Embed Size (px)
Citation preview

Exploring the Role of Innovation in the Relationship Between Strategic Response Capabilities and Firm Performance Outcomes
How to compete in the new competitive landscape ?
Master Thesis
Management of Innovation and Business Development
Copenhagen Business School
Submission: January, 15, 2021
Student Number: 112108
Thesis Advisor: Torben Juul Andersen
Number of Pages: 77
Number of Characters: 181.986

2
ABSTRACT
The world in which companies operate today is becoming increasingly volatile, uncertain, complex and
ambiguous, subjecting companies to an array of risks that threaten their viability in this new competitive
landscape. Here, organizations that cling on to their traditional ways of operating will impede their ability to
succeed, while those who embrace and respond to change will leverage their strategic response capabilities (SRC)
and thrive against the odds. While the possession of such capabilities has become a prominent explanation for
why companies are differentially effective at adapting to change, it is rarely tested empirically and often entails an
implicit, yet important component of the firm’s adaptive journey - Innovation. Combined, the literature on SRC
and innovation in the context of performance outcomes presents two important and seemingly intertwined
adaptive processes that might explain how firms succeed in the new competitive landscape.
Therefore, the purpose of this thesis is to explore the explicit linkage between SRC and performance outcomes,
with a specific focus on the role played by innovation. The relationship is conceptualized by adopting the real
options logic, as a theoretical bridge to combine these two concepts into one coherent framework. Building on
these insights, two competing hypotheses are constructed, in which innovation takes a mediating and moderating
role in its relationship to SRC and subsequent performance outcomes. The two models are tested based on a
comprehensive sample of public US manufacturing firms across two consecutive 5-year time intervals ranging
from 2010-2019, using OLS regression analyses.
The study indicates that companies possessing effective SRC have the ability to exploit opportunities and deflect
risky situations, leading to favorable return and risk outcomes. While the study reveals that innovation does
indeed play a role within this relationship, the precise nature thereof remains inconclusive, as only moderate
support is found for both investigated models across the two time periods. Additionally, innovation appears to
be a much richer and more complex phenomenon than often assumed and can only be captured imperfectly
when using accounting proxies such as R&D and organizational slack.

3
TABLE OF CONTENTS
ABSTRACT .................................................................................................................................................................. 2 CHAPTER 1: INTRODUCTION ............................................................................................................................... 5
1.1 BACKGROUND ................................................................................................................................................................................... 5 1.2 PURPOSE AND PROBLEM STATEMENT .......................................................................................................................................... 7 1.4 DELIMITATIONS ................................................................................................................................................................................ 9 1.5 DISPOSITION OF THE THESIS ....................................................................................................................................................... 10
CHAPTER 2: RESEARCH METHODOLOGY ....................................................................................................... 11 2.1 RESEARCH PHILOSOPHY ............................................................................................................................................................... 11 2.2 RESEARCH APPROACH ................................................................................................................................................................... 12 2.3 RESEARCH STRATEGY .................................................................................................................................................................... 12 2.4 METHODOLOGICAL CHOICE & TIME HPRIZON ....................................................................................................................... 13 2.4 DATA COLLECTION ........................................................................................................................................................................ 13
CHAPTER 3: LITERATURE REVIEW ................................................................................................................... 14 3.1 STRATEGIC RESPONSE CAPABILITIES .......................................................................................................................................... 15 3.2 INNOVATION AND REAL OPTIONS .............................................................................................................................................. 19 3.3 INNOVATION – THE INVESTMENT RATIONALE ........................................................................................................................ 21 3.4 CONNECTING THE DOTS .............................................................................................................................................................. 27
CHAPTER 4: HYPOTHESES DEVELOPMENT .................................................................................................. 28 4.1 STRATEGIC RESPONSE CAPABILITIES, FIRM PERFORMANCE & RISK ................................................................................... 29 4.2.1 THE CASE FOR MEDIATION ...................................................................................................................................................... 31 4.2.2 THE CASE FOR MODERATION ................................................................................................................................................... 34
CHAPTER 5: STATISTICAL METHODS ............................................................................................................... 35 5.1 ECONOMETRIC METHODLOGY .................................................................................................................................................... 35 5.2 VARIABLES ....................................................................................................................................................................................... 41 5.3 SAMPLE CHARACTERISTICS ........................................................................................................................................................... 46
CHAPTER 6: EMPIRICAL FINDINGS .................................................................................................................. 48 6.1 DESCRIPTIVE STATISTICS AND CORRELATIONS ........................................................................................................................ 48 6.2 OLS ASSUMPTIONS ......................................................................................................................................................................... 52 6.3 REGRESSION RESULTS ................................................................................................................................................................... 54 6.4 CONTROL VARIABLES .................................................................................................................................................................... 65
CHAPTER 7: DISCUSSION ..................................................................................................................................... 66 7.1 LINKING EMPERICAL FINDINGS TO PREVIOUS LITERATURE ................................................................................................. 67 7.2 MANAGERIAL IMPLICATIONS ........................................................................................................................................................ 74
CHAPTER 8: CONCLUDING REMARKS .............................................................................................................. 75 8.1 LIMITATIONS AND FUTURE RESEARCH ...................................................................................................................................... 75 8.2 CONCLUSION ................................................................................................................................................................................... 76
REFERENCE LIST .................................................................................................................................................. 78 APPENDICES ........................................................................................................................................................... 91

4
LIST OF FIGURES
Figure 1 - Research Design Summary .................................................................................................................... 14 Figure 2 – General Representation of the R&D Process ................................................................................... 23 Figure 3 - An Innovation Model for Strategic Response Capabilities and Firm Adaptation ........................ 27 Figure 4 - A Mediation Model for Strategic Response Capabilities .................................................................. 40 Figure 5 - A Moderation Model for Strategic Response Capabilities ............................................................... 41 Figure 6 - A Mediated Moderation Model (2) ...................................................................................................... 73 Figure 7 - A Mediated Moderation Model ............................................................................................................ 73
LIST OF TABLES
Table 1 – Inhibitors and Promoters of Strategic Response Capabilities .......................................................... 17 Table 2 - OLS Assumptions and Testing Method ............................................................................................... 36 Table 3 - Variable Summary .................................................................................................................................... 45 Table 4 - Data Exclusion Criteria and Sample Evolution ................................................................................... 47 Table 5- Descriptive Statistics 2010-14 .................................................................................................................. 51 Table 6 - Descriptive Statistics 2015-19 ................................................................................................................. 51 Table 7 - Regression Results Tobin's Q and Return On Assets, 2010-2014 ................................................... 59 Table 8 - Regression Results Tobins's Q and Return on Assets, 2015-2019 ................................................... 61 Table 9 - Regression Results Target Level Risk Ratio and Altman Z Score, 2010-2014 ............................... 62 Table 10 - Regression Results Target Level Risk Ratio and Altman Z Score, 2015-2019 ............................. 63 Table 11 - Summary of Results, Mediation Models ............................................................................................. 64 Table 12 - Summary of Results, Moderation Models .......................................................................................... 65 Table 13 - Expected versus Encountered Sign Of Control Variables .............................................................. 66

5
CHAPTER 1: INTRODUCTION
1.1 BACKGROUND
1.1.1 THE NEW ERA OF COMPETITION
Inverting the F-14 fighter jet and revealing the “bird” to his Soviet counterpart during close range aerial battle,
Tom Cruise's "Maverick” captured the undivided attention of viewers as the opening scene of 1986 Top Gun
unfolded. Not only did this beautifully crafted scene compel the audience, it illustrated an intricate theory that
emerged from 20th century military thinking – the OODA loop. A four piece cyclical process designed to
establish superior positioning, by observing, orienting, deciding and acting as new situations unfold (Nelson,
2016). At the core, the OODA loop is about updating and revising strategies to keep pace with an ever evolving
environment in order to both survive and thrive during chaotic or complex interactions (ibid). Although this
concept was originally developed by Boyd (1987) to assist in air-to-air combat situations, this mental model
seems to apply equally as much to business competition today.
Substantial energy has been devoted toward describing changes in the competitive environment, leading to
characterizations such as ‘the new competitive landscape’ (Bettis & Hitt, 1995), ‘high velocity’ (Eisenhardt &
Bourgeois III, 1988) and ‘hypercompetitive’ (Thomas & D'Aveni, 2009). These reflect that companies nowadays
operate in volatile, uncertain, complex and ambiguous environments (Schoemaker, et al., 2018), characterized by
intense competition, rapid technological shifts, strategic discontinuities, technological uncertainty and frequent
regulatory changes (Bettis & Hitt, 1995; Rosenberg, 1995; Hoffmann, et al., 2009). All while being exposed to a
multitude of risks not limited to natural disasters, cyberattacks, global warming, financial crisis, data fraud (World
Economic Forum, 2020) and most recently the Covid- 19 pandemic (World Health Organization, 2020). Not to
forget, the exogenous risk stemming from technological innovation and competitor moves. Not surprisingly,
such events can substantially affect the strategic position of the corporation and its future earnings potential
(Andersen, 2008).
Thus, like air-to-air combat situations, the ‘new competitive landscape’ requires companies to rapidly devise and
update their strategies to realign with the new conditions imposed by their environments. They can no longer
mindlessly follow detailed, long-term plans (Courtney, et.al, 1997; Luehrman, 1998) instead, they need the ability
to rapidly perceive and exploit opportunities or threats to re-attain strategic fit (Andersen, 2015, 2017). Hence,
they must be able to take immediate response actions, experiment and learn how to navigate the evolving
circumstances and adapt to better match their changing reality. This demands a new set of capabilities, so called
strategic response capabilities (Bettis & Hitt, 1995, Andersen, 2008, 2009) or managerial dynamic capabilities
(Teece, et al., 1997). That is, the ability to initiate fast responses when confronted with surprise or change (Bettis

6
& Hitt, 1995). They also imply an ability to capitalize on new conditions through the identification of alternative
revenue streams and operational structures, while demonstrating agility in redeploying corporate resources to
exploit newly identified opportunities (Andersen et.al, 2007).
1.1.2. CENTRALITY OF INNOVATION
While success in the ‘new competitive era‘ seems to hinge on the ability to leverage strategic response capabilities
and thus effectively adapt to the changing environment, only few companies are successful in this endeavor
(Andersen & Bettis, 2014). Those who are stuck in their traditional ways of operating will hamper or forfeit their
ability to succeed (Leonard-Barton, 1992; Christensen, 1997), while those who challenge the status quo,
reimagine and ideate on how things could be done differently will prosper (Andersen, 2009). Hence, successful,
responsive organizations, innovate and focus on the exploration and exploitation of new value creating activities.
Innovation, defined as the “the generation of new or improved products, processes or services” (National Science Board,
2006), is recognized as an essential mean or process toward changing an organization, regardless of whether it
constitutes a response to changes in the external or internal environment or even an preemptive action to
influence the environment (Damanpour, 1991). With organizational transformation at the heart of innovation it
can therefore be considered an adaptive process.
Additionally, innovation as the practical implementation of a product or process (Schilling, 2019), can also be
conceived of as a ‘real option’. That is, a call option to invest in new market offerings or ways of doing things.
Companies who are able to build a reasonably sized and composed portfolio of real options gain flexibility in
responding to new conditions, as the can choose to exercise the opportune or lapse if not (Ireland, et al., 2003).
Thus, innovation relates to concrete actionable possibilities not just idea generation and a state of creativity. As
such, investments in innovation can be considered the backbone for the creation of new business opportunities
that can provide strategic flexibility in turbulent and evolving markets (Andersen, 2008).
Like SRC, the significance of innovation is amplified under environmental turbulence, as it prompts new
solutions to be devised (Özsomer, et al., 1997; Uzkurt, et al., 2012). In fact, a McKinsey study (2020) found that
companies who invested in innovation during extreme events delivered superior growth and performance in
subsequent periods. For instance, those who maintained their focus on innovation during the 2009 financial
crisis, emerged stronger and outperformed their peers by more than 30%. All while continuing to accelerate
growth during the following three to five years (McKinsey & Company, 2020). This implies, that companies with
a continuous focus on innovation are better positioned to manage and respond to adverse events and thus reflect
better adaptive capabilities. This idea is shared by other academics, who suggest that companies with the capacity
to innovate are better preconditioned to respond quickly as new challenges emerge, while exploiting product and

7
market opportunities more efficiently than non-innovative companies (Brown & Eisenhardt, 1995; Miles, et al.,
1978).
Collectively, the scholarly work on innovation and SRC, focuses on how companies create change through the
exploitation of opportunities that result from uncertainties in the external environment. This points toward an
important interplay between SRC and innovation in attaining superior performance outcomes in the new
competitive landscape.
1.2 PURPOSE AND PROBLEM STATEMENT
Why do some firms fail, while others thrive in the face of environmental uncertainty, complexity and ambiguity?
The answer to this question has been at the heart of strategic management for more than half a century (Porter,
1991; Eunni, et al., 2005). Here, the concept of strategic adaption has frequently been used to explain this
management puzzle, proposing that companies that successfully adapt to environmental conditions get to live yet
another day, while those who do not vanish (Child, 1997; Eunni, et al., 2005). Hence, companies with better
adaptive or strategic response capabilities are able to survive and thrive in the light of environmental disruptions
(Andersen & Bettis, 2014; Wang, et al., 2015). Yet, this explanation provokes a new set of questions. Why are
some companies able to adapt more effectively and efficiently than others and what enables them to do so? So
far, research has rendered inconclusive answers to these questions.
Explanations range from the design of organizational structures (Van der Vegt, et al., 2015; Andersen, 2015),
over leadership characteristics (Gilbert & Bower, 2002; Wu, et al., 2005) to historical resource endowments
(Leonard-Barton, 1992). Interestingly enough, all point to the need to engage in innovative behavior, yet do not
explicitly considered or test the relationship between innovation and such adaptive capabilities empirically. Given
that innovation is one of the key strategic processes that enable firms to adapt both externally and internally
(Hulta, et al., 2004) could suggests that it plays an important part in unravelling this mystery. To explore this
relationship the manufacturing industry provides an interesting case, since it combines both the product and
process perspective of innovation. All while presenting a highly innovative industry, which accounts for 62
percent (274 billion dollars) of the domestic US R&D expenditures in 2018 (Wolfe, 2020). In alignment with
these considerations, I seek to uncover the role of innovation in the relationship between SRC and firm
performance outcomes.

8
This leads to, the following general research question:
What is the role of innovation in the relationship between strategic response capabilities and firm performance outcomes in US
manufacturing firms during 2010-2019?
To support this research effort the following three sub-questions are introduced:
Þ What is the theoretical relationship between strategic response capabilities and innovation?
Þ How and to what extent do strategic response capabilities shape performance outcomes of US manufacturing firms during
2010-2019?
Þ How does innovation impact the relationship between strategic response capabilities and firm performance outcomes in US
manufacturing firms during 2010- 2019?
In answering the research question(s) the thesis will rely on a deductive approach, which can be roughly broken
down into two stages.
In a first stage, I will review the literature on strategic adaptation and innovation, which will set the scene
to explore the potential interplay between SRC and innovation. Given that the field of innovation is extremely
broad (Damanpour, 1991), I will mainly focus on two central concepts – R&D and organizational slack. Both
exemplify monetary commitments to innovation and therefore indicate whether innovation plays a central role in
the firm’s strategy. Using these insights, I will frame the interplay between SRC and innovation in the light of
firm performance outcomes. Thereinafter, the theoretical reasoning derived from the literature will be used to
establish a conceptual framework that will yield a set of testable hypotheses.
In a second stage, I will test these hypotheses empirically, using a large dataset on US listed manufacturing
companies during the 2010-2019 period. By covering this particular 10-year time period, the study will include
multiple environmental exposures, such as the aftermath of the 2009 financial crisis, and the 2016 presidential
election. Finally, by concentrating on US-listed companies, I can control for differences in regulations and
macroeconomic conditions, while obtaining a sufficiently large sample from one of the biggest markets in the
world.

9
1.4 DELIMITATIONS
To ensure a focused progression of this paper, a selection of relevant aspects pertaining to the relationship
between innovation on strategic response capabilities was made. As a result, the following aspects related to the
subject of this paper were not addressed:
Basic Statistics- It is beyond the scope of this thesis to explain and elaborate on basic statistical concepts.
Hence, this thesis assumes a working knowledge in econometrics and statistics to comprehend the findings and
analysis of this paper.
Sectoral, Industry or National Differences – The exploration of this topic focuses geographically and market
wise on public US manufacturing firms.As such, it delimits the opportunity to explore sectoral, industry and
national differences. Thus, restricting the generalizability of the findings to this particular industry.
Micro foundations of Innovation and Strategic Response Capabilities– The exploration of the interplay
between SRC and Innovation occurs with a limited literary focus. As such, it does not consider influences of
innovation beyond the investment specific rationale, such as culture, incentive design, types of innovation,
strategies and so forth. Similarly, I will not investigate the effects stemming from other factors that have been
said to influence SRC, such as sensemaking, organizational structure and leadership.

10
1.5 DISPOSITION OF THE THESIS
The following graphic outlines the structure of this thesis.
11
CHAPTER 2: RESEARCH METHODOLOGY
Before delving into the exploratory part of this paper, this section will present the methodological choices
underlying the research. Doing so, I will follow the ‘research onion’ structure developed by Saunders, Lewis and
Thornhill (2019), which outlines 6 progressive considerations that should be accounted for in every study. This
includes, the research’s philosophy, research approach, methodological choices, strategy, time horizon, and
method of data collection.
2.1 RESEARCH PHILOSOPHY
Regardless of whether one is consciously aware of it or not, every research is developed based on a set of
ontological1and epistemological2assumptions, which inevitably influence the research process. Therefore, it is
important to have a good understanding of underlying beliefs and assumptions that guide the knowledge
development of this thesis (Saunders, et. al, 2019).
The role of innovation in the relationship between strategic response capabilities and firm performance
outcomes is viewed through the lens of post-positivism - a modified version of the positivist philosophy (Guba,
1990). Like its counterpart, post-positivism acknowledges that a real world with real causes exists yet differs by
stipulating that it is impossible for humans to fully capture these causes as a result of imperfect sensory and
intellective mechanisms (ibid). This leads to a critical realist ontology, where the researcher must critically reflect
upon the natural human shortcomings. It is further rooted in a modified objective epistemology, meaning that
full objectivity can only be achieved reasonably close due to constraints imposed by personal experiences, beliefs
and values. Nonetheless, it recognizes that it is possible and essential to adopt a distant and non-interactive
posture (ibid).
Arguably, the most apparent source of biases lies within the topic selection itself, the resulting choice of theories
and interpretation of the findings. Having completed almost 5 years of studies within the field of innovation, it
would be ignorant to presume that such experience and knowledge could be completely suppressed during this
research. Instead, these learnings are likely to exert some influence over the research. Additionally, it should be
acknowledged that the researchers on whose theories I will rely are themselves subjected to biases and should
therefore be interpreted with care.
In the context of this paper, I acknowledge that innovation, SRC and firm performance outcomes are driven by
real causes, yet can only be imperfectly understood, as it is not possible to identify and cover all possible aspects
1 Ontology: assumptions about the nature of reality (Saunders et. al, 2016) 2 Epistemology: assumptions about acceptable knowledge within the field of study (Saunders et. al, 2016)

12
and implicit dynamics. To overcome these challenges and not subsume in subjective biases, post-positivists place
an emphasis on so-called critical multiplism, a type of elaborated triangulation, where multiple and diverse
sources of information (e.g. data, theories, methods) are leveraged to reduce potentially distorted interpretations
about the phenomenon, while increasing the validity of observed relationships and phenomena (Guba, 1990). In
the context of this study, critical multiplism can only be achieved imperfectly, as the reliance on multiple method
lays beyond the scope of this thesis. I will, however, rely on multiple theories and perspectives to ascertain the
said relationship to limit personal biases. Inter alia by reviewing different success and inhibitors of SRC to
establish a connection to innovation and investigate the role of innovation from two perspectives - as a mediator
and moderator.
2.2 RESEARCH APPROACH
For the development of theory, the post-positivist paradigm emphasizes a deductive research approach, which
will also be adopted in this study. Thus, theories are tested by developing of narrow set of hypotheses, which are
thereinafter tested through the collection of data that will either support or refute these propositions (Creswell,
2014). In other words, proceeding from specific perceptions toward general concepts, where known premises
from existing theories and research are joined together to form testable hypotheses (Saunders, et al., 2019).
Hereby, the hypotheses are not given a priori; but rather emerge logically through the recombination of existing
theories. In that sense, the purpose is not merely to verify or falsify a well-established theory nor make an
inference about a specific case, but instead develop and refine existing theories to identify the role of innovation
in the relationship between SRC and firm performance outcomes. That is, examining the different set of
explanations pertaining to the generation of SRC, assess the connection to innovation and thereinafter deepen
these insights with additional theoretical and empirical insights.
2.3 RESEARCH STRATEGY
The research strategy forms the methodological link between the philosophy and subsequent choice of methods
to collect and analyze data (Denzin & Lincoln, 2011). In this research, I will adopt an experiment strategy, which
entails the set-up of theoretical hypotheses that are to be tested statistically (Saunders, et al., 2019). Doing so, one
can discover whether a set of chosen variables exhibit the proposed association – in this case the how
innovation influences the relationship between SRC and firm performance outcomes. Theoretically speaking, this
is tested statistically by manipulating one or more independent variables that then cause a change in a dependent
variable, while controlling for other influential factors (ibid) .Correspondingly, the study takes on a quantitative

13
character, in which the research relies on numerical data to test the developed propositions. How exactly this
takes shape will be covered in Chapter 5, where the econometrics methodology will be presented.
2.4 METHODOLOGICAL CHOICE & TIME HPRIZON
Saunders et. al (2019) propose three types of methodological choices – the mono method, mixed method and
multi-method. As indicated by the labels, these choices differ by the number of methods adopted for a given
study. In this study, I will adopt a mono method quantitative study, where data is collected from one source
(ibid). It should be noted that post-positivism acknowledges the value of qualitative methods (Guba, 1990).
Ideally, I would like to combine the quantitative analysis with a few selected case studies to look behind the
performance and investigate how the empirical findings are reflected in the real world. However, this is beyond
the scope of this study and should instead be viewed as a promising area for future research, where subsequent
case studies could add to the understanding of this investigation.
As for the time horizon, researchers generally have two choices– longitudinal and cross-sectional. The former
refers to a technique were data is collected repeatedly over time, in order to analyze or observe changes (e.g.
cause and effect relationships). In contrast, adopting a cross-sectional time horizon, the phenomenon is studied
at a specific point in time to observe (Saunders, et al., 2019). Given that the purpose of this study is to ascertain
the role of innovation within the relationship between SRC and firm performance, I will adopt a cross-sectional
time horizon, as it allows one to explain how these factors are related (ibid).
2.4 DATA COLLECTION
This study relies exclusively in secondary data, which has been collected for a purpose other than this research
(Saunders, et al., 2019). Hereby, the data for the empirical analysis is obtained from Compustat, which provides
archival performance data on publicly listed US manufacturing firms. An important consideration to make when
using secondary data is the reliability of such data sources. Compustat is a widely used and highly regarded
agency and has therefore been deemed a credible source. More about the data collection will be presented in
Section 5.3.
To provide an overview of the resulting research design, Figure 1 summarizes the aforementioned choices.

14
FIGURE 1 - RESEARCH DESIGN SUMMARY
Having. covered the research methodology, I will now turn to examine the literature, which will provide the basis
for the development of a conceptual framework.
CHAPTER 3: LITERATURE REVIEW
The literature on strategic adaptation is vast and voluminous, with various scholars occupying themselves in the
field. Three prominent contributions include performance effects (e.g. Andersen, et al., 2007), antecedents (e.g.
Hallin, et al., 2014) and success/failure criteria (e.g. Eunni, et al., 2005). I seek to diver deeper into the
success/failure criteria, with a specific focus on innovation as an enabler of strategic change. Given that studies
on innovation are equally as vast, I will focus on the literature pertaining to financing innovation, as financial
commitment is often considered a prerequisite to undertake innovative activity and illustrates whether innovation
takes a central role in the firm’s strategic conduct.
Doing so, I will initially review the basic tenants of strategic response capabilities – its definition and theoretical
roots – to provide the necessary context for the preceding discussion. Thereinafter, I will dive deeper into
existing explanations on the success and failure criteria for SRC with a special focus on the role of innovation.
Thereinafter, I will ascertain how investments into innovation can be a lever to enhance SRC through the
perspective of real options logic as a central connecting factor of the two concepts. At last, the theoretical
Research Philosophy
Methodological
Choice
Time-Horizon
Data Collection
Research Strategy
Research Approach

15
findings will be summarized in a theoretical model that illustrates the potential interplay between investments
into innovation and the relationship to SRC and firm performance outcomes.
3.1 STRATEGIC RESPONSE CAPABILITIES
3.1.1 WHAT ARE STRATEGIC RESPONSE CAPABILITIES?
Originally introduced and defined by Bettis and Hitt (1995, p.15), strategic response capabilities reflect “the
generalized ability to respond fast when change or surprise occurs ”. At the conceptual level this entails three sub-processes,
that capture the ability to rapidly: Sense environmental changes, conceive potential responses, and execute the
response by reconfiguring resources (Bettis & Hitt, 1995, p. 16).
Andersen et al. (2007), incorporates this bundle of capabilities into a more contemporary definition, as “the ability
to assess the environment, identify firm resources, and mobilize them in effective responsive actions”. As such, it resembles the
concept of dynamic capabilities which entails “the firm’s ability to integrate, build, and reconfigure internal and external
competences to address rapidly changing environments“ (Teece, et al., 1997, p. 516). Like SRC, they can be further
deconstructed into three sub-capabilities – sensing, seizing and transforming (Schoemaker, et al., 2018). The
striking similarities may very well explain why some authors have used these concepts interchangeably. Masked
under different descriptors, similar ideas are captured by adaptive capabilities (Volberda, 1996), adaptive capacity
(Aggarwal, et al., 2017) and strategic adaptability (McKee, et al., 1989). The multitude of similar and related
concepts illustrate the growing importance of adaptation at the capability level, while lending support to the
relevance of this field of study. Concurrently, it might point to some ambiguity about the concept itself, given
that it has been explained, approached and labelled several times.
In an attempt to reduce this conceptual uncertainty, I will view SRC at the aggregate level, rather than separating
between the three sub-processes. Doing so, I will follow Andersen et al. (2007), and view SRC as the company’s
aggregate ability to adapt its resource base to changing environmental conditions.
Like most theoretical concepts, SRC are anchored in a set of fundamental assumptions. Therefore, the next
section will briefly explore the theoretical underpinnings on which the concept is based.
THEORETICAL UNDERPINNINGS
Strategic response capabilities find their origin in the strategic adaptation literature, which addresses the
adaptation and renewal of firms to environmental turbulence (Child, 1972; Chakravarthy,1982; Burgleman 1991;
Andersen, 2015). The field is shaped by a multitude of perspectives that have led the literary discourse, including

16
but not limited to contingency perspectives (e.g. Chakravarthy, 1982), strategic fit reasoning (e.g. Fiegenbaum, et
al., 1996) and decision structures (Volberda, 1996).
In general, theories on strategic adaptation and change focus on the role of managerial action and strategic
choice in shaping organizational change (Child 1972, 1997; Burgleman 1991; Desarbo, et al., 2005), rather than
viewing it as the outcome of a passive environmental selection process as proposed by population ecologists
(Hannan & Freeman, 1997). Thus, organizational evolution can be conceived of as a product of actors' decisions
and learning (Miles, et al., 1978; Desarbo, et al., 2005). This entails changes in strategic behavior to improve the
competitive posture in an attempt to attain a better match between the organization and its environment. From
this perspective, successful adaptation is interpreted as proof that „firms had superior regimes of routines or optimal
resource allocation strategies that account for competitive advantage and therefore, for survival“ (Volberda & Lewin, 2003, p.
2112).
The strategic choice perspective takes an inside-out character, as it assumes that organizations survive or fail as a
function of their ability to read and interpret patterns in the environment and adapt over time (Schindehutte &
Morris, 2001). Thus, companies display heterogenous adaptive or strategic response capabilities, which leads
some firms to attain a better strategic fit, ultimately resulting in variable performance outcomes (Andersen, et al.,
2007). In that sense the discussion around SRC can also be framed through the resource-based view (RBV) of
the firm, which argues that superior performance stems from differences in resource endowments and unique
ways to allocate and deploy them (Barney, 1991).
Various explanations have been proposed as to why some companies exhibit better SRC than others. Not limited
to cognitive limitations, executive characteristics, historical resource endowments and decision structures. While
these are not necessarily contradictory, it remains an important conundrum, that would benefit from more
exploration. To shed light on this thematic, the next section will review the most prominent explanations that
have emerged.
3.1.3. STRATEGIC RESPONSE CAPABILITIES – SUCCESS AND FAILURE
Scholars often distinguish between situations that are seen as well understood, certain, predictable, or routine and
those that are uncertain, unpredictable and intractable (Galbraith, 1973; Eisenhardt & Tabrizi, 1995). The reason
being that under certain conditions, companies can plan and organize their activities and therefore rely on
routines and bureaucratic organizations. Contrarily, uncertainty requires companies to become more flexible,
experimental, and improvisational, due to inadequate market information (Eisenhardt & Tabrizi, 1995; Eunni, et
al., 2005). The same distinction has notable implications for strategic response capabilities, as it is the latter
situation under which they are most critical (Bettis & Hitt, 1995; Andersen, 2009, 2015). To understand why
17
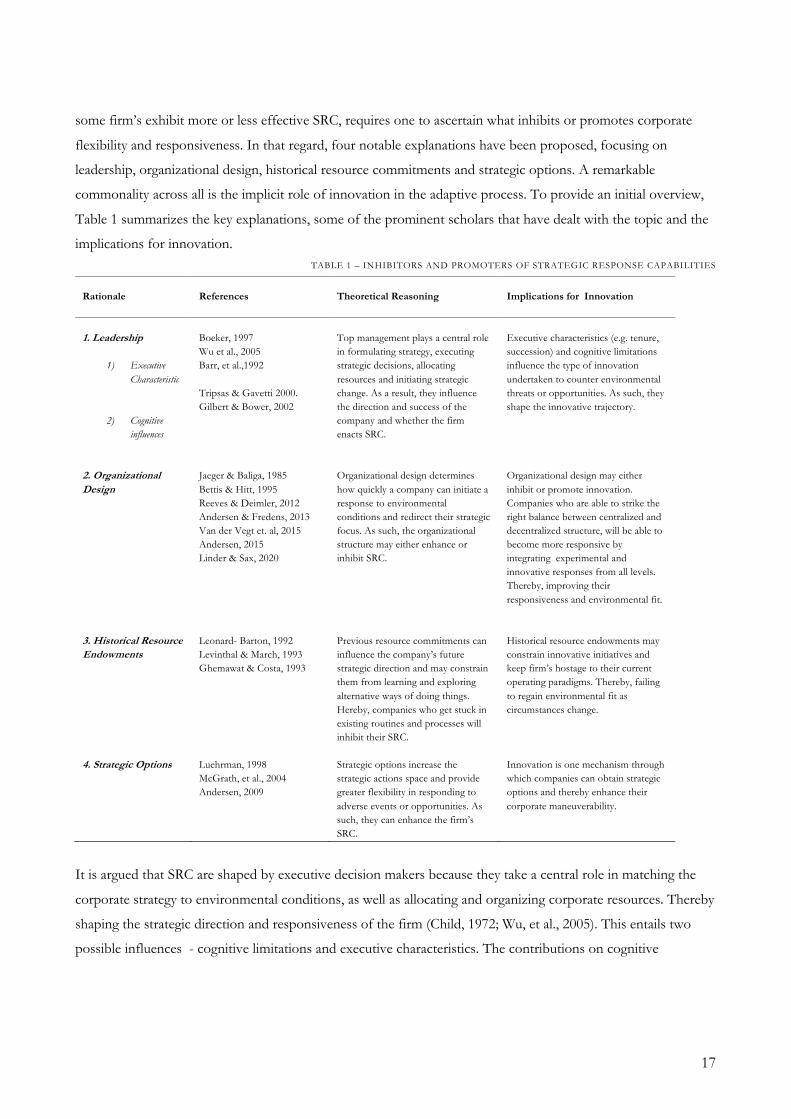
some firm’s exhibit more or less effective SRC, requires one to ascertain what inhibits or promotes corporate
flexibility and responsiveness. In that regard, four notable explanations have been proposed, focusing on
leadership, organizational design, historical resource commitments and strategic options. A remarkable
commonality across all is the implicit role of innovation in the adaptive process. To provide an initial overview,
Table 1 summarizes the key explanations, some of the prominent scholars that have dealt with the topic and the
implications for innovation. TABLE 1 – INHIBITORS AND PROMOTERS OF STRATEGIC RESPONSE CAPABILITIES
Rationale
References
Theoretical Reasoning
Implications for Innovation
1. Leadership
1) Executive Characteristic
2) Cognitive
influences
Boeker, 1997 Wu et al., 2005 Barr, et al.,1992 Tripsas & Gavetti 2000. Gilbert & Bower, 2002
Top management plays a central role in formulating strategy, executing strategic decisions, allocating resources and initiating strategic change. As a result, they influence the direction and success of the company and whether the firm enacts SRC.
Executive characteristics (e.g. tenure, succession) and cognitive limitations influence the type of innovation undertaken to counter environmental threats or opportunities. As such, they shape the innovative trajectory.
2. Organizational Design
Jaeger & Baliga, 1985 Bettis & Hitt, 1995 Reeves & Deimler, 2012 Andersen & Fredens, 2013 Van der Vegt et. al, 2015 Andersen, 2015 Linder & Sax, 2020
Organizational design determines how quickly a company can initiate a response to environmental conditions and redirect their strategic focus. As such, the organizational structure may either enhance or inhibit SRC.
Organizational design may either inhibit or promote innovation. Companies who are able to strike the right balance between centralized and decentralized structure, will be able to become more responsive by integrating experimental and innovative responses from all levels. Thereby, improving their responsiveness and environmental fit.
3. Historical Resource Endowments
Leonard- Barton, 1992 Levinthal & March, 1993 Ghemawat & Costa, 1993
Previous resource commitments can influence the company’s future strategic direction and may constrain them from learning and exploring alternative ways of doing things. Hereby, companies who get stuck in existing routines and processes will inhibit their SRC.
Historical resource endowments may constrain innovative initiatives and keep firm’s hostage to their current operating paradigms. Thereby, failing to regain environmental fit as circumstances change.
4. Strategic Options Luehrman, 1998 McGrath, et al., 2004 Andersen, 2009
Strategic options increase the strategic actions space and provide greater flexibility in responding to adverse events or opportunities. As such, they can enhance the firm’s SRC.
Innovation is one mechanism through which companies can obtain strategic options and thereby enhance their corporate maneuverability.
It is argued that SRC are shaped by executive decision makers because they take a central role in matching the
corporate strategy to environmental conditions, as well as allocating and organizing corporate resources. Thereby
shaping the strategic direction and responsiveness of the firm (Child, 1972; Wu, et al., 2005). This entails two
possible influences - cognitive limitations and executive characteristics. The contributions on cognitive

18
limitations asserts that organizational action is contingent upon the beliefs of decision holders, regarding how the
company can best succeed in its environment (Barr, et al., 1984; Gilbert & Bower, 2002).
For instance, if a company is confronted with disruption, executives may frame this as a threat, and thereby
commit excessive resources toward keeping their old business alive, rather than seeking out new business
opportunities (Gilbert & Bower, 2002). Thus, clinging on to their old, yet outdated, operating model.
Additionally, SRC may be a function of executive characteristics which influence the strategic conduct. For
instance, Wu et al. (2005) found that CEO tenure displays an inverted U-shaped relationship to the introduction
of new inventions, arguing that, short-tenured CEO’s are more inventive in highly dynamic environments,
whereas long-tenured CEO’s spur greater invention under more stable environments. Hence, the ability to devise
rapid and appropriate responses is contingent on the executive in charge.
Others propose that organizational design determines corporate flexibility and ultimately whether timely
responses are devised. Hereby, flexible structures allow companies to respond quicker to evolving circumstances,
while highly centralized structures hinder corporate maneuverability (e.g. Andersen 2015, Van der Vegt, et al.,
2015; Reeves & Deimler, 2012). For instance, Van der Vegt et al. (2015) suggest that the ability to respond and
create organizational resilience depends on decentralized decision-making structures, rather than centralized
authority and hierarchy (Van der Vegt, et al., 2015). This corresponds with the interactive strategy-making
approach outlined by Andersen (2015), suggesting that companies who combine slow forward strategic thinking
with fast operational responses, are better equipped to respond to adverse events. That is, empowering local
decision makers who hold relevant information pertaining to the circumstances to take immediate response
actions, rather than relying on slow hierarchical decision making (ibid). Notably, it’s the combination of
centralized and decentralized responses that enable superior conduct and neither is sufficient in and off itself.
This suggests, that companies relying on ridged hierarchies, stifle the innovative potential emerging from lower
levels of the organizations, thereby decreasing corporate flexibility.
Another explanation pertains to historical resource endowments, arguing that it may constrain future behavior
because learning tends to be premised on local processes of search (Leonard- Barton 1992, Levinthal & March,
1993). Thus, the same resources that brought successful competencies in the past, may create competence or
success traps, when environmental conditions change (Wang, et al., 2015). Especially so, when companies focus
on exploitative, rather than explorative behavior (Levinthal & March, 1982) or ‘static efficiency’, rather than
‘dynamic efficiency’ (Ghemawat & Costa, 1993). In other words, exploiting opportunities pertaining to current
operations, rather than exploring new and more uncertain innovations. Thus, existing capabilities, which are
codified in routines, procedures, and information processing capabilities may hold firm’s hostage to their current
trajectory, and thus limit the firms SRC. In that sense, a firm’s own resource base can serve not only to promote,
but also to inhibit adaptation and change (Leonard-Barton, 1992).

19
At last, it has been argued that SRC are enhanced by holding a portfolio of strategic or real options (Andersen,
2009) because they render greater corporate maneuverability (Luehrman, 1998; McGrath, et al., 2004; Andersen
2009). Firms who invest in a variety of promising strategic options, expand the range of possible actions when
environmental conditions demand strategic adjustment (Andersen, 2009). Hereby, innovation is one mechanism
to develop said options, which allows firms to explore new market opportunities (e.g. McGrath & Nerkar 2004,
Hall & Lerner, 2010). Again, this points toward the potentially important interplay between innovation and SRC
in shaping firm performance outcomes. That is, innovation allows to disrupt or update the current operating
paradigm, by establishing alternate ways of doing things. As such, innovation can be seen as a common
denominator that somewhat reconciles the previous views.
Although the strategic options rationale outlines how and why SRC are supported by investing in real options,
there has not been an explicit attempt to ascertain the specific role innovation plays as a facilitator thereof.
Therefore, the next sections will be dedicated toward exploring this interplay by adopting the real options
perspective in discussing how investments into innovation facilitates the creation of strategic options. Doing so,
the following section will initially review the theory on real options to provide the theoretical basis for the
preceding discussion.
3.2 INNOVATION AND REAL OPTIONS
3. 2.1 WHAT ARE REAL OPTIONS?
Borrowing from financial options theory (Black & Scholes, 1973), the concept of ’real options’ was initially
coined by Myers (1997), who suggested that many growth opportunities could be conceived of as call options.
However, in contrast to financial options where one has the right to sell or buy financial assets, real options are
based on assets that are physical and knowledge-based (Miller & Waller, 2003). Hence, the value underlying the
option is always non-financial (Schilling, 2019).
Essentially, options create value by generating future decision rights (McGrath & Nerkar, 2004), which gives
companies “the opportunity to respond to future contingent events” (Kogut & Kulatilaka, 2001, p. 745). The value of real
options appreciates under uncertainty (Miller & Waller, 2003), as they entail the flexibility to defer, abandon,
switch, stage, or expand investments (Trigeorgis & Reuer, 2017). In principle, the flexibility afforded by such
options gives the holder unlimited upside potential, while delimiting negative returns under unfavorable
circumstances (ibid). Given that real options essentially represent strategic options, I will use these terms
interchangeably. Equipped with the theoretical underpinnings of real options, I will now turn to discuss how and
if the real options lens applies to innovation.
20
3.2.2 INNOVATION AS A REAL OPTION
From the perspective of investment theory, innovation displays a number of characteristics that make it
markedly different from ordinary investments (Hall & Lerner, 2010).
Innovation is a human capital intensive process, where approximately half of the R&D expenditures go toward
the wages of highly educated engineers and/or scientists (Hall & Lerner, 2010). Hereby, the efforts are directed
at creating an intangible knowledge-based asset, with the aim of generating future profits (ibid). Embedded in the
human capital of the firm, the underlying knowledge tends to be tacit, rather than codified (Kerr & Nanda,
2014), which carries a certain degree of risk, as the company loses critical resources if employees exit the firm. As
such R&D spending reflects high adjustments costs, leading many firms to smooth their R&D spending over
time to secure their knowledge base (Hall & Lerner, 2010; Kerr & Nanda, 2014)
Additionally, the resources created by R&D are often firm-specific (Helfat, 1994), which limits their resale value
in the market because they cannot be easily redeployed in another corporate setting (Balakrishnan & Fox, 1993).
Yet, firm specific assets are also a driver of profitability and competitive advantage, as it enhances the firm’s
repertoire of valuable and unique resources (Barney, 1991). As such, investments in innovation can be
considered a double edged sword, with great possibility for return, but also high risk.
In fact, return on innovation has been found to be extremely skewed (e.g. Scherer, et al., 2000), where profits
have shown to display a Pareto distribution (Scherer, 1998)
Lastly, the innovation process and its outcome are inherently uncertain (Rosenberg, 1995), where information
about the project’s success or failure is revealed throughout its progression, gradually reducing the level of
uncertainty (Hall & Lerner, 2010). The uncertainty is amplified through the lack of historical data pertaining to
the potential success of a given project, given that it directed at creating something that is new to the adopting
organization. To avoids premature commitment companies are therefore encouraged to make sequential, rather
than large, one off investments (Rosenberg, 1995).
Not surprisingly, these insights have led authors to suggest that innovation should not be treated as a typical
investment, nor should static valuation tools, such as the NPV be used solely to value such investments (Brasila,
et al., 2018; Hall & Lerner, 2010). Such methods are not suited for the lack of historical data and uncertainty nor
do they account for managerial flexibility (Brasila, et al., 2018). In fact, doing so may hinder the execution of
potentially viable R&D projects, as uncertainty may cause such projects not to pass the initial return hurdle
(Luehrman, 1998; Hall & Lerner, 2010).
Collectively, the sequential, intangible, firm-specific and uncertain nature of investments into innovation exposes
that it takes an option like character, which can also be spotted in the depiction of real options “characterized by

21
sequential, irreversible investments made under conditions of uncertainty“ ( (Adner & Levinthal, 2004, p. 75). It also
illustrates, that organizations must support the innovation process with sufficient resources that allow
organizational members to explore and experiment with new ideas. This can be achieved in a number of ways
and therefore the next section will shed light on the different means by which companies can finance innovative
activity.
3.3 INNOVATION – THE INVESTMENT RATIONALE
3.3.1 FINANCING INNOVATION
Investment into innovation goes beyond what is needed to maintain current operations (Wang & Thornhill,
2010) and therefore represents a form of slack. The concept of slack finds its origin in the behavioral theory of
the (Cyert & March, 1963) and can be defined as „the pool of resources in an organization that is in excess of the minimum
necessary to produce a given level of organizational output” (Nohria & Gulati, 1996, p. 1264).
Previous research has identified and distinguished between multiple components of slack (Bourgeois & Singh,
1983; Geiger & Cashen, 2002) because different sources of slack are not equally transformable, available and
more or less embedded in the organizations structure, processes and routines. For instance, some authors
distinguish between available, recoverable and potential slack (Bourgeois & Singh, 1983; Sharfman, et al., 1988).
Other only make a separation between two types, such as absorbed and unabsorbed slack (Singh, 1986) or
internal and external slack (Geiger & Cashen, 2002). However, regardless of how granular these classifications
are made they are similar in the sense that they distinguish between resources that are readily available to the firm
from internal means, such as available or absorbed slack and those resources that are external to firms, but
potentially available and unabsorbed.
In innovation studies, a prominent example of slack are R&D expenditures, which supports centralized
innovation efforts in the systematical development of new ideas (Schilling, 2019). Yet, R&D investments are not
the only means by which companies can support innovation, as valuable ideas and innovations can also emerge
from the bottom up processes (Burgelman, 1983; Kanter, 2004). Hence, companies who dedicate resources to
lower levels of the organization can facilitate decentralized innovation, by giving mangers the discretion to
experiment with new ideas (Nohria & Gulati, 1996). As such, organizational slack is one enabling factor that
allows for exploration during work (Damanpour, 1991; Nohria & Gulati, 1996). Given that both R&D and
organizational slack are internally available and deliberately dedicated to a specific function they present different
forms of available slack.

22
However, companies may also obtain resources from their external environment to support their innovation
function, which is particularly important when companies are cash constrained (Wang & Thornhill, 2010;
Acharya & Xu, 2017). Generally, this comes in one of two forms, debt or equity, which present different forms
of potential slack (Acharya & Xu, 2017). For instance, public companies can raise equity through the issuance of
common stock, borrow money from banks or issue bonds. The degree to which companies rely on external
finance is reflected in the firm’s capital structure, that is, the proportion of equity to debt (Hall & Lerner, 2010).
The capital structure also reflects the company’s ability to raise future loans and thus its flexibility in pursuing
innovative projects. That is, lower financial leverage (e.g. low debt-equity ratio), signifies greater abilities to raise
money (Andersen, 2009).
In summary, companies who chose to innovate, can support this process by different variations of slack
resources – R&D investments, organizational slack and debt or equity. In this next part, I will explore the
specific dynamics by which slack resources can support the development of real options, and thereby influence
strategic response capabilities.
3.3.2 SLACK RESOURCES AND REAL OPTIONS
The relationship between innovation and slack varies depending on the type of slack being examined (Singh,
1986; Geiger & Cashen, 2002) and will therefore be examined separately. Doing so I view R&D and
organizational slack as complementary elements to the innovation process, as they represent conscious resource
allocations to centralized and decentralized innovation respectively. Thereinafter, I will discuss how external
sources of finance or potential slack – debt and equity – can influence the types of innovation pursued and how
this may shape the strategic options created. In parallel, I will discuss how the capital structure decision will
influence the ability to create or execute strategic options in the presence of varying financial constraints.
R&D
When companies invest in R&D they can ultimately create a new unit of knowledge, which they can exploit at
some point in the future (McGrath & Nerkar, 2004). In that sense, R&D investments can be conceived of as a
call option, in which the company buys the right to implement some technology at a later point in time (Van
Bekkum, et al., 2009; Schilling, 2019).
Examining the R&D process, it becomes clear how real option lens applies. The general R&D process is
graphically shown in Figure 1. Notably, this is a simplified depiction and the steps tend to occur iterative and or
concurrently (Tidd, et al., 2001).

23
FIGURE 2 – GENERAL REPRESENTATION OF THE R&D PROCESS3
The R&D process starts with the generation of new ideas on how things could be done differently, which can
also be conceived of as potential strategic options. Thereinafter, the company engages in a conscious selection
process, in which they choose amongst competing alternatives that can support their strategy. When the
company has sufficient financial resources, multiple innovation projects can be pursued simultaneously which
can provide additional latitude in coping with environmental turbulence, as it allows the company to bet on
multiple horses (Brasila, et al., 2018). At the development stage, the company deviates from a state of creativity
toward generating actionable possibilities, making the strategic options increasingly concrete. Eventually, these
ideas are tested, from which new learnings emerge, that feed back into the idea generation, selection and
development process. Thus, over time, uncertainty is reduced as more is learned about the project’s viability.
Based on these insights’ companies are afforded the choice to extend the knowledge, commercialize it, do
nothing, or leverage it in some other form (McGrath & Nerkar, 2004). Thus, the R&D process allows companies
not only to grow into a certain direction (Oriani & Sobrero, 2008), but also to switch between alternative
projects (McGrath, 1997). If the company chooses to exercise the technological option, the company must
commit further resources in order to commercialize it. Once commercialized the company gains access to
another asset, which is the underlying right to extract returns from the technology that has been commercialized
(McGrath, 1997).
In summary, adopting a real options logic on the R&D process exposes how a continues commitment to
innovation supports strategic response capabilities, as it renders continuous flows of new business opportunities
that can be adopted to cope with new circumstances.
ORGANIZATIONAL SLACK
As mentioned previously, innovation and thus strategic options may also develop outside the centralized R&D
function through the deployment of organizational slack. Although there has been a surging interest around this
3 Adopted from Tidd, Bessant & Pavitt, 2001

24
topic, the impact of organizational slack on innovation remains a highly debated field (Nohria & Gulati, 1996;
Kim, et al., 2014).
Proponents of the behavioral theory of the firm argue that organizational slack enables companies to cope with
uncertain environments, by providing resources for innovation and change, which allows for adaptation and
superior firm performance (Cyert & March,1963; Mohr, 1969). Slack signifies relaxation of controls and
represents a source of funds whose use may be approved even in the face of uncertainty (Levinthal & March,
1982). It allows innovative projects to be pursued because it buffers organizations from the uncertain success of
those projects, fostering a culture of experimentation and innovation (Bourgeois III, 1981). In aggregate, these
views suggest that organizational slack is a facilitator of innovation, because it allows members to pursue new
projects and safely experiment with new strategies, such as the development of new products or market entries
(Nohria & Gulati, 1996). In contrast, in the presence of too little slack the organization’s flexibility is reduced
because the range of available options open to managerial choice is substantially restricted (ibid).
On the other hand, proponents of the agency theory hold that slack resources are products of incompetence,
inefficiency and waste that detriment firm performance (Singh, 1996; Cashen & Geiger, 2002). The fundamental
argument being that managers will act in their self-interest, rather than behaving in the best interest of the firm
(Jensen, 1986). A dysfunction said to be amplified under intense information asymmetries, as agents may exploit
their knowledge to their own advantage, inter alia by pursuing projects that are of personal interest (e.g. ‘pet
projects’). Thus, using resources in ways that decrease experimentation and innovation (Geiger & Cashen, 2002).
Further, Litschert and Bonham (1978) and Yasai-Ardekani (1986) propose that when slack is high, organizations
can afford to adopt structures that do not optimally match their environments, because they can afford to pay
the price of mismatch. In contrast, when slack is low, organizations cannot afford to be unresponsive, and thus
structures are more likely to be matched.
A viewpoint that seeks to reconcile these opposing claims, is the proposal that innovation and slack display a
curvilinear relationship (Nohria & Gulati, 1996), suggesting that there is an optimal level of slack. Thus, to
support the creation of strategic options and enhance SRC, firms should neither eliminate nor design excessive
amounts of slack and instead find the right middle ground.
POTENTIAL SLACK - DEBT & EQUITY
Last but not least, companies can access external sources of finance to support their innovative activities.
However, this can have important effects on what is financed and how financiers might shape the direction of
R&D and innovation (Kerr & Nanda, 2014). Yet, debt and equity differ in their impact one firm governance

25
(Williamson, 1988) and therefore also their effect on innovation. Concurrently, it is critical that firms not only
create, but also execute such options when it is strategically attractive to do so (Luehrman, 1998). Hence, there is
a dual concern – the influences of potential slack on the innovative trajectory and the ability to raise future
finance to create or execute strategic options.
Three theories on the capital structure of the firms can shed light on the choice between debt and equity and the
considerations to be made when considering financial sources beyond corporate boundaries for the purpose of
innovation: Pecking order theory, trade-off theory, and transaction cost economics.
Pecking-order theory suggests that companies will choose their financing sources based on the highest market
value and the lowest cost of capital, which rises with asymmetric information (Myers & Majluf, 1984). Thus,
companies will initially use their internal sources to finance innovation and only thereinafter turn to external
finance, preferring debt over equity (Myers & Majluf, 1984; Fama & French, 2002; Bartoloni, 2013) The
preference of debt over equity stems from more severe information asymmetries that raise costs, which leads
firms to only issue equity when they have exhausted their debt capacity (Myers, 1984; Lemmon & Zender, 2010).
In other words, there is a hierarchical order by which firms choose their financing sources.
Trade of theory suggests that when the level of debt increases, so does the chance of default. Therefore, the
positive effect of tax savings should be balanced against the negative effect arising from bankruptcy costs (Myers,
1984; Chirinko & Singha, 2000).Given the uncertainty of innovative activity, debt financing for R&D is risky,
which may lead firms to limit their amount of debt (Wang & Thornhill, 2010). Concurrently, the possibility of
losing critical assets to creditors in the event of project failure is likely to discourage innovativeness (Rajan, 2012).
In fact, the use of debt has been found to decline with the innovative effort (Bartoloni, 2013), implying that
more innovate firms rely less on debt. Alternatively, it may lead firms to pursue short-term opportunities that will
allow them to repay their future obligations. Hence, debt financing may constrain companies from pursuing
uncertain, but potentially viable innovative projects and instead remain on their current trajectory. As such,
influencing the types of strategic options created.
Finally, transaction cost economics holds that the choice between debt and equity is contingent upon whether
investment assets are specific or general (Williamson, 1979). As previously mentioned, R&D often results in
firm-specific assets, which are intangible, and knowledge based. This makes innovation notoriously hard to
quantify as collateral (Acharya & Xu, 2017) and therefore substantially increases the cost of debt. In fact, theory
suggests that generic assets are better suited for the governance associated with debt (Hall & Lerner, 2010). This
may imply that companies with large proportions of debt will invest less in firm-specific assets, and instead
pursue projects that result in more certain and generalizable outcomes. This implies, that debt influences the
innovative trajectory, favoring exploitation over the exploration of newer business opportunities (March, 1991).

26
Thus, exploring opportunities that are aligned with current operations, rather than finding new innovative ways
of doing things. This stands in clear contrast to the strategic options rationale, as it is the exploration of new,
uncertain ideas that allows firms to leap into new territories and adapt to evolving circumstances. Therefore,
companies who aim to compete on the basis of innovation and firm-specific assets are better off relying on
retained earnings and equity (Balakrishnan & Fox, 1993).
Overall, raising external finance is less attractive for the pursuit of innovation and should only be reverted to
when the internal sources have been exhausted. Thus, companies who retain a relatively large portion of equity in
their capital structure are likely to generate a more sufficient and diverse portfolio of strategic options that allows
them to leap into new territories when opportunities present themselves. Simultaneously, higher levels of debt
decrease the ability of firms to raise additional capital (Andersen, 2009) and therefore delimits the opportunity to
execute strategic options when it is attractive to do so.
Having established the different roles that slack resources play in regard to innovation, the next section will
establish how the different concepts covered by the literature review can be connected in one coherent model.

27
3.4 CONNECTING THE DOTS
So far, the previous parts have outlined the current state of the art concerning strategic response capabilities and
the potential role innovation might that play in attaining superior performance outcomes. These theoretical
insights are synthesized in Figure 3 4 into one coherent Model.
Changes in external environment signal trends or events for future action which can reinforce the companies
deliberate strategy or lead to new emergent strategies (Mintzberg & Waters, 1985). Strategic emergence arises
from exploratory initiatives taken by autonomous mangers through the provision of
organizational slack, while the deliberate strategy is a function of planning and rational analytical assessments of
the environment, which can inform the centralized R&D projects. Ideally, there is a level of interaction between
the intended and emergent strategy, where the organization adopts an ‘adaptive strategy mode’ (Andersen &
Nielsen, 2009). Through the provision of such slack resources, companies can support both centralized and
decentralized innovation, which lead to the creation of new strategic options.
A reasonably sized and composed portfolio of options provides corporate flexibility and latitude to cope with
environmental changes, thereby supporting the effectiveness of their SRC in responding to emerging
opportunities or threats. Dependent on the type of slack resources used for the generation thereof – internal or
external – these options are more or less diverse and exercisable. By relying on internal sources of finance, firms
have considerable discretion in the usage of their funds and can therefore fund more diverse and experimental
4 Inspired by Andersen, 2015. Strategic Adaptation. Elsevier Ltd. P501 – 507.
FIGURE 3 - AN INNOVATION MODEL FOR STRATEGIC RESPONSE CAPABILITIES AND FIRM
ADAPTATION

28
options. Contrarily, a high reliance on external capital, may shape the innovative trajectory towards exploitative
innovation. Thereby, limiting the ability to respond to adverse events, given the lack of alternative action choices.
Finally, the effectiveness of SRC will determine firm performance and the level of environmental fit. As such,
performance outcomes are modelled as a function of heterogeneous adaptive capabilities. When attaining
strategic fit between the organization and the environment the firm will exhibit good performance and therefore
make new slack resources available to the firm (Chakravarthy, 1982). In contrast, if the firm exhibits inferior firm
performance and thus a strategic mismatch, the firm does not generate excess resources and will become more
reliant on external capital.
In this project, I will focus on the interplay between investments into innovation or strategic options, SRC and
firm performance outcomes. The graphic points toward a certain degree of reverse causality, as past performance
influences the type of strategic options created, in turn influencing subsequent performance. It is not the purpose
of this thesis to formally test this relationship, but rather account for this influence through the deployment of
adequate control variables. Given that additional resources stemming from superior performance are recorded in
the form of retained earnings and thus reflected in shareholders equity, it should influence the firm’s capital
structure. Therefore, this thesis will employ financial leverage as a control variable and thus at least partly
account for the firm’s capital structure. Thereby, limiting the influence of this potentially confounding factor.
Having covered the main components of the model, the next section will be dedicated toward setting up the
central hypotheses of the paper to test the proposed relationship.
CHAPTER 4: HYPOTHESES DEVELOPMENT
The previous section established a possible theoretical link between investments into innovation and strategic
response capabilities, with the presumed outcome of superior firm performance (Figure 3). The flow of the
figure would indicate that innovation takes a moderating role, whereby the effectiveness of SRC is enhanced
through the availability of strategic options stemming from innovation. Positioning innovation as a facilitator of
strategic adaptation also finds support in other studies (e.g. Andersen, 2009), yet is not the only possible role.
Previous literature has also ascribed innovation to be a mediator of firm performance in the quest for adaptation
(e.g. Makonnen et. al, 2014). This would imply, that the relationship outlined in Figure 3 can also take a different
functional form. That is, SRCs leads to the creation of strategic options, while innovation becomes the source of
superior performance. Both scenarios seem plausible given that innovation has been linked to both adaptation

29
and firm performance. Nonetheless, it leaves uncertainty as to the precise role(s) innovation may play in the
relationship.
This begs the question of whether innovation facilitates or enacts (mediates) the relationship between SRC and
firm performance or alternatively influences or enhances (moderates) the effect of SRCs or both effects might be
at play. To get further clarity around this riddle, I will initially hypothesize on the relationship between SRC and
firm performance outcomes, as the common denominator between these two alternative explanations.
Thereinafter I will consider supporting evidence for innovation as both a mediator and moderator of this
relationship.
4.1 STRATEGIC RESPONSE CAPABILITIES, FIRM PERFORMANCE & RISK
Companies with effective strategic response capabilities are not only able to identify risks and opportunities, they
can also respond to and counter various adverse events that challenge the company’s viability in the marketplace
(Bettis & Hitt, 1995). In fact, proponents of the strategic adaptation literature claim that performance
differentials depend on such abilities, where companies with high adaptive levels can take advantage of emerging
opportunities stemming from the environment or mitigate downside risk (Bourgeois III, 1980; Snow &
Hrebiniak, 1980). As such, the role of SRC is two-fold – capitalizing on new opportunities, while mitigating risk.
How this leads to superior performance, can be explained by the respective influence on the firm’s revenue and
cost position.
From a revenue perspective, those who are able to both identify and exploit emerging opportunities, such as
changing customer preferences, technological advancements, regulatory shifts and new customer segments, can
tap into new market potential, which can expand or improve their sources of revenue (Helfat & Winter, 2011).
The influence on the cost base can be explained by the firm’s risk profile, commonly identified by the firm’s
corporate earnings volatility (e.g. Bromiley, 1991; Miller & Reuer, 1996). Effective SRC should lower the firm’s
risk profile, given that the ability to mitigate risks should deliver more stable earnings development (Andersen,
2008; 2009). In turn, this should positively influence the firm’s cost base along three dimensions – operating
efficiency, supplier relationships and cost of capital.
Firstly, the cash-flow motive holds that performance volatility reduces cash-flows, as risk induces higher input,
production, management and sales costs (Amit & Wernerfelt, 1990; Miller & Chen, 2003). That is, higher levels
of risk, reduce operating efficiency, as firms are likely to hold excess inventory or production capacity in times of
economic downturn, while forfeiting sales during uptime. This leads firms to incur adjustment costs as they

30
attempt to shift their capacity from one activity to another (ibid). Conversely, lower earnings volatility implies
greater operating efficiency and hence lowers costs, leading to better operational performance. Concurrently,
periodic cash shortfalls induce companies to cut investments more drastically compared to competitors, leading
to fewer projects to be funded (e.g. Froot et. al, 1994), while stable earnings free up financial resources for
investments into new value-adding activities (Minton & Schrand, 1999).
Secondly, the firm’s earnings development has a profound influence on supplier relationships. Fluctuating
performance signifies volatility in demand for supplier inputs, which raises their respective operation costs, as
they face difficulty in adjusting their capacity to such variability (Miller & Chen, 2003). This would suggest that
companies with high variability in corporate earnings present less attractive business partners. This effect is
amplified by the fact that suppliers have fewer risk hedging possibilities compared to other stakeholder groups
(e.g. investors) and may therefore demand compensation for the additional risk. In contrast, stable earnings
projections should increase confidence among important suppliers, make them more attractive business partners
and thereby encourage investments in value-creating firm-specific relationships (Wang, et al. 2004, Andersen,
2008).
Third, a more stable earnings development should reduce the perceived business risk and likelihood of financial
distress, implying lower investment risk for creditors. In turn, making debt financing cheaper (Myers, 1997; 1984;
Myers & Maluf, 1984; Andersen, 2008). This should reduce the average cost of capital, making more investment
projects economically feasible and subdue the underinvestment problem (Andersen, 2008).
Suitably with these explanations, several studies have shown a positive relationship between the ability to adapt
and firm performance (Oktemgil & Greenly, 1997; Biedenbach & Müller, 2012). This, despite the fact that
maintaining such adaptiveness may be a costly endeavor (McKee et. al, 1989). For instance, Oktemgil and
Greenley (1997) examined the consequences of adaptive capabilities on firm performance across a diverse set of
environments and markets in 407 UK companies and found a positive association between the two. Hereby,
adaptative capacity was measured in a questionnaire along 3 dimensions, which ascertained the response to
product-market opportunities, marketing activities for responding to these opportunities, and speed of response.
Further, in a simulation model of strategic responsiveness, Andersen et. al (2007), showed that heterogenous
response capabilities across companies exhibited the inverse relationship originally found by Bowman (1980).
That is, firms exhibit greater and less volatile (e.g. lower risk) performance over the sampled period, pointing to
the important effect of SRC in adapting to change. These analyses and rationales support the proposal that SRCs
improve corporate performance, while lowering the companies risk profile.

31
Overall, the supporting evidence of empirical studies and the dual concern of SRC for both opportunity
exploitation and risk mitigation would suggest a favorable effect on firm performance and risk, leading to the
following two hypotheses:
H1 a: Firms demonstrating more effective strategic response capabilities relative to their peers will be positively associated with return
outcomes.
H1 b: Firms demonstrating more effective strategic response capabilities relative to their peers will be negatively associated with risk
outcomes.
4.2.1 THE CASE FOR MEDIATION
Numerous studies indicate that innovation is a fundamental driver behind firm performance - a view shared
across broad literature streams, ranging from economics (e.g. Geroksi, et al., 1993), to management (e.g.
Damanpour & Evans, 1984), while finding support in various empirical studies (e.g. Baldwin & Johnson 1996;
Prajago, 2006).Innovation can drive performance because it allows firms to develop new markets and “bring existing markets to
new states, extend their life cycles or reshape the competitive landscape” (Kim & Pennings, 2009, p. 368). Especially in
dynamic markets, innovation has been found to be a leading source for profitability, as rapid changes in the
environment make current products and services obsolete, requiring firms to continually introduce new products
and services to neutralize the threats of obsolescence (Marshall & Parra, 2019). Thus, successful innovations
enable the firm to stay in touch with customer preferences and increase their market share at the expense of its
competitors (Makkonen, et al., 2014). For instance, companies can improve their sales through new product
innovations that offer superior performance (e.g. reliability or durability), better features or other design factors
(e.g. aesthetics) (Prajogo, 2016). .In turn, this should make their offerings comparably more attractive to those of
competitors. Further, process innovation can improve the company’s cost base, which allows them to offer their
products or services at more competitive prices, thereby inducing more demand. Inter alia by shortening delivery
times, minimizing inventory or shifting scale economies (Congden & Schroeder, 1996). This rationale
corresponds to an improvement in the competitive strategies as depicted by Porter (1985), where product
innovation can allow for differentiation and process innovation for cost leadership. In turn, this should improve
the company’s competitive position and thus performance (Porter, 1985). This implies that innovation takes a
leading role in generating better fit conditions and achieving a state of adaptation.
However, the pursuit of innovative initiatives is a resource consuming activity, which requires companies to
make essential investments into innovation (Garrett & Covin, 2007). In fact, R&D expenditures have been found

32
to display a positive correlation with productivity growth (Long & Ravenscraft, 1993), firm performance (Long
& Ravenscraft, 1993; Lee & Wu, 2016) and market value (Chan, et al., 1990; Bae & Noh, 2001). This should
hardly be surprising, given that R&D is one of the main functions through which companies systematically
generate innovations. Although R&D is initially a risk expenditure with uncertain pay-offs (Mone, et al., 1998),
companies should be able to decrease risk when such opportunities turn into viable business propositions. In
fact, McAlister, Srinivasan and Kim (2007) found that R&D investments can lower the firm's bankruptcy risk,
which would indicate that innovation also contributes toward a more stable earnings development.
Similar support can be found for the deployment of organizational slack and its relationship to firm performance
and risk. For instance, conducting a meta- analysis based on 80 samples within 60 studies, Daniel, Lohrke,
Fornaciari and Turner (2004) found a positive relationship between organizational slack and firm performance.
The main reasoning being that slack represents a cushion that allows firms to exploit new opportunities and
counter emerging threats (Daniel, et al., 2004). Therefore, it seems reasonable to infer that the presence of such
slack cannot only affect performance but also firm risk, as this cushion allows companies to maintain more stable
aspirations when faced with performance volatility (Cyert & March, 1963). As such, R&D and organizational
slack can be seen as mutually supportive investments into innovation that allow firms to attain better fit
conditions, leading to superior performance and lower risk. This leads to the following four hypotheses:
H2.1 a: There is a positive association between R&D investments and firm return outcomes.
H2.1 b: There is a negative association between R&D investments and firm risk outcomes.
H2.1 c: There is a positive association between organizational slack and firm return outcomes.
H2.1 d: There is a negative association between organizational slack and firm risk outcomes.
When companies have effective SRCs, it suggests that they have well- functioning sensing, response and
reconfiguration capabilities. That is, the ability to process and identify emerging strategic issues, devise alternate
responses based on this information and execute these problem solutions (Bettis & Hitt, 1995; Hallin et al.,
2014). This should enable management to make timely decisions for changing their operational or strategic
conduct if deemed necessary (Makkonen, et al., 2014). From this perspective, SRCs can assist organizations by
providing current updates on the changing competitive landscape and develop an aggregated view on how to
best navigate the enterprise. Thus, uncovering potential threats or opportunities that can be mitigated or
exploited respectively. In other words, inducing search behavior for adaptive opportunities, which spur the
development of concrete and actionable innovations.
The identification of such entrepreneurial opportunities provides the basis for the introduction of new
innovations (Garrett & Covin, 2007; Hallin et al., 2014). This would imply that SRC provide the impetus for the
introduction of innovation, as well as guidelines as to where the company should focus its investment. Although

33
the initial expenditure into innovation is a risky investment (Mone, et al., 1998), it can become profitable and risk
reducing once turned into a viable busines proposition. Such opportunities can be exploited through both
centralized R&D and autonomous activities. Whereas R&D systematically develops new products, services and
processes, autonomous actions induce innovative responses in the absence of top management scrutiny (Garrett
& Covin, 2007). In that sense, both activities should lead to superior financial performance by addressing the
market in novel and creative ways.
In combination, this would suggest that SRC do not directly lead to superior firm performance, but rather
provides the mechanism that enables change, which leads to the development and launch of innovative
solutions. As such, one would expect the economic rents to be generated by the successful introduction of new
products, services, processes or other innovations. This corresponds with the RBV, which holds that it is the
deployment of valuable, rare, inimitable and non-substitutable resources that generate super-normal rents
(Barney, 1991). These value creating resources can be created through the R&D process, that allows companies
to explore and create firm-specific resources (Christensen, 1995; Wang & Thornhill, 2010), which can then
introduce changes to the structure, outcome or processes of firms (Damanpour & Evans, 1984). In turn,
allowing the firm to deliver new product advantages or attain process improvements that result in lower unit
costs (Bowman & Ambrosini, 2000)
The notion that SRC does not directly lead to superior firm performance is enforced by the possibility that firms
can misperceive market opportunities (Ambrosini, et al., 2009). In this scenario, the firm may initiate a flawed
response that is not well aligned with the market conditions, ultimately leading to strategic misfit. For instance,
an overreaction could lead to the destruction of the resource base which disturbs current processes, whereas an
under reaction should lead to performance declines (ibid). In combination, this suggests that SRC are more likely
to affect performance and risk through the mediating effect of innovation. Therefore, the following four
hypotheses:
H2.2 a: The positive association between strategic response capabilities and firm performance is positively mediated by R&D
investments.
H2.2 b: The negative association between strategic response capabilities and firm risk is positively mediated by R&D investments.
H2.2 c: The positive association between strategic response capabilities and firm performance is positively mediated by organizational
slack.
H2.2 d: The negative association between strategic response capabilities and firm risk is positively mediated by organizational slack.

34
4.2.2 THE CASE FOR MODERATION
It is generally accepted that investments into R&D spur the development of new products, services and
processes (Erickson & Jacobsen, 1992; Lee & Wu, 2016) that constitute strategic options. The inherent difficulty
in forecasting market or technological developments (Rosenberg, 1995; Courtney et al. 1997), signifies that
external market needs can only be anticipated imperfectly, which would suggest that companies can benefit from
investing in multiple development projects that allows for the pursuit of alternate growth paths. Doing so, the
firm can broaden its possible strategic choices and form growth options with future economic value (Myers,
1997), which can increase their flexibility in adapting to evolving market needs and technological uncertainty
(Tong & Reuer, 2007). Thus, through R&D, companies can furnish a continuous stream of business
opportunities that can be implemented to counter adverse events stemming from environmental risks.
Consequently, investment into R&D should strengthen SRC by facilitating the execution of effective strategic
responses leading to favorable performance and risk outcomes. Indicative support for this proposition can also
be found in the risk management literature, where Andersen (2009) suggested and found that investments into
R&D and organizational slack improves the firms risk management capabilities. That is, the company’s ability to
counter environmental risks.
Beyond the creation of new business propositions, R&D also determines the firms’ learning ability, or so called
absorptive capacity (Cohen & Levinthal, 1989; Saemundsson & Candi, 2017). That is, “the firm’s ability to identify,
assimilate, and exploit knowledge from the environment“ (Cohen & Levinthal, 1989). This enhances the firm’s ability to
identify entrepreneurial opportunities (Saemundsson & Candi, 2017), as well as recognize and integrate external
technologies (Haro-Dominguez, et al., 2007), while making the firm more proactive rather than reactive
(Daghfous, 2004). In turn, this provides greater flexibility in generating adaptive opportunities especially in high
velocity environments (Saemundsson & Candi, 2017).
It should be noted that the firm’s absorptive capacity is dependent on the previous knowledge accumulation of
R&D activities (Cohen & Levinthal, 1990). Hence, a firm that fails to routinely invest in R&D should be unable
to keep its current scope of knowledge base up-to-date, making them less capable to address new market
developments. Combined, this would imply that continuous R&D investments enhances SRC by improving the
firm’s ability to recognize, exploit and integrate new market opportunities.
Similarly, autonomous activities should strengthen the company’s SRC, as they represent a valuable source to
uncover new strategic pathways that were not deliberately pursued or validated by management (Chakravarthy,
1982; Garrett & Covin, 2007). Middle managers often hold vital knowledge about market developments, shifts in
customer needs and competitor moves (e.g., Burgelman, 1983; Kanter, 2004; Andersen, 2015) because they are
much closer to core operations than top managers (Mahnke, et al., 2007). As such, they should be quicker to
identify and address new opportunities in the market - provided they have the financial resources to do so. Thus,

35
by enabling managers to experiment and act on their localized knowledge they can initiate quicker responses,
which should enhance SRC’s by shifting the response curve upward (Bettis & Hitt, 1995). However, excessive
levels of slack can also lead to loss of control, causing economic waste and inefficiencies (Chakravarthy, 1986;
Nohria & Gulati, 1996), and should therefore not be employed excessively.
Based on the discussion above, the impact of SRC on firm performance and risk should become stronger when
firms invest in innovation - both concerning R&D and organizational slack. As such, it can be presumed that
they take a moderating role in the relationship between SRC, firm performance and risk. Therefore, the
following four hypotheses:
H3 a: The positive association between relatively more effective strategic response capabilities and return outcomes is positively
moderated by investments into R&D.
H3 b: The negative association between relatively more effective strategic response capabilities and risk outcomes is positively
moderated by investments into R&D.
H3 c: The positive association between relatively more effective strategic response capabilities and return outcomes is positively
moderated by the deployment of organizational slack.
H3 d: The negative association between relatively more effective strategic response capabilities and risk outcomes is positively
moderated by the deployment of organizational slack.
CHAPTER 5: STATISTICAL METHODS
The purpose of this chapter is threefold. First, I will review the econometric methodology adopted to test the
hypotheses, reflect upon the central assumptions and briefly present the composition of the mediation and
moderation model. Second, I will outline the variables chosen to be included in the study design and argue for the
inclusion of central control variables. Third, I will review the sample characteristics, including the procedure
taken to clean the dataset.
5.1 ECONOMETRIC METHODLOGY
In line with previous and comparable studies, I have chosen to apply the Ordinary Least Squares (OLS) multiple
linear regression to test both the mediation and moderation models. OLS estimates are obtained by minimizing
the sum of squared residuals, using linear regression to ascertain the mean change in a dependent variable given a
one unit change in the independent variables (Gujarati & Porter, 2009). The essential idea behind using OLS is to
uncover the relationship between the chosen independent variables and the risk/return outcomes, while
controlling for other factors that are thought to correlate with such variables or outcomes. Doing so, the OLS

36
method estimates the parameters that reflect the relationships of different variables in the population. This can
be expressed by the following general equation:
" = #0 + #1 $n +. . . + #k $t + %i,, i = 1,…,n.
Hereby, Y denotes the dependent variable, # the parameter estimates that indicate the relationships between the
dependent variable, Y, and the independent variables, X, including an error term, U (Gujarati & Porter, 2009).
However, for OLS to be a valid estimation procedure, a few central assumptions must be upheld to assure the
results are unbiased and consistent. Although this is often overlooked in studies, it remains a critical investigation
to assure that the results are representative. Therefore, the following sections will review and elaborate on these
essential assumptions and how adherence to such is assured.
5.1.1 OLS MODEL ASSUMPTIONS
The assumptions underlying OLS are typically captured in classical linear models, which makes several
simplifying assumptions, yet it remains a desirable statistical method, widely employed across varies research
disciplines (Gujarati & Porter, 2009). The key assumptions are highlighted in Table 2, including the proposed
testing method (Woolridge, 2012).
TABLE 2 - OLS ASSUMPTIONS AND TESTING METHOD
No. Assumption Results Requirements Test Method
1 Linear in Parameters
Model is linear in the parameters b0, b1, ..., bk Functional Form
2 Random Sampling There is a random sampling of observations
Q- Q Plot
3 No perfect collinearity/ No Multicollinearity
The explanatory variables are not perfectly correlated with each other
Variance Inflation Factors,
Correlation Matrix
4 Zero Conditional Mean The error term has an expected value of zero given any value of the independent variables; i.e., E[εi|xi] = 0
Q- Q Plot
5 Homoskedasticity
The error term must have the same variance across all values of the explanatory variables, i.e., Var[εi|xi] =
σ2
White Test
6 Normally Distributed Error Terms
The errors are normally distributed, conditional upon the independent variables
Q- Q Plot
When Assumptions 1 through 4 are satisfied, OLS remains unbiased and consistent, whereas upholding
assumption 5 assures the usual OLS variance is valid. By further, including Assumption 6, one can assure
accurate statistical inference and conclude that the OLS estimators have the smallest variance among the

37
unbiased estimators (Wooldridge, 2012). To assure these assumptions are upheld, a combination of diagnostic
plots and statistical calculations will be employed, for which the results will be presented in section 6.2.
The distributional characteristics of regression residuals (Assumption 2, 4, 6) will be tested using so called
quantile to quantile plots or in short Q-Q plots. These test the conformity between the empirical distribution and
the theoretical one, by plotting the quantiles of the two distributions against each other (Dodge, 2008). In testing
for multicollinearity, I will assess the variance inflation factors for all independent variables, which is calculated
by the following general formula:
VIFj = 1(j ²
Here, Rj2 is the coefficient of determination for the specified regression model that relates the specific variable to
all other independent variables. Under this approach, collinearity is considered problematic when VIFj is greater
than 10 (Woolridge, 2012). To increase certainty, collinearity, by examining the correlation matrix. To increase
certainty, I will also examine the correlation matrix, where any variables with (+/-) 0.8 correlation should be
removed (Brooks, 2014). Lasty, Homoskedasticity and linearity will be tested by fitting the residuals against the
predicted values. Beyond these general assumptions, the model accuracy can be further disturbed by a number of
biases, which can impact the reliability and internal or external validity. Therefore, the next section will review
these biases and discuss how they have been dealt with.
5.1.2 OLS – POTENTIAL BIASES
Some of the most frequently encountered issues when applying OLS regression analysis pertains to specification
errors such as over- or under specification of the model, choosing the wrong functional form of the relationship
between the dependent and independent variables and measurement errors (Gujarati & Porter, 2009).
When the model is underspecified, the regression equation is missing one or more important predictor variables.
This is also referred to as omitted variable bias, which occurs when the regressor, X, is correlated with a variable
not included in the model. The problem is, that when an important missing variable, say X3, that correlates with
an included independent variable, X2, it will nonetheless influence the dependent variable through the error term,
making it impossible to ascertain whether the effect stems from the excluded variable, X3, or the included
variable, X2. As a consequence, it yields biased regression coefficients and response predictions, whereby it
consistently under or overestimates the regression parameters, resulting in biased inferences about the
population. In the context of this study, there are several organizational variables which may influence the
studied phenomenon, not limited to organizational structure, corporate culture and managerial biases or

38
characteristics. All these variables could be correlated to both return and risk outcomes, as well as one or more
of the in independent variables. Yet, the inherent difficulty in collecting, measuring and quantifying such
variables, makes it notoriously difficult to account for such factors. In an attempt to minimize the risk of
underspecifying the model, other relevant control variables have been included in the regression equation
(Gujarati & Porter, 2009).
Over specifying the model present a second problem, although less severe than the former (ibid). It essentially
describes the reverse situation, in which the regression equation contains one or more redundant predictor
variables, which may cause standard errors to be inflated for the regression coefficients and thus bias the
outcome (ibid). However, this is mostly a problem for small samples sizes and should therefore not severely
influence the results of this study, given the relatively large sample size used here (> 900). On a positive note,
including an irrelevant variable in the model still renders unbiased and consistent estimates of the coefficients in
the true model, whereby the error variance is correctly estimated, and the conventional hypothesis-testing
methods are still valid. The penalty paid for such an inclusion, is the enlargement of the estimated variances of
the coefficient, making the inferences about the parameters less precise. Although this bias is less severe, it would
be false to conclude that the inclusion of redundant variables is unproblematic, as unnecessary variables can lead
to a loss in the efficiency of the estimators or problems with multicollinearity. To avoid this problem, I follow
the scholarly advice to only include explanatory variables that have valid theoretical grounds and influence the
dependent variable in ways not accounted for by other factors (ibid).
Third, the issue of misspecification of the functional form, as the word suggests, represent a situation in which
the functional form of the OLS regression is not specified correctly, causing the OLS estimators to be biased. In
turn, causing Assumption 4 – Zero Conditional mean – to fail as it requires no specification errors (Gujarati &
Porter, 2009). To circumvent this problem, it has been suggested to include a non-linear and interaction version
of the independent variables (Wooldridge, 2012)
Fourth and last, measurement error arises when an imprecise measure of an economic variable is used in a
regression model (ibid). Given that this thesis relies on secondary data, it is difficult to ascertain the types of
errors that may exist, if any (Gujarati & Porter, 2009). Yet, Compustat is generally considered a reliable source
that is widely used in the research community and is therefore deemed reliable. A more notable case for potential
measurement error, lies in the construction of the measurement for strategic response capabilities and its
underlying accuracy. This issue will be more thoroughly considered in section 5.2.2.
Having reviewed the potential errors that may arise in the application of OLS, I will now discuss the two
separate models – mediation and moderation - that will be constructed to test competing hypotheses of this
paper.

39
5.1.3 MEDIATION MODEL
In testing for mediation, Baron and Kenny’s (1986), four general steps and three regression equations, „regressing
the mediator on the independent variable ... regressing the dependent variable on the independent variable, and ... regressing the
dependent variable on both the independent and on the mediator“ (Baron & Kenny, 1986: 1177), provide a useful starting
point. However, this model usually applies for single mediation models, whereas the proposed model entails
complementary mediation by both R&D investments and organizational slack. Luckily, the analysis of a multiple
mediation model is an extension of the single mediation model, where the independent variable is simply related
to two or more mediators that have a presumed relationship with the outcome variable (MacKinnon, 2008).
Essentially extending the model of Baron and Kenny (1986), Gatignon (2014) outlines three regression equations
to test a two mediator relationship:
*1! = +c
*2! = +2,! + -12!
.! = /1*1! + /2*2! + 0′,! + -2!
Notably, this does not include a regression equation for the assumed effect of the independent variables on the
dependent variable as outlined by Baron and Kenny (1986). This exclusion has been argued on the basis of the
questionable benefit of its inclusion and potential model misspecifications, that can lead to controversial results
(Gatignon, 2014). The rationale being that most practical cases of mediation cannot be accurately depicted by a
single mediator, as theories seldom point to such situations. Therefore, plausible scenarios exist in which the
relationship between X and Y is zero or non-significant, inter alia when two mediators have opposite effects. In
turn, when there is no significant relationship between X and Y from the outset, there is in theory, nothing to be
mediated (ibid). Yet, there is no technical harm in including this relationship and considering that both R&D
investments and organizational slack are hypothesized to have a positive effect, there seems to be a good chance
that this is not the case. Therefore, I will include this first step and thus test the following four models:
à Model 1 tests the relationship between SRC and performance outcomes, measured by return and risk
à Model 2 tests the direct relationship between R&D, organizational slack and firm performance
outcomes, measured by return and risk
à Model 3 tests the direct relationship between SRC, R&D and organizational slack treating the proposed
mediators as an outcome variable
à Model 4 tests the simultaneous relationship between SRC, R&D investments, organizational slack and
firm performance outcomes, measured by return and risk
This can be visualized in the following figure with the inclusion of the relevant hypotheses.

40
5.1.4 MODERATION MODEL
For the moderation model, the relationship between SRC, R&D investments, organizational slack and firm
performance outcomes are captured using interaction terms. Doing so, the explanatory variables do not merely
affect the dependent variable independently of one another.
In general, the use of interaction terms postulates that the relationship between an independent and dependent
variable becomes contingent on particular conditions or so-called contingencies, which provide an explanation
for why the relationship changes as a result of these conditions (Gatignon, 2014). Hence, the use of interaction
terms allows the partial effect of SRC to depend on the level of R&D investments and organizational slack - the
so called moderators. Doing so, it is possible to detect both the direct effect of SRC on firm performance
outcomes and the impact generated when dependent on the level of R&D investments and organizational slack
(Gujarati & Porter, 2009). Put more generally, the inclusion of an interaction term in the regression takes the
following functional form:
y = β0 + β1 x1 + β2 x 2 + β3 x1 x 2
This basic formula can further be expanded to include non-linear interaction terms, which is useful if R&D and
organizational slack display a curvilinear relationship. The resulting model is capture in Figure 5.
FIGURE 4 - A MEDIATION MODEL FOR STRATEGIC
RESPONSE CAPABILITIES

41
FIGURE 5 - A MODERATION MODEL
FOR STRATEGIC RESPONSE
CAPABILITIES
Now that the basic econometric methodology has been discussed, I will turn to consider the measurement and
inclusion of relevant variables that are critical to test the two competing models.
5.2 VARIABLES
5.2.1 DEPENDENT VARIABLES
Firm performance is a multi-dimensional concept (Murphy, et al., 1996), for which no single measure can accurately
reflect the its full effects. Therefore, I have chosen to include two measures for firm performance/return, one
accounting and one market based. In line with previous studies, I will use return on asset (ROA), for measuring
the accounting based performance, which is calculated as total assets divided by sales, expressed as a percentage.
Given that ROA is a measure for operating performance, it reflects the contributions made by management
toward the accounting performance and thus, in principle, how productive and efficient managers have navigated
the enterprise. For the market based measure, I will rely on Tobin’s Q, which will be calculated as assets plus
market values (common shares outstanding * price per share) minus book value of common equity divided by
total assets.
Risk Outcomes are often captured by employing a proxy for income stream uncertainty such as the ex post
variance of return measures, e.g., ROA, ROE or ROS (Santacruz, 2020). However, Fishburn (1977) suggests that
risk is not necessarily a measure of dispersion of an expected value, but rather a function of the distance toward a
target outcome. An insight, many subsequent studies have incorporated (e.g. Fiegenbaum 1990; Miller &
Bromiley 1991). Measuring the target level risk based on the studied time period, is only deemed appropriate

42
when the expected return is constant over time, which is seldom the case (Lehner, 2000). Additionally, it may be
misleading because companies can only fully grasp the impact of their industrial performance over time (Gupta,
2017). This suggests that the target return is better reflected by the previous time-period. Based on these
arguments, I calculate the downside risk measure – henceforth target level risk ratio (TLRR) - as the distance to
the target level performance. Doing so, I will measure current year performance volatility based on the standard
deviation of ROA. For the target level distance, I choose to employee the sub-sector industry mean performance
volatility of ROA, as it reflects the exogenous risk factors exerted on the specific industry as a whole, which lays
beyond the control of any individual firm (Gupta, 2017).
Additionally, I will employ an indicator for financial distress, using the Altman Z score, which measures
the company’s proximity to bankruptcy. Here a lower score indicates a higher likelihood for bankruptcy and thus
a higher risk factor. Following Altman (1968), I will measure bankruptcy risk by taking (1.2 × working capital
divided by total assets) + (1.4 × retained earnings divided by total assets) + (3.3 × earnings before interest
expense and taxes divided by total asset) + (0.6 × market value of equity divided by total liabilities + 1.0 × sales
divided by total assets).
5.2.2 EXPLANATORY VARIABLES
Strategic Response Capabilities were conceived of as the company’s aggregate ability to adapt its resource base to
changing environmental conditions. To my knowledge, no prior studies have advanced a measurement for SRC
based on archival data. Therefore, more attention will be given toward developing and explaining the
measurement employed for this study. Given that SRC entail the ability to both deflect downside losses and
capture emerging opportunities, an appropriate measure should consider this dynamic.
Exogenous risk factors beyond corporate control can have an effect on both the cost and revenue
position of the firm. For instance, shifts in demand, technological innovations and competitor moves may
influence the sheer amount of sales made by the company. Similarly, changes in regulation, resource scarcity or
fading supplier commitments may cause changes to the cost structure. Managerial economics would suggest, that
changes to the cost structure, will lead companies to readjust their prices to seek new equilibrium conditions. As
such, external shocks affecting the cost structure should be equally reflected in the amount of sales realized by
the company. To capture the exposure to exogenous risks, I will rely on the coefficient variation in sales,
measured as the standard deviation of sales over average sales. This should reflect the degree to which
companies were exposed to and affected by exogenous events over a longer period of time, while accounting for
size effects.
The corporate response to such events and hence the ability to adapt should be reflected by the
company’s ability to maintain a steady earnings growth over the sample period, by deploying their assets more
efficiently as circumstances change. This can be captured by the firm’s net income figure, which shows the net

43
profit after the deduction of relevant expenditures, such as taxes, operating expenses, cost of goods sold and so
forth. Hence, when the company is able to initiate a proper response, one would expect a lower volatility in net
income, given that it reflects the performance effects after a corporate response has been initiated.
In alignment with these two rationales, SRC will be measured as the coefficient variation of sales divided
by the coefficient variation of net income. Doing so, I will rely on the absolute value, as companies can have
both large profits and losses. Here, a high SRC indicates that the firm has been able to properly cope with
external developments, as they have been able to reinstate the proper balance between revenue (e.g. new product
introductions) and costs (e.g. process improvement), while, a low score indicates that a firm has failed to either
increase its revenue or adapt its cost base to the changing environmental conditions.
Notably, the ability to engage in strategic change and adapt, as captured by the relative measure of SRC,
cannot fully account for the presence of such capabilities. The reason being that strategic changes can also be
affected by non-deliberate incidents such as luck (Barney, 1991), ad hoc interventions (Winter, 2003) or emergent
processes (Mintzberg & Waters, 1985). Naturally, this decreases the internal validity of the proxy used for SRC.
Nonetheless, construing it as an aggregate measure remains consistent with theory even though it does not
perfectly capture the detailed, underlying dynamics.
R&D Investments will be measured based on the R&D intensity, which is calculated as R&D expenditures divided
by total revenue, which is a common proxy among other studies and probably the most widely used measure
(e.g. O’Brien, 2003; Kotabe, et al., 2004).
Organizational Slack will be measures using the SG&A ratio as a proxy, which is a typical measurement for this
construct (e.g. Singh, 1986). That is, dividing selling, general, and administrative expenses with sales. This
captures budgetary resources allocated to support managerial and market activities, which may allow for
discretionary activities. Hereby, the largest proportion of the ratio tends to be devoted to labor-related expenses,
which fits well with the line of argumentation that it allows organizational members to use surplus time for
experimenting with new growth opportunities.
5.2.3 CONTROL VARIABLES
Firm Size is likely to affect the company’s ability to manage corporate exposures and thus improve performance
outcomes. Key features of large firms are diverse capabilities, the ability to exploit economies of scale and/or
scope and the formalization of procedures (Majumdar, 1997; Zhou, et al., 2019). This should make the
implementation of operations more effective, allowing larger firms to generate superior performance relative to
their smaller counterparts (Penrose, 1959). Simultaneously firm size reflects prior successes, which may lead
larger firms to enjoy additional latitude to cope with both external shocks and periods of adverse conditions
(Aldrich, 1999; Sharfman et al., 1988). The enhanced ability to deflect risky situations, should therefore improve

44
return and risk outcomes. Lastly, firm size may also influence the firm’s SRC, where larger firms may be able to
dedicate more resources toward changing their operational conduct. In harmony with previous studies, I have
chosen to measure firm size as the natural logarithm of total assets (e.g. Tong & Reuer, 2007; Andersen, 2009).
Technological Intensity differs across industries and plays an important role in the decision to undertake R&D
investments (Booltink & Saka-Helmhout, 2017), where different business sectors are known to have different
degrees of innovation propensity and profitability (Damanpour, 1991). Therefore, technology intensity was
introduced as a dummy variable to control for potential technology effects. Following the classification of the
United Nations Industrial Development Organization, the manufacturing sub-sectors were clustered into three
levels of technology intensity: Medium-high/high technology, Medium technology, and Low Technology
(UNIDO, 2016). To avoid the dummy trap 5 (Gujarati & Porter, 2009) only two dummies were introduced - one
for medium/high technology and one for medium technology - using low technology as a references class. For
the precise allocation method, please refer to Appendix A.
Financial leverage is often considered a general risk management tool, which can impact on firm performance
outcomes, as capital reserves present buffers against major events. Thus, companies operating with low financials
leverage can use their funds to absorb economic shocks stemming from various risk events. Therefore, financial
leverage is included to control for effects stemming from financing decisions. In line with previous studies,
financial leverage is measured as the ratio of book value of debt to book value of total assets (e.g., O’Brien, 2003;
Vicente-Lorente, 2001).
Advertising intensity is often viewed as a complementary investment to R&D because it allows companies to
differentiate their products. Inter alia by enhancing brand name recognition or creating reputation premiums,
which enable firms to command a price premium relative to competing products that may be near identical
(Erickson & Jacobson, 1992). Therefore, it is expected that advertising intensity correlates positively with return
outcomes (e.g. Erickson & Jacobsen, 1992; Joshi & Hansen, 2004). Simultaneously, it is expected to correlate
negatively with risk outcomes, given that advertising spending can be a lever to stabilize earnings, through the
creation of intangible assets (e.g. reputation), that may protect firms from market or economic downturns. In
measuring the advertising ratio, I follow the norm, dividing advertising expenditures with sales (e.g. Erickson &
Jacobsen 1992; MacAlister et. al, 2007).
Capital Intensive businesses are likely to be subjected to greater risk, as a result of high investment and fixed costs,
which make profits and income more sensitive to fluctuations in sales or demand conditions in general (Shapiro
5 For every qualitative regressor, the number of dummy variables should be one less than the categories of that variable, otherwise there will be issues with
multicollinearity (Gujarati & Porter, 2009)

45
& Titman, 1986). If demand fluctuates, capital-intensive companies will experience greater operating income
variations compared to less-capital-intensive firm. This arises from the relatively greater proportion of fixed
assets committed to operations to attain profitability, while the high volume of fixed costs does not vary with
sales volume (Brealey & Myers, 1984). Ultimately translating into higher performance risk. Concurrently, this
should increase the cost of capital, thereby decreasing firm performance. Therefore, capital intensity is
introduced as a control variable, calculated as total assets divided by total sales indicating the amount of capital
invested in relation to the generated revenue.
To provide an overview of the different variables included in this study, the Table 3 summarized the
aforementioned points. TABLE 3 - VARIABLE SUMMARY
Variables Abbreviation Calculation (1) Dependent Variables Firm Performance ~ Accounting Based ROA Total Assets / Net Income
Firm Performance ~ Market Based TQ assets + market value - minus book value of common
equity / by total assets.
Firm Risk – Target Level Risk Ratio TLRR Mean Industry sd(ROA)t-5 /Mean sd(ROA)
Firm Risk – Altman Z Alt Z 1.2 × working capital/ total assets + 1.4 × retained earnings / total assets +3.3 × earnings before interest expense and taxes / total asset + 0.6 × market value of equity / total liabilities + 1.0 × sales /total assets
(2) Explanatory Variables Strategic Response Capabilities SRC CV(Sales) / CV (Net Income)
R&D Expenditure R&D R&D / Net Sales
Organizational Slack Slack Selling, General, Administrative Costs / Sales (3) Control variables Firm Size Size ln(total assets)
Financial Leverage Lev Total debt / Total Assets
Advertising Adv Advertising Expenditures / Sales
Advertising Dummy - Dummy
Capital Intensity Cap_int Total Assets / Total Revenue
High Tech Industry - Dummy
Medium Tech Industry - Dummy
Having a good grasp of the variables included in this study, I will now discuss how the variable treatment.

46
5.2.4 VARIABLE TREATMENT
To eliminate spurious year-on-year effects, all measures were averaged over the 5-year intervals, which is also a
common approach among other studies (Reuer & Leiblein, 2002; Andersen 2008; 2009). Additionally, the
measures were standardized6 to control for potential confounding industry effects, as previous studies have
pointed toward performance differentials across industries (e.g. Porter, 1979; Ruefli & Wiggins, 2003).
Furthermore, it reduces potential problems with multicollinearity, which is particularly important for the
moderation models. Even though this study focuses solely on the manufacturing industry, differences across
subsectors can be expected, inter alia due to differences in production methods and material inputs. Although it
would be desirable to standardize the variables by two digits SIC codes, some of the included sub-sectors only
contain very few companies, which would cause the standardization procedure to employ meaningless industry
means. To assure a more conservative and sound standardization, sub-subsectors containing fewer than 15
companies, were clustered together with their closest related industry, as outlined in Appendix C.
Due to the following reasons, firm size, TLRR and Altman Z, were excluded from the standardization
procedure. Firm size can be viewed as universal measure without any ties to specific industries (Andersen, 2009).
Further, TLRR is in part based on the average performance volatility of the previous year, thereby already
accounting for industry differences. Finally, the Altman Z score has been specifically designed for the
manufacturing industry. Therefore, it seems intuitive that it should hold equally well across sub-sectors.
To avoid skewed data, TQ and TLRR were log transformed in all models, while R&D and organizational slack
were only log transformed in the mediation model where they act as the dependent variable. Having covered the
variable treatments of this study, I will now turn to discuss the sample characteristics.
5.3 SAMPLE CHARACTERISTICS
5.3.1 SAMPLE SELECTION
The data was retrieved from Standard & Poors Compustat North American database. The total time frame
ranges from 2010–19, segmented into two 5 year intervals in compliance with previous studies (Andersen, 2009).
Doing so, allows for the exploration of the proposed relationship under varying environmental condition, while
increasing the robustness of the analysis. Further, to minimize survivorship bias, both active and inactive
companies were included in the sample. Finally, the study focuses solely on publicly listed Manufacturing
companies, which includes the 2000-3999 SIC code range.
6 For a more detailed description of the mathematical calculations please refer to Appendix B.

47
During the examination of the original dataset, a substantial number of missing values were identified, which
required the dataset to undergo a ‘cleaning’ procedure. Therefore, next section will describe the approach taken
to deal with missing values.
5.3.2 DATA PREPERATIONS AND CLEANING
In cleaning the dataset, the overall aim was to make as few modifications as possible, while retaining a
sufficiently large sample. Both the data cleaning and analytical computations were coded using R, a free software
environment for statistical computing and graphics (The R Foundation, 2020).
To assure a sound and meaningful statistical analysis, a series of data cleaning steps were initiated. To provide an
overview of this procedure, Table 4 presents the exclusion criteria and how this has affected the overall sample
size in the two respective time periods.
TABLE 4 - DATA EXCLUSION CRITERIA AND SAMPLE EVOLUTION
Exclusion Criteria 2010-2014 2015-2019
Total Sample 3807 3176
Canadian Firms 3455 2909
Negative R&D/Advertising/Selling, General & Administrative/ Equity / Debt 2345 2027
Less than 5 million in total assets and revenue 2016 1592
Less than 5 observations per time interval 1417 1220
More than three missing observations per variables (excl. Adv.) 1052 913
Final Sample 1052 913
Firstly, Canadian corporations, were excluded assure that all companies faced similar market circumstances.
Second, negative values for assets, total liabilities, research and development, advertising and selling, general and
administrative expenses were excluded from the sample, as these are non-plausible values and therefore
unreliable. Third, companies with fewer than 5 million in total assets and revenue were excluded, as these
represent smaller companies, which are more likely to represent extreme and outlying observations. Fourth, to
assure consistency and comparability between companies, all were required to have performance data for the full
5 years. Finally, to undertake meaningful imputations, at least two observation per variable are required, for which
reason companies with less than two observations per variable were excluded from the sample.

48
5.3.3 IMPUTATIONS
Although many studies adopt a so called ‘complete case analysis’, where only companies with full data are
retained, this approach has been heavily criticized because it often leads to biased estimates and a reduction in
statistical power, due to the substantial reduction of the overall sample size (Graham, 2009; Zhang, 2015). One
alternative to mitigate this shortcoming is to adopt a technique called single imputations, which replaces a
missing value with a singular estimate (Little & Rubin, 2014). Doing so, I chose to apply the moving average,
under the assumption that missing data points are likely to lay somewhere in between the non-missing
observations. For mathematical details about the method and number of imputed missing values, please refer to
Appendix D and E respectively.
Given that there was a substantial percentage of missing values for advertising expenditures, I adopted a second
imputation technique, were missing values for companies with fewer than 2 observations were coded to be 0.
This was deemed appropriate given that the SEC only requires companies to document advertising expenditures
when they are “material” - usually greater than one percent of sales (U.S. Securities and Exchange Commission,
2001). Hence, missing data points for advertising expenditures are assumed to underly negligible costs that do
not have to be reported.
CHAPTER 6: EMPIRICAL FINDINGS
The following sections present the empirical findings from the study, structured into four areas of inquiry. First,
a dive into the descriptive statistics and variable correlations to get a feel for the data. Second, testing the
underlying model assumptions of OLS to assure the data has the required properties for this regression
technique. Third, testing and reporting the results from the mediation and moderation models. Fourth, a brief
investigation of the chosen control variables and their effect on the return and risk outcomes.
6.1 DESCRIPTIVE STATISTICS AND CORRELATIONS
Table 5 and 6 provide the unstandardized means and standard deviations for all variables used in the analysis, as
well as a correlation analysis across the variables for both time periods.
At a first glance, the 2015-19 period seems to be more volatile than the 2010-14 period, as indicated by the
relatively higher standard deviation across the return and risk measures, with the exception of TLRR. This speaks
toward greater return and risk differentials across firms in the second period. Although less volatile, the average
TLRR measure is slightly lower in the 2015-19 period, scoring 4.62 compared to 5.85 in the previous five-year
period. This indicates, that on average, companies were less susceptible in reaching above target level

49
performance. Recall that a higher score on both risk measures indicates a relatively lower risk profile, given that a
score above 3 for Altman Z suggests that companies are not at risk for bankruptcy, while a score above 1 for
TLRR suggests that firms are above their target level performance.
Investigating the coefficient of variation of sales, as a rough indication for environmental turbulence, shows
insignificant differences between the two samples, as the two averages only differ by 1 percent scoring 0.19 and
0.18 respectively, while the standard deviation is 0.16 and 0.15. However, the remarkable drop in the sample size
of approximately 10%, may suggests two additional points. First, it speaks toward challenging environmental
conditions in 2015-19, given that 329 firms exited the industry within this time period, corresponding to about
31 percent. In other words, the market underwent a significant selection process, whereby a large proportion of
sampled companies did not manage to survive. Second, although 190 new firms entered the industry in 2015-19,
the aggregate number of firms is still smaller, which may suggest that it presents a comparatively less attractive
business environment.
The sampled firms were profitable on average, as the mean ROA ratio tallied 2.58 and 1.20, for the two periods
respectively. Hereby, the greater volatility in 2015-19 implies that there are some more out or underperformers,
while the lower average suggests that competition has intensified. This seems like a reasonable assessment given
that the average GDP growth rate was slightly higher in the second time period, scoring 1.62 and 1.8 percent
respectively. The logic being that greater competition stimulates more demand, leading to an overall increase in
sales. In turn, spurring greater economic growth. Calculating the Herfindahl- Hirschman Index (HII)7 for the
two sub-samples – a measure of market concentration - confirms this notion, scoring 0.015 and 0.003 for the
two respective time periods. Although both results point to highly competitive industries, the markedly lower
score in 2015-19 signifies a relatively greater competitive intensity. As such, demonstrating a more challenging
environment, in which high performance is more difficult to achieve. The mean TQ in both samples shows that
on average investors saw growth potential for the sampled companies, as evident from the mean score above 18
in both periods. Given that the average TQ is slightly higher in 2010-14, would suggest that investors perceived
more growth and value creation opportunities during that period. The risk measures indicate that the average
firm is not close to bankruptcy in either period, given that the average score lays beyond 3. Similarly, the average
firm is able to exceed their TLRR, meaning they were less risky than then benchmarked industry performance of
the previous period.
As for the explanatory variables, SRC is slightly less volatile in the second time period, while also showing a
slightly lower average. The relatively higher standard deviation in 2010-14 speaks to more variation in the
competitive approach to adapt, while the lower average in 2015-19 would imply that on average firms placed less
7 Calculated by summing the squared market share of all of firms in the sample 8 At a score of 1 the market valuation matches the value of firm assets

50
emphasis on the ability to respond to environmental conditions and/or experienced greater difficulties in doing
so. The average R&D and organizational slack remained relatively stable across both periods, although R&D was
slightly more volatile in the 2010-14 period, while the opposite is true for organizational slack.
Finally, examining the density graphs of the dependent variables9 there seems to be a number of outlying
observations, especially for ROA and Altman Z score. This should hardly be surprising, given the large standard
deviations in both these measures. To the degree that such observations presented significant outliers in the
regression analysis, they were dealt with through a removal process based on Cooks D. An observation is
deemed influential when it significantly affects the regression estimates, causing results to be less reliable. In this
thesis, any point falling above 4/n, where n is the sample size, is investigated for its influence. For a more
thorough description of the Cooks D methodology, please refer to Appendix F.
9 Appendix G

51
TABLE 5- DESCRIPTIVE STATISTICS 2010-14
TABLE 6 - DESCRIPTIVE STATISTICS 2015-19
No. Variables Mean SD 1 2 3 4 5 6 7 8 9 10 11 12 13
1 Return on Assets 2.58 10.91
2 Tobin’s Q 1.89 1.16 0.01
3 Downside Risk 5.85 7.89 0.19*** -0.04
4 Altman Z 4.42 6.23 0.39*** 0.43*** 0.11***
5 Strategic Response Capabilities 0.39 0.55 0.05+ 0.25*** 0.62*** 0.23***
6 R&D Investment 0.11 0.47 -0.11*** 0.04 -0.06* -0.09** 0.01
7 Organizational Slack 0.34 0.52 -0.45*** 0.23*** -0.09** -0.05 0.06+ 0.11***
8 Firm Size 6.77 2.29 0.35*** -0.06+ 0.31*** -0.06* 0.10** -0.13*** -0.23***
9 Financial Leverage 0.15 0.14 0.01 -0.04 0.12*** -0.25*** 0.01 -0.07* -0.11*** 0.44***
10 Capital Intensity 1.36 0.78 -0.19*** 0.05 0.01 0.06* 0.08** 0.10*** 0.21*** 0.09** 0.06*
11 Advertising Intensity 0.01 0.06 0.01 0.01 -0.02 0.00 -0.01 0.07* 0.01 -0.02 -0.03 -0.01
12 Advertising Dummy 0.55 0.49 -0.07* 0.04 0.03 -0.05+ 0.05+ 0.03 -0.02 0.07* 0.04 0.05 -0.19***
13 High Tech Industry 0.78 0.41 -0.11*** 0.09** 0.10** 0.03 0.01 0.10** 0.14*** -0.13*** -0.19*** 0.14*** -0.05 0.07*
14 Medium Tech Industry 0.08 0.28 0.04 -0.09** -0.10** -0.01 -0.05+ -0.05 -0.08** 0.06* 0.04 -0.06+ 0.02 0.04 -0.57***
Notes: +p < 0.10; *p < 0.05; **p < 0.01; ***p < 0.001; n = 1052
No. Variables Mean SD 1 2 3 4 5 6 7 8 9 10 11 12 13
1 Return on Assets 1.20 12.86
2 Tobin’s Q 1.74 1.76 0.04
3 Downside Risk 4.62 4.62 0.21*** -0.08*
4 Altman Z 4.64 9.18 0.28*** 0.43*** 0.04
5 Strategic Response Capabilities 0.34 0.39 -0.15*** 0.29*** 0.30*** 0.13***
6 R&D Investment 0.11 0.32 -0.34*** 0.21*** -0.12*** 0.06+ 0.24***
7 Organizational Slack 0.38 0.63 -0.44*** 0.22*** -0.15*** 0.04 0.25*** 0.78***
8 Firm Size 7.06 2.38 0.38*** -0.11*** 0.33*** -0.08* -0.03 -0.12*** -0.21***
9 Financial Leverage 0.21 0.22 0.04 -0.07* 0.10** -0.16*** 0.00 0.07* -0.09** 0.32***
10 Capital Intensity 1.57 1.31 -0.19*** 0.04 -0.02 0.05 0.16*** 0.64*** 0.60*** 0.14*** 0.06+
11 Advertising Intensity 0.02 0.14 -0.01 0.05 0.06+ 0.02 0.06+ -0.01 0.02 -0.02 -0.01 0.05
12 Advertising Dummy 0.56 0.49 0.00 -0.10** 0.05 -0.04 0.03 0.05 -0.03 0.16*** 0.11*** 0.09** -0.12***
13 High Tech Industry 0.78 0.41 -0.11** 0.12*** 0.06+ 0.04 0.07* 0.13*** 0.13*** -0.12*** -0.11*** 0.12*** 0.01 0.08*
14 Medium Tech Industry 0.08 0.28 0.00 -0.13*** -0.05 -0.04 -0.09* -0.05 -0.09** 0.06+ 0.05 -0.07* 0.01 0.00 -0.57***
Notes: +p < 0.10; *p < 0.05; **p < 0.01; ***p < 0.001; n = 913

52
The correlation analysis provides a first sense of the strength and direction of the bivariate variable
relationships. ROA displays a positive significant relationship with the two risk measures in both periods.
Similarly, TQ and Altman Z are positively correlated. In part, this suggest an inverse risk return
relationship, where high risk is associated with low performance and vice versa (Bowman, 1980). ROA is,
however, uncorrelated with TQ in both periods, implying a greater detachment from annual financials in
driving market valuations.
As expected, SRC is positively correlated with all performance and risk variables, with the exception of
ROA in the 2015-19 period, where there seems to be negative correlation. A speculative interpretation
could be few influential and very poorly performing firms that have effective SRC. Thus, being able to
stabilize extreme losses, but unable to generate positive returns. The strong correlation between SRC and
TQ may attest to the high potential value creation effects of SRC, as judged by the market.
In the 2010-14 period R&D is not correlated with SRC, while organizational slack is positively correlated.
In the subsequent period both R&D and slack are highly and positively correlated with SRC.
Interestingly, both R&D and organizational slack are negatively correlated with the performance
measures, with the exception of TQ. This seems reasonable, given that R&D expenditures are initially
expensed as they occur, rather than capitalized (Lev & Sougiannis, 1996). Thus, initially decreasing
accounting performance, which is consistent with some of the literature suggesting that R&D has a
significant lag effect (Sougiannis, 1994; Lev & Sougiannis, 1996; Lee & Wu, 2016). It is also in harmony
with the positive relationship with TQ, as it provides information about the investor’s current
expectations of the company’s future profitability. Put differently, unlike ROA, TQ should reflect the
present discounted value of future expected profits, where such investment decisions have already been
factored in. A similar logic applies to downside risk, in which there also seems to be a negative association
with R&D and slack. That is, uncertainties (e.g. technological market) underlying such investments,
initially increase firm risk, as the future pay-offs remain unknown until a later point in time (Moehrle &
Walter, 2008). Finally, there could be another dynamic at play here – a curvilinear relationship with
performance and risk outcomes (Nohria & Gulati, 1996; Andersen, 2009).
6.2 OLS ASSUMPTIONS
This section reports on the tests conducted to ensure that potential statistical issues are both identified
and dealt with. This includes testing regression residuals for normality, multicollinearity and
heteroscedasticity. Given the unforeseen negative association between R&D and organizational slack with
some of the dependent variables, I have also conducted the Ramsey Regression Equation Specification
Error Test (RESET), to identify or rule out possible model misspecifications. This assures that the Model
has the proper functional form, by testing whether non-linear combinations of the model increase the

53
explanatory power (Wooldridge, 2012). Adopting a 5 % confidence interval, the results show that it the
Model is not better explained by a non-linear combination of the variables. Given that the mediation
models are largely based on combinations of variables, it was deemed sufficient to conduct the test for
the two moderation Models only, as it gives a fairly good overview of whether non-linearities are present.
The inspection of the Q-Q plots10, reveals some deviations from normality, especially for the Altman Z
score and ROA. Although such non-normality does not bias the findings, it decreases efficiency, which
can potentially lead to higher standard errors (Wooldridge, 2012). After removing an average of 53 and 41
influential cases for the two respective time-periods, the Q-Q plots reach closer to normality, although
Altman Z and ROA continue to show some deviations. Apart from removing outliers and relying on
more advanced statistical methods (e.g. Quasi Maximum Likelihood Methods), which lay beyond the
scope of this study, the assumption of normality can be relaxed by invoking the Central Limit Theorem
(CTL), stating that the distribution of a sample is approximately normal as the sample size increases.
Hereby, a sample size of 30 is usually suggested for the assumption to hold (Lynch, 2013). Given that the
two collected samples, were far beyond this threshold, it seems appropriate to rely on the CTL here,
which gives comfort that the results are approximately correct.
Heteroskedascity was identified using the White Test, which revealed varying results for the different
models. In the presence of heteroskedacity, I used robust standard errors, which are more conservative
and thus more appropriate than the standard errors (Gujarati & Porter, 2009). Whether robust or
standard errors have been used, is indicated in the regression table, where SE, stands for Standard errors,
and RSE for robust standard errors.
No problems were detected concerning multicollinearity, as the neither VIF nor the correlation Matrix
revealed values that lay beyond their respective thresholds. The maximum VIF value across all models
tallied 3.15, which is significantly below the threshold of 10 (Woolridge, 2012). Additionally, the
maximum correlation coefficient is 0.57, which too is below the suggested 0.8 threshold at which
multicollinearity becomes a problem (Gujarati & Porter, 2009).
Finally, the results from the RESET11 suggest no evidence for functional form model misspecification,
given that all results lead to the rejection of the null hypothesis, confirming that no nonlinear
combinations of the variables have been omitted. As such, the current Model specifications are deemed
sufficient to test these relationships and need no further extensions. Having assured that the OLS
assumptions are upheld reasonably well, I will now turn to report the statistical result of the Mediation
and Moderation Models.
10 Appendix H and I 11 See Appendix I

54
6.3 REGRESSION RESULTS
This section is structured into two parts. First, the regression results for the mediation and the moderation
models will be covered respectively, testing the hypotheses H1 through H3. As mentioned previously, all
regression equations were tested for influential observations using Cooks D, whereby the most extreme
observations were removed one by one. The influence of such points was visually investigated by the
means of the Q-Q plot, whereby observations were removed until no or insignificant changes to the
regression line and residuals could be detected. To provide more conservative, stable and generalizable
results, all the reported results are based on the exclusion of outliers. Given that each regression equation
has a unique set of outliers, the number of excluded points varies slightly across models. This was deemed
to be the most appropriate approach, given that it better assures that the underling model assumptions of
OLS could be upheld. For comparability and transparency purposes, the full models were also tested and
documented, which can be found in Appendix M and N. In cases of significant differences across the full
and reported models, they will be addressed in the respective section. In the absence of commentary, they
display similar results, in which case there is no need for further discussion. Second, all the results from the
mediation and moderation analysis will be summarized to provide a final and comprehensive overview of
the findings.
6.3.1 MEDIATION RESULTS
Before describing the results for the mediation analysis, it is useful to briefly present how the coming
section is structured. Both return and risk measures will be discussed in tandem, as they are expected to
reveal similar insights. Doing so, the results of all four Models will be reported separately for each time-
period in progressive order. Given that the effect of SRC on the two mediators within the same time-
period are identical across all Models, they will only be presented briefly the second time around, to avoid
unnecessary repetition where the underlying meaning remains the same. Due to limited space, the Tables
have been added to the Appendix, which can be accessed with interactive links.
RETURN 2010-14: ROA & TQ
Testing Model 1, the analysis shows that the direct performance impact of effective SRC remains strong
after controlling for influences of organizational size, advertising, capital and technology intensity, as well
as financial leverage. Thus, providing support for Hypothesis H1a. Hence, companies possessing
relatively more effective SRC are associated with higher return outcomes, both in terms of accounting
and market based performance.
Hypothesis H2.1a and H2.c were tested by analyzing Model 2, in which R&D and organizational slack act
as the independent variables in the relationship with performance outcomes. The results show that both
measures are significant across the two models yet vary in their effect. In the ROA model, they display a

55
negative association, while the opposite is true for TQ. Thus, only providing support for Hypothesis
H2.1a and H2.1c, where TQ acts as the dependent variable.
Model 3, testing the direct effect of SRC on R&D and organizational slack, shows an insignificant
relationship for both mediating variables. Thus, unlike hypothesized, more effective SRC do no lead to
increases in spending on R&D and organizational slack in the 2010-14 period. As such, one can
prematurely conclude that there is no mediating effect, due to the absence of an indirect effect. Thus,
rejecting hypotheses H2.2a and H2.2c.
Finally, testing Model 4, all explanatory variables display a significant relationship with the dependent
variables, where SRC displays a positive and highly significant impact on both performance variables,
while organizational slack and R&D show a negative impact on ROA and positive one for TQ. Despite,
the absence of a mediating effect, it is worth noting how the explanatory power increases in both Models,
once all variables are added to the equation. Hence, speaking to their independent and collective impact
on return outcomes. Hereby, Model 4 with ROA as the dependent variable, is able to explain
approximately 40%, which is about 14 % higher than Model 1 and 5 % higher than Model 2. Similarly,
the final TQ model is able to explain approximately 25 %, which is 13 % higher than Model 1 and 12 %
higher than Model 2. It should be noted that all 4 Models are highly significant (p< 0.0001), meaning that
the independent variables improve the model fit. Having covered the results for the 2010-14 period, I will
not turn to discuss the results of the second time-period.
RETURN 2015-19: ROA & TQ
Like the former period the impact of SRC and both performance measures remain positive and
statistically significant in 2015-19, reinforcing Hypothesis 1a. The impact of R&D and organizational
slack on both performance measures, remains consistent with the previous period, lending support to
Hypothesis 2.1a and 2.1c, where TQ acts as the dependent variable. Interestingly, Hypotheses H2.2 a and
H2.2. c are supported in this period, exhibiting a positive and statistically significant impact of SRC on
both R&D and organizational slack. Thus, companies possessing more effective SRC appear to spend
more on innovative initiatives.
When the mediators are added to the regression equation in Model 4, the direct effect of SRC on firm
performance remains significant across both measures, while the impact of the mediators also remain
significant. As such, one can infer that there is a partial mediating effect of R&D and organizational slack
on return outcomes, although the type of effect varies. With ROA acting as the dependent variable, there
seems to be a negative mediational effect, where the coefficient increases slightly from 0.099 to 0.103
once the two mediators are added. This implies that investments into innovation causes the positive
return effect from SRC to decrease. Although this may seem counterintuitive, it would be consistent with

56
the proposition that R&D and organizational slack exhibit a lag effect, in which the performance
improvements resulting from such investments cannot be readily observed within the same period. In
contrast, the TQ model shows a decrease in the coefficient from 0.381 to 0.340, meaning that there is a
partial and positive mediating effect. In other words, some of the improvements in performance stem
from investment activities into R&D and organizational slack that can only be traced back to SRC
indirectly. Thus, leading to a partial acceptance of Hypothesis 2.2a and 2.2c, for the TQ Model.
Again, the final Models have the highest explanatory power, where ROA and TQ are able to explain
approximately 30.6 and 25.9 percent respectively. Notably, the explanatory power of the ROA Model is
approximately 10 percent lower than the previous period. Again, all 4 Models are statistically highly
significant (p<0.0001).
In this time-period, there are some significant differences between the reported Model for ROA and the
full Model. In Model 1 the coefficient of SRC is negative and non-significant. This effect persists up until
the removal of 5 outliers, where the effect turns positive and significant. Thus, speaking to the influence
exerted by the 5 outliers over the regression equation. Second, the impact of R&D on firm performance
is also not significant. Lastly, Model 4 does not display a significant relationship between SRC and R&D
on accounting performance. Given that SRC does exhibit a positive relationship with slack in the full
Model, the interpretation for the Full Model would differ. Recall that the impact of SRC in Model 1 on
firm performance is not a prerequisite to infer mediation. As such, one would conclude that there is a full
and negative mediation of organizational slack.
Overall, this underlines a more general dynamic of outliers – they increase data variability, which can
shift the regression line. That is, outliers can exert extreme influence over the regression estimates, as
their divergence from the overall pattern of the sample can lead to different results. It also points toward
a more general shortcoming of OLS – because residuals are squared outlying observations gain
overproportioned prominence. Hence, distorting parameter estimates. This means that the regression
equation is sensitive to outliers and thus not robust for the inclusion of such. Having covered the results
for both periods concerning the performance relationship, I will now turn to discuss the risk Models.
RISK 2010-14: TLRR & ALTMAN Z
The regression coefficient of SRC on both risk measures is positive and highly significant, after the
inclusion of the relevant control variables, hence providing support for Hypothesis 1b. The positive
coefficient was to be expected, given that a higher score on both measures indicates a lower risk profile.
As such one can infer that companies with more effective SRC are able decrease firm risk.

57
Testing the impact of the two mediating variables on risk outcomes, organizational slack remains negative
and highly significant across both Models, leading to the rejection of Hypothesis 2.1b and 2.1d. This
implies, that both R&D and organizational slack increase rather than decrease firm risk.
As mentioned previously, the results from Model 3 are identical with the ones reported in the previous
section, thus leading to the rejection of Hypothesis 2.2b and 2.2 d, as the SRC exhibits no significant
relationship with either mediator.
Finally, Model 4, exhibits the same positive and significant correlation between SRC and risk outcomes,
while R&D and organizational slack negatively impact the relationship. Thus, more effective SRC
decrease firm risk, while relatively higher levels of organizational slack and R&D increase it. The absence
of the indirect effect suggests that the three variables affect risk independently from one another.
Notable, is the increase in explanatory power across the two final models, where the explanatory power
reaches 21.67 and 46.06 percent for bankruptcy and downside risk respectively. Especially the downside
risk Model is quite strong, which speaks to the relevance of the included variables in explaining downside
risk. Lastly, all the Models are highly significant (p<0.0001), underlining that the results do not occur by
chance. Next, I will turn to test and discuss the same Models in the second time-period.
RISK 2015-19: TLRR & ALTMAN Z
Consistent with the previous period, the effect of SRC on both risk outcomes remains positive and
statistically significant across both models, reinforcing Hypothesis 1b. Regressing R&D and
organizational slack on TLRR, both exhibit negative and statistically significant coefficients, meaning that
they increase downside risk. It should be noted that the impact of R&D on firm performance in the full
Model for TLRR is not significant, implying that the results are not robust for outliers. For Altman Z, the
effect of R&D is non-significant, while organizational slack is significant and negative, meaning that it
increases bankruptcy risk. Consequently, Hypotheses 2.1b and 2.1d are rejected for all Models.
Not surprisingly, the results from Model 3 exhibit a statistically significant relationship between SRC and
R&D, as well as SRC and organizational slack. This signifies that more effective SRC lead to relatively
higher levels of R&D and organizational slack.
Testing Model 4 for a mediation effect, the impact of SRC on both risk outcomes remains highly
significant (p< 0.0001) after adding the two mediators. As such, the relationship is only partially mediated.
For Altman Z, the R&D coefficient remains insignificant, while organizational slack displays a negative
and significant effect, indicating that it weakens rather than strengthens the risk outcomes of effective
SRC. That is, part of the positive effect stemming from SRC in reducing firm risk vanishes due to

58
increases in organizational slack arising from more effective SRC. For downside risk, both measures
display a negative and statistically significant association, indicating that both R&D and organizational
slack play a role in increasing firm risk and thus weakening the positive impact of SRC in decreasing firm
risk. In both instances, the coefficient of SRC increases once all variables are added to the regression,
meaning that its effect is stronger at lower level of R&D and organizational slack. As such, Hypothesis
2.2b and 2.2d are not supported in either of the Models. Nonetheless, it provides new informational value
on the relationship, supporting the previous notion that R&D and organizational slack have different
short and long-term dynamics. Again, the final Model is significantly stronger than the previous 3 Models
and are able to explain 31.69 and 19.95 percent for the downside and bankruptcy risk models respectively.
Like the performance Models, the explanatory power is slightly lower in this period, which reinforces the
assumption that more turbulent environments impose more complex operational conditions. Finally, all
Models are highly significant (p<0.0001), meaning that the relationship between the independent variables
and risk outcomes do not occur at chance.
Next, I will now turn to discuss the results from the moderation Models.
6.3.2 MODERATION RESULTS
Like the mediation Models, the two performance and risk measures will be discussed in tandem.
However, given that the last equation of the mediation model and the first equation of the moderation
model are identical, there is not value added by reiterating the same results. Recall, that the impact of SRC
on performance and risk outcomes in Model 4 for all dependent variables was significant across both
time-periods. Thus, lending support to both H1a and H1b across all the moderation Models (here Model
1). In other words, the impact of effective SRC positively/negatively influences performance outcomes
even after the inclusion of relevant control variables. Consequently, the following sections will focus
solely on Model 2.
RETURN 2010-14: ROA & TQ
The results from the regression are presented in Table 3. Regressing the interaction term between SRC
and R&D on firm performance outcomes yields statistically significant coefficients for both measures. In
the Model where ROA acts as the dependent variable, the results show a negative coefficient, meaning
that companies operating with higher levels of R&D inhibit the effectiveness of their SRC leading to
decreases in accounting based performance. Consequently, Hypothesis H3a is not supported for the ROA
Model. In contrast, the regression equation with TQ reflects the expected positive interaction, where
companies operating with higher levels of R&D seem to improve the effectiveness of their SRC and
hence their market based performance. This suggests that investors place a premium on companies who
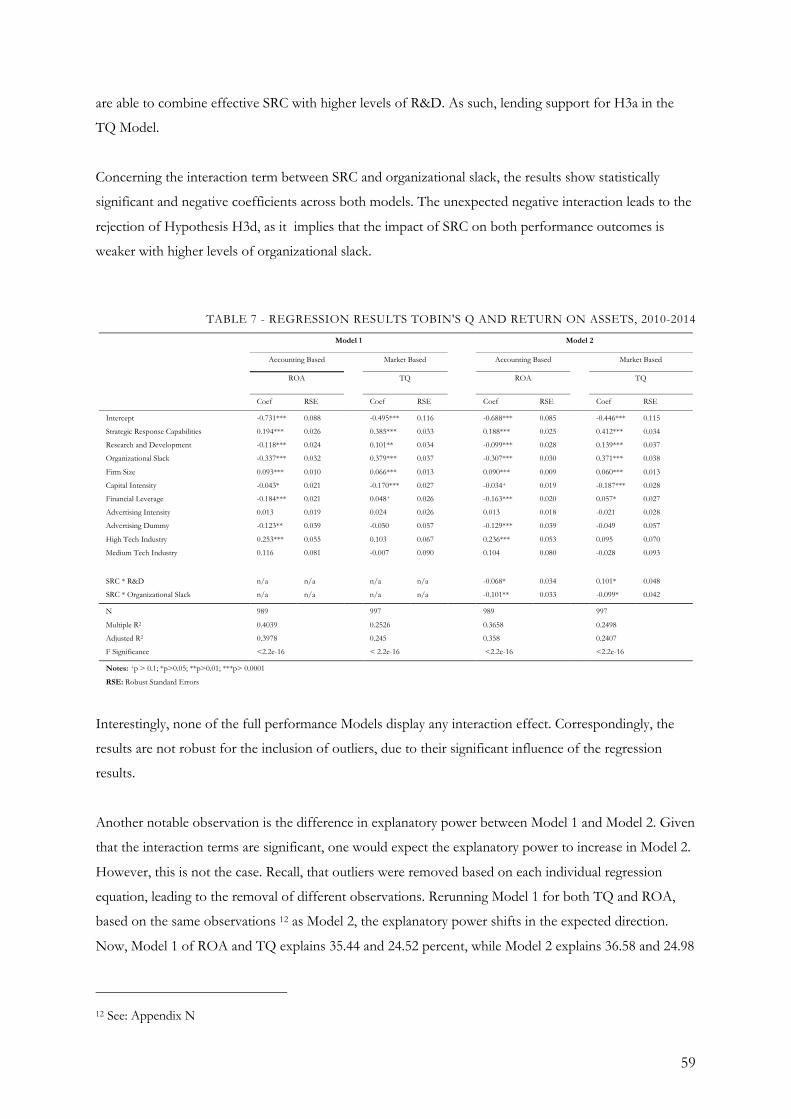
59
are able to combine effective SRC with higher levels of R&D. As such, lending support for H3a in the
TQ Model.
Concerning the interaction term between SRC and organizational slack, the results show statistically
significant and negative coefficients across both models. The unexpected negative interaction leads to the
rejection of Hypothesis H3d, as it implies that the impact of SRC on both performance outcomes is
weaker with higher levels of organizational slack.
TABLE 7 - REGRESSION RESULTS TOBIN'S Q AND RETURN ON ASSETS, 2010-2014
Model 1 Model 2
Accounting Based Market Based Accounting Based Market Based
ROA TQ ROA TQ
Coef RSE Coef RSE Coef RSE Coef RSE
Intercept -0.731*** 0.088 -0.495*** 0.116 -0.688*** 0.085 -0.446*** 0.115
Strategic Response Capabilities 0.194*** 0.026 0.385*** 0.033 0.188*** 0.025 0.412*** 0.034
Research and Development -0.118*** 0.024 0.101** 0.034 -0.099*** 0.028 0.139*** 0.037
Organizational Slack -0.337*** 0.032 0.379*** 0.037 -0.307*** 0.030 0.371*** 0.038
Firm Size 0.093*** 0.010 0.066*** 0.013 0.090*** 0.009 0.060*** 0.013
Capital Intensity -0.043* 0.021 -0.170*** 0.027 -0.034+ 0.019 -0.187*** 0.028
Financial Leverage -0.184*** 0.021 0.048+ 0.026 -0.163*** 0.020 0.057* 0.027
Advertising Intensity 0.013 0.019 0.024 0.026 0.013 0.018 -0.021 0.028
Advertising Dummy -0.123** 0.039 -0.050 0.057 -0.129*** 0.039 -0.049 0.057
High Tech Industry 0.253*** 0.055 0.103 0.067 0.236*** 0.053 0.095 0.070
Medium Tech Industry 0.116 0.081 -0.007 0.090 0.104 0.080 -0.028 0.093
SRC * R&D n/a n/a n/a n/a -0.068* 0.034 0.101* 0.048
SRC * Organizational Slack n/a n/a n/a n/a -0.101** 0.033 -0.099* 0.042
N 989 997 989 997
Multiple R2 0.4039 0.2526 0.3658 0.2498
Adjusted R2 0.3978 0.245 0.358 0.2407
F Significance <2.2e-16 < 2.2e-16 <2.2e-16 <2.2e-16
Notes: +p > 0.1; *p>0.05; **p>0.01; ***p> 0.0001
RSE: Robust Standard Errors
Interestingly, none of the full performance Models display any interaction effect. Correspondingly, the
results are not robust for the inclusion of outliers, due to their significant influence of the regression
results.
Another notable observation is the difference in explanatory power between Model 1 and Model 2. Given
that the interaction terms are significant, one would expect the explanatory power to increase in Model 2.
However, this is not the case. Recall, that outliers were removed based on each individual regression
equation, leading to the removal of different observations. Rerunning Model 1 for both TQ and ROA,
based on the same observations 12 as Model 2, the explanatory power shifts in the expected direction.
Now, Model 1 of ROA and TQ explains 35.44 and 24.52 percent, while Model 2 explains 36.58 and 24.98
12 See: Appendix N

60
percent of performance variation, respectively. Again, this underlines the influence exerted by outliers on
the individual regression equations. Finally, the regression for all Models are highly significant (p<0.0001),
implying that the independent variables improve the Model fit.
Having assessed the regression results for the 2010-14 period, I will now turn to report the results for the
2015-19 period and thus get a sense for the robustness of these findings.
RETURN 2015-2019: ROA & TQ
Table 4 presents the regression results for this time-period. Regressing the interaction term between SRC
and organizational slack on both performance measures, yields consistent results with the previous time-
period, where the coefficient is statistically significant and negative. Consequently, Hypothesis H3c is not
supported by the results. Thus, reinforcing the proposition that companies with relatively higher levels of
organizational slack weaken the performance impact of SRC. Notable is how the coefficient in the ROA
Model almost doubles in contrast to the former period, increasing from 0.101 to 0.198. A speculative
interpretation of this finding is a greater need for efficiency under more competitive conditions, where
excessive levels of slack more severely impact the effectiveness of SRC. In contrast the market based
measure displays a diminishing effect, where the coefficient drops from 0.99 to 0.075, which may suggest
that investors are more forgiving when companies use greater amounts of slack resources under more
intense competitive conditions.
Further, the interaction term between R&D and SRC shows an insignificant coefficient for both
measures, implying that effective SRC are not strengthened by higher levels if R&D investments. This is
especially surprising for the TQ Model, where the effect was previously significant. Hence, in the 2015-
2019 period, investors disregard the combination of R&D and effective SRC in their market valuations.
Here too, the Models seems to be sensitive to outliers, given that the full Models differ to the ones
reported. Firstly, the interaction effect between SRC and organizational slack is not significant for TQ
when outliers are included. Second, although significant, the interaction effect between SRC and
organizational slack is much lower in the full Model. As such, the Models are not robust under the
inclusion of outliers.

61
TABLE 8 - REGRESSION RESULTS TOBINS'S Q AND RETURN ON ASSETS, 2015-2019
Model 1 Model 2
Accounting Based Market Based Accounting Based Market Based
ROA TQ ROA TQ
Coef RSE Coef RSE Coef RSE Coef RSE
Intercept -0.856*** 0.110 -0.546*** 0.129 -0.828*** 0.111 -0.486*** 0.129
Strategic Response Capabilities 0.103*** 0.024 0.340*** 0.031 0.092*** 0.025 0.353*** 0.032
Research and Development -0.093* 0.044 0.229*** 0.039 -0.087* 0.038 0.258*** 0.043
Organizational Slack -0.317*** 0.046 0.273*** 0.047 -0.247*** 0.044 0.248*** 0.046
Firm Size 0.104*** 0.012 0.065*** 0.014 0.103*** 0.012 0.058*** 0.014
Capital Intensity -0.071*** 0.028 -0.303*** 0.033 -0.083** 0.028 -0.285*** 0.034
Financial Leverage -0.147*** 0.024 0.018 0.031 -0.131*** 0.023 0.022 0.031
Advertising Intensity -0.014 0.036 0.017 0.036 -0.048 0.032 0.033 0.038
Advertising Dummy -0.140** 0.051 -0.062 0.064 -0.144** 0.050 -0.046 0.064
High Tech Industry 0.268*** 0.065 0.150* 0.074 0.269*** 0.067 0.140+ 0.075
Medium Tech Industry 0.232* 0.098 0.218* 0.099 0.237* 0.098 0.227* 0.037
SRC * R&D n/a n/a n/a n/a 0.029 0.030 -0.013 0.037
SRC * Organizational Slack n/a n/a n/a n/a -0.198*** 0.036 -0.075* 0.036
N 858 875 858 875
Multiple R2 0.3064 0.259 0.2941 0.2595
Adjusted R2 0.2982 0.2504 0.2841 0.2492
F Significance < 2.2e-16 <2.2e-16 <2.2e-16 <2.2e-16
Notes: +p > 0.1; *p > 0.05; **p > 0.01; ***p > 0.0001
RSE: Robust Standard Errors
Like the former period, there is an unexpected difference in the explanatory power between Model 1 and
2. Again, rerunning Model 1 based on the same observations as Model 2, this dynamic changes, where the
explanatory power increases by 3 and 1 percent, explaining 28.4 and 24.92 percent of the variation in
accounting and market based performance respectively. Finally, all Models are highly significant
(p>0.0001), reinforcing the previous finding that the independent variables improve the Model fit.
Having covered the results for the performance measures in both periods, I will now turn to investigate
the proposed relationships for the two risk variables.
RISK 2010-14: TLRR & ALTMAN Z
The results from the regression are presented in Table 5. Testing the interaction effect between SRC and
R&D on the two risk measures, the coefficient is only statistically significant for Altman Z. The
unexpected negative interaction does not support Hypothesis H3b, as it suggests that companies
operating with relatively higher levels of R&D inhibit the risk reducing effect stemming from more
effective SRC. Combined, this leads to the rejection of Hypothesis H3b for both Models, as neither
exhibits the expected relationship. Hypotheses H3d is rejected for both Models, as regressing the
interaction term between SRC and organizational slack, yields insignificant results for both measures.
Consequently, one can infer that higher levels of organizational slack do not strengthen the effectiveness
of SRC in reducing bankruptcy and downside risk.

62
TABLE 9 - REGRESSION RESULTS TARGET LEVEL RISK RATIO AND ALTMAN Z SCORE, 2010-2014
Model 1 Model 2
Downside Risk Bankruptcy Risk Downside Risk Bankruptcy Risk
Target Level Risk Ratio Altman Z Target Level Risk Ratio Altman Z
Coef RSE Coef RSE Coef RSE Coef RSE
Intercept 0.128 0.102 4.106*** 0.428 0.142 0.101 3.903*** 0.451
Strategic Response Capabilities 0.392*** 0.024 1.122*** 0.140 0.400*** 0.031 1.156*** 0.147
Research and Development -0.113*** 0.026 -0.272* 0.132 -0.139*** 0.029 -0.207 0.148
Organizational Slack -0.222*** 0.029 -0.421** 0.144 -0.193*** 0.028 -0.377* 0.147
Firm Size 0.140*** 0.011 0.0002 0.050 0.138*** 0.011 0.024 0.052
Capital Intensity -0.026 0.024 0.335** 0.136 -0.024 0.023 0.354* 0.138
Financial Leverage 0.029 0.024 -1.544*** 0.117 0.035 0.022 -1.564*** 0.122
Advertising Intensity -0.022 0.028 -0.140+ 0.083 -0.023 0.024 -0.159+ 0.087
Advertising Dummy -0.072 0.049 -0.678** 0.237 -0.061 0.048 -0.578* 0.242
High Tech Industry 0.372*** 0.065 0.687** 0.218 0.368*** 0.062 0.695** 0.223
Medium Tech Industry -0.184 + 0.098 0.384 0.316 -0.193** 0.088 0.347 0.320
SRC * R&D n/a n/a n/a n/a -0.093* 0.040 -0.222 0.229
SRC * Organizational Slack n/a n/a n/a n/a 0.016 0.036 -0.080 0.177
N 1023 1003 1003 1005
Multiple R2 0.4606 0.2167 0.4479 0.2123
Adjusted R2 0.4551 0.2088 0.4412 0.2028
F Significance < 2.2e-16 < 2.2e-16 < 2.2e-16 < 2.2e-16
Notes: +p > 0.1; *p>0.05; **p>0.01; ***p> 0.0001
RSE: Robust Standard Errors
SE: Standard Errors
Like the performance Models, here too, there is an unexpected difference in the explanatory power for
the two Models. For the TLRR Model, where the interaction effect between R&D and SRC is significant,
this seems questionable, given that the sum of significant coefficients/variables explaining the
relationship is greater. However, testing the regression using the same observations as Model 2, this
changes in the expected direction, leading to a slight increase in explanatory power, where Model 1
explains 44.56 and Model 2 explains 44.79 percent of variation in downside risk. Here too, all Models are
highly significant (p<0.0001), suggesting that the independent variables improve the Model fit.
Having covered the results for the 2010-14 period, I will now turn to discuss the results for the second
time-period.
RISK 2015-19: TLRR & ALTMAN Z
The results from the regression are presented in Table 6. Regressing the interaction term between SRC
and R&D on both risk measures, yield positive and statistically significant coefficients. Thus, lending
support to hypothesis H3b in both instances. This would suggest that companies can lower their risk
outcomes when combining effective SRC with higher levels of R&D. This is particularly interesting when
comparing the results from TRLL of the previous period, where it displayed a significant negative
interaction effect. Further, the interaction effect between SRC and organizational slack is negative and

63
highly significant (p<0.0001) for both risk measures, suggesting that higher levels of organizational slack
decrease the risk reducing impact of effective SRC.
TABLE 10 - REGRESSION RESULTS TARGET LEVEL RISK RATIO AND ALTMAN Z SCORE, 2015-2019 Model 1 Model 2
Downside Risk Bankruptcy Risk Downside Risk Bankruptcy Risk
Target Level Risk Ratio Altman Z Target Level Risk Ratio Altman Z
Coef RSE Coef RSE Coef RSE Coef RSE
Intercept 0.054 0.116 4.143*** 0.569 0.040 0.115 3.656*** 0.614
Strategic Response Capabilities 0.338*** 0.026 0.928*** 0.173 0.362** 0.027 0.863*** 0.168
Research and Development -0.118*** 0.032 0.148 0.168 -0.120*** 0.034 0.186 0.177
Organizational Slack -0.226*** 0.037 -0.616** 0.213 -0.161*** 0.038 -0.709*** 0.205
Firm Size 0.136*** 0.012 0.035 0.067 0.140*** 0.012 0.087 0.072
Capital Intensity 0.012 0.029 -0.024 0.150 -0.051+ 0.029 -0.034 0.171
Financial Leverage 0.009 0.027 -1.751*** 0.172 0.007 0.027 -1.802*** 0.175
Advertising Intensity -0.047 0.033 -0.049 0.162 -0.070* 0.033 -0.033 0.167
Advertising Dummy -0.091 0.055 -1.167*** 0.336 -0.096+ 0.055 -1.089** 0.344
High Tech Industry 0.205** 0.072 0.806** 0.284 0.213** 0.072 0.772** 0.295
Medium Tech Industry -0.110 0.107 -0.531 0.383 -0.126 0.106 -0.509 0.383
SRC * R&D n/a n/a n/a n/a 0.059+ 0.032 0.524* 0.260
SRC * Organizational Slack n/a n/a n/a n/a -0.123*** 0.030 -0.764*** 0.182
N 906 877 906 877
Multiple R2 0.3783 0.19 0.3865 0.1884
Adjusted R2 0.3713 0.1806 0.3783 0.1771
F Significance < 2.2e-16 < 2.2e-16 < 2.2e-16 < 2.2e-16
Notes: +p > 0.1; *p>0.05; **p>0.01; ***p> 0.0001
RSE: Robust Standard Errors
SE: Standard Errors
Unlike the previous Models, the explanatory power of TLRR increases in the second Model, suggesting
that it is more robust to outlying observations. In contrast, the Altman Z displays the same problematic as
the rest of the Models, where the explanatory power does not increase. Again, when adjusting the Model
1 to include the same observations as Model 2, here too the explanatory power increases. Again, all
Models are highly significant (p<0.0001), reinforcing that the independent variables play an important
part in explaining risk outcomes. Having covered all the results from the mediation and moderation
Models, I will now present a final summary of the findings.
6.3.3 SUMMARY EMPIRICAL RESULTS
The summary of final results can be seen in Table 11 and 12 for the mediation and moderation Models
respectively. One notable commonality across all Models is the positive/negative effect of SRC on firm
return and risk outcomes, providing strong support for the proposition that companies possessing
effective SRC are relatively more susceptible in reaching favorable risk/return outcomes. Investigating the
difference between SRC in the two time-periods, there seems to be an interesting dynamic. While the
relative impact of SRC on firm performance outcomes is weaker in the 2015- 19 period, the opposite is
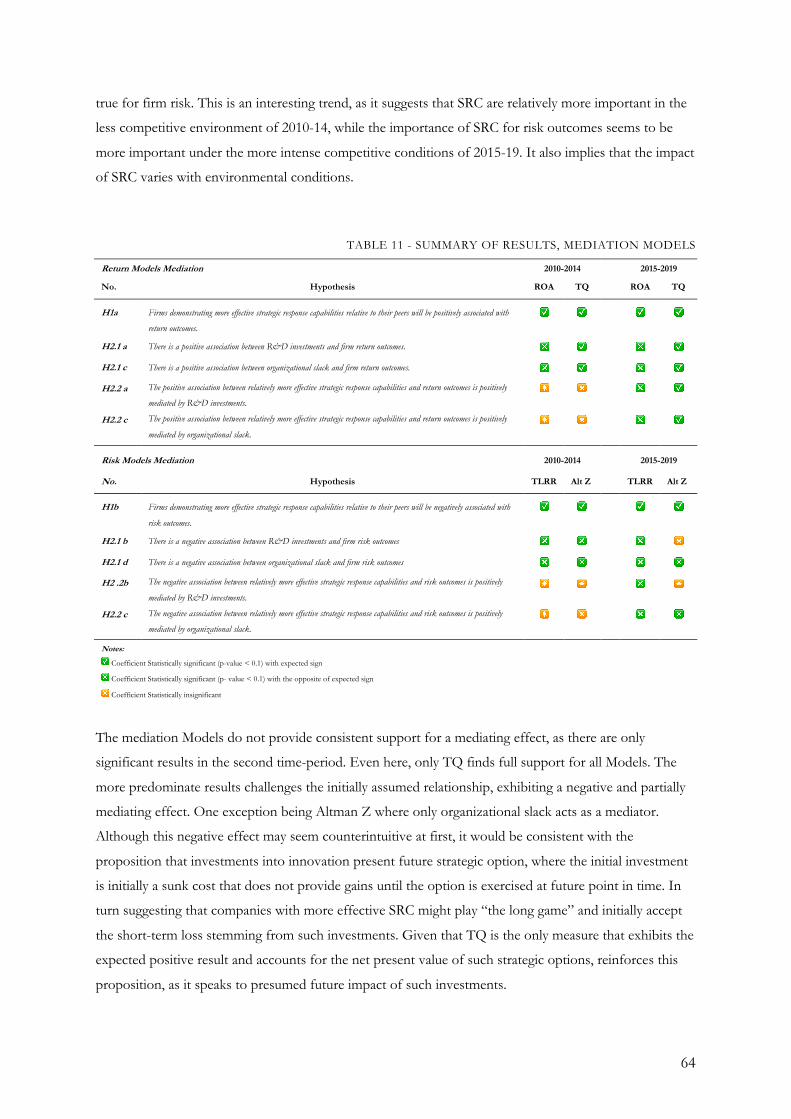
64
true for firm risk. This is an interesting trend, as it suggests that SRC are relatively more important in the
less competitive environment of 2010-14, while the importance of SRC for risk outcomes seems to be
more important under the more intense competitive conditions of 2015-19. It also implies that the impact
of SRC varies with environmental conditions.
TABLE 11 - SUMMARY OF RESULTS, MEDIATION MODELS
Return Models Mediation 2010-2014 2015-2019
No. Hypothesis ROA TQ ROA TQ
H1a Firms demonstrating more effective strategic response capabilities relative to their peers will be positively associated with
return outcomes. ✅ ✅ ✅ ✅
H2.1 a There is a positive association between R&D investments and firm return outcomes. ❎ ✅ ❎ ✅
H2.1 c There is a positive association between organizational slack and firm return outcomes. ❎ ✅ ❎ ✅
H2.2 a The positive association between relatively more effective strategic response capabilities and return outcomes is positively
mediated by R&D investments. ✴ ✴ ❎ ✅
H2.2 c The positive association between relatively more effective strategic response capabilities and return outcomes is positively
mediated by organizational slack. ✴ ✴ ❎ ✅
Risk Models Mediation 2010-2014 2015-2019
No. Hypothesis TLRR Alt Z TLRR Alt Z
H1b Firms demonstrating more effective strategic response capabilities relative to their peers will be negatively associated with
risk outcomes. ✅ ✅ ✅ ✅
H2.1 b There is a negative association between R&D investments and firm risk outcomes ❎ ❎ ❎ ✴
H2.1 d There is a negative association between organizational slack and firm risk outcomes ❎ ❎ ❎ ❎
H2 .2b The negative association between relatively more effective strategic response capabilities and risk outcomes is positively
mediated by R&D investments. ✴ ✴ ❎ ✴
H2.2 c The negative association between relatively more effective strategic response capabilities and risk outcomes is positively
mediated by organizational slack. ✴ ✴ ❎ ❎
Notes:
✅ Coefficient Statistically significant (p-value < 0.1) with expected sign
❎ Coefficient Statistically significant (p- value < 0.1) with the opposite of expected sign
✴ Coefficient Statistically insignificant
The mediation Models do not provide consistent support for a mediating effect, as there are only
significant results in the second time-period. Even here, only TQ finds full support for all Models. The
more predominate results challenges the initially assumed relationship, exhibiting a negative and partially
mediating effect. One exception being Altman Z where only organizational slack acts as a mediator.
Although this negative effect may seem counterintuitive at first, it would be consistent with the
proposition that investments into innovation present future strategic option, where the initial investment
is initially a sunk cost that does not provide gains until the option is exercised at future point in time. In
turn suggesting that companies with more effective SRC might play “the long game” and initially accept
the short-term loss stemming from such investments. Given that TQ is the only measure that exhibits the
expected positive result and accounts for the net present value of such strategic options, reinforces this
proposition, as it speaks to presumed future impact of such investments.

65
TABLE 12 - SUMMARY OF RESULTS, MODERATION MODELS
Return Models Moderation 2010-2014 2015-2019
Hypothesis ROA TQ ROA TQ
H1a Firms demonstrating more effective strategic response capabilities relative to their peers will be positively associated with
return outcomes. ✅ ✅ ✅ ✅
H3a The positive association between relatively more effective strategic response capabilities and return outcomes is positively
moderated by investments into R&D. ❎ ✅ ✴ ✴
H3c The positive association between relatively more effective strategic response capabilities and return outcomes is positively
moderated by the deployment of organizational slack. ❎ ❎ ❎ ❎
Risk Models Moderation 2010-2014 2015-2019
Hypothesis TLRR Alt Z TLRR Alt Z
H1b Firms demonstrating more effective strategic response capabilities relative to their peers will be negatively associated with risk
outcomes. ✅ ✅ ✅ ✅
H3b The negative association between relatively more effective strategic response capabilities and risk outcomes is positively
moderated by investments into R&D. ❎ ✴ ✅ ✅
H3d The negative association between relatively more effective strategic response capabilities and risk outcomes is positively
moderated by the deployment of organizational slack. ✴ ✴ ❎ ❎
Notes:
✅ Coefficient Statistically significant (p-value < 0.1) with expected sign
❎ Coefficient Statistically significant (p- value < 0.1) with the opposite of expected sign
✴ Coefficient Statistically insignificant
Like the mediation models, there seems to be inconsistent support for a moderation effect across both
periods, with the exception of the interaction between organizational slack and SRC on firm performance
outcomes. Although not supporting the initial hypothesis, there is strong evidence for a negative
interaction between the two, where companies operating with higher levels of slack seem to negatively
influence their accounting and market based performance. Interestingly, there is no interaction effect that
is consistently insignificant across both periods, which may attest to the influences of environmental
conditions on the outcome.
6.4 CONTROL VARIABLES
In this section, I will briefly present the impact of the control variables on the return and risk outcomes,
for the two final mediation and moderation Models. Given that the control variables are not the focus of
this thesis, I will keep the discussion brief. Table 13 reports on the expected versus the encountered signs
of the control variables and whether they are significant (p<0.1). Note that the table below only displays
the results for the moderation Model, while the mediation results can be found in Appendix Q. The
impact of control variables is almost identical, with the exception of four variables, which do not display a
significant impact in the mediation Model.
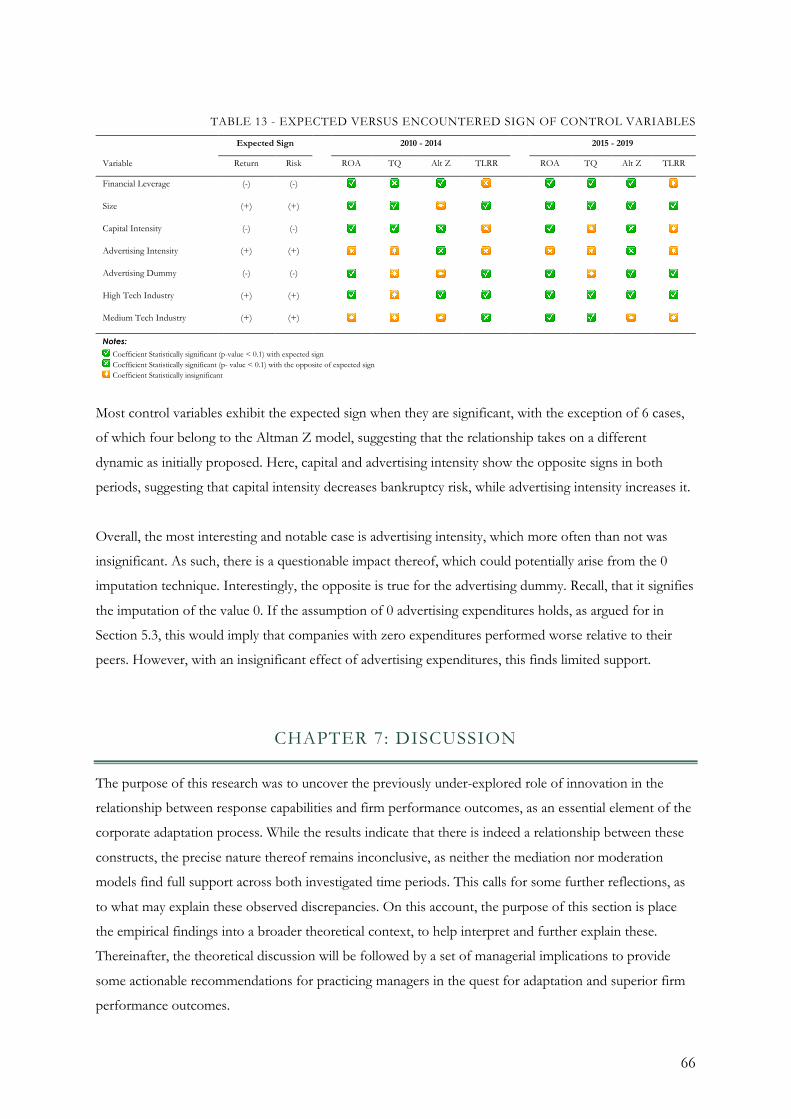
66
TABLE 13 - EXPECTED VERSUS ENCOUNTERED SIGN OF CONTROL VARIABLES
Expected Sign 2010 - 2014 2015 - 2019
Variable Return Risk ROA TQ Alt Z TLRR ROA TQ Alt Z TLRR
Financial Leverage (-) (-) ✅ ❎ ✅ ✴ ✅ ✅ ✅ ✴
Size (+) (+) ✅ ✅ ✴ ✅ ✅ ✅ ✅ ✅
Capital Intensity (-) (-) ✅ ✅ ❎ ✴ ✅ ✴ ❎ ✴
Advertising Intensity (+) (+) ✴ ✴ ❎ ✴ ✴ ✴ ❎ ✴
Advertising Dummy (-) (-) ✅ ✴ ✴ ✅ ✅ ✴ ✅ ✅
High Tech Industry (+) (+) ✅ ✴ ✅ ✅ ✅ ✅ ✅ ✅
Medium Tech Industry (+) (+) ✴ ✴ ✴ ❎ ✅ ✅ ✴ ✴
Notes: ✅ Coefficient Statistically significant (p-value < 0.1) with expected sign ❎ Coefficient Statistically significant (p- value < 0.1) with the opposite of expected sign ✴ Coefficient Statistically insignificant
Most control variables exhibit the expected sign when they are significant, with the exception of 6 cases,
of which four belong to the Altman Z model, suggesting that the relationship takes on a different
dynamic as initially proposed. Here, capital and advertising intensity show the opposite signs in both
periods, suggesting that capital intensity decreases bankruptcy risk, while advertising intensity increases it.
Overall, the most interesting and notable case is advertising intensity, which more often than not was
insignificant. As such, there is a questionable impact thereof, which could potentially arise from the 0
imputation technique. Interestingly, the opposite is true for the advertising dummy. Recall, that it signifies
the imputation of the value 0. If the assumption of 0 advertising expenditures holds, as argued for in
Section 5.3, this would imply that companies with zero expenditures performed worse relative to their
peers. However, with an insignificant effect of advertising expenditures, this finds limited support.
CHAPTER 7: DISCUSSION
The purpose of this research was to uncover the previously under-explored role of innovation in the
relationship between response capabilities and firm performance outcomes, as an essential element of the
corporate adaptation process. While the results indicate that there is indeed a relationship between these
constructs, the precise nature thereof remains inconclusive, as neither the mediation nor moderation
models find full support across both investigated time periods. This calls for some further reflections, as
to what may explain these observed discrepancies. On this account, the purpose of this section is place
the empirical findings into a broader theoretical context, to help interpret and further explain these.
Thereinafter, the theoretical discussion will be followed by a set of managerial implications to provide
some actionable recommendations for practicing managers in the quest for adaptation and superior firm
performance outcomes.

67
7.1 LINKING EMPERICAL FINDINGS TO PREVIOUS LITERATURE
This part of the discussion will be centered around 4 central topics. First, I will reflect upon the consistent
support concerning the impact of effective SRC on firm risk and return. Second, I will discuss potential
causes for the observed negative association between performance outcomes, organizational slack and
R&D. Doing so, I will initially consider the validity of the previously implied lag effect, followed by a
consideration about the measurement accuracy of R&D and organizational slack as indicators for
innovation. Third, I will dive into the model specifications of the mediator model and consider whether
important variables have been omitted in the set-up of the regression equation that could have caused
inconsistent results. Fourth and last, I will discuss the concurrent mediation and moderation effect in the
2015-19 period, which might provide additional insights on the relationship between SRC and innovation.
7.1.1. EFFECTIVE STRATEGIC RESPONSE CAPABILITIES
To date, there have been few empirical studies investigating the performance outcomes of effective SRC,
despite its popularity in explaining performance differentials (e.g. Bettis & Hitt 1995, Andersen, 2009). A
plausible explanation for this shortage could be the inherent difficulty in measuring this construct in a
reasonable and accurate way. By taking a more holistic approach in conceptualizing SRC - as the
companies aggregate ability to manage external threats and opportunities - I attempted to reduce this
shortage through the development of a new measure. Relying on the coefficient of variation of sales
divided by the coefficient of variation of net income over a 5-year period as a proxy for SRC, it provides
an indication of how firms are both affected by environmental change and how successfully they are in
responding to such. Rooted in proper theoretical arguments it thus provided a first avenue to empirically
investigate the performance impact of such adaptive capabilities on firm performance outcomes.
Overall, this research lends support to the proposition that firms with effective SRC can improve their
performance outcomes through their superior ability to maintain a steady earnings development in the
face of exogenous risk. Although, the various organizational activities that support this capability are not
addressed in further detail, the underlying logic suggests that companies possessing these are more
adaptive because they can deflect risky situations and take advantage of new emerging opportunities,
ultimately translating into favorable risk/return outcomes. Thus, differences in the level of SRC across
companies may explain why some companies are differentially effective at adapting to environmental
change. This reaffirms not only the theoretical basis provided by Bettis and Hitt (1995), as the initial
pioneers of the concept, but also subsequent studies, where companies with adaptative capabilities were
found to outperform their peers.
Additionally, companies with more effective SRC seem to display the often found paradoxical
relationship between risk and return, known as the Bowman Paradox (Bowman, 1980; Andersen & Bettis,

68
2014; Santacruz, 2020). Thus, contrary to conventional economic and finance wisdom, suggesting a trade-
off between risk and return, this study corroborates the negative association between these constructs.
Hence, the ability to respond better to environmental changes compared to peers, allows companies to
realize higher earnings, while concurrently reducing their earnings volatility.
7.1.2 SLACK & R&D – PLAYING THE LONG GAME?
At a first glance, the regression results revealed some conflicting results regarding the impact of R&D and
organizational slack on firm performance outcomes, showing a negative association for three of the four
dependent variables. The positive relation with TQ – a forward looking measure - seems to point toward
a more fundamental dynamic. Firms investing into firm specific resources may opt to increase their future
performance. Evidently, this is something not readily observable by metrics based on the current
accounting year. This suggests, that companies investing into new value creating activities are play the
long-game, in which they satisfice short-term performance for long-term gains. This raises the question of
whether using same-period expenditures is an accurate depiction of the dynamics underlying R&D and
organizational slack and their interactive or mediating effects with SRC to adapt and perform.
Research is consistent in suggesting that R&D expenditures are crucial for long-term performance
(Latham & Braun, 2010). However, the picture becomes somewhat more blurred when looking at the
short-term dynamic, as studies have shown divergent evidence, demonstrating either positive, negative or
curvilinear relationships (Connolly & Hirschey, 1984; Bae, et al., 2008, Andersen, 2009). Equally debated
is the relationship between R&D and firm risk, with arguments being presented on both ends of the
spectrum (Bromiley, et al., 2017).
Turning to the literature, two compelling reasons emerge for why R&D expenditures should not display a
favorable impact on profitability and risk in the same-period accounting period. Firstly, R&D is initially a
sunk cost as accounting standards require such investments to expensed rather than capitalized (Lev &
Sougiannis, 1996). As such, they should negatively impact the firms bottom line in the year they took
place. The concurrent uncertainty surrounding R&D success should also initially increase firm risk, as
there is no guarantee that the initial investment will be recovered (Mone, et al., 1998). Thus, the uncertain
nature of R&D is akin to gambling and can be viewed as a bet that presents “a willingness to back the hunch of
a research scientist” (Bowman & Hurry, 1993, p. 774), where the only certainty that remains is that they
detract from short-term profitability (Latham & Braun, 2010). Thus, only when development efforts
prove fruitful, exogenous risks can be deflected and managed through the introduction of an innovation.
Secondly, with an average project lifetime of about three years (Ravenscraft & Scherer, 1982) R&D
investments are subjected to considerable development time. New revenue streams can only be realized
when the resulting innovation is implemented, sold or commercialized. The implied time lag is further

69
exacerbated by the fact that even after technical success is attained, companies must spend additional time
on the product launch, building up new sales (e.g. promotion) or replacing older production processes
(Ravenscraft & Scherer, 1982). Hence, not only is the development of an innovation a costly and time-
intensive endeavor, so is the subsequent commercialization thereof. This suggests that R&D investments
initially decrease profitability and increase risk.
With respect to organizational slack, one might be tempted to side with agency theorists and infer that it
causes inefficiencies and waste leading less favorable performance outcomes (Singh, 1996; Cashen &
Geiger, 2002). Yet, this defies the idea that slack promotes innovative and experimental behavior (Nohria
& Gulati, 1996). Although a plausible alternate explanation might be a curvilinear relationship, the
RESET test conducted in Section 5.2, showed that the Model is not better explained by exponential
combinations of the variables. Correspondingly, a potential lag effect is the more obvious possibility. In
the ideal case, the discretion over additional financial resources for the purpose of experimentation
should induce innovative behavior, where mangers can act on their localized knowledge to exploit new
opportunities, while deflecting risky situations. In turn, these decentralized initiatives may lead to new
emergent strategies that can inform top management about alternate strategic paths moving forward
(Andersen & Nielsen, 2009). Research suggests, that when decentralized initiatives are successful and take
momentum they are integrated into the formal strategy (Andersen, 2015). Therefore, one would expect
these initiatives to become impactful on firm performance outcomes when top management recognizes
and formally integrates them into their strategic plans. However, to my knowledge, no study has
investigated the approximate time frame in which middle managers demonstrate new, successful strategic
actions and top management actually integrates. Thus, additional insights on the interactive dynamic
between centralized and decentralized actions could be an important prerequisite to understand when and
how one should observe favorable outcomes.
It has been suggested that the operational level strategy may be reviewed annually, while long-term plans
are updated every 3-5 years (Flamholtz & Randle, 2015). As such, experimental actions that prove fruitful
throughout the same accounting year, are only likely to be integrated in the subsequent year – at least for
the majority of firms. Potentially, companies possessing contemporary and quicker interactive patterns
between decentralized and centralized strategy-making process are more effective at adaptation. Yet this
remains a conundrum for further research. Concurrently, it suggests that organizational slack only
indirectly influence firm performance outcomes, as it requires top management to use these insights pro-
actively to adjust their strategic path (Andersen & Nielsen, 2009).
In the context of the present study, it has been argued that investments into innovation can expand the
strategic options space, by allowing companies to adjust their course of action when attractive to do so.
However, if R&D and organizational slack truly exhibit a lag effect, it should not be surprising that

70
neither the moderation nor mediation effect is positive in the short-run. Regardless of whether innovation
strengthens the effect or SRC or mediates its performance impact, the benefits thereof cannot be realized
until a viable innovation is produced. This may point towards a shortcoming of the real options logic
when applied to innovation. While these investments appear to act like a real option - they cannot be
exercised at any given time because they must first be developed along an exploratory process, where the
outcome remains uncertain.
Overall, it seems intuitively right, that R&D and organizational slack display a lag effect, whereby the
positive gains from such exploratory and serendipitous behavior cannot be readily observed within the
same period. As such, it would be worth adopting lagged measures for these two constructs. However,
doing so, longitudinal data will be more appropriate, as it allows the researcher to account for the
different lag effects of R&D and organizational slack.
7.1.3 INNOVATION BEYOND INVESTMENTS
Another worthwhile consideration is the accuracy of R&D intensity and organizational slack as proxies
for centralized and decentralized innovation, as they remain crude approximations of the more fine-
grained activities. Although it is intuitive that a company cannot create compelling offerings without
allocating money into the development thereof, the mere investment does not guarantee success (Mone,
et al., 1998). As such, it can only be conceived of as the intent or commitment to innovate and not be
equated with an innovative outcome.
So, if R&D merely captures the intent to innovate, how might this be reflected in the analytical results?
Recall that the relationship between R&D and firm performance was based on the argument that it spurs
the development of new products, services or processes, that should render comparably higher profits by
enabling adaptive moves. Yet, if development efforts fail there is no innovation to be implemented and
enhance the company’s strategic fit with the evolving environment. Although real options theory suggests
that the option to abandon is valuable, it merely assures that the firm can minimize its losses and not the
avoidance of sunk costs altogether. Thus, abandoned or failed projects inevitably hurt the firms bottom
line, while the severity thereof is contingent upon spillover effects. The same logic suggests, that risk can
only be decreased if the initial investments leads to a successful innovation.
R&D as a determinant for firm performance is further put into question by the fact that some firms can
invest well-below the industry average and nonetheless thrive while others can invest well above and
flounder. For instance, strategy& found that companies who outperformed their peers on seven key
financial success metrics spent less on R&D as a percentage of sales (Jaruzelski, et al., 2018). This would
suggest that it’s the quality of R&D projects, rather than the sheer size of investment that influences firm
performance outcomes. Probably a more appropriate way to capture R&D, would be the combination of

71
an input (e.g. R&D expenditures), intermediate (e.g. patents) and output measure (e.g. new product sales),
that reflects the success rate of the firm’s development efforts (Iddris, 2016). Unfortunately, such
measures are not readily available from archival data and require some more elaborate and lengthy data
collection processes (e.g. surveys) that are beyond the scope of this study.
A similar logic may apply to organizational slack as a proxy for decentralized innovation. Like R&D,
organizational slack merely reflects the monetary input towards discretionary activities yet is silent about
the outcome and success thereof. Adding to the dilemma, the SG&A ratio entails a number of items that
are likely disconnected from innovative behavior, such as legal, accounting and non-manufacturing related
rent costs. As such, it remains a somewhat crude approximation of decentralized innovative behavior.
Altogether, this may explain some of the negative interactions between SRC, R&D and organizational
slack, as well as the negative mediating effect. While these investments supposedly expand the strategic
options space and thus enhance SRC, in-progress and unsuccessful projects cannot be distinguished from
those that are successful and implemented. Arguably, the relationship(s) could benefit from a number of
moderators or mediators that mirror or determine the success of such investments. This seems logical,
given that a firm’s resources do not exist in isolation, but depends upon the environment within which
they exist (Katila & Shane, 2005). Thus, integrating additional organizational characteristics may enhance
the explanatory power of R&D and organizational slack. The literature has suggested a number of factors
that influence the success of corporate innovation, ranging from organizational culture (Wang et al.,
2010), absorptive capacity (Cohen & Levinthal, 1989) to leadership (Elkins & Keller, 2003).
Overall, this discussion points to the limited value of archival data in capturing the impact of innovation
on firm performance, as both R&D and organizational slack remain crude approximations. Although
important, the financial input to innovation can be regarded as only one of the many important factors
that facilitate innovation.
7.1.4 MEDIATOR – MODEL SPECIFICATIONS
Another notable finding is the inconsistent support for the mediation model. One conspicuous
explanation could lie in the underlying model specifications. Because the control variables for the two
mediators where based on their association with the two return and risk measures, the regression
equations testing these relationships may not have optimally captured the dynamics by which firm
increase or decrease R&D and organizational slack. As a consequence, it may have influenced the
significance level of SRC as a predictor for this relationship. Therefore, it is worth considering alternate
control variables that are explicitly tailored to the investigated relationship.

72
A particularly interesting dynamic to consider is a potential bidirectional relationship between firm
performance outcomes and the two mediators. Previous research has shown that past profitability
encourages innovation, leading to higher R&D expenditures (Audretsch, 1995). At the same time, there is
evidence that current firm performance may also be a predictor of R&D (Graves, 1988). In fact, return on
assets has been used as a control variable in previous studies investigating R&D determinant (Wang, et al.,
2016; Ling, et al., 2020). In that regard, I would expect ROA to negatively influence investments into
R&D in the short-run, based on the following two rationales.
Firstly, investments into R&D requires managerial foresight, with a willingness to satisfice short-
term performance for long-term gains. There is significant evidence that capital markets induce pressure
for short-term performance by focusing predominately on reported financial performance (Porter, 1992;
Dunk & Kilgore, 2001). As such, companies may have strong incentives to curtail R&D expenditures, and
forgo profitable, long-term investment opportunities due to the pressure induced by shareholders for
short-term financial results. Especially so, as R&D investments present a riskier strategy that competes
for funds with other instruments of firm strategy (Audretsch, 1995). Following this logic, companies with
higher performance might reflect myopic tendencies and thus invest relatively less in R&D, in an attempt
to retain investor expectations and avoid the risk and uncertainties associated with innovation. On the
other hand, companies with comparatively lower performance in the current year, might spent relatively
more on R&D in an attempt to realize long-term growth opportunities. Thus, satisficing short-term
performance for long-term gains.
A second reason which may suggest that poor performers spent relatively more on R&D can be
found in the organizational decline literature - "necessity is the mother of invention" (Mone, et al., 1998, p. 118).
In other words, poor performers are driven to invest in new approaches to mitigate the impending threat
of failure and thus try to stimulate higher performance. Backed by the organizational learning literature, it
is suggested that companies exhibiting poor performance experience a gap between actual and desired
results, leading them to search for new innovative solutions (Cyert & March, 1963; Lant & Mezia, 1992).
Additionally, prospect theory proposes that decision makers facing losses will tend to be risk seeking,
whereas managers who have achieved gains will tend to be risk averse (Kahneman & Tversky, 1979).
Thus, not only will companies with more foresight satisfice performance, they will also be willing to
accept higher levels of risk. Although the discussion has focused on R&D, I would expect the same
dynamic to hold for organizational slack, as it too presents a risky investment with unknown future gains.
Integrating these insights into the Model and thus adding ROA and TLRR as control variables, confirms
this proposition, as both display a significant and negative effect on R&D intensity and organizational
slack13. More notable is how the relationship between R&D, organizational slack and SRC changes when
integrating these variables. Now SRC displays a positive and significant effect across both periods when
acting as a determinant for R&D and organizational slack. As such, providing support for the partial
13 Appendix R and S

73
mediational effect of the two mediators. Concurrently, the explanatory power of these models increases,
suggesting that the relationship is indeed better explained when adding these variables to the equation.
While adding ROA and TLRR enhance the model fit, it also points toward an endogeneity problem or so
called “simultaneity bias”, where the outcome variable is also a predictor of the independent variable
(Lynch & Brown, 2011). In this case, it would be more appropriate to analyze the relationships with a two
equation system, such as two stage least squares (Wooldridge, 2012). Note that it does, however, provide
support for the model where TQ and Altman Z act as the dependent variables, given that these variables
were not included in the new regression equation. To further circumvent this issue, one could adopt
alternative profitability and risk measures for ROA and TLRR such as, return on investments and current
year standard deviation of returns for the two measures, respectively. Thus, providing an interesting case
for further research.
7.1.5 MODERATED MEDIATION?
An interesting and notable dynamic is the simultaneous moderation and partial mediation effect,
especially so when readjusting the regression equations for the two mediator models. Although it might
seem counterintuitive that both effects are contemporaneous, this is indeed possible (Hayes, 2013). In this
case the relationship takes a different functional form and is usually tested through conditional process
analysis (ibid). Here, both propositions are tested in parallel, as illustrated in the two Models below.
Both Figures illustrate the same relationship and only differ in the graphical depiction of the underlying
dynamic. That is, X, leads to M, whereby M leads to Y. Further, the impact of M on Y is contingent on
the level of X. In the context of this study, it would suggest that relatively more effective SRC lead to
increases in R&D and organizational slack, while the direct effect of the two mediators on firm
performance outcomes is contingent on the effectiveness of SRC. As such, SRC should moderate its own
indirect impact on firm performance outcomes.
FIGURE 7 - A MEDIATED MODERATION MODEL (2) FIGURE 6 - A MEDIATED MODERATION MODEL

74
While modeling this relationship as a mediator moderator combination is mathematically possible,
another question is whether it is sensible to do so. In other words, are there sufficient theoretical grounds
for SRC to moderate its own indirect impact? Recall that SRC in itself does not necessarily lead to
improvements in performance, as the company might misperceive environmental signals that lead to the
initiation of flawed responses, inter alia by investing in unattractive opportunities. As such, the impact of
innovation on firm performance, might very well depend on how well the firm is able to rightly perceive
market signals, tailor its responses and reconfigure its resources. Further, if we construe R&D as an
ongoing activity that spans over several years, it would seem logical, that over the project’s lifetime, the
firm’s SRC can inform on the viability thereof. Especially so, as forecasting technology and the industry
evolution is complex and often not very inaccurate beyond a few months (Bettis & Hitt, 1995; Rosenberg,
1995). As such, it is particularily imporant to both detect and respond to such changes to assure the
project is conductive towards attaining enviornmental fit. Inter alia sensing changes in the external
environment, that can reinform the scope of the projects, whether it needs to be readjusted or alternate
projects should be pursued.
Combined, it seems intuitively right, that the success of innovation and thus its impact on firm
performance outcomes, is contingent on how effectively the firm has identified, conceptualized and
reconfigured its resources as a response to an external event at an ongoing basis. As such, it seems
reasonable to construe the relationship between SRC and investments into innovation as a mediated
moderation model, which would be a promising area for further research.
7.2 MANAGERIAL IMPLICATIONS
Finally, the thesis and its findings have a number of managerial implications. First, the results provide
clear indications for the benefits derived from nurturing and employing strategic response capabilities.
Correspondingly, it should be an imperative for managers to consider, build and maintain such adaptive
capabilities, as an essential driver for favorable firm performance and risk outcomes. Second, managers
should be conscious of the fact that they cannot expect to harvest immediate benefits from R&D and
organizational slack, as they are often tied to adverse cost effects within the same accounting period.
Nonetheless, the negative short-term impact of innovation should not discourage managers to undertake
these investments, as they are potentially important drivers of corporate renewal and prosperity. Of
course, neither R&D or organizational slack are miracle cures and mangers should be reflective about
other important organizational processes that support SRC (e.g. leadership, structure), as well as other
influences on the innovation development efforts itself. Third, both innovation and SRC are directed at
the exploitation/mitigation of future opportunities and risks. The forward looking character of these
constructs makes them more prone toward cost-cutting, especially under turbulent conditions. Yet,
75
managers should resist the temptation to curtail such expenditures for short-term gains, as they will
support the long-term survival of the corporation.
CHAPTER 8: CONCLUDING REMARKS
Finally, this chapter represents the concluding remarks of the thesis, divided into two parts. First, I will be
reflecting upon the limitations of this study and promising areas for future research. Second, I will present
the overall conclusion to the research question. Hence, answering “What is the role of Innovation in the
relationship between strategic response capabilities and firm performance outcomes in public US manufacturing firms during
2010-2019?”
8.1 LIMITATIONS AND FUTURE RESEARCH
The empirical analysis exhibited some sensitivity to the inclusion of outliers. Although the CTL was
invoked to cope with this issue, future research could benefit from alternative regression techniques that
are more robust compared to OLS. This may include Robust Regression or Least Absolute Deviation,
which employ weighting techniques to account for very influential outliers (Wooldridge, 2009). The use
of cross sectional data presents another limitation because it may cause endogeneity problems such as
“causality” or “simultaneity bias “ (Lynch & Brown, 2011). The issue of causality was already addressed in
Section 3.4 and dealt with through the instigation of financial leverage as a control variable. There does,
however, seem to be a problem with simultaneity bias, due to the seemingly bilateral dependence between
R&D, organizational slack, ROA and TLRR. This may call for alternate ways to analyze the data, such as
a two equation system (e.g. two stage least squares) or alternatively, the deployment of other performance
measures such as ROE, ROS or ROI.
Furthermore, small companies with fewer than 5 million in revenue and assets were excluded from the
sample, under the argument that these are more prone to represent outlying observations. As such, the
findings are only generalizable for medium sized and large businesses.
The thesis relies on archival performance data to explore the relationship between innovation and
strategic response capabilities. To deepen the understanding thereof, one would have to look behind the
performance data to ascertain how the proposed relationship plays out in the ‘real world’.
Correspondingly, follow up case studies, could be a promising avenue to uncover the dynamics through
with innovation and SRC lead to superior performance outcomes.
Finally, the focus of this study remained on the internal boundaries of the firm, yet, companies may also
create or obtain innovation-based strategic options in the external environment. As such, it only provides

76
partial picture of how strategic options can benefit companies in their quest for adaptation. Three
promising areas for further research could update this understanding – markets for technology, mergers
and acquisitions and open innovation. Markets for technology as a central place where companies can buy
new technologies (Arora, et al., 2001), which might be pertinent for large corporations with superior
complementary assets and commercialization capabilities. Mergers and acquisitions to attain needed
technological know-how, strategic assets and growth. And finally, open innovation, through which the
company can expand their strategic option space by collaborating with relevant parties. Inter alia engaging
in joint ventures or strategic alliances that allow them to combine and tap into new knowledge sources,
while sharing the development risk.
8.2 CONCLUSION
Driven by curiosity to understand how companies succeed in the new competitive landscape, this thesis
explored the role of innovation as an essential adaptive process in the relationship between strategic
response capabilities and firm performance outcomes. On the basis of real options logic, these concepts
were bridged into an integrated conceptual framework that allowed for the development of two
competing hypotheses that could be empirically tested based on a comprehensive dataset of public US
manufacturing firms.
Strong support was found for the central hypothesis of this paper that companies possessing more
effective SRC display favorable return and risk outcomes. In other words, they appear to be more
efficient and effective at generating a stable earnings development, by taking advantage of new
environmental opportunities, while deflecting risky situations in an increasingly volatile world.
The results did not provide the same clarity for the role of innovation within this relationship, as the
findings showed inconsistent evidence across the two studied time-periods. Both concerning the
hypothesized mediating and moderating function of innovation. Yet, after the inclusion of additional
control variables - ROA and TLRR - as predictors of R&D and organizational slack, the results revealed
consistent support for a partially mediating effect of both constructs. Thus, companies with more
effective SRC appear to invest more into the creation of new value creating and firm-specific business
propositions. It did, however, point towards an endogeneity problem, limiting the generalizability of these
findings. In particular, the results only provide full support for market based performance and bankruptcy
risk. Even there, the role of innovation as a mediator differs. For TQ, both R&D and organizational slack
capture some of the positive impact stemming from relatively more effective SRC. Thus, higher investor
valuations are partly driven by investments into innovation, which can only be tied to SRC indirectly. For
bankruptcy risk, innovation appears to take a partially negative mediating role, which masks some of the
favorable return outcomes derived from effective SRC.

77
Additionally, the study also finds a consistent negative interaction between SRC and organizational slack
across the two return measures, indicating that in the short-run, the provision of discretionary resources
for experimentation, negatively impact the effectiveness of SRC and thereby performance. The
relationship between R&D and SRC remains inconclusive, with varying results across the two models.
Overall, the results provide an indication that R&D and organizational slack facilitate the creation of
long-term business opportunities, whose (potentially) favorable impact is not readily observable by
current year accounting data. Concurrently, it seems that both centralized and decentralized innovation
represent richer and more complex phenomenon, which cannot be fully captured by archival data. This
invites further scholarly exploration, with a special focus on the lag effects of innovation, as well as more
elaborate proxies for these constructs.
Finally, the results revealed an unexpected concurrent mediating and moderating effect, which could
suggest that innovation and SRC are intertwined in a more complex way, where more effective SRC lead
to increases in innovation, but also determine the magnitude of its impact on firm performance
outcomes.

78
REFERENCE LIST
Acharya, V. & Xu, Z., 2017. Financial dependence and innovation: The case of public versus private firms. Journal of Financial
Economics, 124(1), pp. 223 - 243.
Adner, R. & Levinthal, D. A., 2004. What Is Not a Real Option: Considering Boundaries for the Application of Real Options
to Business Strategy. The Academy of Management Review, 29(1), pp. 74-85.
Aggarwal, V. A., Posen, H. E. & Workiewicz, M., 2017. Adaptive Capacity to Technological Change: A Microfoundational
Approach. Strategic Management Journal, Volume 38, pp. 1212-1231.
Aldrich, H., 1999. Organizations Evolving. Nebury Park, CA: Sage Publications.
Altman, E. I., 1968. Financial Ratios. Discriminant Analysis and the Prediction of Corporate Bankruptcy. The Journal of
Finance, 23(4), pp. 589-609.
Ambrosini, V., Bowman, C. & Collier, N., 2009. Dynamic Capabilities: An Exploration of How Firms Renew their Resource
Base. British Journal of Management, 20(1), pp. 9 - 24.
Amit, R. & Wernerfelt, B., 1990. Why Do Firms Reduce Business Risk?. The Academy of Management Journal , 33(3), pp. 520 -
533.
Andersen, T. J. & Bettis, R. A., 2014. The Risk-Return Outcomes of Strategic Responsiveness. In: T. J. Andersen, ed.
Contemporary Challenges in Risk Management. New York: palgrave macmillan, pp. 63- 90.
Andersen, T. J. & Nielsen, B. B., 2009. Adaptive strategy making: The effects of emergent and intended strategy modes.
European Management Review, Volume 6, pp. 94-106.
Andersen, T. J., 1999. Strategizing in the New Competitive Energy Market. The Electricity Journal, 12(7), pp. 42-48.
Andersen, T. J., 2008. The Performance Relationship of Effective Risk Management: Exploring the Firm-Specific Investment
Rationale. Long Range Planning, 41(1), pp. 155 - 176.
Andersen, T. J., 2009. Effective risk management outcomes: exploring effects of innovation and capital structure. Journal of
Strategy and Management, 2(4), pp. 352-379.
Andersen, T. J., 2014. Contemporary Challenges in Risk Management: Dealing with Risk, Uncertainty and the Unknown. s.l.:palgrave
macmillan.
Andersen, T. J., 2015. Interactive strategy-making: combining central reasoning with ongoing learning from decentralited
responses. Journal of Genereal Management, 40(4), pp. 69-88.
Andersen, T. J., Denrell, J. & Bettis, R. A., 2007. Strategic Responsiveness and Bowman's Risk-Return Paradox. Strategic
Management Journal , 28(4), pp. 407 - 429.
Anderson, P. & Tushman, M. L., 1990. Technological Discontinuities and Dominant Designs: A Cyclical Model of
Technological Change. Administrative Science Quarterly, 35(4), pp. 604-633.
Arora, A. & Gambardella, A., 2010. Ideas for rent: an overview of markets for technology. Industrial and Corporate Change,
19(3), pp. 775-803.

79
Arora, A., Fosfuri, A. & Gambardella, A., 2001. Markets for Technology and their Implications for Corporate Strategy.
Industrial Corportae Change, 10(2), pp. 419- 451.
Audretsch, D. A., 1995. Firm Profitability, Growth, and Innovation. Review of Industrial Organization, Volume 10, pp. 579 - 588.
Bae, S. C. & Noh, S., 2001. Multinational corporations versus domestic corporations: a comparative study of R&D
investment activities. Journal of Multinational Financial Management, Volume 11, p. 89–104.
Bae, S. C., Park, B. J. C. & Wang, X., 2008. Multinationality, R&D Intensity, and Firm Performance: Evidence from U.S.
Manufacturing Firms. Multinational Business Review, 16(1), pp. 53 -77.
Balakrishnan, S. & Fox, I., 1993. Asset Specificity, Firm Heterogeneity and Capital Structure. Strategic Management Journal,
14(1), pp. 3-16.
Baldwin, J. R. & Johnson, J., 1996. Business strategies in more- and less-innovative firms in Canada. Research Policy, 25(5), pp.
785-804 .
Barney, J., 1991. Firm Resources and Sustained Competitive Advantage. Journal of Management, 17(1), pp. 99-120.
Baron, R. M. and D. A. Kenny, 1986. The moderator-mediator variable distinction in social psychological research:
Conceptual, strategic, and statistical considerations. Journal of Personality and Social Psychology, 51: 1173–1182.
Barr, P. S., Stimpert, J. L. & Huff, A. S., 1992. Cognitive change, strategic action, and organizational renewal. Strategic
Management Journal, 13(S1), pp. 15-36.
Bartoloni, E., 2013. Capital structure and innovation: causality and determinants. Empirica, 40(1), pp. 111 - 151.
Bettis, R. A. & Hitt, M. A., 1995. The New Competitive Landscape. Strategic Management Journal, Volume 16, pp. 7-19.
Biedenbach, T. & Müller, R., 2012. Absorptive, innovative and adaptive capabilities and their impact on project and project
portfolio performance. International Journal of Project Management, 30(5), pp. 621-635.
Black, F. & Scholes, M., 1973. The pricing of options and corporate liabilities. Journal of Political Economy, 81(3), p. 637 – 654.
Bloom, N. & Reenen, J. V., 2007. Measuring and explaining management practices across firms and countries. The Quarterly
Journal of Economics, 122(4), pp. 1351-1408.
Boeker, W., 1997. Strategic Change: The Influence of Managerial Characteristics and Organizational Growth. The Academy of
Management Journal, 40(1), pp. 152-170.
Booltink, L. W. & Saka-Helmhout, A., 2017. The effects of R&D intensity and internationalization on the performance of
non-high-tech SMEs. International Small Business Journal: Researching Entrepreneurship, 36(1), pp. 81-103.
Bourgeois III, L. J., 1980. Strategy and Environment: A Conceptual Integration. The Academy of Management Review, 5(1), pp.
25-39.
Bourgeois III, L. J., 1981. On the Measurement of Organizational Slack. The Academy of Management Review, 6(1), pp. 29-39.
Bourgeois, L. J. & Singh, J. V., 1983. Organizational Slack and Political Behavior Among Top Management Teams.. Academy
of Management Proceedings, Volume 1, pp. 43-47.
Bowman, C. & Ambrosini, V., 2000. Value Creation Versus Value Capture: Towards a Coherent Definition of Value in
Strategy. British Journal of Management, Volume 11, pp. 1-15.

80
Bowman, E. H. & Hurry, D., 1993. Strategy through the Option Lens: An Integrated View of Resource Investments and the
Incremental-Choice Process. The Academy of Management Review, 18(4), pp. 760-782.
Bowman, E. H., 1980. A Risk/Return Paradix for Strategic Management. Sloan Management Review, Volume 21, pp. 17-31.
Boyd, J., 1987. A discourse on winning and losing. s.l.:Maxwell Air Force Base, AL.
Brasila, V. C., Salernoa, M. S. & VasconcelosGomesb, L. A. d., 2018. Valuation of innovation projects with high uncertainty:
Reasons behind the search for real options. Journal of Emngineering and Technology Management, 49(1), pp. 109 - 122.
Brealey, R. & Myers, S., 1984. Principles of Corporate Finance. New York: McGraw-Hill..
Brockhoff, K., 2003. Exploring Strategic R&D Success Factors. Technology Analysis and Strategic Management , 15(3), pp. 333 -
348.
Bromiley, P., 1991. Testing a causal model of corporate risk taking and performance.. Academy of Management Journal, 34(1), pp.
37-59.
Bromiley, P., Rau, D. & Zhang, Y., 2017. Is R&D risky?. Strategic Management Journal, 38(4), pp. 876-891.
Brooks, C., 2014. Introductory Econometrics for Finance. 3rd ed. Cambridge: Cambridge University Press.
Brown, S. L. & Eisenhardt, K. M., 1995. Product Development: Past Research, Present Findings, and Future Directions. The
Academy of Management Review, 20(2), pp. 343-378.
Burgelman, R. A., 1983. A Process Model of Internal Corporate Venturing in the Diversified Major Firm. Administrative Science
Quarterly, 28(2), pp. 223-244.
Burgelman, R. A., 1983. Corporate Entrepreneurship and Strategic Management: Insights from a Process Study. Management
Science, 29(12), pp. 1349-1364.
Burgelman, R. A., 1991. Intraorganizational Ecology of Strategy Making and Organizational Adaptation: Theory and Field
Research. Organization Science, 2(3), pp. 239-321.
Chakravarthy, B. S., 1982. Adaptation: A Promising Metaphor for Strategic Management. The Academy of Management Review,
7(1), pp. 35-44.
Chan, S. H., Martin, J. D. & Kensinger, J. W., 1990. Corporate research and development expenditures and share value.
Journal of Financial Economics, 26(2), pp. 255 - 276.
Child, J., 1997. Strategic Choice in the Analysis of Action, Structure, Organizations and Environment: Retrospect and
Prospect. Organization Studies, 18(1), pp. 43-76.
Chirinko, B. & Singha, A. R., 2000. Testing static tradeoff against pecking order models of capital structure: a critical
comment. Journal of Financial Economics, 58(3), pp. 417-425.
Chirinko, B. & Singha, A. R., 2000. Testing static tradeoff against pecking order models of capital structure: a critical
comment. Journal of Financial Economics, 58(3), pp. 417-425.
Christensen, C. M., 1997. The Innovator's Dilemma: When New Technologies Cause Great Firms to Fail. Boston, MA: Harvard
University Press.
Christensen, J. F., 1995. Asset profiles for technological innovation. Research Policy, 24(5), pp. 727 - 745.
Cohen, W. M. & Levinthal, D. A., 1989. Innovation and Learning: The Two Faces of R & D. Oxford University Press, 99(397),
pp. 569 - 596.

81
Congden, S. W. & Schroeder, D. M., 1996. Competitive Strategy and the Adoption and Usage of Process Innovation. IJCM,
6(3 & 4 ), pp. 5 - 21.
Connolly, R. A. & Hirschey, M., 1984. R&D, Market Structure and Profits: A Value-Based Approach. The MIT Press, 66(4),
pp. 682-686.
Courtney, H., Kirkland, J. & Patrick, V., 1997. Strategy under uncertainty. Harvard Business Review, Issue November -
December, pp. 197-218.
Creswell, J. W., 2014. Research Design: Qualitative, Quantitatove and Mixed Methods Approaches. Fourth ed. s.l.:SAGE Publications.
Crossan, M. M. & Apaydin, M., 2010. A Multi-Dimensional Framework of Organizational Innovation: A Systematic Review
of the Literaturejoms_880. Journal of Management Studies, 47(6), pp. 1154 -1191.
Cyert, R. M. & March, J. G., 1963. Behavioral Theory of the Firm. Englewood Cliffs: NJ: Prentice-Hall.
Daghfous, A., 2004. Absorptive capacity and the implementation of knowledge-intensive best practices. Advanced Management
Journal, 69(2), p. 21.
Damanpour, F. & Wischnevskyb, J., 2006. Research on innovation in organizations: Distinguishing innovation-generating
from innovation-adopting organizations. Journal of Engineering and Technology, 23(4), pp. 269-291.
Damanpour, F., 1991. Organizational Innovation: A Meta-Analysis of Effects of Determinants and Moderators. The Academy
of Management Journal , 34(3), pp. 555-590.
Daniel, F., Lohrke, F. T., Fornaciari, C. J. & Jr., R. A. T., 2004. Slack resources and firm performance: a meta-analysis. Journal
of Business Research, 57(6), pp. 565 - 574.
Denzin, N. K. & Lincoln, Y. S., 2011. The SAGE handbook of qualitative research. 4 ed. London: SAGE Publications.
Desarbo, W. S., Benedetto, C. A. D., Song, M. & Sinha, I., 2005. Extending the Miles and Snow Strategic Framework:
Strategic Types, Capabilities, Environmental Uncertainty, and Firm Performance. Strategic Management Journal,
Volume 26, pp. 47-74.
Dodge, Y., 2008. The Concise Encyclopedia of Statistics. New York, NY: Springer.
Dunk, A. S. & Kilgore, A., 2001. Short-term R&D bias, competition on cost rather than innovation, and time to market.
Scandinavian Journal of Management, 17(4), pp. 409-420.
Eckhardt, J. T. & Shane, S. A., 2003. Opportunities and Entrepreneurship. Journal of Management, 29(3), p. 333_349.
Eisenhardt, K. M. & Bourgeois III, L. J., 1988. Politics of Strategic Decision Making in High-Velocity Environments: Toward
a Midrange Theory. The Academy of Management Journal, 31(4), pp. 727-770.
Eisenhardt, K. M. & Tabrizi, B. N., 1995. Accelerating Adaptive Processes: Product Innovation in the Global Computer
Industry. Administrative Science Quarterly, 40(1), pp. 84-110.
Elkins, T. & Keller, R. T., 2003. Leadership in research and development organizations: A literature review and conceptual
framework. The Leadership Quarterly, 14(4-5), pp. 587-606.
Erickson, G. & Jacobsen, R., 1992. Gaining Comparative Advantage Through Discretionary Expenditures: The Returns To
R&D and Advertising. Management Science, 38(9), pp. 1264 - 1279.
Erickson, G. & Jacobson, R., 1992. Gaining Comparative Advantage Through Discretionary Expenditures: The Returns to
R&D and Advertising. Management Science, 38(9), pp. 1264 - 1279.

82
Eunni, R. V., Post, J. E. & Berger, P. D., 2005. Adapt or adapt: lessons for strategy from the US telecoms industry. Journal of
General Management, 31(1), pp. 83-105.
Fama, E. F. & French, K. R., 2002. Testing Trade-Off and Pecking Order Predictions about Dividends and Debt. The Review
of Financial Studies, 15(1), pp. 1-33.
Fiegenbaum, A., 1990. Prospect theory and the risk-return association: An empirical examination in 85 industries. Journal of
Economic Behavior & Organization, 14(2), pp. 187-203.
Fishburn, P. C., 1977. Mean-Risk Analysis with Risk Associated with Below-Target Returns. American Economic Review, 67(2),
pp. 116-26.
Fitzsimmons, J., Fitzsimmons, M. & Bordoloi, S., 2013. Service Management: Operations, Strategy, Information Technology. 8th ed.
s.l.:McGraw-Hill Education.
Flamholtz, E. G. & Randle, Y., 2015. Growing Pains : Building Sustainably Successful Organizations. In: 5, ed. Chapter 6:
Strategic Planning. s.l.:John Wiley & Sons, pp. 117 -158.
Froot, K. A., Scharfstein, D. S. & Stein, J. C., 1994. A Framework for Risk Management. Journal of Applied Corporate Finance,
7(3), pp. 22-33.
Galbraith, J. R., 1974. Organization Design: An Information Processing View. Interfaces, 4(3), pp. 28-36.
Garrett, R. P. & Covin, J. G., 2007. A Model of Corporate Entrepreneurship as a Strategic Adaptation Mechanism. Advances in
Entrepreneurship, Firm Emergence and Growth, 10(1), pp. 9 - 31.
Gatignon, H., 2014. Testing Mediation and Moderation Effects. In: Statistical Analysis of Management Data. Boston, MA:
Springer, pp. 349 - 452.
Geiger, S. W. & Cashen, L. H., 2002. A Multidimensional Examination Of Slack And Its Impact On Inno. Journal of Managerial
Issues, XIV(1), pp. 68 - 84.
Geroski, P., Machin, S. & Van Reenen, J., 1993. The profitability of innovating firms. The RAND Journal of Economics, 24(2),
pp. 198-211.
Ghemawat, P. & Costa, J. E. I. R., 1993. The organizational tension between static and dynamic efficiency. Strategic
Management Journal, 14(S2), pp. 59-73.
Gilbert, C. & Bower, J. L., 2002. Disruptive Change: When Trying Harder Is Part of the Problem. Harvard Business Review,
80(5), pp. 94 - 101.
Graham, J. W., 2009. Missing data analysis: making it work in the real world. Annu Rev Psychol., Volume 60, pp. 549-576.
Graves, S. B., 1988. Institutional Ownership and Corporate R&D in the Computer Industry. The Academy of Management Journal
, 31(2), pp. 417-428.
Guba, E. G., 1990. The Paradigm Dialog. Newbury Park: Sage Publications.
Gujarati, D. N. & Porter, D. C., 2009. Basic Econometrics. Fifth ed. New York: McGraw-Hill.
Gupta, R. D., 2017. Risk-attitudes of the NSE 500 firms—Bowman’s paradox and prospect theory perspectives. IIMB
Management Review, Volume 29, pp. 76 - 89.
Hall, B. H. & Lerner, J., 2010. Chapter 14 - The Financing of R&D and Innovation. In: B. H. Hall & N. Rosenberg, eds.
Economics of innovation. s.l.:s.n., pp. 609 - 639.

83
Hallin, C. A., Andersen, T. J. & Ooi, C.-S., 2014. How Stakeholder Sensing and Anticipations Shape the Firm's Strategic Response
Capability. Spain, Madrid, s.n.
Hannan, M. T. & Freeman, J., 1997. The population ecology of organizations. American Journal of Sociology, Volume 82, pp.
929-964.
Haro-Dominguez, M. d. C., Arias-Aranda, D., Llorens-Montes, F. J. & Moreno, A. R., 2007. The impact of absorptive
capacity on technological acquisitions engineering consulting companies. Technovation, 27(1), pp. 417 - 425.
Hayes, A. F., 2013. Introduction to mediation, moderation, and conditional process analysis: A regression-based approach.. s.l.:Guilford
Press..
Helfat, C. E. & Winter, S. G., 2011. Untangling Dynamic and Operational Capabilities: Strategy for the (N)ever-Changing
World. Strategic Management Journal, 32(11), pp. 1243-1250.
Helfat, C. E., 1994. Firm-Specificity in Corporate Applied R&D. Organization Science, 5(2), pp. 173 - 184.
Hoffmann, V. H., Trautmann, T. & Hamprecht, J., 2009. Regulatory Uncertainty: A Reason to Postpone Investments? Not
Necessarily. Journal of Management Studies, 46(7), pp. 1227-1253.
Hulta, G. T. M., Hurleyb, R. F. & Knightc, G. A., 2004. Innovativeness: Its antecedents and impact on business performance.
Industrial Marketing Management, 33(5), pp. 429-438.
Iddris, F., 2016. Innovation Capability: A systeamtic Review and Research Agenda. Interdisciplinary Journal of Information,
Knowledge, and Management, Volume 11, pp. 235 - 260.
Ireland, R. D., Hitt, M. A. & Sirmon, D. G., 2003. A Model of Strategic Entrepreneurship: The Construct and its
Dimensions. Journal of Management , 29(6), pp. 963-989.
Jaeger, A. M. & Baliga, B. R., 1985. Control Systems and Strategic Adaptation: Lessons from the Japanese Experience. Strategic
Management Journal, 6(2), pp. 115 - 134.
Jaeger, A. M. & Baliga, B. R., 1985. Control systems and strategic adaptation: Lessons from the Japanese experience. Strategic
Management Journal, 6(2), pp. 115-134.
Jahanshahi, A. A. & Zhang, S. X., 2015. Chapter 7: Real Options Reasoning and Innovative Performance in the Context of
Dynamic Capabilities. In: É. V. Alexander Brem, ed. Adoption of Innovation - Balancing Internal and External Stakeholders
in the Marketing of Innovation. s.l.:Springer, Cham., pp. 181-196.
Jaruzelski, B., Chwalik, R. & Goehle, B., 2018. The Global Innovation 1000. s.l.:Tech & Innovation.
Jensen, M. C., 1986. Agency Costs of Free Cash Flow, Corporate Finance, and Takeovers. The American Economic Review, 76(2),
pp. 323 -329.
Kahneman, D. & Tversky, A., 1979. An Analysis of Decision under Risk. The Econometric Society, 47(2), pp. 263-291.
Kanter, R. M., 2004. The Middle Manager as Innovator. Harvard Business Review , 82(7-8), pp. 152-161.
Katila, R. & Shane, S., 2005. When does lack of resources make new firms innovative?. Academy of Management Journal, 48(5),
pp. 814-829.
Kerr, W. R. & Nanda, R., 2014. Financing Innovation. s.l.:National Bureau of Economic Research.
Kiesler, S. & Sproull, L., 1982. Managerial response to changing environments: Perspectives on problem sensing from social
cognition.. Administrative Science Quarterly, 27(4), pp. 548-570.

84
Kim, H. E. & Pennings, J. M., 2009. Innovation and Strategic Renewal in Mature Markets: A Study of the Tennis Racket
Industry. Organization Science, 20(2), pp. 368 - 383.
Kim, S. K., Cho, H. & Khieu, H., 2014. Slack and R&D Strategy: The Effect of Slack on Internal R&D and External R&D,
and Innovation. Journal of Management Policy and Practice, 15(2), pp. 33 - 42.
Kochhar, R. & David, P., 1996. Institutional Investors and Firm Innovation: A Test of Competing Hypotheses. Strategic
Management Journal , 17(1), pp. 73-84.
Kogut, B. & Kulatilaka, N., 2001. Capabilities as Real Options. Organization Science, 12(6), pp. 744-758.
Kotabe, M., Srinivasan, S. S. & Aulakh, P. S., 2002. Multinationality and Firm Performance: The Moderating Role of R&D
and Marketing Capabilities. Journal of International Business Studies, Volume 33, pp. 79-97.
Lant, T. K. & Mezia, S. J., 1992. An Organizational Learning Model of Convergence and Reorientation. Organization Science,
3(1), pp. 47-71.
Latham, S. & Braun, M., 2010. Does Short-termism Influence Firm Innovation? An Examination of S&P 500 Firms, 1990-
2003. Journal of Managerial Issue, 22(3), pp. 368-382.
Lee, C. & Wu, H., 2016. How do slack resources affect the relationship between R&D expenditures and firm performance?.
R&D Management , 46(S3), pp. 958- 978.
Lee, C.-L. & Wu, H.-C., 2016. How do slack resources affect the relationship between R&D expenditures and firm
performance?. R&D Management, 46(S3), pp. 958 - 978.
Lehner, J. M., 2000. Shifts of Reference Points for Framing of Strategic Decisions and Changing Risk- Return Associations.
Management Science, 46(1), pp. 63 - 76.
Lemmon, M. L. & Zender, J. F., 2010. Debt Capacity and Tests of Capital Structure Theories. The Journal of Financial and
Quantitative Analysis, 45(5), pp. 1161-1187.
Leonard-Barton, D., 1992. Core capabilities and core rigidities: A paradox in managing new product development. Strategic
Management Journal , 13(S1), pp. 111-125.
Lev, B. & Sougiannis, T., 1996. The capitalization, amortization, and value-relevance of R&D. Journal of Accounting and
Economics, Volume 21, pp. 107-138.
Levinthal, D. & March, J. G., 1982. A Model Of Adaptive Organozational Search. Journal of Economic Behavior and
Organization, Volume 2, pp. 307-333.
Linder, S. & Sax, J., 2020. Chapter 3: Fostering strategic responsiveness: The role of middle manager involvement and
strategic planning. In: T. J. Andersen, ed. Adapting to Enviornmental Challenges: New Research in Strategy and International
Business. Bingley, UK: Emeral Publishing, pp. 35-63.
Ling, S. et al., 2020. The Effects of Financing Channels on Enterprise Innovation and Life Cycle in Chinese A-Share Listed
Companies: An Empirical Analysis. Sustainability, 12(17), pp. 1-22.
Litschert, R. J. & Bonham, T., 1978. A Conceptual Model of Strategy Formation. Academy of Management Review, 3(2), pp. 211-
219.
Little, R. J. A. & Rubin, D. B., 2014. Chapter 4: Single Imputation Methods. In: Statistical Analysis with Missing Data. Hoboken,
NJ, USA: John Wiley & Sons, Incorporated, pp. 59-74.

85
Long, W. F. & Ravenscraft, D. J., 1993. LBOs, DEBT AND R&D INTENSITY. Strategic management Journal, 14(1), pp. 119 -
135.
Luehrman, T. A., 1998. Strategy as a Portfolio of Real Options. Harvard Business Review, 76(5), pp. 89-99.
Lynch, S. M. & Brown, J. S., 2011. Chapter 8 - Stratification and Inequality Over the Life Course. In: R. H. Binstock & L. K.
George, eds. Handbook of Aging and the Social Sciences. Seventh ed. s.l.:Academic Press, pp. 105-117.
Lynch, S. M., 2013. Statistical Inference. In: Using Statistics in Social Research: A Concise Approach. s.l.:Springer, pp. 83-105.
MacKinnon, D. O., 2008. Introduction to Statistical Mediation Analysis. 1st ed. s.l.:Taylor & Francis.
Mahnke, V., Venzin, M. & Zahra, S. A., 2007. Governing Entrepreneurial Opportunity Recognition in MNEs: Aligning
Interests and Cognition Under Uncertainty. Journal of Management Studies, 44(7), pp. 1278-1298.
Majumdar, S. K., 1997. The Impact of Size and Age on Firm-Level Performance: Some Evidence from India. Review of
Industrial Organization , 12(2), pp. 231 - 241.
Makkonen, H., Pohjola, M., Olkkonen, R. & Koponen, A., 2014. Dynamic capabilities and firm performance in a financial
crisis. Journal of Business Research, 67(1), pp. 2707 - 2719.
March, J. G., 1991. Exploration and Exploitation in Organizational Learning. Organization Science, 2(1), pp. 71-87.
Marshall, G. & Parra, Á., 2019. Innovation and competition: The role of the product market. International Journal of Industrial
Organization, 65(1), pp. 221 - 247.
McAlister, L. & Kim, R. S. a. M., n.d. Advertising, Research and Development, and Systematic Risk of the Firm.
McAlister, L., Srinivasan, R. & Kim, M., 2007. Advertising, Research and Development, and Systematic Risk of the Firm.
Journal of Marketing, 71(1), pp. 35-48.
McGrath, R. G. & Nerkar, A., 2004. Real Options Reasoning and a New Look at the R&D Investment Strategies of
Pharmaceutical Firms. Strategic Management Journal, Volume 25, pp. 1-21.
McGrath, R. G., 1997. A Real Options Logic for Initiating Technology Positioning Investments. The Academy of Management
Review, 22(4), pp. 974-996.
McKee, D. O., Varadarajan, P. R. & Pride, W. M., 1989. Strategic Adaptability and Firm Performance: A Market-Contingent
Perspective. Journal of Marketing, 53(3), pp. 21-35.
McKinsey & Company, 2020. Innovation in a crisis: Why it is more critical than ever, s.l.: s.n.
Miles, R. E., Snow, C. C., Meyer, A. D. & Henry J. Coleman, J., 1978. Organizational Strategy, Structure, and Process. The
Academy of Management Review, 3(3), pp. 546-562.
Miller, K. D. & Bromiley, P., 1990. Strategic Risk and Corporate Performance: An Analysis of Alternative Risk Measures. The
Academy of Management Journal, 33(4), pp. 756 - 779.
Miller, K. D. & Chen, W.-R., 2003. Risk and firms' costs. Sage Publications, Ltd., 1(4), pp. 355 - 382.
Miller, K. D. & Reuer, J. J., 1996. Measuring Organizational Downside Risk. Strategic Management Journal , 17(9), pp. 671-691.
Miller, K. D. & Waller, H. G., 2003. Scenarios, Real Options and Integrated Risk Management. Long Range Planning , 36(1), pp.
93-107.

86
Minton, B. A. & Schrand, C., 1999. The impact of cash flow volatility on discretionary investment and the costs of debt and
equity financing. Journal of Financial Economics, 54(3), pp. 423-460.
Mintzberg, H. & Waters, J. A., 1985. Of Strategies, Deliberate and Emergent. Strategic Management Journal, 6(3), pp. 257-272.
Moehrle, M. G. & Walter, L., 2008. Risk and uncertainty in R&D management. R&D Management , 38(5), pp. 449- 451.
Mohr, L. B., 1969. Determinants of Innovation in Organizations. American Political Science Review, 63(1), pp. 111-126.
Mone, M. A., McKinley, W. & Vincent L. Barker, I., 1998. Organizational Decline and Innovation: A Contingency
Framework. The Academy of Management Review, 23(1), pp. 115-132.
Mone, M. A., McKinley, W. & Vincent L. Barker, I., 1998. Organizational Decline and Innovation: A Contingency
Framework. The Academy of Management Review , 23(1), pp. 115-132.
Murphy, G. B., Trailer, J. W. & Hill, R. C., 1996. Measuring performance in entrepreneurship research. Journal of Business
Research, 36(1), pp. 15-23.
Myers, S. C. & Majluf, N. S., 1984. Corporate Financing And Investment Decisions When Firms Have Information That
Investors Do Not Have. Journal of Financial Economics, 13(2), pp. 187 - 221.
Myers, S. C., 1997. Determinants of Corporate Borrowing. Journal of Financial Economics , 5(2), pp. 147-175.
National Science Board, 2006. Chapter 5. Academic Research and Development, Glossary. In: Science and engineering indicators.
s.l.:s.n.
Nelson, J., 2016. Chapter 4 - Build–Measure–Learn as an OODA Loop. In: Becoming a Lean Library. s.l.:Elsevier, pp. 51-61.
Nohria, N. & Gulati, R., 1996. Is Slack Good or Bad for Innovation?. The Academy of Management Journal, 39(5), pp. 1245 -
1264.
O'Brien, J. P., 2003. The Capital Structure Implications of Pursuing a Strategy of Innovation. Strategic Management Journal,
24(5), pp. 415-431.
Oktemgil, M. & Greenley, G., 1997. Consequences of high and low adaptive capability in UK companies. European Journal of
Marketing, 31(7), pp. 445-466.
Oriani, R. & Sobrero, M., 2008. Uncertainty and the Market Valuation of R&D within a Real Options Logic. Strategic
Management Journal, 29(4), pp. 343-361.
Ozsomer, A., Calantone, R. J. & Benedetto, A. D., 1997. What makes firms more innovative? A look at organizational and
environmental factors. Journal of Business & Industrial Marketing, 12(6), pp. 400-416.
Penrose, E., 1959. The Theory of the Growth of the Firm. s.l.:Basil Blackwell, Oxford.
Porter, M. E., 1979. How Competitive Forces Shape Strategy. Harvard Business review, 57(2), pp. 137-145.
Porter, M. E., 1985. Competitive Advantage - Creating and Sustaining Superior Perfromance. 1st ed. New York: The Free Press.
Porter, M. E., 1991. Towards a Dynamic Theory of Strategy. Strategic Management Journal, 12(8), pp. 95-107.
Prajogo, D., 2016. The strategic fit between innovation strategies and business environment in delivering business
performance. Internaltion Journal of Production Economics, 171(2), pp. 241-249.
Ravenscraft, D. & Scherer, F. M., 1982. The lag structure of returns to research and development. Applied Economics, 14(6), pp.
603 - 620.

87
Reeves, M. & Deimler, M., 2012. Chapter 2: Adaptability: The New Competitive Advantage. In: M. Deimler, R. Lesser, D.
Rhodes & J. Sinha, eds. Own the Future: 50 Ways to Win from the Boston Consulting Group. s.l.:The Boston Consulting
Group, Inc., pp. 19-26.
Reuer, J. J. & Lieblein, M. J., 2000. “Downside risk implications of multinationality and international joint ventures. Academy of
Management Journal, Volume 43, pp. 203-214.
Roberts, E. B., 1988. Managing Invention and Innovation. Research Technology Management , 31(1), pp. 11- 29.
Rosenberg, N., 1995. Why Technology Forecasts Often Fail. The Futurist, Volume July-August, pp. 17-21.
Ruefli, T. W. & Wiggins, R. R., 2003. Industry, corporate, and segment effects and business performance: A non-parametric
approach. Strategic Management Journal, Volume 24, pp. 861-879.
Saemundsson, R. J. & Candi, M., 2017. Absorptive capacity and the identification of opportunities in new technology-based
firms. Technovation, 64 - 65(1), pp. 43 - 49.
Santacruz, L., 2020. Measures of firm risk-taking: revisiting Bowman’s paradox. Managerial Finance, 46(3), pp. 421 - 434.
Saunders, M. N. K., Lewis, P. & Thornhill, A., 2016. Research methods for business students. 7. ed. ed. s.l.: Pearson Education UK.
Saunders, M. N. K., Thornhill, A. & Lewis, D. P., 2019. Research Methods for business Students. 8th ed. New York: Pearson
Education Limited .
Scherer, F. M., 1998. The Size Distribution of Profits from Innovation. Annales d'Économie et de Statistique, Issue 49/50, pp.
495-516.
Scherer, F. M., Harhoff, D. & Kukies, J., 2000. Uncertainty and the size distribution of rewards from innovation. Journal of
Evolutionary Economics, 10(1), pp. 175-200.
Schilke, O., 2014. On The Contingent Value Of Dynamic Capabilities Fof Competitive Advantage: The Nonlineat
Moderating Effect Of Enviornmental Dynamism. Strategic Management Journal, Volume 35, pp. 179-203.
Schilling, M. A., 2019. Strategic Management of Technological Innovation. 6th ed. New York, NY: McGraw-Hill Education.
Schindehutte, M. & Morris, M. H., 2001. Understanding Strategic Adaptation in Small Firms. International Journal of
Entrepreneurial , 7(3), pp. 84-107.
Schoemaker, P. J. H., Heaton, S. & Teece, D., 2018. Innovation, Dynamic Capabilities, and Leadership. California Management
Review, 61(1), pp. 15-42.
Shapiro, A. C. & Titman, S., 1986. An Integrated approaches to corporate risk management. In: J. Stern & D. Chew, eds. The
Revolution in Corporate Finance. Boston: Blackwell.
Sharfman, M. P., Wolf, G., Chase, R. B. & Tansik, D. A., 1988. Antecedents of Organizational Slack. The Academy of
Management Review, 13(4), pp. 601-614.
Simerly, R. L. & Li, M., 2000. Environmental dynamism, capital structure and performance: a theoretical integration and an
empirical test. Strategic Management Journal, 21(1), pp. 31-49.
Singh, J. V., 1986. Performance, Slack, and Risk Taking in Organizational Decision Making. The Academy of Management Journal,
29(3), pp. 562-585.
Snow, C. C. & Hrebiniak, L. G., 1980. Strategy, Distinctive Competence, and Organizational Performance. Administrative
Science Quarterly, 25(2), pp. 317-336.

88
Sougiannis, T., 1994. The Accounting Based Valuation of Corporate R&D. The Accounting Review, 69(1), pp. 44 - 68.
Teece, D. J., 1986. Profiting from technological innovation: Implications for integration, collaboration, licensing and public
policy. Research Policy, 15(6), pp. 285 - 305.
Teece, D. J., Pisano, G. & Shuen, A., 1997. Dynamic Capabilities and Strategic Management. Strategic Management Journal,
18(7), pp. 509-533.
The R Foundation, 2020. The R Project for Statistical Computing. [Online]
Available at: https://www.r-project.org
Thomas, L. G. & D'Aveni, R. A., 2009. The Changing Nature of Competition in the US Manufacturing Sector, 1950-2002.
Strategic Organization , 7(4), pp. 387-431.
Thomas, L. G. & D'Aveni, R., 2009. The changing nature of competition in the US manufacturing sector, 1950–2002. Strategic
Organization, 7(4), pp. 387 - 431.
Tidd, J., Bessant, J. & Pavitt, K., 2001. Managing Innovation: Integrating Technological, Market, and Organizational Change. New York:
John Wiley & Sons.
Tong, T. W. & Reuer, J. J., 2007. Real Options in Strategic Management. Advances in Strategic Management, Volume 24, pp. 3 -
28.
Trigeorgis, L. & Reuer, J. J., 2017. Real options in Strategic Management. Strategic Management Journal, 38(1), pp. 42-63.
Trigeorgis, L. & Reuer, J. J., 2017. REAL OPTIONS THEORY IN STRATEGIC MANAGEMENT. Strategic Management
Journal, 38(1), pp. 42-63.
Tripsas, M. & Gavetti, G., 2000. Capabilities, Cognition, and Inertia: Evidence from Digital Imaging. Strategic Management
Journal, 21(10/11), pp. 1147 - 1161.
U.S. Securities and Exchange Comission, 2020. Division of Corporation Finance: Standard Industrial Classification (SIC) Code List.
[Online]
Available at: https://www.sec.gov/info/edgar/siccodes.htm
U.S. Securities and Exchange Commission, 2001. Division of Corporation Finance: Frequently Requested Accounting and Financial
Reporting Interpretations and Guidance. [Online]
Available at: https://www.sec.gov/divisions/corpfin/guidance/cfactfaq.htm
[Accessed 7 12 2020].
UNIDO, 2016. Classification of manufacturing sectors by technological intensity (ISIC Revision 4). [Online]
Available at: https://stat.unido.org/content/focus/classification-of-manufacturing-sectors-by-technological-
intensity-%2528isic-revision-4%2529;jsessionid=561400724511B33A01F1C32CEA4300FB
[Accessed 29 10 2020].
Uzkurt, C., Kumar, R., Kimzan, H. S. & Sert, H., 2012. The Impact Of Enviornmental Uncertainty Dimensions On
Organizational Innovativeness: An Empirical Study on SME's. International Journal of Innovation Management, 16(2).
van Bekkum, S., Pennings, E. & Smit, H., 2009. A real options perspective on R&D portfolio diversification. Research Policy,
38(7), pp. 1150-1158.
van Buuren, S., 2012. Flexible Imputation of Missing Data. 2nd ed. New York: Chapman & Hall/CRC.

89
Van der Vegt, G. v. d., Gerard, G. & Peter, E., 2015. Managing Risk and Resilience. The Academy of Management Journal, 58(4),
pp. 971-980.
Ven, A. H. V. d., 1986. Central Problems in the Management of Innovation. Management Science, 32(5), pp. 590-607.
Vicente-Lorente, J., 2001. Specificity and opacity as resource-based determinants of capital structure: evidence for Spanish
manufacturing firms. Strategic Management Journal, Volume 22, pp. 157-171.
Volberda, H. & Lewin, A., 2003. Co-evolutionary dynamics within and between firms: From evolution to co-evolution.
Journal of Management Studies, Volume 40, p. 2111–2136.
Volberda, H. W., 1996. Toward the Flexible Form: How to Remain Vital in Hypercompetitive Environments. Organization
Science, 7(4), pp. 359-374.
Wang, C. L., Senaratne, C. & Rafiq, M., 2015. Success Traps, Dynamic Capabilities and Firm Performance. British Journal of
Management, Volume 26, pp. 26-44.
Wang, H., Barney, J. B. & Reuer, J. J., 2003. Stimulating Firm-specific Investment through Risk Management. Long Range
Planning, 36(1), pp. 49-59.
Wang, H., Liang, P., Li, H. & Yang, R., 2016. Financing Sources, R&D Investment and Enterprise Risk. Procedia Computer
Science, Volume 91, p. 122 – 130.
Wang, S., Guidice, R. M., Tansky, J. W. & Wang, Z., 2010. When R&D spending is not enough: The critical role of culture
when you really want to innovate. Human Resource Management, 49(4), pp. 767-792.
Wang, T. & Thornhill, S., 2010. R&D investment and financing choices: A comprehensive perspective. Research Policy , 39(9),
pp. 1148 - 1159.
Williamson, O. E., 1979. Transaction-Cost Economics: The Governance of Contractual Relations. Journal of Law and
Economics, 22(2), pp. 233-261.
Williamson, O. E., 1988. Corporate Governance. The Journal of Finance, 43(3), pp. 567-591.
Winter, S. G., 2003. Understanding dynamic capabilities. Strategic Management Journal , 24(10), pp. 991-995.
Wolfe, R. M., 2020. Business Enterprise Research and Development Survey (BERD), s.l.: National Center for Science and Engineering
Statistics.
Wooldridge, J. M., 2012. Introductory Econometrics: A Modern Approach. 5th ed. Mason, Ohio: South-Western Cengage Learning.
World Economic Forum, 2020. The Global Risks Report 2020, s.l.: s.n.
World Health Organization, 2020. Coronavirus disease (COVID-19) pandemic. [Online]
Available at: https://www.who.int/emergencies/diseases/novel-coronavirus-2019
[Accessed 1 9 2020].
Wu, S., Levitas, E. & Priem, R. L., 2005. CEO Tenure and Company Invention under Differing Levels of Technological
Dynamism. The Academy of Management Journal , 48(5), pp. 859-873.
Yasai-Ardekani, M., 1986. Structural adaptations to environments. The Academy of Management Review, 11(1), pp. 9-21.
Zhang, Z., 2015. Missing data imputation: focusing on single imputation. Ann Transl Med., 4(1), pp. 1 - 13.

90
Zhou, S. S., Zhou, A. J., Feng, J. & Jiang, S., 2019. Dynamic capabilities and organizational performance: The mediating role
of innovation. Journal of Management & Organization , 25(5), pp. 731 - 747.

91
APPENDICES
A) Technology Intensity Allocations
B) Standardization Methodology
C) Industry Allocations
D) Moving Average Methodology
E) Number of Missing Values Imputed
F) Distribution of Non-Control Variables
G) Cooks D Methodology
H) Q-Q Plots Mediation
I) Q-Q Plots Moderation
J) Results Heteroskedacity and Multicollinearity - Moderation
K) Results Heteroskedacity and Multicollinearity - Mediation
L) RESET Results
M) Regression Results Full Models - Moderation
N) Regression Results Full Models Mediation
O) Regression Results Without Outliers - Mediation
P) Regression Results Moderations – Identical Observations
Q) Control Variables: Expected Versus Encountered Sign – Mediation
R) New Mediator Model Regression Results – With Outliers
S) New Mediator Regression Results – Without Outliers

92
A) TECHNOLOGY INTENSITY ALLOCATIONS
Technology Intensity Broad Sic Codes Special Sic Code Cases
Medium/High Technology 20, 21, 22, 23, 24, 25, 26, 27, 31, 34
No special cases
Medium Technology
29,30,33,32,39 3731,3732
Low Technology 35,28,37 3728,3721,3724, 3761, 3769,
3764, 3433,3812, 2834, 3483,
3482, 3761, 3795, 3519, 3391,
3577, 3572, 3575, 3571
B) STANDARDIZATION METHODOLOGY
A standardized variable is created by deducting the industry mean for the given variable and year from the
unstandardized variable and dividing by the industry standard deviation for the given variable and year.
This can be captured by the following equation:
! = # − %'
Where,
Z = standardized variable
x = is the observed value
" = mean of the sample
# = standard deviation.

93
C) INDUSTRY ALLOCATIONS
Industry Grouping Sic Code Composition Formal Industry Name
Food Related Products 20, 21 Food & Kindred Products; Tobacco Products
Textile Industry 22, 23, 31 Textile Mill Products; Apparel & Other
Textile Products; Leather & Leather Products
Forestry Related 24, 26, 27 Lumber & Wood Products; Paper & Allied Products; Printing & Publishing;
Raw Materials 29, 32, 33 Petroleum & Coal Products; Stone, Clay & Glass Products; Primary Metal Industries
Industrial Machinery & Equipment 35 Industrial Machinery & Equipment
Chemical & Allied Products 28 Chemical & Allied Products
Transportation Equipment 37 Transportation Equipment
Electronic & Other Electric Equipment 36 Electronic & Other Electric Equipment
Instruments & Related Products 38 Instruments & Related Products
Fabricated Metal Products 34 Fabricated Metal Products
Miscellaneous 25, 30, 39 Furniture & Fixtures; Rubber & Miscellaneous Products; Miscellaneous Manufacturing Industries

94
D) MOVING AVERAGE METHODOLOGY
The Moving Average is calculated based on the following calculation:
(! = (" + (#2
Here, (! represents the missing middle observation between two values, which are non-missing. If (! is
missing, the observation before the middle observation (", and the observation after the middle
observation, (# will be added and divided by two.
Assuming this relationship to be true, the formula can also be rearranged to impute ending values, by
rearranging the formula in the following way:
2(! − (" = (#
2(! − (# = ("
Thus, the beginning value of the time series, (" or the ending value, (# is missing, while the middle value,
(! is non missing.

95
E) NUMBER OF MISSING VALUES IMPUTED
Variables # Missing
2010-2014 # Missing 2015-2019
Imputation Method
Total Assets 18 11 Moving Average
Common Equity 18 11 Moving Average
Common Shares Outstanding 38 40 Moving Average
Total Debt 34 32 Moving Average
Total Liabilities 22 19 Moving Average
Retained Earning 34 36 Moving Average
Net Income 19 13 Moving Average
Revenue 19 12 Moving Average
Price per Share 75 69 Moving Average
Selling, General and Administrative 33 35 Moving Average
Advertising 3010 2652 Moving Average + 0 for exclusive missing
Research and Development 105 75 Moving Average
Earnings before interest and taxes 19 13 Moving Average
Working Capital 23 16 Moving Average

96
F) COOKS DISTANCE METHODOLOGY
Cook’s distance is a common measurement for data point’s influence or identification of outliers in least-
squares regression analysis, which measures the leverage and residuals of an observation. Hereby, a
measure that has high leverage it is typically an extreme high or low point stemming from one or more of
the independent variables. From a technical standpoint, Cook’s D is calculated by removing the ith data
point from the specified model and thereinafter recalculating the regression. This is done based on the
following Formula:
where,
yj — the jth fitted response value.
yj(i) — the jth fitted response value, where the fit does not include observation i
p — the number of regression coefficients
σ — the estimated variance from the fit, based on all observations, i.e. Mean Squared Error

97
G) DISTRIBUTION GRAPHS

98

99
H) QQ PLOTS MODERATION

100

101

102
I) QQ PLOTS MEDIATION

103

104

105
J) HETEROSKEDACTIY AND MULTICOLLIENARITY: MODERATION MODEL
TIME PERIOD: 2010-2014
Dependent Variable # Outliers Excluded Maximum VIF White Test ROA 0 2.44 1.24e-45 ROA 63 1.55 0.00000000278
TQ 0 2.44 1.34e-13 TQ 55 1.53 0.0000234
Downside Risk 0 2.44 0.0000165 Downside Risk 49 1.56 0.996
Bankruptcy Risk 0 2.44 0.0322 Bankruptcy Risk 47 1.53 0.000000849
TIME PERIOD: 2015-2019
Dependent Variable # Outliers Excluded Maximum VIF White Test ROA 0 4.19 6.68e-64 ROA 55 1.86 0.000000130
TQ 0 4.19 1.10e-12 TQ 38 3.15 0.000494
Downside Risk 0 4.19 0.0262 Downside Risk 38 2.43 0.982
Bankruptcy Risk 0 4.19 0.000000119 Bankruptcy Risk 36 1.88 0.000000538
K) HETEROSKEDACTIY AND MULTICOLLIENARITY: MEDIATION MODEL
TIME PERIOD: 2010-2014
Dependent Variable # Outliers Excluded Maximum VIF White Test ROA 0 1.54 1.16e-32 ROA 63 1.54 6.71e-12
TQ 0 1.54 1.34e-13 TQ 55 1.52 0.00702
Downside Risk 0 1.54 0.0895 Downside Risk 49 1.54 0.0765
Bankruptcy Risk 0 1.54 0.0959 Bankruptcy Risk 29 1.58 0.122
TIME PERIOD: 2015-2019
Dependent Variable # Outliers Excluded Maximum VIF White Test ROA 0 2.12 3.11e-38 ROA 55 2.13 3.55e-13
TQ 0 2.12 8.32e-13 TQ 38 2.27 3.29e-10
Downside Risk 0 1.18 0.206 Downside Risk 7 1.54 0.801
Bankruptcy Risk 0 2.12 0.459 Bankruptcy Risk 36 1.54 8.83e-18

106
L) RESET RESULTS
Model14 Dependent Variable Outliers Excl. RESET Outliers Excl. RESET
1 ROA 0 3.075e-12 0 < 2.2e-16
1 ROA 63 1.246e-13 55 7.207e-10
2 ROA 0 2.758e-12 0 < 2.2e-16
2 ROA 63 5.554e-13 55 4.504e-10
1 TQ 0 < 2.2e-16 0 1.003e-10
1 TQ 55 8.563e-09 38 0.0002108
2 TQ 0 < 2.2e-16 0 4.683e-09
2 TQ 55 0.0003123 38 0.0003123
1 TLRR 0 0.04655 0 4.002e-05
1 TLRR 49 0.0001599 7 0.009626
2 TLRR 0 0.03405 0 0.0002914
2 TLRR 38 0.004596 7 0.000698
1 Alt Z 0 1.182e-06 0 4.36e-08
1 Alt Z 29 < 2.2e-16 36 2.054e-13
2 Alt Z 0 2.394e-07 0 2.394e-07
2 Alt Z 47 < 2.2e-16 36 < 2.2e-16
14 Moderation Models

107
M) MEDIATION MODELS WITH OUTLIERS
MEDIATION ANALYSIS WITH OUTLIERS; TOBIN’S Q AND RETURN ON ASSETS, 2010-2014
Time Period 2010 - 2014
Model 1 Model 2 Model 3 Model 4
Accounting Based Market Based Accounting Based Market Based Mediator Mediator Accounting Bases Market Based
ROA TQ ROA TQ R&D Organizational Slack ROA TQ
Coef RSE Coef RSE Coef RSE Coef RSE Coef RSE Coef RSE Coef RSE Coef RSE
Intercept -1.268*** 0.165 0.055 0.140 -0.785*** 0.138 -0.479*** 0.139 0.323* 0.140 1.158*** 0.133 -0.744*** 0.141 -0.346** 0.136
Strategic Response Capabilities 0.063+ 0.033 0.288*** 0.045 n/a n/a n/a n/a -0.001 0.02653 0.0004 0.030 0.084** 0.030 0.273*** 0.041
Research and Development n/a n/a n/a n/a -0.082 0.063 0.035 0.050 n/a n/a n/a n/a -0.084 0.064 0.027 0.047
Organizational Slack n/a n/a n/a n/a -0.429*** 0.048 0.366*** 0.056 n/a n/a n/a n/a -0.433*** 0.048 0.354*** 0.056
Firm Size 0.185*** 0.019 -0.002 0.014 0.119*** 0.014 0.070*** 0.015 -0.045** 0.015 -0.145*** 0.014 0.114*** 0.014 0.053*** 0.015
Capital Intensity -0.215*** 0.037 -0.040 0.036 -0.055+ 0.032 -0.160*** 0.037 0.339*** 0.040 0.349*** 0.040 -0.055+ 0.032 -0.160*** 0.036
Financial Leverage -0.186*** 0.031 0.023 0.030 -0.211*** 0.027 0.032 0.031 -0.156*** 0.034 -0.079* 0.031 -0.208*** 0.028 0.041 0.029
Advertising Intensity -0.083+ 0.043 -0.018 0.058 -0.013 0.032 -0.073 0.045 0.063+ 0.035 0.112 0.072 -0.013 0.032 -0.072 0.044
Advertising Dummy -0.260*** 0.062 -0.103 0.075 -0.240*** 0.054 -0.075 0.068 -0.008 0.066 -0.178* 0.076 -0.25*** 0.054 -0.108 0.066
High Tech Industry 0.192* 0.081 0.015 0.087 0.135 0.086 0.061 0.083 -0.024 0.085 -0.096 0.084 0.135 0.085 0.033 0.121
Medium Tech Industry 0.105 0.128 0.020 0.129 0.083 0.131 0.015 0.126 0.018 0.133 -0.023 0.122 0.089 0.129 0.059 0.080
N 1052 1052 1052 1052 1052 1052 1052 1052
Multiple R2 0.1931 0.08463 0.3544 0.1149 0.1468 0.2515 0.3613 0.1876
Adjusted R2 0.1869 0.07761 0.3488 0.1073 0.1402 0.2458 0.3552 0.1798
F Significance < 2.2e-16 < 2.2e-16 < 2.2e-16 < 2.2e-16 < 2.2e-16 < 2.2e-16 2.2e-16 2.2e-16
Notes: +p > 0.1; *p>0.05; **p>0.01; ***p> 0.0001
RSE: Robust Standard Errors

108
MEDIATION ANALYSIS WITH OUTLIERS; TOBIN’S Q AND RETURN ON ASSETS, 2015-2019
Time Period 2015 - 2019
Model 1 Model 2 Model 3 Model 4
Accounting Based Market Based Accounting Based Market Based Mediator Mediator Accounting Based Market Based
ROA TQ ROA TQ R&D Organizational Slack ROA TQ
Coef RSE Coef RSE Coef RSE Coef RSE Coef RSE Coef RSE Coef RSE Coef RSE
Intercept -1.402*** 0.163 -0.064 0.141 -0.904*** 0.149 -0.466** 0.149 0.372* 0.167 1.391*** 0.132 -0.900*** 0.149 -0.435** 0.142
Strategic Response Capabilities -0.021 0.044 0.340*** 0.034 n/a n/a n/a n/a 0.111*** 0.031 0.075* 0.031 0.040 0.036 0.289*** 0.036
Research and Development n/a n/a n/a n/a -0.094 0.063 0.176** 0.054 n/a n/a n/a n/a -0.099 0.063 0.142** 0.050
Organizational Slack n/a n/a n/a n/a -0.339*** 0.075 0.250*** 0.068 n/a n/a n/a n/a -0.344*** 0.074 0.214*** 0.064
Firm Size 0.195*** 0.017 0.011 0.015 0.131*** 0.016 0.062*** 0.016 -0.053** 0.017 -0.164*** 0.013 0.131*** 0.016 0.058*** 0.015
Capital Intensity -0.239*** 0.045 -0.102** 0.035 -0.053 0.047 -0.245*** 0.035 0.275*** 0.049 0.408*** 0.038 -0.053 0.047 -0.244*** 0.035
Financial Leverage -0.147*** 0.035 -0.028 0.034 -0.172*** 0.037 -0.011 0.034 -0.069 0.049 -0.087** 0.031 -0.172*** 0.037 -0.012 0.033
Advertising Intensity -0.090+ 0.052 0.057 0.041 -0.035 0.042 0.012 0.050 0.030 0.037 0.041 0.215 -0.034 0.042 0.020 0.046
Advertising Dummy -0.160+ 0.071 -0.125+ 0.072 -0.195** 0.064 -0.084 0.075 -0.024 0.072 -0.365*** 0.056 -0.197** 0.063 -0.103 0.072
High Tech Industry 0.149 0.092 0.060 0.088 0.108 0.100 0.083 0.087 0.008 0.099 -0.047 0.091 0.110 0.099 0.091 0.082
Medium Tech Industry 0.003 0.136 0.107 0.136 0.001 0.144 0.084 0.132 0.109 0.143 0.081 0.123 0.005 0.143 0.108 0.129
N 913 913 913 913 913 913 913 913
Multiple R2 0.2062 0.1297 0.3153 0.1196 0.103 0.3286 0.3169 0.1995
Adjusted R2 0.1992 0.122 0.3085 0.1108 0.09504 0.3226 0.3093 0.1907
F Significance < 2.2e-16 < 2.2e-16 < 2.2e-16 < 2.2e-16 < 2.2e-16 < 2.2e-16 2.2e-16 2.2e-16
Notes: +p > 0.1; *p>0.05; **p>0.01; ***p> 0.0001
RSE: Robust Standard Errors

109
MEDIATION ANALYSIS WITH OUTLIERS; ALTMAN Z AND TARGET LEVEL RISK RATIO, 2010-2014
Time Period 2010 - 2014
Model 1 Model 2 Model 3 Model 4
Downside Risk Bankruptcy Risk Downside Risk Bankruptcy Risk Mediator Mediator Downside Risk Bankruptcy Risk
Target Level Risk Ratio Altman Z Target Level Risk Ratio Altman Z R&D Organizational Slack Target Level Risk Ratio
Altman Z
Coef RSE Coef RSE Coef SE Coef SE Coef RSE Coef RSE Coef SE Coef SE
Intercept -0.180 0.113 3.876*** 0.733 -0.068 0.116 4.362*** 0.868 0.323* 0.140 1.158*** 0.133 0.089 0.107 5.015*** 0.852
Strategic Response Capabilities 0.309*** 0.027 1.280*** 0.377 n/a n/a n/a n/a -0.001 0.02653 0.0004 0.030 0.320*** 0.023 1.331*** 0.182
Research and Development n/a n/a n/a n/a -0.065* 0.027 -0.594** 0.200 n/a n/a n/a n/a -0.074** 0.025 -0.632** 0.196
Organizational Slack n/a n/a n/a n/a -0.189*** 0.029 -0.605** 0.215 n/a n/a n/a n/a -0.203*** 0.026 -0.664** 0.210
Firm Size 0.183*** 0.012 0.077 0.094 0.166*** 0.013 0.002 0.095 -0.045** 0.015 -0.145*** 0.014 0.146*** 0.012 -0.081 0.093
Capital Intensity -0.101*** 0.026 0.414 0.315 -0.018 0.027 0.784*** 0.201 0.339*** 0.040 0.349*** 0.040 -0.018 0.025 0.783*** 0.196
Financial Leverage 0.037 0.024 -1.739*** 0.172 0.015 0.027 -1.817*** 0.203 -0.156*** 0.034 -0.079* 0.031 0.026 0.025 -1.771*** 0.198
Advertising Intensity -0.037 0.025 -0.307+ 0.165 -0.002 0.028 -0.164 0.208 0.063+ 0.035 0.112 0.072 -0.001 0.025 -0.161 .203
Advertising Dummy -0.046 0.052 -1.039* 0.409 0.001 0.056 -0.810+ 0.419 -0.008 0.066 -0.178* 0.076 -0.037 0.051 -0.971* 0.410
High Tech Industry 0.374*** 0.071 0.708* .317 0.347*** 0.074 0.590 0.553 -0.024 0.085 -0.096 0.084 0.344*** 0.068 0.578 0.540
Medium Tech Industry -0.261* 0.105 0.446 0.520 -0.290** 0.109 0.328 .817 0.018 0.133 -0.023 0.122 -0.269** 0.100 0.414 0.797
N 1052 1052 1052 1052 1052 1052 1052 1052
Multiple R2 0.3679 0.1196 0.3053 0.09789 0.1468 0.2515 0.4162 0.1421
Adjusted R2 0.363 0.1128 0.2993 0.0901 0.1402 0.2458 0.4106 0.1339
F Significance < 2.2e-16 < 2.2e-16 < 2.2e-16 < 2.2e-16 < 2.2e-16 < 2.2e-16 < 2.2e-16 < 2.2e-16
Notes: +p > 0.1; *p>0.05; **p>0.01; ***p> 0.0001
RSE: Robust Standard Errors

110
MEDIATION ANALYSIS WITH OUTLIERS; ALTMAN Z AND TARGET LEVEL RISK RATIO, 2010-2014 & 2015-2019
Time Period 2015 - 2019
Model 1 Model 2 Model 3 Model 4
Downside Risk Bankruptcy Risk Downside Risk Bankruptcy Risk Mediator Mediator Downside Risk Bankruptcy Risk
Target Level Ratio Altman Z Target Level Ratio Altman Z R&D Organizational Slack Target Level Ratio Altman Z
Coef RSE Coef RSE Coef SE Coef SE Coef RSE Coef RSE Coef SE Coef SE
Intercept -0.303** 0.114 3.761** 1.333 0.020 0.128 4.928*** 1.418 0.372* 0.167 1.391*** 0.132 0.054 0.117 5.068*** 1.405
Strategic Response Capabilities 0.279*** 0.032 1.188*** 0.295 n/a n/a n/a n/a 0.111*** 0.031 0.075* 0.031 0.323*** 0.025 1.312*** 0.300
Research and Development n/a n/a n/a n/a -0.041 0.034 0.322 0.376 n/a n/a n/a n/a -0.079* 0.031 0.166 0.374
Organizational Slack n/a n/a n/a n/a -0.199*** 0.039 -0.977* 0.429 n/a n/a n/a n/a -0.239*** 0.036 -1.140** 0.426
Firm Size 0.181*** 0.012 0.104 0.139 0.140*** 0.014 -0.042 0.151 -0.053** 0.017 -0.164*** 0.013 0.135*** 0.013 -0.061 0.150
Capital Intensity -0.162*** 0.032 0.257 0.304 -0.029 0.031 0.713* 0.349 0.275*** 0.049 0.408*** 0.038 -0.029 .029 0.716* 0.345
Financial Leverage 0.024 0.027 -2.351*** 0.322 0.007 0.029 -2.426*** 0.326 -0.069 0.049 -0.087** 0.031 0.006 0.027 -2.428*** 0.322
Advertising Intensity -0.068 0.045 -0.055 0.060 -0.038 0.029 -0.462 0.327 0.030 0.037 0.041 0.215 0.029 0.027 -0.426 0.324
Advertising Dummy -0.065 0.062 -0.591+ 0.320 -0.069 0.060 -0.883 0.664 -0.024 0.072 -0.365*** 0.056 -0.091+ 0.055 -0.970 0.657
High Tech Industry 0.241** 0.074 0.857 0.877 0.203* 0.080 0.727 0.884 0.008 0.099 -0.047 0.091 0.213** 0.073 0.765 0.875
Medium Tech Industry -0.109 0.110 -0.669 1.295 -0.135 0.117 -0.759 1.303 0.109 0.143 0.081 0.123 -0.108 0.108 -0.650 1.290
N 913 913 913 913 913 913 913 913
Multiple R2 0.305 0.08334 0.2553 0.072 0.103 0.3286 0.092 0.09749
Adjusted R2 0.2988 0.07523 0.2479 0.063 0.09504 0.3226 0.082 0.08545
F Significance < 2.2e-16 8.055e-14 < 2.2e-16 3.5e-11 < 2.2e-16 < 2.2e-16 < 2.2e-16 1.401e-14
Notes: +p > 0.1; *p>0.05; **p>0.01; ***p> 0.0001
RSE: Robust Standard Errors
SE: Standard Errors

111
N) MODERATION WITH OUTLIERS
MODERATION ANALYSIS WITH OUTLIERS; TOBIN’S Q AND RETURN ON ASSETS,, 2015-2019
Time Period 2010 - 2014 Time Period 2015 - 2019
Model 1 Model 2 Model 1 Model 2
Accounting Based Market Based Accounting Based Market Based Accounting Based Market Based Accounting Based Market Based
ROA TQ ROA TQ ROA TQ ROA TQ
Coef RSE Coef RSE Coef RSE Coef RSE Coef RSE Coef RSE Coef RSE Coef RSE
Intercept -0.744*** 0.141 -0.346** 0.136 -0.741*** 0.140 -0.344* 0.136 -0.900*** 0.149 -0.435** 0.142 -0.910*** 0.148 -0.421** 0.143
Strategic Response Capabilities 0.084** 0.030 0.273*** 0.041 0.082* 0.035 0.270*** 0.041 0.040 0.036 0.289*** 0.036 0.070* 0.036 0.319*** 0.034
Research and Development -0.084 0.064 0.027 0.047 -0.077 0.063 0.031 0.047 -0.099 0.063 0.142** 0.050 -0.109* 0.053 0.167** 0.060
Organizational Slack -0.433*** 0.048 0.354*** 0.056 -0.404*** 0.046 0.360*** 0.053 -0.344*** 0.074 0.214*** 0.064 -0.289*** 0.070 0.240*** 0.069
Firm Size 0.114*** 0.014 0.053*** 0.015 0.114*** 0.014 0.053*** 0.015 0.131*** 0.016 0.058*** 0.015 0.132*** 0.016 0.058*** 0.015
Capital Intensity -0.055+ 0.032 -0.160*** 0.036 -0.055+ 0.030 -0.164*** 0.036 -0.053 0.047 -0.244*** 0.035 -0.050 0.047 -0.238 *** 0.035
Financial Leverage -0.208*** 0.028 0.041 0.029 -0.197*** 0.027 0.043 0.029 -0.172*** 0.037 -0.012 0.033 -0.171*** 0.036 -0.005 0.033
Advertising Intensity -0.013 0.032 -0.072 0.044 -0.011 0.031 -0.073+ 0.044 -0.034 0.042 0.020 0.046 -0.049 0.041 0.013 0.047
Advertising Dummy -0.25*** 0.054 -0.108 0.066 -0.246*** 0.054 -0.107 0.066 -0.197** 0.063 -0.103 0.072 0.204** 0.062 -0.109 0.072
High Tech Industry 0.135 0.085 0.033 0.121 0.132 0.084 0.055 0.081 0.110 0.099 0.091 0.082 0.131 0.101 0.095 0.083
Medium Tech Industry 0.089 0.129 0.059 0.080 0.070 0.129 0.028 0.122 0.005 0.143 0.108 0.129 0.002 0.140 0.102 0.130
SRC * Research and Development
n/a n/a n/a n/a -0.013 0.077 0.038 0.052 n/a n/a n/a n/a 0.063 0.054 -0.019 0.036
SRC * Organizational Slack n/a n/a n/a n/a -0.082 0.064 -0.040 0.056 n/a n/a n/a n/a -0.124** 0.048 -0.043 0.037
N 1052 1052 1052 1052 913 913 913 913
Multiple R2 0.3613 0.1876 0.3716 0.1886 0.3169 0.1995 0.3311 0.2077
Adjusted R2 0.3552 0.1798 0.3643 0.1792 0.3093 0.1907 0.3222 0.1971
F Significance 2.2e-16 2.2e-16 2.2e-16 2.2e-16 2.2e-16 2.2e-16 2.2e-16 < 2.2e-16
Notes: +p > 0.1; *p>0.05; **p>0.01; ***p> 0.0001
RSE: Robust Standard Errors
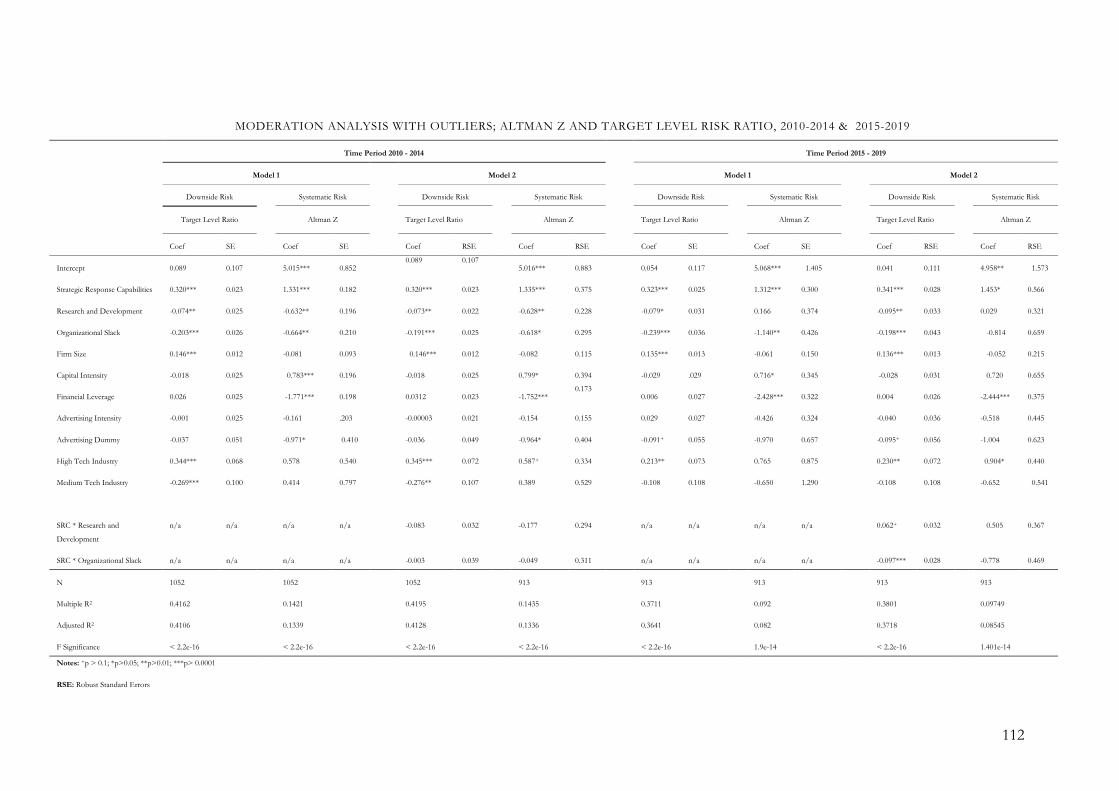
112
MODERATION ANALYSIS WITH OUTLIERS; ALTMAN Z AND TARGET LEVEL RISK RATIO, 2010-2014 & 2015-2019
Time Period 2010 - 2014 Time Period 2015 - 2019
Model 1 Model 2 Model 1 Model 2
Downside Risk Systematic Risk Downside Risk Systematic Risk Downside Risk Systematic Risk Downside Risk Systematic Risk
Target Level Ratio Altman Z Target Level Ratio Altman Z Target Level Ratio Altman Z Target Level Ratio Altman Z
Coef SE Coef SE Coef RSE Coef RSE Coef SE Coef SE Coef RSE Coef RSE
Intercept 0.089 0.107 5.015*** 0.852 0.089 0.107
5.016*** 0.883 0.054 0.117 5.068*** 1.405 0.041 0.111 4.958** 1.573
Strategic Response Capabilities 0.320*** 0.023 1.331*** 0.182 0.320*** 0.023 1.335*** 0.375 0.323*** 0.025 1.312*** 0.300 0.341*** 0.028 1.453* 0.566
Research and Development -0.074** 0.025 -0.632** 0.196 -0.073** 0.022 -0.628** 0.228 -0.079* 0.031 0.166 0.374 -0.095** 0.033 0.029 0.321
Organizational Slack -0.203*** 0.026 -0.664** 0.210 -0.191*** 0.025 -0.618* 0.295 -0.239*** 0.036 -1.140** 0.426 -0.198*** 0.043 -0.814 0.659
Firm Size 0.146*** 0.012 -0.081 0.093 0.146*** 0.012 -0.082 0.115 0.135*** 0.013 -0.061 0.150 0.136*** 0.013 -0.052 0.215
Capital Intensity -0.018 0.025 0.783*** 0.196 -0.018 0.025 0.799* 0.394 -0.029 .029 0.716* 0.345 -0.028 0.031 0.720 0.655
Financial Leverage 0.026 0.025 -1.771*** 0.198 0.0312 0.023 -1.752*** 0.173
0.006 0.027 -2.428*** 0.322 0.004 0.026 -2.444*** 0.375
Advertising Intensity -0.001 0.025 -0.161 .203 -0.00003 0.021 -0.154 0.155 0.029 0.027 -0.426 0.324 -0.040 0.036 -0.518 0.445
Advertising Dummy -0.037 0.051 -0.971* 0.410 -0.036 0.049 -0.964* 0.404 -0.091+ 0.055 -0.970 0.657 -0.095+ 0.056 -1.004 0.623
High Tech Industry 0.344*** 0.068 0.578 0.540 0.345*** 0.072 0.587+ 0.334 0.213** 0.073 0.765 0.875 0.230** 0.072 0.904* 0.440
Medium Tech Industry -0.269*** 0.100 0.414 0.797 -0.276** 0.107 0.389 0.529 -0.108 0.108 -0.650 1.290 -0.108 0.108 -0.652 0.541
SRC * Research and
Development
n/a n/a n/a n/a -0.083 0.032 -0.177 0.294 n/a n/a n/a n/a 0.062+ 0.032 0.505 0.367
SRC * Organizational Slack n/a n/a n/a n/a -0.003 0.039 -0.049 0.311 n/a n/a n/a n/a -0.097*** 0.028 -0.778 0.469
N 1052 1052 1052 913 913 913 913 913
Multiple R2 0.4162 0.1421 0.4195 0.1435 0.3711 0.092 0.3801 0.09749
Adjusted R2 0.4106 0.1339 0.4128 0.1336 0.3641 0.082 0.3718 0.08545
F Significance < 2.2e-16 < 2.2e-16 < 2.2e-16 < 2.2e-16 < 2.2e-16 1.9e-14 < 2.2e-16 1.401e-14
Notes: +p > 0.1; *p>0.05; **p>0.01; ***p> 0.0001
RSE: Robust Standard Errors

113
O) MEDIATION MODELS EXCLUDING OUTLIERS
MEDIATION ANALYSIS WITHOUT OUTLIERS; TOBIN’S Q AND RETURN ON ASSETS, 2010-2014 [BACK]
Time Period 2010 - 2014
Model 1 Model 2 Model 3 Model 4
Accounting Based Market Based Accounting Based Market Based Mediator Mediator Accounting Based Market Based
ROA TQ ROA TQ R&D Organizational Slack ROA TQ
Coef RSE Coef RSE Coef RSE Coef RSE Coef RSE Coef RSE Coef RSE Coef RSE
Intercept -0.910*** 0.095 -0.049 0.113 -0.847*** 0.092 -0.666*** 0.116 0.331** 0.112 1.210*** 0.100 -0.731*** 0.088 -0.495*** 0.116
Strategic Response Capabilities 0.181*** 0.030 0.398*** 0.036 n/a n/a n/a n/a -0.005 0.022 0.001 0.024 0.194*** 0.026 0.385*** 0.033
Research and Development n/a n/a n/a n/a -0.113*** 0.024 0.105** 0.035 n/a n/a n/a n/a -0.118*** 0.024 0.101** 0.034
Organizational Slack n/a n/a n/a n/a -0.346*** 0.031 0.388*** 0.037 n/a n/a n/a n/a -0.337*** 0.032 0.379*** 0.037
Firm Size 0.127*** 0.011 0.004 0.012 0.105*** 0.010 0.081*** 0.013 -0.034** 0.012 -0.138*** 0.011 0.093*** 0.010 0.066*** 0.013
Capital Intensity -0.158*** 0.023 0.008 0.028 -0.034 0.022 -0.166*** 0.0260 0.409*** 0.030 0.423*** 0.030 -0.043* 0.021 -0.170*** 0.027
Financial Leverage -0.141*** 0.021 0.016 0.027 -0.201*** 0.022 0.031 0.028 -0.223*** 0.028 -0.107*** 0.026 -0.184*** 0.021 0.048+ 0.026
Advertising Intensity -0.060* 0.025 0.038 0.029 0.016 0.019 -0.034 0.028 0.040 0.029 0.165*** 0.025 0.013 0.019 0.024 0.026
Advertising Dummy -0.140** 0.043 -0.054 0.061 -0.116** 0.040 0.002 0.060 -0.071 0.057 -0.168** 0.052 -0.123** 0.039 -0.050 0.057
High Tech Industry 0.246*** 0.053 0.057 0.069 0.268*** 0.058 0.110 0.068 -0.062 0.072 -0.175** 0.064 0.253*** 0.055 0.103 0.067
Medium Tech Industry 0.103 0.076 0.019 0.094 0.134 0.087 0.0005 0.093 0.060 0.099 -0.018 0.087 0.116 0.081 -0.007 0.090
N 997 997 995 997 1007 1007 989 997
Multiple R2 0.2457 0.1219 0.3498 0.1289 0.218 0.3262 0.4039 0.2526
Adjusted R2 0.2396 0.1148 0.3439 0.121 0.2117 0.3208 0.3978 0.245
F Significance < 2.2e-16 < 2.2e-16 < 2.2e-16 2.2e-16 < 2.2e-16 < 2.2e-16 <2.2e-16 < 2.2e-16
Notes: +p > 0.1; *p>0.05; **p>0.01; ***p> 0.0001
RSE: Robust Standard Errors

114
MEDIATION ANALYSIS WITHOUT OUTLIERS; TOBIN’S Q AND RETURN ON ASSETS, 2015-2019 [BACK]
Time Period 2015 - 2019
Model 1 Model 2 Model 3 Model 4
Accounting Based Market Based Accounting Based Market Based Mediator Mediator Accounting Based Market Based
ROA TQ ROA TQ R&D Organizational Slack ROA TQ
Coef RSE Coef RSE Coef RSE Coef RSE Coef RSE Coef RSE Coef RSE Coef RSE
Intercept -1.140*** 0.113 -0.185 0.123 -0.849*** 0.110 -0.599*** 0.132 0.352** 0.127 1.390*** 0.111 -0.856*** 0.110 -0.546*** 0.129
Strategic Response Capabilities 0.099*** 0.026 0.381*** 0.030 n/a n/a n/a n/a 0.057* 0.028 0.052* 0.026 0.103*** 0.024 0.340*** 0.031
Research and Development n/a n/a n/a n/a -0.080+ 0.046 0.237*** 0.040 n/a n/a n/a n/a -0.093* 0.044 0.229*** 0.039
Organizational Slack n/a n/a n/a n/a -0.330*** 0.046 0.274*** 0.049 n/a n/a n/a n/a -0.317*** 0.046 0.273*** 0.047
Firm Size 0.147*** 0.013 0.016 0.013 0.104*** 0.012 0.069*** 0.015 -0.058*** 0.013 -0.160*** 0.012 0.104*** 0.012 0.065*** 0.014
Capital Intensity -0.220*** 0.028 -0.108*** 0.028 -0.075** 0.028 -0.287*** 0.031 0.364*** 0.036 0.437*** 0.032 -0.071*** 0.028 -0.303*** 0.033
Financial Leverage -0.108*** 0.024 -0.050+ 0.029 -0.142*** 0.024 -0.002 0.032 -0.106*** 0.032 -0.081** 0.027 -0.147*** 0.024 0.018 0.031
Advertising Intensity -0.090** 0.029 0.058* 0.026 -0.023 0.036 -0.010 0.039 0.065* 0.033 0.171*** 0.023 -0.014 0.036 0.017 0.036
Advertising Dummy -0.115* 0.052 -0.094 0.064 -0.132** 0.051 -0.017 0.065 -0.081 0.064 -0.244*** 0.052 -0.140** 0.051 -0.062 0.064
High Tech Industry 0.263*** 0.063 0.137+ 0.076 0.253*** 0.067 0.117 0.077 0.131+ 0.078 -0.132+ 0.069 0.268*** 0.065 0.150* 0.074
Medium Tech Industry 0.195* 0.094 0.269** 0.100 0.211* 0.101 0.107 0.101 0.136 0.102 0.056 0.091 0.232* 0.098 0.218* 0.099
N 855 871 858 873 887 871 858 875
Multiple R2 0.2153 0.1615 0.2997 0.1547 0.1657 0.3651 0.3064 0.259
Adjusted R2 0.2078 0.1537 0.2923 0.1459 0.1581 0.3592 0.2982 0.2504
F Significance < 2.2e-16 < 2.2e-16 < 2.2e-16 < 2.2e-16 < 2.2e-16 < 2.2e-16 < 2.2e-16 < 2.2e-16
Notes: +p > 0.1; *p>0.05; **p>0.01; ***p> 0.0001
RSE: Robust Standard Errors

115
MEDIATION ANALYSIS WITHOUT OUTLIERS; ALTMAN Z AND TARGET LEVEL RISK RATIO, 2010-2014 [BACK]
Time Period 2010 - 2014
Model 1 Model 2 Model 3 Model 4
Downside Risk Bankruptcy Risk Downside Risk Bankruptcy Risk Mediator Mediator Downside Risk Bankruptcy Risk
Target Level Ratio Altman Z Target Level Ratio Altman Z R&D Organizational Slack Target Level Ratio Altman Z
Coef RSE Coef RSE Coef RSE Coef SE Coef RSE Coef RSE Coef SE Coef SE
Intercept -0.168 0.110 4.204*** 0.412 -0.069 0.111 4.373*** 0.880 0.331** 0.112 1.210*** 0.100 0.128 0.102 4.106*** 0.428
Strategic Response Capabilities 0.346*** 0.025 1.082*** 0.128 n/a n/a n/a n/a -0.005 0.022 0.001 0.024 0.392*** 0.024 1.122*** 0.140
Research and Development n/a n/a n/a n/a -0.106*** 0.029 -0.577** 0.207 n/a n/a n/a n/a -0.113*** 0.026 -0.272* 0.132
Organizational Slack n/a n/a n/a n/a -0.204***
0.029 -0.654** 0.217 n/a n/a n/a n/a -0.222*** 0.029 -0.421** 0.144
Firm Size 0.183*** 0.012 -0.001 0.048 0.159***
0.012 -0.008 0.096 -0.034** 0.012 -0.138*** 0.011 0.140*** 0.011 0.0002 0.050
Capital Intensity -0.100*** 0.024 0.191+ 0.115 -0.023 0.026 0.836*** 0.205 0.409*** 0.030 0.423*** 0.030 -0.026 0.024 0.335** 0.136
Financial Leverage 0.030 0.024 -1.329*** 0.096 0.017 0.025 -1.799*** 0.205 -0.223*** 0.028 -0.107*** 0.026 0.029 0.024 -1.544*** 0.117
Advertising Intensity -0.058* 0.025 -0.132 0.082 -0.002 0.024 -0.128 0.212 0.040 0.029 0.165*** 0.025 -0.022 0.028 -0.140+ 0.083
Advertising Dummy -0.063 0.051 -0.626** 0.224 -0.007 0.053 -0.772+ 0.426 -0.071 0.057 -0.168** 0.052 -0.072 0.049 -0.678** 0.237
High Tech Industry 0.375*** 0.069 0.620** 0.212 0.385*** 0.071 0.622 0.561 -0.062 0.072 -0.175** 0.064 0.372*** 0.065 0.687** 0.218
Medium Tech Industry -0.222* 0.097 0.069 0.262 -0.232* 0.102 0.379 0.835 0.060 0.099 -0.018 0.087 -0.184 + 0.098 0.384 0.316
N 1037 996 1027 996 1007 1007 1003 1003
Multiple R2 0.386 0.197 0.3186 0.1608 0.218 0.3262 0.4606 0.2167
Adjusted R2 0.3812 0.1905 0.3126 0.1531 0.2117 0.3208 0.4551 0.2088
F Significance < 2.2e-16 < 2.2e-16 < 2.2e-16 < 2.2e-16 < 2.2e-16 < 2.2e-16 < 2.2e-16 < 2.2e-16
Notes: +p > 0.1; *p>0.05; **p>0.01; ***p> 0.0001
RSE: Robust Standard Errors

116
MEDIATION ANALYSIS WITHOUT OUTLIERS; ALTMAN Z AND TARGET LEVEL RISK RATIO, 2015-2019 [BACK]
Time Period 2015- 2019
Model 1 Model 2 Model 3 Model 4
Downside Risk Bankruptcy Risk Downside Risk Bankruptcy Risk Mediator Mediator Downside Risk Bankruptcy Risk
Target Level Ratio Altman Z Target Level Ratio Altman Z R&D Organizational Slack Target Level Ratio Altman Z
Coef RSE Coef RSE Coef RSE Coef RSE Coef RSE Coef RSE Coef SE Coef RSE
Intercept -0.187+ 0.106 3.744*** 0.532 -0.023 0.127 4.141*** 0.565 0.352** 0.127 1.390*** 0.111 0.054 0.116 4.143*** 0.569
Strategic Response Capabilities 0.349*** 0.028 0.870*** 0.173 n/a n/a n/a n/a 0.057* 0.028 0.052* 0.026 0.338*** 0.026 0.928*** 0.173
Research and Development n/a n/a n/a n/a -0.101* 0.040 0.298 0.215 n/a n/a n/a n/a -0.118*** 0.032 0.148 0.168
Organizational Slack n/a n/a n/a n/a -0.150*** 0.041 -0.659*** 0.224 n/a n/a n/a n/a -0.226*** 0.037 -0.616** 0.213
Firm Size 0.176*** 0.012 0.085 0.064 0.147*** 0.014 0.032 0.066 -0.058*** 0.013 -0.160*** 0.012 0.136*** 0.012 0.035 0.067
Capital Intensity -0.166*** 0.027 -0.221+ 0.125 -0.045 0.032 -0.025 0.165 0.364*** 0.036 0.437*** 0.032 0.012 0.029 -0.024 0.150
Financial Leverage 0.027 0.025 -1.621*** 0.162 -0.002 0.030 -1.768*** 0.174 -0.106*** 0.032 -0.081** 0.027 0.009 0.027 -1.751*** 0.172
Advertising Intensity -0.103*** 0.024 -0.178 0.143 -0.092* 0.037 -0.113 0.162 0.065* 0.033 0.171*** 0.023 -0.047 0.033 -0.049 0.162
Advertising Dummy -0.077 0.055 -1.160*** 0.325 -0.086 0.060 -1.152*** 0.335 -0.081 0.064 -0.244*** 0.052 -0.091 0.055 -1.167*** 0.336
High Tech Industry 0.181** 0.063 0.883*** 0.264 0.203* 0.079 0.788** 0.293 0.131+ 0.078 -0.132+ 0.069 0.205** 0.072 0.806** 0.284
Medium Tech Industry -0.171+ 0.089 -0.521 0.364 -0.147 0.117 -0.479 0.388 0.136 0.102 0.056 0.091 -0.110 0.107 -0.531 0.383
N 888 877 906 877 887 871 906 877
Multiple R2 0.3431 0.1817 0.2578 0.1691 0.1657 0.3651 0.3711 0.19
Adjusted R2 0.3371 0.1742 0.2504 0.1604 0.1581 0.3592 0.3641 0.1806
F Significance < 2.2e-16 < 2.2e-16 < 2.2e-16 < 2.2e-16 < 2.2e-16 < 2.2e-16 < 2.2e-16 < 2.2e-16
Notes: +p > 0.1; *p>0.05; **p>0.01; ***p> 0.0001
RSE: Robust Standard Errors

117
P) MODERATION MODEL 1, SAME OBSERVATIONS
MODERATION ANALYSIS IDENTICAL OBSERVATIONS; TOBIN’S Q, RETURN ON ASSETS, ALTMAN Z AND TARGET LEVEL RISK RATIO
Time Period 2010 - 2014 Time Period 2015 – 2019
Performance Risk Performance Risk
Accounting Based Market Based Downside Risk Bankruptcy Risk Accounting Based Market Based Downside Risk Bankruptcy Risk
ROA TQ Target Level Ratio Altman Z ROA TQ Target Level Ratio Altman Z
Coef RSE Coef RSE Coef SE Coef RSE Coef RSE Coef RSE Coef SE Coef RSE
Intercept -0.683*** 0.086 -0.461*** 0.116 0.143 0.102 3.904*** 0.451 -0.839*** 0.111 -0.511*** 0.128 0.050 0.116 3.758 *** 0.582
Strategic Response Capabilities 0.212*** 0.027 0.407*** 0.034 0.404*** 0.026 1.191*** 0.142 0.111*** 0.026 0.337*** 0.074 0.338*** 0.026 0.869*** 0.172
Research and Development -0.092** 0.031 0.124*** 0.036 -0.130*** 0.033 -0.171 0.140 -0.084* 0.041 0.244*** 0.041 -0.102** 0.032 0.218 0.186
Organizational Slack -0.316*** 0.034 0.371*** 0.038 -0.198*** 0.030 -0.400** 0.148 -0.264*** 0.047 0.222*** 0.050 -0.208*** 0.036 -0.772*** 0.209
Firm Size 0.090*** 0.001 0.061*** 0.013 0.139*** 0.011 0.024 0.052 0.105*** 0.012 0.060*** 0.014 0.139*** 0.012 0.104 0.072
Capital Intensity -0.035+ 0.020 -0.183*** 0.028 -0.026 0.025 0.351* 0.136 -0.089** 0.028 -0.281*** 0.035 -0.047 0.030 -0.142 0.156
Financial Leverage -0.171*** 0.021 0.051+ 0.026 0.035 0.024 -1.575*** 0.120 -0.142*** 0.023 0.007 0.032 0.007 0.027 -1.802*** 0.175
Advertising Intensity 0.013 0.018 -0.018 0.028 -0.025 0.029 -0.158+ 0.088 -0.031 0.033 0.040 0.037 -0.053 0.033 0.027 0.168
Advertising Dummy -0.135*** 0.039 -0.051 0.057 -0.069 0.050 -0.588* 0.242 0.136** 0.051 -0.039 0.064 -0.090 0.056 -1.082** 0.347
High Tech Industry 0.244*** 0.053 0.106 0.069 0.367*** 0.066 0.707** 0.223 0.257*** 0.066 0.136+ 0.074 0.195** 0.073 0.760** 0.292
Medium Tech Industry 0.124 0.080 -0.021 0.093 -0.197* 0.098 0.375 0.318 0.247* 0.098 0.225* 0.100 -0.124 0.107 -0.537 0.389
N 989 997 1003 1005 858 875 906 877
Multiple R2 0.3544 0.2452 0.4454 0.2113 0.266 0.2498 0.3728 0.18
Adjusted R2 0.3478 0.2376 0.4398 0.2034 0.2573 0.2411 0.3658 0.1705
F Significance < 2.2e-16 < 2.2e-16 < 2.2e-16 < 2.2e-16 < 2.2e-16 < 2.2e-16 < 2.2e-16 < 2.2e-16
Notes: +p > 0.1; *p>0.05; **p>0.01; ***p> 0.0001
RSE: Robust Standard Errors

118
Q) CONTROL VARIABLES – EXPECTED VERSUS ENCOUNTERED SIGN
MEDIATION
Expected Sign 2010 - 2014 2015 - 2019
Variable Return Risk ROA TQ Alt Z TLRR ROA TQ Alt Z TLRR
Financial Leverage (-) (-) ✅ ❎ ✅ ✴ ✅ ✴ ✅ ✴ Size (+) (+) ✅ ✅ ✴ ✅ ✅ ✅ ✴ ✅ Capital Intensity (-) (-) ✅ ✅ ❎ ✴ ✅ ✅ ✴ ✴ Advertising Intensity (+) (+) ✴ ✴ ❎ ✴ ✴ ✴ ✴ ✴
Advertising Dummy (-) (-) ✅ ✴ ✴ ✅ ✅ ✴ ✅ ✅ High Tech Industry (+) (+) ✅ ✴ ✅ ✅ ✅ ✅ ✅ ✅ Medium Tech Industry
(+) (+) ✴ ✴ ✴ ❎ ✅ ✅ ✴ ✴
Notes: ✅ Coefficient Statistically significant (p-value < 0.1) with expected sign ❎ Coefficient Statistically significant (p- value < 0.1) with the opposite of expected sign ✴ Coefficient Statistically insignificant

119
R) NEW MEDIATOR MODEL REGRESSION RESULTS - WITH OUTLIERS
Time Period 2010-2014 Time Period 2015-2019
Model 3 Model 3
R&D Organizational Slack R&D Organizational Slack
RSE Coef RSE Coef RSE Coef RSE Coef
Intercept 0.036 0.150 0.742*** 0.136 0.070 0.185 0.945*** 0.135
Strategic Response Capabilities 0.069* 0.033 0.065* 0.031 0.179*** 0.030 0.131*** 0.025
Firm Size 0.007 0.017 -0.077*** 0.015 0.015 0.020 -0.086*** 0.014
Capital Intensity 0.288*** 0.038 0.277*** 0.036 0.207*** 0.045 0.323*** 0.034
Financial Leverage -
0.192***
0.035 -0.135*** 0.029 -0.092+ 0.051 -0.121*** 0.029
Advertising Intensity 0.045 0.037 0.086 0.066 0.012 0.031 0.102** 0.032
Advertising Dummy -0.067 0.067 -0.264*** 0.072 -0.059 0.069 -0.314*** 0.057
High Tech Industry 0.046 0.087 -0.012 0.086 0.089 0.102 0.018 0.093
Medium Tech Industry 0.022 0.087 -0.004 0.124 0.104 0.149 0.050 0.124
ROA -
0.208***
0.039 -0.313*** 0.032 -0.169*** 0.036 -0.252*** 0.033
TLRR -0.014** 0.004 -0.011** 0.004 -0.048*** 0.009 -0.040*** 0.008
N 1052 1052 913 913
Multiple R2 0.1913 0.3377 0.1705 0.427 Adjusted R2 0.1836 0.3314 0.1613 0.4207 F Significance < 2.2e-16 < 2.2e-16 < 2.2e-16 < 2.2e-16 Notes: +p > 0.1; *p>0.05; **p>0.01; ***p> 0.0001 RSE: Robust Standard Errors

120
S) NEW MEDIATOR MODEL REGRESSION RESULTS - WITHOUT OUTLIERS
Time Period 2010-2014 Time Period 2015-2019
Model 3 Model 3
R&D Organizational Slack R&D Organizational Slack
SE Coef RSE Coef SE Coef SE Coef
Intercept 0.057 0.120 0.796*** 0.104 0.017 0.129 0.946*** 0.112
Strategic Response
Capabilities
0.098** 0.032 0.063* 0.026 0.139*** 0.028 0.139*** 0.025
Firm Size 0.020 0.014 -0.072*** 0.012 0.016 0.014 -0.072*** 0.012
Capital Intensity 0.336*** 0.028 0.319*** 0.027 0.286*** 0.031 0.342*** 0.029
Financial Leverage -0.231*** 0.028 -0.150*** 0.025 -0.125*** 0.030 -0.135*** 0.026
Advertising Intensity 0.027 0.033 0.149*** 0.023 0.028 0.031 0.126*** 0.030
Advertising Dummy -0.108+ 0.057 -0.198
***
0.049 -0.106+ 0.058 -0.300*** 0.051
High Tech Industry 0.040 0.075 -0.094 0.066 0.260** 0.080 -0.047 0.071
Medium Tech Industry 0.042 0.111 -0.010 0.088 0.192 0.119 0.035 0.103
ROA -0.208*** 0.029 -0.305*** 0.024 -0.150*** 0.030 -0.264*** 0.027
TLRR -0.025*** 0.005 -0.012*** 0.003 -0.062*** 0.008 -0.046*** 0.007
N 999 998 865 858
Multiple R2 0.28 0.4036 0.27 0.47 Adjusted R2 0.27 0.3976 0.26 0.47 F Significance <2e-16 < 2.2e-16 <2e-16 <2e-16 Notes: +p > 0.1; *p>0.05; **p>0.01; ***p> 0.0001 RSE: Robust Standard Errors SE: Standard Errors