Embed Size (px)
Citation preview
University of South FloridaScholar Commons
Graduate Theses and Dissertations Graduate School
4-7-2016
Exploring the Relationship Between Severity ofIllness and Human Milk Volume in Very Low BirthWeight and Extremely Low Birth Weight InfantsOver Six WeeksShannon Leigh MorseUniversity of South Florida, [email protected]
Follow this and additional works at: http://scholarcommons.usf.edu/etd
Part of the Nursing Commons, Nutrition Commons, and the Other Education Commons
This Thesis is brought to you for free and open access by the Graduate School at Scholar Commons. It has been accepted for inclusion in GraduateTheses and Dissertations by an authorized administrator of Scholar Commons. For more information, please contact [email protected].
Scholar Commons CitationMorse, Shannon Leigh, "Exploring the Relationship Between Severity of Illness and Human Milk Volume in Very Low Birth Weightand Extremely Low Birth Weight Infants Over Six Weeks" (2016). Graduate Theses and Dissertations.http://scholarcommons.usf.edu/etd/6329

Exploring the Relationship Between Severity of Illness and Human Milk
Volume in Very Low Birth Weight and Extremely Low Birth Weight Infants Over Six
Weeks
by
Shannon Morse
A dissertation submitted in partial fulfillment of the requirements for the degree of
Doctor of Philosophy Department of Nursing
with a concentration in Nursing Science College of Nursing
University of South Florida
Major Professor: Maureen Groer, Ph.D. Melissa Shelton, Ph.D. Denise Maguire, Ph.D. Terri Ashmeade, M.D.
Date of Approval: April 7, 2016
Keywords: Mother’s Own Milk, Donor Human Milk, Score for Neonatal Acute Physiology, Premature Infants, Multilevel Modeling
Copyright © 2016, Shannon Morse

DEDICATION
One does not complete a doctoral dissertation without the help and support from many
individuals. Therefore, I would like to dedicate this work to the many special people that have
supported me over many years and made this day possible.
First, I would like to dedicate this accomplishment to my family! Without your love, support,
and encouragement, I would not be completing this doctoral journey. Mom, did you realize that
you were actually the first person to teach me how to research when you were a graduate student
at the University of Alabama? Thank you for teaching me to value education and believing that I
could actually achieve this goal! Dad and Mava, thank you for always believing in me and
encouraging me to keep striving for the goal! Aleida, my big sister, thank you for proofreading
every paper I’ve ever written and for your daily support handling so many ‘life details’ so that I
had time for schoolwork. Aunt Pearl, thank you for my ‘daily dose’ of encouragement (via text
message) as I pushed hard to finish during the last 2 ½ months of the journey! Hope, thank you
for my many encouraging text messages along the journey as well! Eric, thank you for always
being just a phone call away when I needed anything and everything! To the Bailey Bunch,
thank you for your support! I wish I could name each person here as you each have all played a
special part in this day. Please know that I am so grateful for each one of you and that I love
you!

I also owe a huge debt of gratitude to my friends and colleges for their support and
encouragement. LiTing, I am so grateful that God saw fit to have our paths cross so that we
could travel this educational journey together. I am certain I would not have made it through to
completion without your friendship and tutoring! God has given you a special gift when it
comes to understanding statistics and I am so grateful for the MANY times that you allowed me
to talk and ask questions until the “muddy water” became clear and I had an “ah-ha!” moment!
Jessie, my fellow USF breastfeeding advocate, I’m so blessed that we journeyed together
through both graduate degrees! I would also like to dedicate this dissertation to my nursing
colleagues at Rasmussen College. You are a phenomenal group of nursing educators and I am so
blessed to work with you each day! Kim Barnett, I would specifically like to dedicate this work
to you as you valued nursing education and continued on your doctoral nursing education
journey amidst great obstacles. You helped me to push forward each time the journey became
tough! So, I am finishing my degree in your honor. You are dear to my heart and I miss you so!
Jennifer Cowherd, you made this day possible in so many ways, I am so blessed that God
brought us together as friends and colleagues. I would also like to give a special recognition to
Dr. Kelly McCullough, Dean of Nursing at Rasmussen College, New Port Richey. Words
cannot adequately express how much I appreciate the many ways that you have supported me
over the past four years on this doctoral education journey. I would not be here today without
you! I’m so blessed to have you as my Dean of Nursing and my friend! I would also like to
dedicate this work to my AWHONN (Association of Women’s Health, Obstetric and Neonatal
Nurses) colleagues. It is my joy and privilege to work with such a passionate group of nursing
leaders at the local, state, and national level that desire to impact the care of women and
newborns. I would also like to thank my many friends that have been praying for me throughout

this journey including: Vivian Coates, Carrie Liddell, Gloria Skiles, Tina Valdez, Denise
Peterson, Diane Avriett, Jan Bailie, Terry Doyle, USF NP grad friends, and many more from my
church family at First Baptist Church of Land O’ Lakes! Your prayers and support mean more
to me than words can express! Finally, I would like to dedicate this work to the nurses and
midwives, from East Pasco Medical Center (now Florida Hospital Zephyrhills) that took me
under their wings when I was a brand new graduate nurse. So many nurses influenced me as a
new graduate, but I would especially like to thank Madeline Beaumont for believing in me and
hiring me as a new graduate nurse! I would also like to thank Rita Watson, Andree Landry, and
Lois Bineshtarigh as they served as my preceptors and taught me how to successfully transition
from a student nurse to an RN. In addition, I would like to express gratitude to Delrose Brown,
Joanie Turner, and Marie McCord, three wonderful midwives who served as mentors to me at
the beginning of my nursing journey and beyond. I know I always asked a thousand questions
and I thank you for always patiently answering every single one of them! Guess what? I’m still
asking questions, and now I am equipped to conduct nursing research that can provide new
evidence for the questions that nurses ask each day as we care for our patients.
I would also like to dedicate this work to the educators that have been influential throughout my
nursing career. Dr. Barbara Redding and Dr. Susan McMillan, your passion for nursing
education and your genuine interest in your students is inspirational! I want my students to look
up to me the way that I have always looked up to each of you! Dr. Frances Rankin, you have
been a role model for me since the day you completed my health history and physical to enter
nursing school in 1997. I was blessed to be a patient first and subsequently your student! Dr.
Cecilia Jevitt, thank you for the many ways that you have influenced my career over the years

including: helping me to get hired for my first nursing job, getting published for the first time as
a co-author with you, and especially for planting the seed about this doctoral journey. A wise
woman, you, once told me that all nurses that have earned a Ph.D. do not love to write or find the
task easy; yet they place enough importance on the task to take the time to pass along knowledge
to grow the profession of nursing. Dr. Jason Beckstead, thank for always answering my statistics
questions again and again. Dr. Allison Edmonds-Poff, Dr. Denise Passmore, and Dr. Joan
Gregory, thank you for watering that seed that Dr. Jevitt planted and encouraging me to continue
on this educational journey.
I would also like to dedicate this work to my students. Certainly my career path demonstrates
life long learning. My desire is that this personal achievement will help me to be a better nurse
educator. I also hope that it inspires some of you to continue your educational pursuits and
achieve goals and dreams that you didn’t think was possible!
Finally, I would like to dedicate this dissertation to my Savior, Jesus Christ. Ultimately this day
belongs to you as you gave me abilities beyond my natural abilities to accomplish the tasks set
before me. “…My grace is sufficient for thee: for my strength is made perfect in weakness.
Most gladly therefore will I rather glory in my infirmities, that the power of Christ may rest upon
me” II Corinthians 12: 9. My prayer is that this educational pursuit can be used for Your Glory!
Ultimately, I want my life to count for YOU! You have blessed me with talents as a nurse and it
is my greatest desire to use these talents to make a difference in the world.
“And of some have compassion, making a difference:” Jude 1:22

ACKNOWLEDGMENTS
I would like to extend my heartfelt thanks to my doctoral committee: Dr. Maureen Groer, Dr.
Melissa Shelton, Dr. Denise Maguire, and Dr. Terri Ashmeade. I am so thankful for how each of
you have supported me through candidacy and the dissertation process. Your willingness to
provide robust, detailed, and quick feedback along this educational journey has helped me to
grow and to finish strong! This day would not be possible without each one of you. Thank you!
I would also like to thank Dr. Eun Sook Kim for sharing your passion and expertise of multilevel
modeling. Thank you so much for giving of your time to meet with me and answer so many of
my questions as I worked on the data analysis. I would not be here without your guidance.
Finally, I would like to extend a special thanks to Dr. Maureen Groer, my major professor, for
mentoring me during my doctoral education journey. I am so grateful for the many opportunities
that you afforded me including: working as your research assistant on the NICU MOM study
(parent study for this dissertation research), presenting posters with you at the 2014 Experimental
Biology conference, and the 2015 International Society of Research on Human Milk and
Lactation conference, and ultimately being published twice during my tenure in the doctoral
program. I will always be grateful to you!
i
TABLE OF CONENTS
List of Tables .................................................................................................................................. iii
List of Figures ................................................................................................................................ iv
Abstract ............................................................................................................................................v
Chapter One: Introduction ..............................................................................................................1 Statement of the Problem .....................................................................................................4 Research Questions ..............................................................................................................5 Definition of Relevant Terms ...............................................................................................5 Significance to Nursing........................................................................................................6
Chapter Two: Review of Literature .................................................................................................7 Conceptual Framework ........................................................................................................7 Human Milk .........................................................................................................................9 Benefits of human milk ............................................................................................9 Prevalence of the use of human milk .....................................................................10 Human milk changes.............................................................................................. 11 Donor human milk ................................................................................................. 11 Dose dependent relationship ..................................................................................12 Maternal/Infant Characteristics ..........................................................................................13 Antenatal steroids...................................................................................................13 Maternal infection ..................................................................................................13 Birth weight and gestational age ............................................................................14 Neonatal Severity of Illness ...............................................................................................14 History of the development of the SNAP-II Instrument ........................................15 Utilization of SNAP-II ...........................................................................................15 Mean blood pressure ..............................................................................................17 Temperature instability ..........................................................................................18 Partial pressure of arterial oxygen (PaO2) / Fraction of inspired oxygen (FiO2) ratio .......................................................................................................19 Serum pH ...............................................................................................................20 Presence of multiple seizures .................................................................................21 Urine output ...........................................................................................................21 Summary ............................................................................................................................22
Chapter Three: Method ..................................................................................................................24 Research Design.................................................................................................................24 Setting ................................................................................................................................25

ii
Population and Sample ......................................................................................................25 Measures (Instruments) ......................................................................................................26 SNAP-II .................................................................................................................26 Human milk volume ..............................................................................................27 Demographic data form .........................................................................................28 Procedures ..........................................................................................................................28 Data Analysis .....................................................................................................................30
Chapter Four: Results ....................................................................................................................32 Preliminary Analyses .........................................................................................................32 Outliers, missing data, and normality ....................................................................32 Description of the sample ......................................................................................33 Level 1 Variables Descriptive Statistics .............................................................................34 Level 2 Variables Descriptive Statistics .............................................................................38 Correlations ........................................................................................................................38 Multilevel Modeling Approach ..........................................................................................40 Model Comparison.............................................................................................................41 Growth models .......................................................................................................43 Analysis of the Research Questions ...................................................................................44 Research question one............................................................................................44 Research question two ...........................................................................................46 Research question three .........................................................................................47
Chapter Five: Discussion ..............................................................................................................51 Discussion of Findings .......................................................................................................51 Human milk ...........................................................................................................51 Neonatal severity of illness ....................................................................................54 Conclusions ........................................................................................................................56 Implications for Future Research .......................................................................................57 Acknowledgement .............................................................................................................58
References ......................................................................................................................................59
Appendices .....................................................................................................................................79 Appendix A: IRB Exemption Letter ..................................................................................80 Appendix B: SNAP-II and SNAPPE-II .............................................................................81 Appendix C: Copyright Permission Letters .......................................................................82

iii
LIST OF TABLES
Table 1: Race/Ethnicity ..............................................................................................................34
Table 2: SNAP-II Scores – Descriptive Statistics ......................................................................36
Table 3: Milk Intake Volumes – Descriptive Statistics ..............................................................37
Table 4: Birth Weight – Descriptive Statistics ...........................................................................39
Table 5: Correlations Among Study Variables for Infants Averaged Over Six Weeks ..............42
Table 6: Fixed and Random Effects Estimates for Severity of Illness Growth Models ............44
Table 7: Fixed and Random Effects Estimates for Piecewise Models with MOM ...................46
Table 8: Fixed and Random Effects Estimates for Piecewise Models with DBM ....................48
Table 9: Fixed and Random Effects Estimates for Piecewise Models with THM .....................50
iv
LIST OF FIGURES
Figure 1: Conceptual Framework ..................................................................................................8
Figure 2: Study Design ................................................................................................................31
Figure 3: Scatterplot of SNAP-II Scores by Week ......................................................................35
Figure 4: Graph of Means of SNAP-II Scores from Birth through each Week of Life ...............36
Figure 5: Scatterplot of MOM, DHM, and THM Intake for each Week of Life .........................38
v
ABSTRACT
Very low birth weight and extremely low birth weight neonates have tremendous risk of
mortality. This is a grave concern; however, survival alone is not the goal of neonatal intensive
care. Survival, along with a reduction or elimination of life long morbidity is the aim of neonatal
intensive care.
Human milk is known as the best nutrition for babies and a growing body of evidence
supports that human milk is critical in helping these fragile neonates mitigate the overwhelming
risks they face. Therefore, the purpose of this study was to examine the relationship between
neonatal severity of illness and human milk, specifically mothers own milk (MOM), donor
human milk (DHM), and total human milk (THM) intake in very low birth weight (VLBW) and
extremely low birth weight (ELBW) infants over the first six weeks of life. Although there is a
growing body of evidence that supports the use of human milk in this fragile neonatal
population, information is lacking about the relationship between human milk and neonatal
illness severity.
The current study was a secondary data analysis from a National Institutes of Health
(NIH) funded R21 study in a level three NICU in Florida. Multilevel modeling was used for data
analysis to examine relationships between maternal dyad characteristics and severity of illness,
operationalized by the Score for Neonatal Acute Physiology-II (SNAP-II), at 12 hours of life and
at the end of each week of life for six weeks.

vi
Growth models (linear, quadratic, piecewise) were examined to determine the best model
fit for the data, then predictor variables were added and model fit was tested. Birth weight was
added to final models as a control as it is seen as a proxy for severity of illness in the literature.
Model six demonstrated a significant inverse relationship between MOM(mL) (γMOM(mL)) = -
.000079, p < .05) and SNAP-II scores (Deviance = 287.862, ∆χ2(df) = 31.38(1), p < .001, AIC =
303.862, BIC = 336.930). Model 11 demonstrated a significant inverse relationship between
THM(mL) (γTHM(mL) = -.000127, p < .001) and SNAP-II scores (Deviance = 279.280, ∆χ2(df) =
30.859(1), p < .001, AIC = 295.280, BIC = 328.347). No relationships were noted between
severity of illness and DHM(mL), MOM(%), DHM(%), or THM(%). Therefore the
relationships noted between MOM(mL) and THM(mL) and neonatal severity of illness should be
interpreted with caution.
1
CHAPTER ONE
INTRODUCTION
Very low birth weight (VLBW) and extremely low birth weight (ELBW) infants are
among the most vulnerable populations cared for in the Neonatal Intensive Care Unit (NICU)
(Sehgal, Osborn, & McNamara, 2012). These fragile infants are plagued with increased risk of
morbidity and mortality as compared to infants with a normal birth weight. Risk of morbidity
associated with decreased birth weight begins when neonates are born weighing less than 2,500
grams, categorized as low birth weight (LBW). Furthermore, risk of morbidity and mortality
increases as the birth weight decreases. Therefore the category of LBW has been further
subdivided into very low birth weight (less than 1,500 grams) and extremely low birth weight
(less than 1,000 grams).
In 2013 and 2014, very low birth weight (VLBW) newborns accounted for 1.4% of births
in the United States. Specifically, 0.73% of neonates were between 1,000 – 1,499 grams and an
additional 0.67% of neonates were less than 1,000 grams at birth (ELBW) (Hamilton, Martin,
Osterman, Curtin, & Matthews, 2015; Martin, Hamilton, Osterman, Curtin, & Matthews, 2015).
In the state of Florida, the 2014 prevalence rate of VLBW newborns was 1.6%, which is a slight
increase from the 2013 prevalence rate of 1.54%. Specifically in Hillsborough county, the 2014
VLBW prevalence rate was 1.5% and this was decreased from 1.71% in 2013 (Florida
Community Health Assesment Resource Tool Set, 2013; Florida Community Health Assesment
Resource Tool Set, 2014). The healthy People 2020 target is a VLBW prevalence rate of 1.4% or
less. Although Florida missed this target in 2013 and 2014, they did achieve this goal in 2000,
2
2001, 2004, and 2009 (Yu). Overall, the trending of VLBW has remained fairly consistent since
2000 (Yu). Clearly, the literature and use of birth weight in statistical trends supports birth
weight as a powerful predictor of infant health or lack thereof (Mathews & MacDorman, 2010,
2012, 2013).
When considering care for these fragile infants, one must consider the cost for the
provision of care in the NICU. Intensive care is expensive for any population, and the NICU is
no exception. A recent study demonstrated that societal costs for NICU care ranges from
$114,000 - $225,000 with a lifetime cumulative cost estimated at $450,000 (Meadow et al.,
2012). A better emphasis may be on the efficiency of neonatal intensive care. Doyle (2004b)
noted that although NICU care was expensive, it was efficient in the use of monetary resources.
Another point of interest is that NICU care has improved the survival rate from 25% in 1979 to
73% in 1997 (Doyle, 2004a).
Infant mortality rate is defined as the number of infants dying during the first year of life
per 1,000 live births per year. For example, the total infant mortality rate in the United States
(US) was 6.61 in 2008 and 6.39 in 2009. However, the infant mortality rate for VLBW infants
for 2008 and 2009 was significantly higher at 237.39 and 231.23 respectively (Mathews &
MacDorman, 2012, 2013). This indicates that VLBW infants are more than 100 times more
likely to die as compared to infants born at normal weights (Mathews & MacDorman, 2012,
2013). Newborns weighing less than 500 grams are even more fragile. Mathews and
MacDorman noted that 85% (2013) – 87% (2012) died within infancy.
VLBW and ELBW infants are also at risk for many serious illnesses. Some of the most
common neonatal/infant morbidities in this population include: sepsis, necrotizing enterocolitis
(NEC) (Romieu, Werneck, Ruiz Velasco, White, & Hernandez, 2000), intracranial hemorrhage

3
(IVH), bronchopulmonary dysplasia (BPD), and retinopathy of prematurity (ROP) (Horodynski
et al., 2007) (Ambalavanan et al., 2012). Due to the increased risk of morbidity and mortality,
these neonates are assessed at birth and frequently throughout their NICU admission for signs
and symptoms that alert clinicians to the severity or degree of illness for these neonates. The
concept of neonatal illness severity seeks to describe how acutely ill the neonate is at that
moment in time as well as to provide some prediction for future morbidity and mortality risk for
the neonate. This concept has been operationalized by various instruments including: Score for
Neonatal Acute Physiology (SNAP) (Richardson, Gray, McCormick, Workman, & Goldmann,
1991), Score for Neonatal Acute Physiology-II (SNAP-II) (Richardson, Corcoran, Escobar, &
Lee, 2001), Score for Neonatal Acute Physiology-Perinatal Extension (SNAP+PE) (Richardson,
Phibbs, et al., 1993), Score for Neonatal Acute Physiology- Perinatal Extension – II (SNAP+PE-
II) (Richardson et al., 2001), Severity of Illness Scoring System (SISS), Clinical Risk Index for
Babies (CRIB), and the Sinkin Score at 12 hours of life (SS12) (Fleisher et al., 1997). Although
the various illness severity scores are calculated using data from individual babies, the current
literature supports using illness severity scores at the population level versus the individual
patient level for outcome predictions. Therefore currently, the greatest utilization of illness
severity scores in the literature has been to control for illness severity at birth when comparing
mortality rates, morbidity rates, and quality care indicators between and among NICUs. Without
controlling for the degree of illness severity upon admission, statistical comparison data may be
misleading. However, utilizing illness severity scores may be useful to the clinician at the
bedside as well as the researcher. The major advantage to utilizing an illnesses severity tool
versus individual physical assessment and clinical judgment is that an instrument will assist the
individual in gathering more objective data. This in turn may help to improve the validity and
4
reliability of the data and therefore yield more useful information for the researcher and
clinician.
One area of promising research is focused on the provision of human milk and the
potential for neonatal health outcome improvement. Human milk is known as the optimal and
natural source of nutrition for all infants (Chung, Raman, Trikalinos, Lau, & Ip, 2008; de Jager,
Skouteris, Broadbent, Amir, & Mellor, 2012; Ip, Chung, Raman, Trikalinos, & Lau, 2009).
Specifically, the American Academy of Pediatrics (AAP) recommends human milk as the
optimal nutrition for high-risk neonates (Eidelman & Schanler, 2012; Gartner et al., 2005).
Benefits of human milk for these fragile infants may include: decreased risk of sepsis (Corpeleijn
et al., 2012), decreased necrotizing enterocolitis (Corpeleijn et al., 2012; Cristofalo et al., 2013),
decreased retinopathy of prematurity (Okamoto et al., 2007), decreased hospital re-admissions
(Vohr et al., 2007; Vohr et al., 2006), decreased neurodevelopmental disabilities (Vohr et al.,
2007; Vohr et al., 2006), quicker attainment of full enteral feeding (Eidelman & Schanler, 2012;
Schanler, 2007, 2011; Vohr et al., 2007) and earlier hospital discharge (Vohr et al., 2007).
Statement of the Problem
Human milk is known to provide benefits to very low birth weight and extremely low
birth weight infants; however, there is still a high rate of mortality and morbidity among these
vulnerable populations. Information is lacking in understanding the dose dependent relationship
that human milk has on mitigating illness severity in this vulnerable population. The purpose of
this study is to examine the relationship between the severity of illness and human milk
(mother’s own milk and donor human milk) volume intake in very low birth weight and
extremely low birth weight infants over the first six weeks of life.

5
Research Questions
This study addressed the following questions:
1. What is the relationship between mothers own milk (MOM) intake and neonatal
severity of illness for very low birth weight and extremely low birth weight infants
over the first six weeks of life?
2. What is the relationship between donor human milk (DHM) intake and neonatal
severity of illness for very low birth weight and extremely low birth weight infants
over the first six weeks of life?
3. What is the relationship between total human milk intake (THM) (combined total of
MOM and DHM) and neonatal severity of illness for very low birth weight and
extremely low birth weight infants over the first six weeks of life?
Definition of Relevant Terms
For the purpose of this study, the following terms are defined:
Very low birth weight – Newborns weighing less than 1500 grams at birth.
Extremely low birth weight – Newborns weighing less than 1000 grams at birth.
Infancy – The first year of life.
Infant mortality rate - The number of infants dying during the first year of life per 1,000 live
births per year in the United States.
Lactogenesis Stage II - The onset of mature milk production.
Preterm Human Milk – Human milk produced by a mother that delivered her baby prior to 37
completed weeks of gestation.
Preterm Neonate – A baby that is born prior to 37 completed weeks of gestation.
6
Total Human Milk Volume – The combined volume of mother’s own milk and donor human milk
reported in milliliters (mL).
Significance to Nursing
Human milk is known to provide the most optimal nutrition for VLBW and ELBW
infants (Eidelman & Schanler, 2012). However, nurse scientists are still seeking to understand
more about the volume of human milk intake required to produce statistically significant
differences in severity of illness for VLBW and ELBW infants. This study seeks to gain
additional supporting data to help nurse scientists to understand the relationship between human
milk volume intake and severity of illness. Known thresholds will help nurses to encourage
mothers to reach at least these minimal goals. The impact of this study will benefit the infant as
well as the entire family. A NICU admission is an extremely stressful event for a new mother.
The knowledge that a mother’s milk may potentially achieve better health outcomes for her baby
can be encouraging during this most distressing time.

7
CHAPTER TWO
REVIEW OF LITERATURE
Chapter two begins with a discussion of the conceptual framework utilized to construct
the proposed secondary data analysis. This is followed by an extensive literature review that was
conducted using search engines including: PubMed, Web of Knowledge, Cumulative Index to
Nursing and Allied Health Literature (CINAHL), and the Cochrane Database. Search terms in
the literature review included: very low birth weight infants, extremely low birth weight infants,
extreme prematurity, gestational age, human milk, donor human milk, maternal infection,
antenatal steroids, severity of illness, score for neonatal acute physiology, mean blood pressure,
temperature instability, partial pressure of arterial oxygen/fraction of inspired oxygen ratio
(PaO2/FIO2), oxygenation, respiratory instability, hemodynamic instability, serum pH, acid-base
balance, seizures, urine output, and renal injury/failure.
Conceptual Framework
Very low birth weight and extremely low birth weight neonates are some of the most
fragile patients among the NICU population (Blencowe et al., 2012). Nutritional support for this
fragile patient population is a major focus of care in the NICU. Human milk is known to be the
best source of nutrition for infants and is particularly beneficial for acutely ill neonates (Bhatia,
2013; Chung et al., 2008; de Jager et al., 2012; Eidelman & Schanler, 2012; Gartner et al., 2005;
Ip et al., 2009). In addition to the macro nutrient and micro nutrient content, human milk is a
unique food that contains bioactive components which help to strengthen the neonate’s immune
system (Bhatia, 2013). Furthermore, the nutritional content of human milk produced from a

8
mother of a premature neonate may differ from milk produced from a mother of a term neonate
in order to meet the increased nutritional needs of her premature baby (Bauer & Gerss, 2011).
Current literature supports that human milk has a positive effect on health outcomes for infants
including reduction of risk for common ailments for these premature infants such as necrotizing
enterocolitis (Cristofalo et al., 2013; Parker, 2013) and sepsis (Bhatia, 2013; Schanler, 2011). It
is likely that human milk may help to reduce illness severity over time. Specifically, a dose
dependent relationship may exist between the amount of human milk ingested and the change in
the neonatal illness severity over time. To date, no other known study has evaluated the
relationship between human milk volume intake and neonatal illness severity over time.
When considering the relationship between human milk volume intake and neonatal
severity of illness, one must consider other maternal or infant characteristics that may contribute
to the infant’s severity of illness risk. These maternal/infant dyad characteristics must be
controlled for including: antenatal steroid injections (Henderson, Hartmann, Newnham, &
Simmer, 2008; Morken, 2012), antenatal infection (Chiesa et al., 2003), gestational age, and birth
weight (Chiesa et al., 2003).
Figure 1. Conceptual Framework.
9
Human Milk
Human milk is recognized as the best source of nutrition for infants; and it is especially
important for vulnerable NICU populations such as VLBW and ELBW infants. Although
critically important, provision of human milk is not met without significant challenges including:
separation of the mother/infant dyad (Lee, Lee, & Kuo, 2009), delay and/or infrequent pumping
(Henderson et al., 2008; Smith, 2013), low milk volume (Henderson et al., 2008), physical breast
discomfort (Lee et al., 2009), maternal stress (Lee et al., 2009), and lack of adequate support
(Smith, 2013). It is important to recognize that these infants are some of the most critically ill
patients; and they are in need of the best nutrition available, mother’s own milk that has been
appropriately fortified. The breastfeeding challenges that VLBW and ELBW mother/infant
dyads face demands the attention of the healthcare team to increase lactation support so that this
vulnerable population has the best chance of receiving an exclusive human milk diet (Pineda,
2011; Vohr et al., 2007).
Benefits of human milk. The body of evidence regarding the benefits of human milk for
VLBW and ELBW babies is growing rapidly. The literature supports that the risk for many
common neonatal morbidities can be decreased with the provision of human milk including:
NEC (Contreras-Lemus et al., 1992; Cristofalo et al., 2013), urinary tract infection (Contreras-
Lemus et al., 1992; Corpeleijn et al., 2012), infectious diarrhea (Contreras-Lemus et al., 1992),
sepsis (Corpeleijn et al., 2012), respiratory illnesses (Vohr et al., 2007), and even death
(Corpeleijn et al., 2012). Human milk may also decrease the need for common interventions
such as antibiotic administration and blood transfusions (Contreras-Lemus et al., 1992). Finally,
human milk has been shown to help neonates achieve milestones sooner including the attainment
of full enteral feeds and earlier discharge from the NICU (Vohr et al., 2007).
10
Prevalence of the use of human milk. While human milk is known to have positive
health affects for VLBW and ELBW infants, in the absence of any medical contraindications, it
is ultimately the mothers’ choice whether she will provide human milk for her baby (Smith,
2013; Vohr et al., 2006). Mothers of VLBW and ELBW infants are encouraged to express
human milk for their babies. If the mother has an inadequate milk supply or does not wish to
express human milk for her baby, many NICUs are now providing the option of donor human
milk for these fragile infants. However, it is still ultimately the mothers’ decision if she will
express her milk or provide consent for donor human milk.
Breastfeeding initiation rates for these fragile infants range from 39.1% – 90% (Meier,
Engstrom, Mingolelli, Miracle, & Kiesling, 2004; Pineda, 2011; Smith, 2013; Vohr et al., 2006).
This is a very wide range and perhaps indicates that the health care providers and the culture of
the organization may affect the success of human milk provision for this population. Perrine and
Scanlon (2013) conducted a study with data accounting for 80% of the births in the US and
found that human milk provision in US NICUs is on the rise. In 2011, 30.8% of NICUs provided
human milk for the majority (>90%) of their patients and this is an upward trend from 2009
(26.7%) and 2007 (21.1%) (Perrine & Scanlon, 2013). They also found an increasing trend
(11.5% in 2007 to 22% in 2011) in U.S. NICUs utilizing donor milk. An international survey of
124 hospitals across Australia, New Zealand, Canada, Scandinavia, United Kingdom, and Ireland
reported that 48% of NICUs had access to donor human milk (Klingenberg, Embleton, Jacobs,
O'Connell, & Kuschel, 2012). Furthermore, it is interesting to note that 100% of the NICUs
surveyed in Scandinavia had access to donor milk (Klingenberg et al., 2012). Clearly, feeding
practices for preterm neonates vary greatly across the globe.

11
Human milk changes. Human lactation is a dynamic process and therefore the
nutritional content of human milk is continually changing (Agostoni et al., 2010). Human milk
changes from the beginning to the end of each feeding/pumping session (Bishara, Dunn, Merko,
& Darling, 2008). Human milk also changes across the stages of lactation: colostrum,
transitional milk and mature milk (Bauer & Gerss, 2011).
Recently, additional evidence has been provided of changes in preterm milk over time by
He, Sun, Quan, and Wang (2014); however, this article was only available in Chinese and
therefore only the abstract could be reviewed. It is also critical to consider the potential
differences between human milk produced by mothers that delivered preterm infants and human
milk produced by mothers of term infants. While some studies have demonstrated that preterm
milk is different than term milk (Bauer & Gerss, 2011; Dempsey & Miletin, 2010), a recent
study did not produce similar results (Hsu et al., 2014).
Donor human milk. Donor human milk is recommended by the AAP as the alternative
when mother’s own milk is not available or it is medically contraindicated (Eidelman &
Schanler, 2012). Donor human milk is a commodity that is donated by mothers and is then
processed by human milk banks to ensure the safety of the donor milk that is provided for the
recipient infants (Carroll, 2014). Although freezing and Holder pasteurization are important for
milk safety, it may affect the non-nutritive/ bioactive components in the milk. However, a recent
study provided reassuring evidence that not all bioactive components are eliminated in donor
human milk (Groer et al., 2014). This is critically important as these non-nutritive, bioactive
components are only found in human milk.
One concern that has been raised with donor human milk provision is the decreased
growth patterns as compared to formula fed infants (Quigley & McGuire, 2014). One strategy to

12
improve growth patterns with donor human milk is to utilize preterm donor human milk versus
term donor human milk due to the potential variation in the milk biology. The first challenge
with this strategy is that many milk banks do not supply preterm human milk. Of the milk banks
that do provide this service, the volume of preterm donor milk is very limited (Dempsey &
Miletin, 2010). These challenges also impact research that seeks to compare outcomes for
VLBW infants provided either term or preterm donor human milk. In 2010 (Dempsey &
Miletin), a Cochrane review indicated that no studies met inclusion criteria to provide evidence
comparing neonatal outcomes with regards to term and preterm donor human milk. Despite the
concern with decreased short-term growth patterns, the evidence still supports the use of donor
human milk because of the decreased risk of NEC as compared to formula fed groups (Quigley
& McGuire, 2014).
Dose dependent relationship. The literature has demonstrated a dose dependent
relationship between the amount of human milk ingested and positive health outcomes for
infants (Corpeleijn et al., 2012; Vohr et al., 2007; Vohr et al., 2006). Specifically, Vohr et al.
(2006) and Vohr et al. (2007) demonstrated that for every 10mL/kg per day of breastmilk,
corresponding health effects would be noted. Corpeleijn et.al. (2012) noted positive health
effects with any amount of human milk intake during the first 5 days of life; however during the
days of life, six through ten, at least 50% of the infant’s diet needed to consist of their mothers
own milk (MOM) to demonstrate positive health outcomes (HR=0.37, 95% CI 0.22, 0.65).
Additional research is needed in this area to determine exact thresholds where breastfeeding
exerts maximal benefit for the infant.
13
Maternal/Infant Characteristics
The main focus of this study is to examine the relationship between human milk volume
intake and neonatal severity of illness. It is important to consider variables that may also affect
this relationship. The following section reviews variables that may influence neonatal illness
severity, human milk volume intake, or both.
Antenatal steroids. Antenatal steroids are frequently administered to obstetrical patients
when preterm delivery is anticipated in order to promote fetal lung maturity. The more mature
the fetal lungs are, the less severity of illness one would anticipate. Antenatal steroid
administration has been shown to reduce the risk of respiratory morbidities in neonates (Bartels,
Kreienbrock, Dammann, Wenzlaff, & Poets, 2005; Corchia et al., 2013) and hypotension
requiring medical intervention (Fanaroff & Fanaroff, 2006). It is interesting to note that steroids
may also be administered to a small number of infants in the postnatal period as a treatment for
hypotension (Fanaroff & Fanaroff, 2006) as well as the prevention or treatment of chronic lung
disease (Doyle, Ehrenkranz, & Halliday, 2014a, 2014b). A final consideration of antenatal
steroids is their potential effect of delaying lactogenesis stage II (full milk production) and
therefore decreasing the mothers’ milk volume that is available for her fragile infant (Henderson
et al., 2008).
Maternal infection. Maternal infections are often accompanied by an increase in
neonatal morbidities and increase in severity of illness in infants (Alexander, Gilstrap, Cox,
McIntire, & Leveno, 1998). Risk factors for infection include: administration of antenatal
antibiotics, maternal fever, uterine tenderness, foul odor at delivery, fetal/maternal tachycardia,
premature rupture of membranes, and diagnosis of chorioamnionitis. Neonatal morbidities

14
associated with maternal infection include: lower gestational age at birth, low five minute Apgar
score, and sepsis (Alexander et al., 1998; Hornik et al., 2012).
Birth weight and gestational age. Birth weight and gestational age are both important
to consider when assessing for the risk of severity of illness. Clearly the smallest and most
immature babies have some of the highest risks of morbidity and mortality among the infant
population (Ambalavanan et al., 2012).
Birth weight has been used as a proxy for severity of illness as it explains some of the
risks attributable to these infants (Richardson, Gray, McCormick, Workman, & Goldmann, 1993;
Richardson, Phibbs, et al., 1993). The relationship between birth weight and illness
severity/mortality is inverse. As birth weight decreases, risk for morbidity and mortality
increases. Mortality is almost certain when birth weight is below 500 grams (Richardson,
Phibbs, et al., 1993). Lower birth weight and lower gestational age has been associated with
increased risk of mortality (Davis et al., 2010; Richardson, Phibbs, et al., 1993; Subhedar, Tan,
Sweeney, & Shaw, 2000). Furthermore, if the infant is small for gestational age, the mortality
risk increases 2.5 fold (Bartels et al., 2005). Lower birth weight and lower gestational age has
also been associated with increased morbidity including: neurodevelopmental impairment (Davis
et al., 2010), symptomatic hypotension (Fanaroff & Fanaroff, 2006), retinopathy of prematurity
(Hauspurg et al., 2011), and seizures (Davis et al., 2010). In contrast, higher birth weight has
been associated with improved outcomes (Meyn, Ness, Ambalavanan, & Carlo, 2010).
Neonatal Severity of Illness
Severity of illness is a concept used to describe how acutely ill and physiologically
unstable an infant is currently, as well as to create a prediction of future morbidity and mortality
risk (Richardson et al., 2001). Very low birth weight and extremely low birth weight infants are

15
at tremendous risk for physiologic instability and mortality (Ambalavanan et al., 2012). Mean
blood pressure, temperature instability, PaO2/FiO2 ratio, serum pH, presence of multiple seizures
and urine output all may be signs of severity of illness. Research instruments have been used
extensively in NICUs to measure the concept of neonatal severity of illness including the revised
Score for Neonatal Acute Physiology (SNAP-II).
History of the development of the SNAP-II instrument. The original score for
neonatal acute physiology (SNAP) and score for neonatal acute physiology perinatal extension
(SNAP-PE) was published in 1993; however, it was a lengthy and time-consuming instrument.
Therefore in 2001, Richardson et al. created a more parsimonious tool with the second versions
of SNAP-II and SNAPPE-II. The Score for Neonatal Acute Physiology (SNAP-II) is an
instrument designed to measure illness severity and predict mortality in the neonatal population.
It was initially developed as a measurement tool for the day of admission; however, some studies
have used it sequentially during the NICU stay (Lim & Rozycki, 2008). The SNAPPE-II
instrument is a further development of the SNAP-II score including invariant measures such as:
APGAR, birth weight, and small for gestational age. The SNAPPE-II was measured for the
parent study, but it cannot be used as a sequential measure, therefore it was not used for this
proposed secondary data analysis.
Utilization of SNAP-II. The SNAP-II instrument has been used in research studies to
operationalize neonatal illness severity across four continents including: North America (Brindle,
Ma, & Skarsgard, 2010; Chien et al., 2001; Chien et al., 2002; Coleman et al., 2013; Dammann
et al., 2010; Dammann et al., 2009; Lam, Claydon, Mitton, & Skarsgard, 2006; Lee et al., 2003;
Lim & Rozycki, 2008; Madan, Fiascone, Balasubramanian, Griffith, & Hagadorn, 2008; Mills,
Lin, Macnab, & Skarsgard, 2010; Nasr & Langer, 2011; Richardson et al., 2001; Skarsgard,
16
MacNab, Qiu, Little, & Lee, 2005; Soraisham, Singhal, McMillan, Sauve, & Lee, 2009; Stanger,
Mohajerani, & Skarsgard, 2014; Wilson et al., 2013; Wong et al., 2013; Zupancic et al., 2007;
Zwicker et al., 2013), South America (Lucas da Silva, Euzebio de Aguiar, & Reis, 2012; Zardo
& Procianoy, 2003), Asia (Kadivar, Sagheb, Bavafa, Moghadam, & Eshrati, 2007; Ma et al.,
2010; Mathur & Arora, 2007; Nakwan, Nakwan, & Wannaro, 2011; Sundaram, Dutta,
Ahluwalia, & Narang, 2009), and Europe (Capasso et al., 2013; De Felice et al., 2005; Figueras-
Aloy et al., 2003; Figueras-Aloy et al., 2004; Figueras-Aloy et al., 2007; Iacobelli et al., 2013;
Miletin, Pichova, Doyle, & Dempsey, 2010; ter Horst, Jongbloed-Pereboom, van Eykern, & Bos,
2011). The SNAP-II has commonly been used to assess baseline neonatal severity of illness and
establish morbidity/mortality risk by using physiologic data from the first 12 hours of life.
However, some studies have expanded this assessment window to the first 24 hours of life
(Coleman et al., 2013; ter Horst et al., 2011; Zwicker et al., 2013). Although less frequently, this
instrument has also been used to measure neonatal illness severity at other time points including:
after neonatal transport (Lucas da Silva et al., 2012; Mathur & Arora, 2007), sepsis (Sundaram et
al., 2009), and finally assessing the SNAP-II score during at the highest time of clinical illness
(Figueras-Aloy et al., 2003; Figueras-Aloy et al., 2004; Figueras-Aloy et al., 2007).
The vast majority of studies have used the SNAP-II score as a single measure, usually
establishing the neonates’ baseline risk at birth; however, the concept of physiologic instability
has the ability to change continually. Therefore conceptually, this concept could be measured at
birth, at later time points, as well as sequentially during a hospitalization. To date, only two
studies have used the SNAP-II instrument to measure neonatal illness severity over time (Lim &
Rozycki, 2008; Madan et al., 2008). One study measured initial illness severity at birth and then
again with the timing of a medication treatment (Madan et al., 2008); while the other study
17
measured daily SNAP-II scores over the course of the NICU length of stay (Lim & Rozycki,
2008). The authors did not find relationships between severity of illness scores and morbidity as
expected and therefore advised caution when utilizing the SNAP-II instrument sequentially.
While the validity of the SNAP-II instrument has been supported in many studies as a
measurement of baseline risk, little is known about this instrument’s ability to be used as a
sequential measure. Although the two studies that used the SNAP-II instrument sequentially
advised caution when using this instrument sequentially; these data are limited and warrant
further investigation.
Mean blood pressure. Mean arterial blood pressure (MAP) is a routine vital sign used
to assess perfusion in all NICU populations including VLBW and ELBW infants. These infants
are especially prone to hypotension as compared to their more mature counterparts (Fanaroff &
Fanaroff, 2006; Laughon et al., 2007; Martens et al., 2003; Sehgal et al., 2012). The treatment
rates for hypotension range from 29% - 93% (Fanaroff & Fanaroff, 2006; Laughon et al., 2007),
and the incidence of hypotension decreases as their gestational age increases (Laughon et al.,
2007). Although this measurement is utilized on a routine basis to asses illness severity, there is
no standard definition for hypotension in these small, fragile infants (Fanaroff & Fanaroff, 2006;
Laughon et al., 2007; Logan, O'Shea, Allred, Laughon, Bose, Dammann, Batton, Engelke, et al.,
2011; Sehgal et al., 2012). Therefore clinicians and researchers have defined it in various ways
including: initiation of hypotensive treatments by providers (Fanaroff & Fanaroff, 2006), MAP
less than 30 mmHg (Martens et al., 2003), and a three part definition (lowest MAP in the lowest
quartile for the corresponding gestational age, treatment with vasopressor, blood pressure
lability) (Logan, O'Shea, Allred, Laughon, Bose, Dammann, Batton, Engelke, et al., 2011;
Logan, O'Shea, Allred, Laughon, Bose, Dammann, Batton, Kuban, et al., 2011). Hypotension is

18
an important severity of illness sign as it has been associated with increased risk of mortality
(Fanaroff & Fanaroff, 2006; Martens et al., 2003) and may be associated with neurological
morbidity (Martens et al., 2003); however some studies have failed to demonstrate this (Logan,
O'Shea, Allred, Laughon, Bose, Dammann, Batton, Engelke, et al., 2011; Logan, O'Shea, Allred,
Laughon, Bose, Dammann, Batton, Kuban, et al., 2011).
Temperature instability. Temperature is another physiologic indicator that can provide
information on the severity of the infant’s condition. Very low birth weight and extremely low
birth weight infants are especially at risk for temperature instability due to their large body
surface area, thin epidermal layers, limited amount of insulating fat, and increased peripheral
blood flow (Mok, Bass, Ducker, & McIntosh, 1991). Interventions used to mitigate this risk
include the use of pre-warmed blankets, radiant heat, and utilization of a plastic bag with a hole
cut for the head and covering the infant’s body to prevent evaporative heat loss for the tiniest
babies that cannot be dried at birth without skin damage (Fuchs et al., 2012).
Research has demonstrated that hypothermia is associated with an increased risk of
mortality in these fragile infants (Bartels et al., 2005; Garcia-Munoz Rodrigo, Rivero Rodriguez,
& Siles Quesada, 2013). Specifically, Bartels, Kreinenbrock, Dammann, Wenzlaff and Poets
(2005) found this association at a temperature of less than 35.5°C, while Garcia-Munoz Rodrigo
et al. (2013) demonstrated this risk at a temperature of less than 36°C. Hypothermia and
temperature instability has also been associated with several other common neonatal morbidities
including: intraventricular hemorrhage (Bartels et al., 2005; Garcia-Munoz Rodrigo et al., 2013),
respiratory distress syndrome (Bartels et al., 2005; Mok et al., 1991), and sepsis (Tamim,
Alesseh, & Aziz, 2003).

19
Partial pressure of arterial oxygen (PaO2) /Fraction of inspired oxygen (FiO2) ratio.
Oxygenation is the most basic need for every human being and VLBW/ELBW infants are
especially at risk for respiratory decompensation (Clark et al., 2013). If adequate gas exchange
fails to occur, the infant’s severity of illness increases rapidly and will lead to morbidity and
eventually mortality without prompt intervention (Clark et al., 2013). The greatest initial risk for
respiratory severity of illness in this premature population has been linked to the lack of adequate
surfactant in premature lungs at birth (Avery & Mead, 1959; Fujiwara et al., 1980).
Although the most frequently used, non-invasive, clinical measure of oxygenation status
is oxygen saturation (SpO2) (Iyer & Mhanna, 2013), a more precise measurement is needed to
determine severity of illness (Fuchs et al., 2012; Iyer & Mhanna, 2013). The oxygenation ratio
(PaO2/FiO2) has been used in several studies as an indicator of severity of illness (Ammari et al.,
2005; Halbertsma, Vaneker, Pickkers, & Hoeven, 2009).
The oxygenation ratio (OR) is a mathematical calculation from two values: the partial
pressure of arterial oxygen (PaO2) and the fraction of inspired oxygen (FiO2). The PaO2 is a
value obtained from an arterial blood gas (ABG), which is an invasive measure yet the ABG
remains the gold standard to obtain information on oxygenation status and severity of illness
(Fuchs et al., 2012; Iyer & Mhanna, 2013). Although this measure is more precise, the
disadvantage is that arterial blood gases are invasive and multiple lab draws put these tiny infants
at risk for iatrogenic anemia (Kirpalani et al., 2006). FiO2 is the concentration or percentage of
oxygen being delivered to the infant. FiO2 is titrated from 21% (room air) up to 100% to meet
the infant’s respiratory needs (Fuchs et al., 2012). Nurses play an important role in the oxygen
titration process, which is critical in order to avoid periods of hypoxia and hyperoxia (Fuchs et
al., 2012; Sink, Hope, & Hagadorn, 2011), which potentially may lead to iatrogenic injuries such
20
as retinopathy of prematurity (Chen et al., 2011; Hauspurg et al., 2011). The higher the
concentration of oxygen needed to maintain adequate oxygenation, the greater the severity of
illness (Ammari et al., 2005).
As nurses and providers work to mitigate the increasing risks that accompany increasing
severity of illness, consequences and risks of treatments must be acknowledged. For example,
mechanical ventilation is needed for many of these infants; however, it is not without risk (Aly,
Hammad, Essers, & Wung, 2012). Newer, less invasive options such as continuous positive
airway pressure (CPAP) are being utilized (Ammari et al., 2005) and may decrease some of these
risks.
Serum pH. Serum pH indicates the presence of acidosis, alkalosis, or a pH within the
normal range. One measure of intrapartum risk for the neonate utilizes arterial pH from a cord
blood sample obtained at birth (Malin, Morris, & Khan, 2010). This laboratory measure is often
taken only for neonates that are considered at high risk for neonatal asphyxia at birth; however,
Malin, Morris and Khan (2010) are advocates that cord blood samples be assessed more
routinely and be used as an outcome measure for the intrapartum period and beyond as research
has demonstrated an increased risk of morbidity for those neonates born with a low cord pH.
Subsequent neonatal arterial blood gasses are routinely used in the NICU to assess ongoing acid
base balance. These values also determine oxygenation status and are utilized to adjust
ventilator settings in order to keep the pH normal.
As mentioned above, research has also indicated an abnormal pH being associated with
increased morbidity risk for infants. For example, a common morbidity of ELBW and VLBW
infants is retinopathy of prematurity Horodynski et al. (2007). It is well known that ROP is
associated with high PaO2 levels; however, Hauspurg et al. (2011) showed that there is also an

21
association between ROP and a low pH and high PCO2. Another concern of interest is that a
combination of hyperoxia and acidemia upon admission to the NICU may increase the risk of
hypoxic ischemic encephalopathy (Kapadia et al., 2013). Clearly, infants that are unable to
maintain homeostasis are more ill. Interventions targeting acid base balance are critical for this
population.
Presence of multiple seizures. Neonatal seizures, especially repetitive seizures are of
concern and have been associated with an increase in illness severity, neurodevelopmental
impairment, as well as mortality risk in premature infants (Davis et al., 2010). Due to the
immature neurological system of these infants, seizure activity is often subtle and therefore may
go undetected by clinicians without the use of an electroencephalogram (EEG) (Murray et al.,
2008).
A common cause of neonatal seizures is birth asphyxia. Some clinicians may routinely
order prophylactic anticonvulsants for these infants to prevent seizures; however, Evans, Levene,
and Tsakmakis (2007) warn that there is not enough information at this time to routinely advise
this practice. A more recent treatment that has emerged for neonatal seizures is therapeutic
hypothermia. This whole body cooling treatment has been associated with a reduction in
neonatal seizures (Bonifacio et al., 2011; Meyn et al., 2010; Srinivasakumar et al., 2013).
Specifically, Srinivasakumar et al. (2013) noted a reduction in seizures only for those infants
with moderate hypoxic ischemic encephalopathy (HIE); whereas, Bonifacio et al. (2011) noted a
reduction for moderate as well as severe HIE.
Urine output. Urine output, or specifically a decrease in urine output indicates a
decrease in renal function usually due to acute kidney injury (AKI). A common cause of AKI in
neonates is end organ damage caused by perinatal/birth asphyxia (Bezerra, Vaz Cunha, &

22
Liborio, 2013; Karlowicz & Adelman, 1995; Kaur et al., 2011). Other causes of AKI in this
population may include hypotension (Ikegami et al., 2010; Viswanathan, Manyam, Azhibekov,
& Mhanna, 2012) and incomplete maturation of the premature kidney (Cataldi et al., 2005).
Urine output is utilized routinely as a measure of illness severity in NICU care as it has
been associated with an increased risk of mortality (Bezerra et al., 2013; Viswanathan et al.,
2012). Although urine output is easily measured with or without an indwelling catheter, it is
fraught with potential error from chart review calculations and/or missing data entries
(Richardson et al., 2001; Sutton et al., 2002).
The greatest challenge with this measure is the lack of a consistent definition and the
limited amount of evidence informing the operational definition of AKI in the VLBW and
ELBW infant population (Akcan-Arikan et al., 2007; Cataldi et al., 2005; Viswanathan et al.,
2012). Most definitions for AKI include parameters for urine output as well as serum creatinine.
Various studies have used urine outputs ranging from 0.5 mL/kg/h to less than 1.5 mL/kg/h as an
indication of AKI (Bezerra et al., 2013; Karlowicz & Adelman, 1995; Viswanathan et al., 2012).
It is also critical to note that although decreased urine output indicates renal compromise, many
neonates have AKI without oliguria (Bezerra et al., 2013; Karlowicz & Adelman, 1995;
Viswanathan et al., 2012). Current research is focused on defining classification systems for
AKI in neonatal populations so that the language used is universal and data from various studies
can be compared (Bezerra et al., 2013).
Summary
Clearly, the needs of VLBW and ELBW neonates have been an important focus in recent
nursing and medical research. The literature undeniably supports that these newborns are fragile
and that they are at greater risk for morbidity and mortality as compared to infants born at a
23
normal birth weight. These babies are acutely ill and require extended intensive care due to their
ongoing severity of illness over the weeks and months following their birth.
The literature is also clear that human milk, including mother’s own milk and donor
human milk contains bioactive components that are helpful in strengthening the immune system
of these fragile infants. This is believed to be the reason that human milk helps to mitigate some
of the risks for mortality and common morbidities that this population faces.
Although a plethora of research has focused on this population, there are still gaps in the
literature. More knowledge is needed in the area of dose specific amounts of mother’s own milk,
donor human milk, or the combination of these enteral foods that are needed to impact neonatal
illness severity. Specifically, more knowledge is needed to understand the relationships between
neonatal severity of illness and the volume of human milk intake by VLBW and ELBW infants.
This study seeks to provide evidence on the relationship between specific amounts of human
milk and the ongoing weekly affect on the neonatal severity of illness for VLBW and ELBW
babies over the first six weeks of life in the neonatal intensive care unit.

24
CHAPTER THREE
METHOD
This chapter provides details regarding the study design, the study setting, as well as
describes the population of interest and the recruitment procedures for the study sample. All
study variables are operationalized and the SNAP-II instrument is discussed in detail.
Procedures are outlined including the process for institutional approvals, recruitment of
participants, and data collection. Finally, the plan for the data analysis specific to each aim of
the study concludes this chapter.
Research Design
This research study was a secondary data analysis that used longitudinal data from an
NIH funded (2012-2015), R21 exploratory study. The parent study sought to investigate the
quantitative amounts of immunobiological components ingested via human milk, and the
possible associations with enteral health, skin immunity, and clinical outcomes for VLBW and
ELBW infants. The principal investigator of the primary study, Dr. Maureen Groer, provided
initial approval for this secondary data analysis. An IRB application was submitted, however the
University of South Florida IRB determined this secondary data analysis did not meet the
definition of human subject research and provided a letter of determination indicating that IRB
approval was not needed for this secondary data analysis (See Appendix A).
The purpose of this study was to explore the relationship between human milk volume
intake and severity of illness in very low birth weight and extremely low birth weight infants.
Because human milk has been linked to improvement of infant health outcomes, this study
25
sought to explore the possible impact of human milk on the severity of illness over the first six
weeks of life for this vulnerable population. Although the parent study collected severity of
illness scores each week for the first six weeks, the parent study is only utilizing the initial
severity of illness measure (SNAP-II) in their analysis; however, this secondary data analysis
explored the weekly changes in severity of illness (SNAP-II) for the six-week duration of the
parent study.
Setting
The parent study took place in a tertiary care medical center that is affiliated with the
University of South Florida. Specifically, the study site was an 82 bed, level three, neonatal
intensive care unit.
Population and Sample
The target population for the parent study included mother/infant dyads admitted to the
NICU with a birth weight between 750 and 1500 grams with mothers who intended to provide
human milk as a nutritional source for the infant. Research participants were recruited by one of
two-nurse research coordinators employed by the affiliated hospital. NIH funding for the parent
study provided partial salary compensation for the research coordinators. Mother/infant dyads
were screened upon admission to the NICU by the research coordinators. They approached
dyads meeting study inclusion/exclusion criteria and provided information about the study.
Inclusion criteria for the parent study included: infants of all ethnicities and genders that were
admitted to the NICU with a birth weight between 750 – 1500 grams. Exclusion criteria for
mothers included: HIV infections, autoimmune disease, long-term steroid use, and
immunosuppressive medication use. Exclusion criteria for infants included: significant
congenital anomalies, hereditary disease, requiring immediate surgery and moribund infants.

26
After eligibility was determined, the research coordinator met with the mother and provided
information about the study to obtain informed consent. Mothers were provided with a $50 gift
card honorarium for participating in the study. Power analytic strategies indicated that a goal of
75 participants was adequate for the parent study. Therefore, the final recruitment goal was 100
participants to allow for possible study attrition.
Measures (Instruments)
The dependent variable of interest in this secondary analysis was neonatal severity of
illness. Neonatal severity of illness was operationalized via the score for neonatal acute
physiology, version two (SNAP-II). Each of the independent variables was obtained via a
prospective chart review during the parent study.
SNAP-II. The SNAP-II score was calculated using six variables including: mean blood
pressure, lowest temperature, PaO 2 (mmHg) / FIO 2 (%), lowest serum pH, presence of multiple
seizures, and urine output (mL/kg.h) (Richardson et al., 2001) (See Appendix B).
The SNAP-II is a summative rating scale measurement instrument that provides a
continuous level of measurement total score that ranges from 0-115. A higher score indicates an
infant that is more acutely ill. This instrument includes six sub scales that provide an ordinal
level of measurement including: mean blood pressure (0-19 points), lowest temperature (0-15
points), PO2/FIO2 (0-28 points), serum pH (0-16), presence of multiple seizures (0-19 points),
and urine output (0-18 points) (Richardson et al., 2001) (See Appendix B). The SNAP-II scores
were collected within 12 hours of birth and then weekly for six weeks.
Criterion validity was demonstrated by a Pearson correlation for all birth weights
(r=0.91) and (r =0.90) for < 1500 grams between the SNAP-PE and the SNAPPE-II.
Discrimination of the SNAPPE-II was assessed using the area under the receiver operator curve

27
(AUC) for all birth weights (0.91 ± 0.01) and for birth weights <1500 grams (0.85 ± 0.01). This
demonstrated good discrimination as 1.0 equals a perfect score and 0.5 means that it is
completely random. The Hosmer-Lemeshow goodness of fit test for the SNAPPE-II was 0.9 for
all birth weights and 0.86 for < 1500 grams (Richardson et al., 2001). In 2007, Zupancic et al.
provided further validity data specifically for the SNAP-II including: AUC 0.86 ± 0.01 for all
births and 0.82 ± 0.01 for infants < 1500 grams and Hosmer-Lemeshow goodness of fit 0.336 for
all birth weights and 0.768 for < 1500 grams. No reliability data were reported with either study.
Human milk volume. Human milk volume was the major independent variable of
interest. Exact milk intake, in milliliters (mL), was routinely documented in the healthcare
record for every feeding in the NICU. A research assistant calculated weekly totals of human
milk volume intake via chart review. Human milk was calculated for four categories including:
expressed breast milk (EBM), expressed breast milk with human milk fortifier (EBM-HMF),
donor human milk (DHM), and donor human milk with human milk fortifier (DHM-HMF).
Aliquots of milk samples (0.5 mL) were obtained by the nurse from each batch of the
mother’s own milk and separately from each batch of donor human milk for the study period of
six weeks or upon discharge. The human milk samples were collected using one mL needleless
syringes, labeled, and frozen at -20°C. One to two times per week, specimens were transported
on ice to the USF biobehavioral lab where they were stored at -80°C until processing.
Processing milk samples included thawing of the aliquots and combining milk samples to create
weekly-pooled milk specimens for laboratory testing for the parent study.
All donor human milk used in this study was purchased by the study NICU from two
non-profit milk banks in northern Texas. Therefore the DHM went through the standard human
milk bank processing procedures to ensure the safety of the human donor milk including: donor

28
screening, holder pasteurization, and quality control testing. While many human milk banks
only accept term human milk donations, one of the milk bank suppliers for study NICU accepted
preterm milk donations as well. Finally, pooled milk samples from multiple donors were
shipped frozen to the NICU. Milk was then thawed and distributed to the recipient infants.
Demographic data form. Finally, a demographic data form was completed for each
participant in the parent study. Information utilized for the secondary data analysis included
race, ethnicity, maternal age, socioeconomic status, and educational level. Mothers expected to
deliver prematurely should have received two doses of antenatal steroids for fetal lung maturity.
Depending on the amount of time prior to the premature delivery of the infant, the mother may
have received one or more doses prior to delivery. The parent data set included if any steroids
were provided to the mother, therefore this was a dichotomous independent variable. Maternal
infection data were also collected. Specifically, the infection of concern was a maternal
diagnosis of chorioamnionitis at the time of her hospitalization and premature delivery. This was
also a dichotomous independent variable. Both of these maternal factors were independent
variables collected via chart review and recorded on the demographic data form. Finally, infant
birth weight and gestational age were both important infant factors to consider. However, due to
the expected high collinearity between these two variables, only birth weight was included as a
control variable. Birth weight was a continuous, independent variable collected via prospective
chart review during the parent study.
Procedures
Dr. Maureen Groer, principal investigator (PI), granted the initial approval for this
secondary data analysis. The Tampa General Hospital (TGH) and University of South Florida
(USF) IRBs approved the parent study. An IRB application was submitted, however the
29
University of South Florida IRB determined this secondary data analysis did not meet the
definition of human subject research and provided a letter of determination indicating that IRB
approval was not needed for this secondary data analysis (See Appendix A). The parent study
included funded and non-funded research team members including: three neonatologists, two
statisticians, three TGH research nurse coordinators, and three research assistants. Upon
initiation of the parent study, the parent study PI met with all study personal to ensure each
person understood his/her role. The parent study PI also met with the NICU staff nurses to
explain the study and provide an opportunity for questions to be addressed.
Recruitment for the parent study was completed by the TGH NICU research nurse
coordinators. The research nurse coordinators screened maternal/infant dyads each weekday for
study eligibility upon admission to the NICU for the duration of the three year recruitment
period. TGH research nurse coordinators spent time with each eligible dyad to discuss the
research study and complete the informed consent process.
Data collection started with the mother completing a demographic data form. The TGH
research nurse coordinators collected the forms and ensured that the demographic data form was
complete. The completed demographic data forms were picked up by a research assistant one to
two times per week. Data were entered into SPSS and kept on a secure USF network. The
identifying information was kept on an Excel spreadsheet in a paper and electronic format that is
in a locked cabinet in a locked office. Research assistants retrieved additional data via chart
review. Exact volumes of human milk intake per feeding were charted routinely by NICU
nurses. Research assistants totaled weekly milk volumes consumed by the infants. Research
assistants also collected data from the chart to assign the initial SNAP-II score within 12 hours of
30
birth as well as sequential SNAP-II scores each week for the six weeks of the study. All data
points were entered into SPSS for data analysis.
Data Analysis
Data analysis began by performing descriptive statistics (means, standard deviations,
frequencies, and percentages) of the demographic data. Data were examined for outliers,
missing data, and normal distribution. If skewness or kurtosis was present, then data were
transformed based on the distribution of the data. Next, level one data were aggregated and
means for infants were used to calculate Pearson’s product moment correlations between milk
volume, SNAP-II scores, and maternal/infant characteristics. The initial correlations provided
information for multilevel models.
Multilevel modeling was used to compare growth models for the best fitting model
including linear, quadratic, cubic, and piecewise trends. Model fit was evaluated using chi-
square (χ2) and goodness of fit testing including Akaike Information Criterion (AIC) and
Bayesian Information Criterion (BIC). A smaller AIC and BIC were desirable to demonstrate
the best fitting model. For the model comparison between two nested models using chi-square
difference tests, a statistically significant chi-square difference indicated a better fit of a more
complex model with less degrees of freedom. The piecewise model demonstrated the best fit and
was used as a base model to systematically add level one and level two independent variables to
the model. Finally, birth weight, a proxy for illness severity in the literature, was added as a
control to the models that demonstrated a statistically significant relationship between severity of
illness and human milk. Ultimately, the goal was to have a model that explained the greatest
amount of variance while still maintaining a parsimonious model. SPSS statistical software
(IBM SPSS Statistics 22) was used for all statistical data analysis.

31
The current study used multilevel modeling to explore the relationship between total
human milk volume, maternal/infant dyad characteristics, and severity of illness in VLBW and
ELBW infants during the first six weeks of life. Multilevel modeling was optimal because it
allowed for repeated measures that took place weekly for six weeks. Multilevel modeling also
allowed for some missing data points which often occurs with repeated measure studies
(Tabachnick & Fidell, 2013).
The multilevel model study design is illustrated in Figure 2. This figure defines each of
the independent variables including specific maternal/infant dyad characteristics that were
controlled for in this model. The weekly time points and weekly cumulative mother’s own milk
(MOM), donor human milk (DHM), and total human milk (THM) volume were all level one
independent variables because they changed weekly. Birth weight, antenatal steroids, and
maternal infection were level two independent variables as they remained constant throughout
the six-week study period.
Figure 2. Study Design. MOM = Mother’s Own Milk; DHM = Donor Human Milk; THM = Total Human Milk.

32
CHAPTER FOUR
RESULTS
Preliminary Analyses
Outliers, missing data and normality. The parent study recruited a total of 95
participants that included 73 singletons and 22 multiples. Since twins and triplets shared the
same gestation and mother, they would not provide a source of independent data; therefore
random selection was used to include only one neonate from each multiple gestation pregnancy.
This reduced the sample size to 85. Initial analysis revealed six neonates had partial missing
data including: eight SNAP-II scores and corresponding weekly milk intake volumes (two at
birth, two at week five of life and four at week six of life). However, by using the multilevel
modeling techniques, inclusion of all collected data was possible for these cases. One additional
neonate was removed from the study because although initial demographic data were collected,
no other data for the six weeks of the study were collected for this infant.
Although the study sample included neonates at risk for illness due to their very low birth
weight and admission to the neonatal intensive care unit, initial analysis revealed that the
dependent variable of interest, severity of illness, was not demonstrated as evidenced by a
SNAP-II score of zero at every time point in the study. This may be partially due to the
advances in perinatal care over the past few decades; however, including neonates that did not
demonstrate evidence of illness severity would blunt the effects of the remaining study sample
that did demonstrate illness severity via the SNAP-II instrument. Therefore neonates that earned
33
a SNAP-II score of zero for all time points (n=17) were removed from the analysis providing a
final sample size of 67 neonates in this secondary data analysis.
Description of the sample. All of the research participants were premature neonates with
gestational ages ranging from 24 to 32 weeks and six days (M= 27.86, SD =1.89) gestation.
According to the inclusion criteria all neonates were less than 1,500 grams and the study sample
ranged from 600 grams to 1,485 grams (M= 1064, SD =217.37). The majority of the neonates
(58.2%, n=39) were very low birth weight and 41.8% (n=28) were extremely low birth weight.
The study sample was racially and ethnically diverse. Equal numbers of Caucasian
(32.8%, n=22) and African American (32.8%, n=22) mothers were represented. Fathers were
similar, but there were a few more African Americans (37.3%, n=25). Hispanic ethnicity was
also represented in this sample with 22.4% (n=15) self-identifying as Hispanic White and 1.5%
(n=1) as Hispanic Black. The remaining sample consisted of various races including:
Asian/Pacific Islander, Native American, or other. See Table 1 below for parental self-reported
race/ethnicity data.
The maternal age ranged from 15 to 46 years with a mean of 28 years. More than half of
the mothers completed high school (55.2%, n=37) and an additional 28.4% (n=19) of the
mothers completed a college or post-graduate degree. The remaining 11 mothers indicated that
they completed middle school (10.4%, n=7) or grammar school (6%, n=4).
Self-reported income amounts were diverse and ranged from under $4,999 and up to
$70,000 and beyond. However, almost three-quarters of the sample (71.6%, n=48) indicated that
they made $39,999 or less. Two mothers (3%) indicated that they earned between $40,000 -
$69,999 and eight mothers indicated an income at $70,000 and beyond. It was also noted that
nine participants (13.4%) chose not to disclose their income level.

34
Table 1
Race/Ethnicity
Maternal
n / % Paternal
n / %
Caucasian 22 (32.8%) 17 (25.4%) African American 22 (32.8%) 25 (37.3%) Hispanic White 15 (22.4%) 18 (26.9%) Other 5 (7.5%) 4 (6.0%) Asian/Pacific Islander 2 (3.0%) 0 (0%) Hispanic Black 1 (1.5%) 1 (1.5%) Native American 0 (0%) 1 (1.5%) Not Reported 0 (0%) 1 (1.5%)
Note. N = 67
Level 1 Variables Descriptive Statistics
The level one dependent variable of interest was severity of illness operationalized via
the SNAP-II instrument. SNAP-II scores were collected on the first day of life and at the end of
each week of life for a total of six weeks of life, thus seven data points. The minimum SNAP-II
score across all time points was zero and the maximum score was 66 at the end of week one of
life, closely followed by a score of 54 on the first day of life. When evaluating the means for
SNAP-II scores at each week of life, the highest mean is at the end of week 1 of life (M =
14.478, SD=11.45), closely followed by the mean at birth (M = 12.708, SD = 9.65) and then a
decreasing trend over time. See Figure 3 that shows a scatterplot of SNAP-II scores at each time
point and Figure 4 demonstrating a graph of the means for SNAP-II scores at each of the seven
time points in the study.
Descriptive statistics and histograms were performed to evaluate the SNAP-II value at
each time point. See Table 2 for descriptive statistics for the SNAP-II instrument at each of the
seven time points. All SNAP-II scores demonstrated positive skewness (1.731 -5.043) and
positive kurtosis (3.495 – 29.926).

35
Figure 3. Scatterplot of SNAP-II Scores by Week
Skewness indicates that the data are not symmetrical, specifically positive skewness
means that more cases accumulate on the left side of the graph and there is a long right tail.
Positive kurtosis indicates that the values are too peaked and have short and thick tails
(Tabachnick & Fidell, 2013). Log10 transformation was used to correct for the non-normality
data structure. Since SNAP-II scores did contain zero values, one was added to each SNAP-II
score prior to the log transformation procedure (Tabachnick & Fidell, 2013).

36
Figure 4. Graph of Means of SNAP-II Scores from Birth through each Week of Life
Table 2
SNAP-II Scores - Descriptive Statistics
n Minimum Maximum M SD Skewness Kurtosis
SNAP0 65 0 54 12.708 9.650 2.379 6.852 SNAP1 67 0 66 14.478 11.447 2.465 7.176 SNAP2 67 0 31 4.299 5.810 1.731 5.137 SNAP3 67 0 24 2.896 5.085 1.815 3.495 SNAP4 67 0 41 1.701 5.947 5.043 29.926 SNAP5 66 0 25 1.061 3.835 4.544 24.044 SNAP6 66 0 28 1.439 4.855 3.938 16.530
Note. SNAP = Score for Neonatal Acute Physiology
The independent variables of interest at level one included weekly intake amounts of
milk volumes in milliliters as well as calculated percentages of intake for mother’s own milk

37
(MOM), donor human milk (DHM), and total human milk (THM) as noted above. MOM, DHM,
and THM ranged from zero to 100% of the neonates diet. The average weekly diet for neonates
in this study was made up of 62.2% of mother’s milk, 10.2% of donor milk, for a combined total
of 72.4% of human milk. The data demonstrated as expected that the amount of milk intake
increases over time. See Figure 5 that includes a scatterplot of individual intake of MOM, DHM,
and THM across the seven time points. Descriptive statistics for MOM and THM demonstrated
normality, however, donor human milk volume and the percentage of donor human milk volume
showed skewness and kurtosis (See Table 3). Log10 transformation was used to correct the non-
normality distribution for both donor human milk variables. Since some values were zero for
milk intake, a one was added to each DHM value prior to the log transformation procedure
(Tabachnick & Fidell, 2013). See Table 3 for the full descriptive statistics for milk variables.
Table 3
Milk Intake Volumes - Descriptive Statistics
N Minimum Maximum Mean SD Skewness Kurtosis
MOM(mL) 463 0 2768 596.897 668.94 .846 -.514 DHM(mL) 463 0 1891 122.514 354.36 3.071 8.450 THM(mL) 463 0 2768 719.411 699.92 .474 -1.127 MOM(%) 463 0 1 .622 .445 -.492 -1.624 DHM(%) 463 0 1 .102 .259 2.525 4.981 THM(%) 463 0 1 .724 .427 -1.000 -.919
Note. MOM(mL) = Mother’s own milk volume intake measured in milliliters; DHM(mL) = Donor human milk volume intake measured in milliliters; THM(mL) = Total human milk volume intake measured in milliliters; MOM(%) = Percentage of mother’s own milk intake; DHM(%) = Percentage of donor human milk intake; THM(%) = Percentage of total human milk intake; Measured for 67 babies over time.

38
Figure 5. Scatterplot of MOM, DHM, and THM Intake for Each Week of Life.
Level 2 Variables Descriptive Statistics
Level two variables were time invariant and included subject level data for each dyad
including: infant birth weight, maternal history of antenatal steroid administration, and maternal
diagnosis of chorioamnionitis. Neonatal birth weight ranged from 600 grams to 1,485 grams (M
= 1064, SD = 217.37) with a normal distribution. See Table 4 for full descriptive statistics for
infant birth weight. A total of six mothers (9%) were diagnosed with chorioamnionitis. A total
of 47 mothers (70.1%) received at least one antenatal steroid injection prior to delivery.
Correlations
Prior to constructing multilevel models for comparison, correlations were used to

39
Table 4
Birth Weight - Descriptive Statistics
N Minimum Maximum Mean SD Skewness Kurtosis
Birth Weight/g 67 600 1485 1064 217.37 .036 -.705
examine the relationships among the study variables. See Table 5 for correlations of aggregated
key variables. Due to the multilevel nature of the dataset, level one data were aggregated for
infants prior to running correlations among the study variables. Statically significant negative
correlations were noted between SNAP-II scores and mother’s own milk volume (r = -.398, p =
.001), total human milk volume (r = -.479, p < .001), and infant birth weight (r =-.579, p < .001).
These relationships remained after log10 transformation of the SNAP-II score (r = .384, p =
.001; r = -.472, p < .001; r = -.629, p < .001). However, when evaluating relationships between
the SNAP-II score and percentage of MOM (r = -.035, p > .05) and percentage of THM (r = -
.044, p > .05), the statically significant correlations did not remain. Correlations were not
significant for donor human milk volume (r = -.076, p > .05), percentage of DHM (r =.000, p >
.05), log10 transformed donor human milk volume (r =-.049, p > .05), and log10 transformed
percentage of DHM (r =-.001, p > .05). Statistically significant correlations were not
demonstrated between SNAP-II scores and antenatal steroid administration (r =.108, p > .05), or
SNAP-II scores and maternal diagnosis of chorioamnionitis (r = -.011, p > .05). Therefore,
antenatal steroids and chorioamnionitis were not included in the final model. As expected,
SNAP-II scores demonstrated statically significant negative correlations to infant birth weight (r
= -.579, p < .001), and was used as a control variable in the model.
40
Multilevel Modeling Approach
The study design included repeated measures that were nested within individual babies.
The intraclass correlation coefficient (ICC) was calculated from the unidentified model with the
original SNAP-II scores to determine the amount of influence of the individual babies. The ICC
of 0.2 indicated that the individual baby could explain 20 percent of the variance noted in the
data. Since data dependency was present, a multilevel modeling approach was appropriate for
this study. Therefore level two variables represented the data for the individual mother/baby
dyad that was time invariant. These time invariant variables include the infants’ birth weight,
maternal history of receiving antenatal steroid injections, and a perinatal diagnosis of
chorioamnionitis during the current antepartum and intrapartum period. Level one variables
were time variant as they were measured on the day of birth and at the end of each week of life
for the first six weeks of life, for a total of seven time points. These data were nested within the
individual neonate and allowed the researcher to determine the growth curve over time. Level
one variables in this study included illness severity scores operationalized via the SNAP-II
instrument as well as weekly milk volumes ingested by the neonate each week. Milk volumes
specifically included six different data points including: 1.) weekly intake of mothers’ own milk
measured in milliliters, 2.) weekly intake of donor human milk measured in milliliters 3.) weekly
intake of all human milk (combined weekly total of mothers’ own milk plus donor human milk)
measured in milliliters, 4.) percentage of weekly diet that was attributed to consumption of
mothers’ own milk 5.) percentage of weekly diet that was attributed to consumption of donor
human milk, 6.) percentage of weekly diet that was attributed to consumption of total human
milk (combined total of mothers’ own milk plus donor human milk).
41
Model Comparison
The initial step was to evaluate the graph showing the change in the dependent variable,
neonatal severity of illness, over time. Growth models were constructed to evaluate a linear,
quadratic, and finally a piecewise model for SNAP-II scores over time. Once the best fitting
growth model was determined, the independent variables of interest (MOM, DHM, and THM)
were added independently to test for statistical significance. Finally, birth weight was added to
the model as a control since it is seen as a proxy for severity of illness in the literature.
The maximum likelihood estimation method was utilized in this study so that model
comparisons could be done using likelihood ratio testing. Although restricted maximum
likelihood estimation produces a less biased result, one cannot compare models with this method
and therefore it was not utilized. Maximum likelihood estimation method was also selected
because it is a robust estimation method when dealing with some non-normality in the dataset.
Likelihood ratio testing was calculated by subtracting the negative two log likelihood scores, also
known as deviance scores, for the comparison model from the baseline model. Then the number
of parameters for the comparison model were subtracted from the parameters from the baseline
model to determine the degrees of freedom used. The likelihood ratio test is distributed as a chi-
square and comparison was made to the critical values to determine if significant change
occurred between models. Models were also compared using goodness of fit testing including:
Akaike’s Information Criterion (AIC) and Schwarz’s Bayesian Criterion (BIC). A better model
was noted when the respective AIC or BIC score decreases for the comparison model.
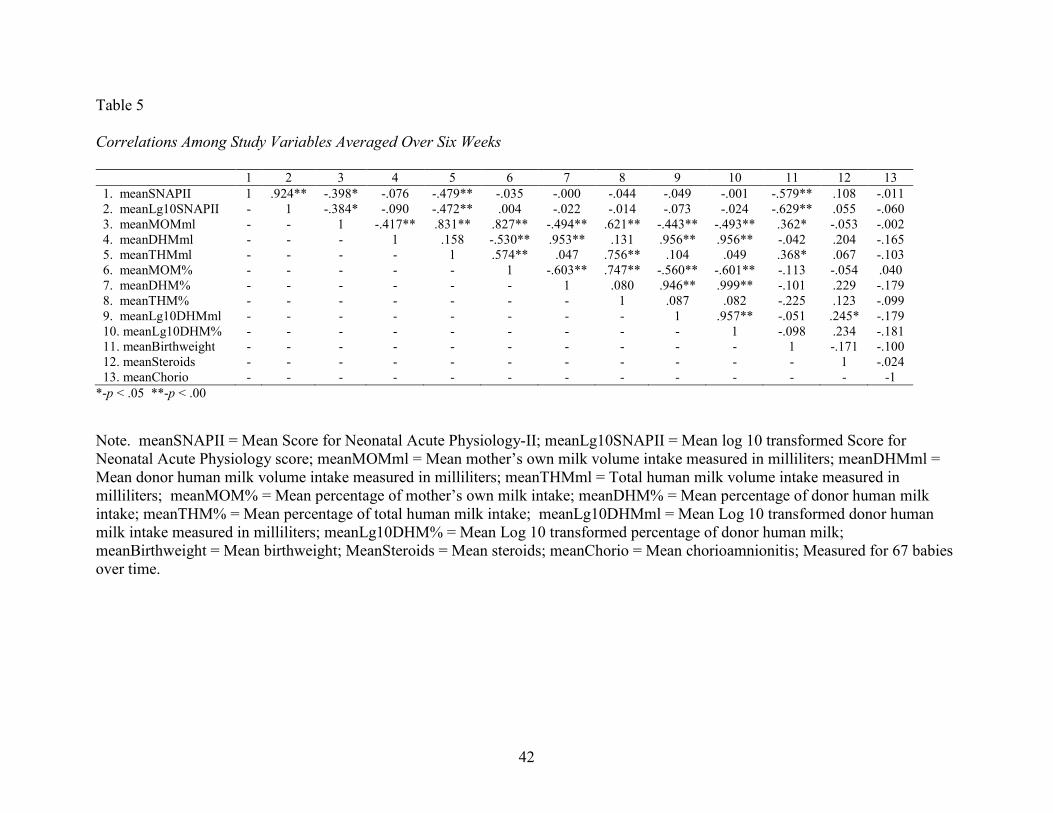
42
Table 5
Correlations Among Study Variables Averaged Over Six Weeks
1 2 3 4 5 6 7 8 9 10 11 12 13
1. meanSNAPII 1 .924** -.398* -.076 -.479** -.035 -.000 -.044 -.049 -.001 -.579** .108 -.011 2. meanLg10SNAPII - 1 -.384* -.090 -.472** .004 -.022 -.014 -.073 -.024 -.629** .055 -.060 3. meanMOMml - - 1 -.417** .831** .827** -.494** .621** -.443** -.493** .362* -.053 -.002 4. meanDHMml - - - 1 .158 -.530** .953** .131 .956** .956** -.042 .204 -.165 5. meanTHMml - - - - 1 .574** .047 .756** .104 .049 .368* .067 -.103 6. meanMOM% - - - - - 1 -.603** .747** -.560** -.601** -.113 -.054 .040 7. meanDHM% - - - - - - 1 .080 .946** .999** -.101 .229 -.179 8. meanTHM% - - - - - - - 1 .087 .082 -.225 .123 -.099 9. meanLg10DHMml - - - - - - - - 1 .957** -.051 .245* -.179 10. meanLg10DHM% - - - - - - - - - 1 -.098 .234 -.181 11. meanBirthweight - - - - - - - - - - 1 -.171 -.100 12. meanSteroids - - - - - - - - - - - 1 -.024 13. meanChorio - - - - - - - - - - - - -1
*-p < .05 **-p < .00
Note. meanSNAPII = Mean Score for Neonatal Acute Physiology-II; meanLg10SNAPII = Mean log 10 transformed Score for Neonatal Acute Physiology score; meanMOMml = Mean mother’s own milk volume intake measured in milliliters; meanDHMml = Mean donor human milk volume intake measured in milliliters; meanTHMml = Total human milk volume intake measured in milliliters; meanMOM% = Mean percentage of mother’s own milk intake; meanDHM% = Mean percentage of donor human milk intake; meanTHM% = Mean percentage of total human milk intake; meanLg10DHMml = Mean Log 10 transformed donor human milk intake measured in milliliters; meanLg10DHM% = Mean Log 10 transformed percentage of donor human milk; meanBirthweight = Mean birthweight; MeanSteroids = Mean steroids; meanChorio = Mean chorioamnionitis; Measured for 67 babies over time.

43
Growth models. Growth models were examined in a stepwise fashion to compare each
model and determine the best fitting growth model for SNAP-II scores over time (See Table 6).
The first model was the unconditional model, which was used as the baseline. The second model
was linear and the model fit was improved by adding the level one predictor of time (γweek = -
.182, p < .001). Model two explained variance at level one increased by 54% (.543506 for σ2)
and model fit improvement was supported (Deviance = 444.481, ∆χ2(df) = 310.819(1), p < .001,
AIC = 452.481, BIC = 469.015). Model three was quadratic and included two parameter
estimates for time including week (γweek = -.393, p <. 001) and week2 (γweek2
= -.035, p <. 001).
Model three explained variance at level one increased by an additional 13.7% as compared to
model 2 (.136934 for σ2). Model three also demonstrated improved model fit as compared to
model two (Deviance = 386.371, ∆χ2(df) = 58.11(1), p < .001, AIC = 396.371, BIC = 417.038).
Finally a piecewise model was created by visually examining the weekly mean SNAP-II scores
(See Figure 4.) This graph indicated that the average slopes for SNAP-II scores were different at
three time points and therefore three “pieces” or three linear relationships were examined. Piece
one was defined as starting at birth (time point zero) and ending at the end of week one of life
(time point 1). Piece two was defined as starting at the end of week one of life (time point 1) and
ending at the end of week 2 of life (time point 2). Piece three was defined as starting at the end
of week 2 (time point 2) and extending through the end of the sixth week of the study (time point
6). The parameter estimates for the piecewise model were significant for piece two (γpiece2 = -
.711, p < .001) and piece three (γpiece3 = -.083, p < .001), but was not statistically significant for
piece one (γpiece1 = .051, p > .05). The piecewise model explained variance increased by an
additional 13.7% (.136818 for σ2). Finally, the piecewise growth model demonstrated the best
model fit (AIC = 340.480, BIC = 365.280). Therefore the piecewise growth model was used as
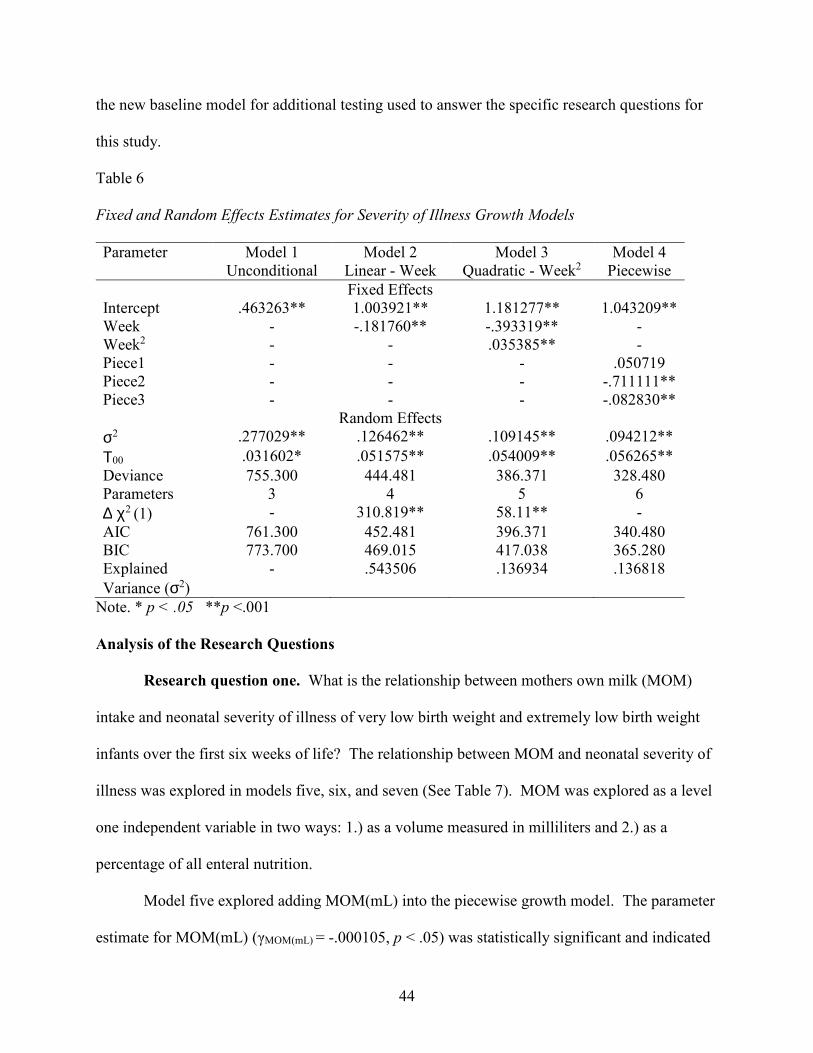
44
the new baseline model for additional testing used to answer the specific research questions for
this study.
Table 6
Fixed and Random Effects Estimates for Severity of Illness Growth Models
Parameter Model 1 Unconditional
Model 2 Linear - Week
Model 3 Quadratic - Week2
Model 4 Piecewise
Fixed Effects Intercept .463263** 1.003921** 1.181277** 1.043209** Week - -.181760** -.393319** - Week2 - - .035385** - Piece1 - - - .050719 Piece2 - - - -.711111** Piece3 - - - -.082830**
Random Effects
σ2 .277029** .126462** .109145** .094212**
Τ00 .031602* .051575** .054009** .056265**
Deviance 755.300 444.481 386.371 328.480 Parameters 3 4 5 6
∆ χ2 (1) - 310.819** 58.11** -
AIC 761.300 452.481 396.371 340.480 BIC 773.700 469.015 417.038 365.280 Explained
Variance (σ2)
- .543506 .136934 .136818
Note. * p < .05 **p <.001
Analysis of the Research Questions
Research question one. What is the relationship between mothers own milk (MOM)
intake and neonatal severity of illness of very low birth weight and extremely low birth weight
infants over the first six weeks of life? The relationship between MOM and neonatal severity of
illness was explored in models five, six, and seven (See Table 7). MOM was explored as a level
one independent variable in two ways: 1.) as a volume measured in milliliters and 2.) as a
percentage of all enteral nutrition.
Model five explored adding MOM(mL) into the piecewise growth model. The parameter
estimate for MOM(mL) (γMOM(mL) = -.000105, p < .05) was statistically significant and indicated
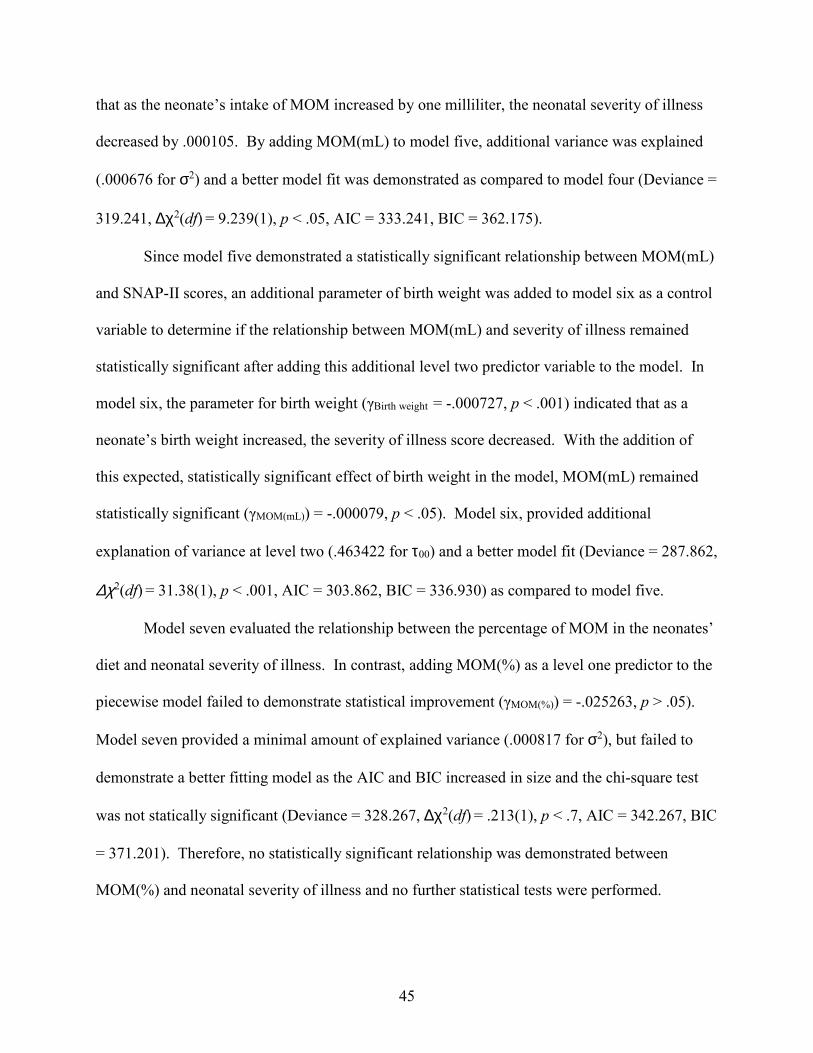
45
that as the neonate’s intake of MOM increased by one milliliter, the neonatal severity of illness
decreased by .000105. By adding MOM(mL) to model five, additional variance was explained
(.000676 for σ2) and a better model fit was demonstrated as compared to model four (Deviance =
319.241, ∆χ2(df) = 9.239(1), p < .05, AIC = 333.241, BIC = 362.175).
Since model five demonstrated a statistically significant relationship between MOM(mL)
and SNAP-II scores, an additional parameter of birth weight was added to model six as a control
variable to determine if the relationship between MOM(mL) and severity of illness remained
statistically significant after adding this additional level two predictor variable to the model. In
model six, the parameter for birth weight (γBirth weight = -.000727, p < .001) indicated that as a
neonate’s birth weight increased, the severity of illness score decreased. With the addition of
this expected, statistically significant effect of birth weight in the model, MOM(mL) remained
statistically significant (γMOM(mL)) = -.000079, p < .05). Model six, provided additional
explanation of variance at level two (.463422 for τ00) and a better model fit (Deviance = 287.862,
∆χ2(df) = 31.38(1), p < .001, AIC = 303.862, BIC = 336.930) as compared to model five.
Model seven evaluated the relationship between the percentage of MOM in the neonates’
diet and neonatal severity of illness. In contrast, adding MOM(%) as a level one predictor to the
piecewise model failed to demonstrate statistical improvement (γMOM(%)) = -.025263, p > .05).
Model seven provided a minimal amount of explained variance (.000817 for σ2), but failed to
demonstrate a better fitting model as the AIC and BIC increased in size and the chi-square test
was not statically significant (Deviance = 328.267, ∆χ2(df) = .213(1), p < .7, AIC = 342.267, BIC
= 371.201). Therefore, no statistically significant relationship was demonstrated between
MOM(%) and neonatal severity of illness and no further statistical tests were performed.

46
Table 7
Fixed and Random Effects Estimates for Piecewise Models with MOM
Parameter Model 4 Piecewise
Model 5 Piecewise
MOM(mL)
Model 6 Piecewise
MOM(mL) Birth Weight
Model 7 Piecewise MOM(%)
Fixed Effects Intercept 1.043209** 1.043324** 1.816148** 1.043319** Piece1 .050719 .059516 .057805 .072385 Piece2 -.711111** -.655280** -.669021** -.711835** Piece3 -.082830** -.072145** -.075094** -.084582** MOM(mL) - -.000105* -.000079* - MOM(%) - - - -.025263 Birth Weight -.000727** Random Effects
σ2 .094212** .093575** .093334** .094135**
Τ00 .056265** .049825** .026735** .056392**
Deviance 328.480 319.241 287.862 328.267 Parameters 6 7 8 7
∆ χ2 (1) - 9.239* 31.38** .213
AIC 340.480 333.241 303.862 342.267 BIC 365.280 362.175 336.930 371.201 Explained Variance
- .000676 (σ2) .463422 (τ00) .000817 (σ2)
Note. * p < .05 **p <.001
Research question two. What is the relationship between donor human milk (DHM)
intake and neonatal severity of illness of very low birth weight and extremely low birth weight
infants over the first six weeks of life? The relationship between DHM and neonatal severity of
illness was explored in models eight and nine (See Table 8). DHM was explored as a level one
independent variable in two ways: 1.) as a volume measured in milliliters and 2.) as a percentage
of all enteral nutrition.
Model eight explored the relationship of DHM(mL) and neonatal severity of illness by
adding it as an additional predictor to the piecewise model. The addition of DHM(mL) failed to
demonstrate a statistically significant relationship with neonatal severity of illness (γDHM(mL) = -

47
.000089, p > .05). Furthermore, model eight did not demonstrate a better fitting model as the
BIC increased in size and the chi-square test was not a statically significant (Deviance =
325.575, ∆χ2(df) = 2.91(1), p < .09, AIC=339.575, BIC=368.509). Therefore, no statistically
significant relationship was demonstrated between DHM(mL) and neonatal severity of illness.
Model nine examined the relationship between DHM(%) and neonatal severity of illness
by adding DHM(%) as a predictor to the piecewise model. Model nine did not demonstrate a
better fitting model as the AIC and BIC increased in size and the chi-square test did not
demonstrate a statistically significant decrease (Deviance = 326.739, ∆χ2(df) = 1.74(1), p < .2,
AIC = 340.739, BIC = 369.673). Therefore, no statistically significant relationship was
demonstrated between DHM(%) and neonatal severity of illness (γDHM(%) = -.094057, p > .05).
Initial correlations of aggregated means for infants failed to demonstrate a statistically
significant relationship between SNAP-II and DHM(mL) as well as between SNAP-II and
DHM(%). These findings were supported with the statistically insignificant parameter estimates
for DHM(mL) and DHM(%) above as well as the rejection of model eight and nine as they did
not provide model improvement as compared to the piecewise model alone. Therefore the null
hypothesis was accepted and no further analysis was continued.
Research question three. What is the relationship between total human milk intake
(THM) (combined total of MOM and DHM) and neonatal severity of illness of very low birth
weight and extremely low birth weight infants over the first six weeks of life? The relationship
between THM and neonatal severity of illness was explored in model 10, 11, and 12 (See Table
9). THM was explored as a level one, independent variable in two ways: 1.) as a volume
measured in milliliters and 2.) as a percentage of all enteral nutrition.
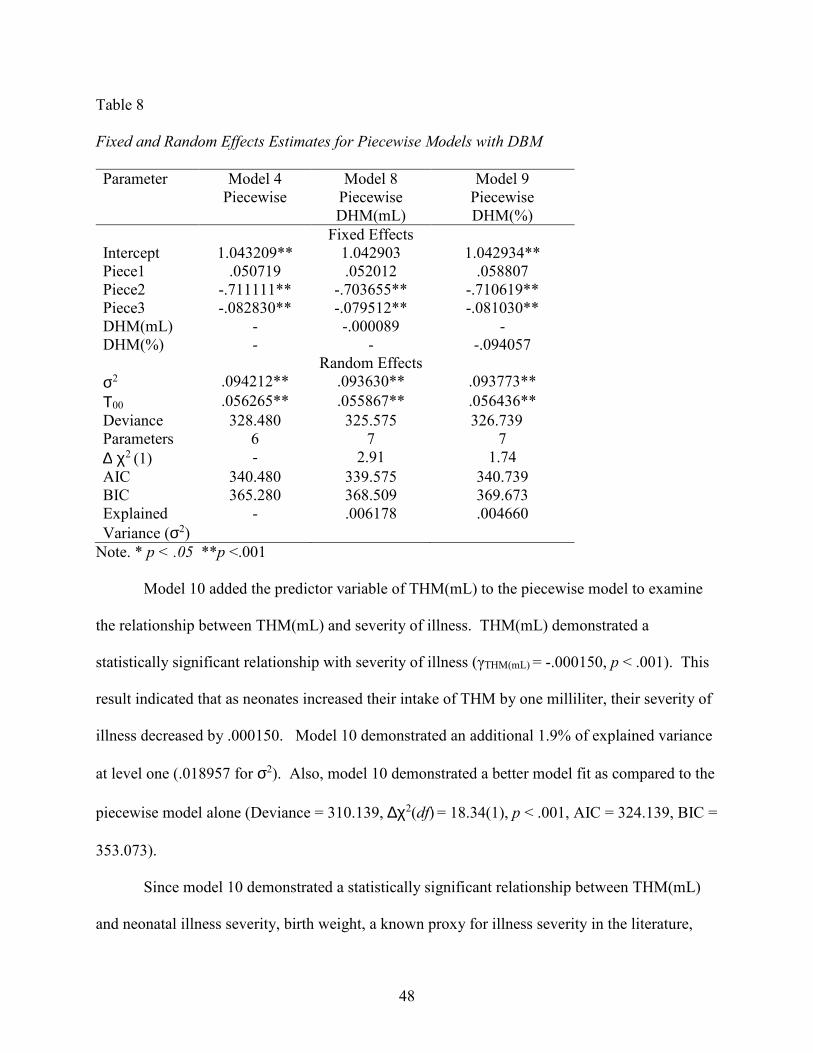
48
Table 8
Fixed and Random Effects Estimates for Piecewise Models with DBM
Parameter Model 4 Piecewise
Model 8 Piecewise DHM(mL)
Model 9 Piecewise DHM(%)
Fixed Effects Intercept 1.043209** 1.042903 1.042934** Piece1 .050719 .052012 .058807 Piece2 -.711111** -.703655** -.710619** Piece3 -.082830** -.079512** -.081030** DHM(mL) - -.000089 - DHM(%) - - -.094057 Random Effects
σ2 .094212** .093630** .093773**
Τ00 .056265** .055867** .056436**
Deviance 328.480 325.575 326.739 Parameters 6 7 7
∆ χ2 (1) - 2.91 1.74
AIC 340.480 339.575 340.739 BIC 365.280 368.509 369.673 Explained
Variance (σ2)
- .006178 .004660
Note. * p < .05 **p <.001
Model 10 added the predictor variable of THM(mL) to the piecewise model to examine
the relationship between THM(mL) and severity of illness. THM(mL) demonstrated a
statistically significant relationship with severity of illness (γTHM(mL) = -.000150, p < .001). This
result indicated that as neonates increased their intake of THM by one milliliter, their severity of
illness decreased by .000150. Model 10 demonstrated an additional 1.9% of explained variance
at level one (.018957 for σ2). Also, model 10 demonstrated a better model fit as compared to the
piecewise model alone (Deviance = 310.139, ∆χ2(df) = 18.34(1), p < .001, AIC = 324.139, BIC =
353.073).
Since model 10 demonstrated a statistically significant relationship between THM(mL)
and neonatal illness severity, birth weight, a known proxy for illness severity in the literature,
49
was added to the next model as a control. Model 11 demonstrated an expected statistically
significant relationship between birth weight and illness severity (γBirth weight = -.000698, p <
.001). In addition, the statistically significant relationship between THM(mL) and illness
severity (γTHM(mL) = -.000127, p < .001) persisted with the addition of the control variable. The
parameter estimate for THM(mL) in model 11 indicated that as neonates increased their intake of
THM by one milliliter, their severity of illness decreased by .000127. Model 11 also provided
additional explanation of variance at level two (.461730 for τ00) as well as a better model fit as
compared to model 10 (Deviance = 279.280, ∆χ2(df) = 30.859(1), p < .001, AIC = 295.280, BIC
= 328.347).
Model 12 evaluated the relationship between THM(%) and neonatal severity of illness.
Although model 10 and 11 demonstrated a statistically significant relationships between
THM(mL) and SNAP-II, the parameter estimate for THM(%) was not statistically significant
(γTHM(%) = -.101846, p > .05) and model 12 did not improve the model fit as compared to the
piecewise model alone (Deviance = 325.732, ∆χ2(df) = 2.748(1), p < .1, AIC = 339.732, BIC =
368.666) as demonstrated by a larger AIC, BIC, and a non-significant chi-square test.
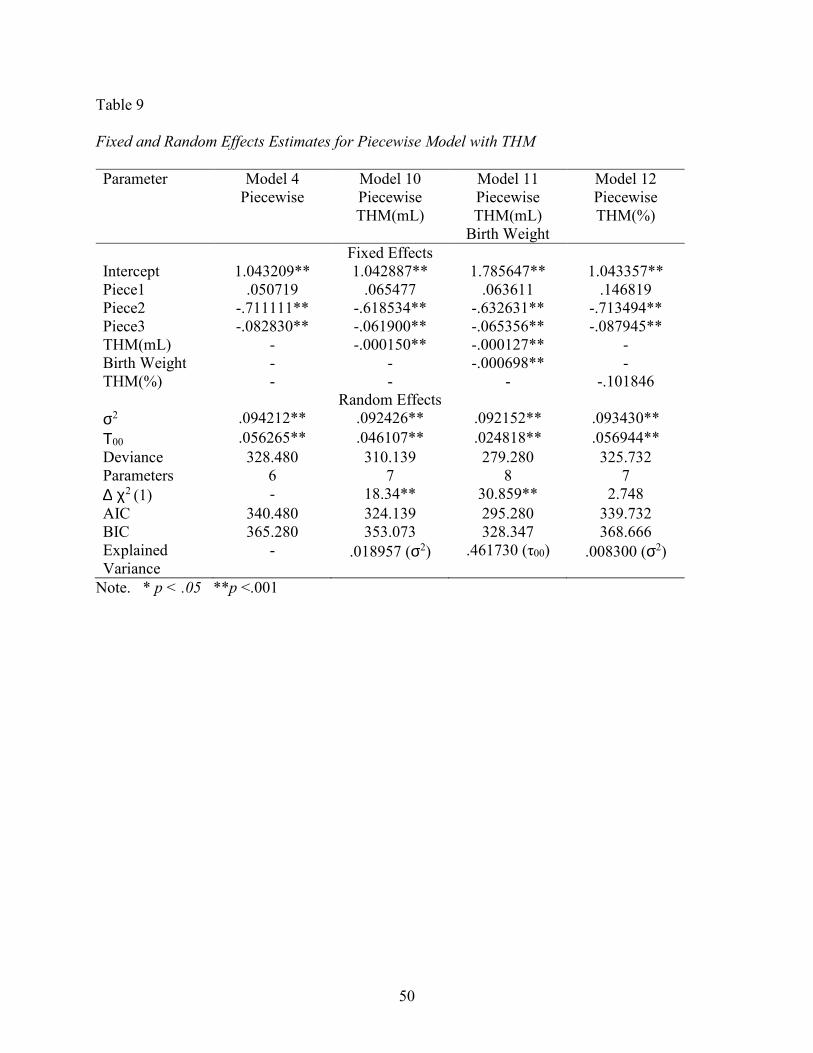
50
Table 9
Fixed and Random Effects Estimates for Piecewise Model with THM
Parameter Model 4 Piecewise
Model 10 Piecewise THM(mL)
Model 11 Piecewise THM(mL)
Birth Weight
Model 12 Piecewise THM(%)
Fixed Effects Intercept 1.043209** 1.042887** 1.785647** 1.043357** Piece1 .050719 .065477 .063611 .146819 Piece2 -.711111** -.618534** -.632631** -.713494** Piece3 -.082830** -.061900** -.065356** -.087945** THM(mL) - -.000150** -.000127** - Birth Weight - - -.000698** - THM(%) - - - -.101846 Random Effects
σ2 .094212** .092426** .092152** .093430**
Τ00 .056265** .046107** .024818** .056944**
Deviance 328.480 310.139 279.280 325.732 Parameters 6 7 8 7
∆ χ2 (1) - 18.34** 30.859** 2.748
AIC 340.480 324.139 295.280 339.732 BIC 365.280 353.073 328.347 368.666 Explained Variance
- .018957 (σ2) .461730 (τ00) .008300 (σ2)
Note. * p < .05 **p <.001

51
CHAPTER FIVE
DISCUSSION
Discussion of Findings
The purpose of this secondary data analysis was to explore the relationships between
neonatal severity of illness and human milk, specifically mother’s own milk, donor human milk,
and total human milk over the first six weeks of life in VLBW and ELBW infants. This study
contained two major areas of focus: 1.) human milk (MOM, DHM, THM) as the independent
variable of interest and 2.) neonatal severity of illness as the dependent variable of interest.
Human milk. A growing body of evidence supports that human milk is the best nutrition
for babies and that vulnerable populations should be provided with human milk to help mitigate
illness and improve overall neonatal health. One consideration regarding measuring the effect of
human milk is the ability to measure small effect sizes and ensure that small, yet statistically
significant effects are not missed and therefore avoiding type II errors. The mean volume of
human milk consumption changes greatly over the first few days and weeks of life and this was
demonstrated in the current study. This variation was also demonstrated via the large standard
deviation noted for each human milk volume (SDMOM(mL) = 668.94, SDDHM(mL) = 354.36,
SDTHM(mL) = 699.92).
The volume of nutritional intake for neonates is routinely documented in milliliters,
therefore the parent study used this same measurement. Furthermore, this means that the
parameter effects of human milk were estimated based on the effect of the neonate ingesting one

52
milliliter of human milk. One milliliter is a very small amount; therefore the corresponding
effect per milliliter is anticipated to be small as well.
There are two approaches that can be used to ensure that the researcher does not miss this
small, yet statistically significant effect: 1.) take the numerical value out additional decimal
places so that the very small coefficients are still observed or 2.) compute a new variable for
human milk by multiplying by a larger number to magnify the effect, essentially changing the
comparison from the effect of ingestion of one milliliter to the ingestion of a larger amount of
human milk. In this study, the primary investigator choose to keep the comparison at one
milliliter as these fragile neonates often start enteral feeds one milliliter at a time. Also, many
NICUs are now providing oral care with drops of human milk for these fragile infants before
enteral feeds are started. A recent randomized clinical trial provided evidence that using 0.2mL
of colostrum (the first human milk that is produced) for oral care every three hours, for three
days, starting at 48 – 96 hours of life was associated with a statistically significant decrease in
sepsis (Lee et al., 2015). Therefore, determining the effect of ingesting one milliliter of human
milk can be a powerful way to let clinicians as well as new moms know the beneficial effects
when these fragile infants ingest even small amounts of human milk. Mother’s are more likely
to provide human milk if they are empowered with the knowledge and clinicians are also more
likely to promote and protect breastfeeding and human milk provision in the NICU when they
are empowered with this knowledge as well.
The most significant results of this study were the statistically significant inverse
relationships demonstrated between MOM(mL) and SNAP-II scores as well as THM(mL) and
SNAP-II scores. Specifically, as MOM(mL) and THM(mL) volume of intake increased, severity
of illness scores decreased. However, MOM(%) and THM(%) failed to demonstrate statistically

53
significant relationships with illness severity. These results are discordant and require further
reflection and inquiry. It was expected that if the milliliter volume of human milk was correlated
to illness severity measurements, that the percentage of human milk intake would also
demonstrate significant inverse relationships and provide additional evidence of a relationship
between human milk and neonatal illness severity. However, no relationship was seen with any
of the human milk percentage predictor variables including DHM(%). This result indicates that
caution should be used when interpreting the meaning of the relationship noted between
MOM(mL) ,THM(ml), and neonatal severity of illness.
In the NICU, a neonate’s intake is highly regulated by the provider according to the
neonate’s weight and physiologic stability. If neonates are unstable, or increased feeding
residuals are observed, feedings are withheld. Inversely, as neonates are doing well, feedings
continue and the volume of intake steadily increases in a stepwise fashion according the neonates
physiologic status and toleration of the diet. Therefore, it is possible that the relationship that
was observed in this study is that of volume of intake increasing over time related to the
decreasing severity of illness scores over time regardless as to whether the intake volume was
human milk or an alternative nutritional source.
In addition, DHM(mL) failed to demonstrate a statistically significant relationship with
severity of illness scores, which may be due to insufficient quantities of DHM(mL) intake.
When compared to quantities of MOM(mL) and THM(mL) intake, DHM(mL) was minimal and
on average, it only composed 10% of the neonates’ diet (See Table 3). So although DHM(mL)
did not demonstrate a significant relationship with severity of illness in this study, it may be due
to the small amounts of DHM(mL) that the infants ingested as compared to MOM(mL) and
THM(mL). Most likely this minimal intake of DHM is due to two factors: 1.) the NICU for the
54
parent study did not introduce the use of donor milk until about halfway through recruitment for
the parent study and 2.) although DHM may provide 100% of the enteral nutrition for a neonate,
it is often only used as a supplement to MOM, because MOM is still known as the best human
milk that is unique to that mother/baby dyad (Bauer & Gerss, 2011). Although DHM(mL) alone
did not demonstrate a significant relationship with severity of illness, the addition of DHM(mL)
as a part of the sum total of THM(mL) for model 10 (γTHM(mL) = -.061900, p < .001) and model
11 (γTHM(mL) = -.000127, p <.001) provided evidence that DHM(mL) strengthen the relationship
between THM(mL) and severity of illness versus MOM(mL) alone (γMOM(mL) = -.000105, p <
.001).
Neonatal severity of illness. Neonatal severity of illness, the dependent variable of
interest, was operationalized by the SNAP-II instrument. Although this instrument has been
used widely thoughout the globe, this study is only the third known study to date that has used
the SNAP-II instrument longitudinally (Morse, Groer, Shelton, Maguire, & Ashmeade, 2015).
Madan et al. (2008) examined relationships of neonatal complications with SNAP-II scores;
however, no statistically significant relationships were identified. Lim and Rozycki (2008)
measured SNAP-II scores daily throughout the NICU admission and examined relationships of
morbidity, specifically sepsis and necrotizing enterocolitis, as well as mortality to SNAP-II
scores. However, the data did not demonstrate the ability of the SNAP-II score to accurately
predict morbidity and mortality at these later time points.
Another concern identified by Lim and Rozycki (2008) was that 92% of the SNAP-II
scores in their study were zero, indicating that there was no severity of illness identified in these
at risk neonates. The current study also found a high percentage of null value SNAP-II scores;
specifically 57.7% (n=266) of the SNAP-II scores in this study were zero. In addition, another
55
119 null values were not accounted for in the 57.7% since these participants (n=17) were
eliminated prior to data analysis because they had a SNAP-II score of zero at all seven time
points. Furthermore, when evaluating the SNAP-II scores by week, the frequency of null values
increases over time from a low of 4.5% (n=3) on week one to a high of 89.6% (n=60) for week
five.
A potential contributing factor to a high number of null SNAP-II values in the parent
study is the lack of arterial blood gas data especially for later time points. If the neonate was not
physiologically unstable enough to require an arterial line or an arterial blood gas sampling, then
the value assigned was zero for the subscale. Although this practice is questionable, other
studies indicated this same limitation (Lim & Rozycki, 2008). So although the SNAP-II score
has robust data to support its utility as a measure of initial neonatal illness severity, the current
study provides evidence that caution should be exercised when using this instrument to measure
neonatal severity of illness over time. However, it is also imperative that the researcher
considers the natural trajectory of illness scores over time during a NICU journey. It is
reasonable to expect that most babies will improve during their NICU stay. Therefore indicating
an expectation that the illness scores will decrease over time as the baby improves and moves
towards a plan to discharge home. This may account for many of the null values at later time
points as babies may be reaching discharge dates. However, this inquiry is beyond the scope of
this dissertation.
An additional concern that was identified with the SNAP-II values was a violation of the
assumption of normal distribution. Specifically, positive skewness and positive kurtosis was
observed. Log10 transformation was conducted for correction; however it is more useful in
correcting skewness versus kurtosis. Additionally, the large number of null scores as discussed
56
above impact this distribution. Further residual analyses with histograms and Q-Q plots were
conducted on the final models to demonstrate normal distribution of the residuals.
Finally, the last major limitation of this dissertation was the inability to report a measure
of validity for the SNAP-II measurement instrument. Although the researcher intended to
calculate the Cronbach’s alpha coefficient for the SNAP-II instrument for this sample of VLBW
and ELBW neonates, it was not possible with the current data available in SPSS for this
secondary data analysis. During the parent study, the SNAP-II scores were input into SPSS as a
total score versus inputting each of the six subscales independently. Without the individual
subscale values for the instrument, it is impossible to calculate this statistic. This was
unfortunate because reliability data on the SNAP-II instrument has not been published (Morse et
al., 2015).
Conclusions
The current study utilized a de-identified, existing data set to examine the relationship
between human milk and neonatal severity of illness. Multilevel modeling was selected as the
statistical measurement approach due to the time variant data that were nested within individual
neonates. Six milk variables were explored including: MOM(mL), MOM(%), DHM(mL),
DHM(%), THM(mL) and THM(%). Of these, only MOM(mL) and THM(mL) demonstrated a
relationship with SNAP-II scores. The best model of fit for MOM(mL) was model six (See
Table 7) and demonstrated that as MOM(mL) intake increased, neonatal severity of illness
decreased. The best model of fit for THM(mL) was model 11 (See Table 9) and this
demonstrated that as MOM(mL) and DHM(mL) were combined, each increase in THM(mL)
consumption was inversely related to a decrease in the neonatal severity of illness score.
However, no relationships were demonstrated with MOM(%), DHM(%), or THM(%). Although
57
statistically significant relationships were demonstrated between MOM(mL) and severity of
illness as well as THM(mL) and severity of illness, these results must be interpreted with caution
as the percentages of intake of MOM(%) THM(%) failed to demonstrate the same relationship.
Implications for Future Research
A growing body of evidence supports human milk as the best nutrition for neonates. This
study provides additional support that a relationship between neonatal illness severity and human
milk intake exists. Furthermore, due to this relationship and the known benefits of human milk
consumption, human milk should remain a focus of ongoing research due to its potential to
mitigate risk for the most fragile populations in the NICU. However, a more precise instrument
may be needed to assess for subtle changes in illness severity over time when examining
relationships between human milk and illness severity. The large percentage of null values for
the SNAP-II score may indicate that the SNAP-II instrument is not precise at measuring very
subtle changes in severity of illness. Future research should explore the development of a tool
that is able to detect more subtle changes in severity of illness. Furthermore, the increased null
SNAP-II values at later time points indicate a need for a precise instrument in order to detect the
subtle changes in severity of illness that occur over time during a NICU admission. The ability
to detect these subtle changes in illness severity will help researchers to continue to explore the
relationships discussed in this study, yet the implications expand well beyond this research to all
areas of neonatology.
Currently, the SNAP-II instrument is used mainly as a tool for research at the population
level versus the individual patient level. With the increased use of the electronic medical record
(EMR), it would be advantageous to create an automatically calculated illness severity score
based on the routine input of assessment data by clinicians. An automatically calculated score
58
based on real time data would provide researchers with a plethora of information. Big data
studies are increasing in popularity and a daily auto calculated illness severity score would
provide a tremendous amount of information for researchers as they explore the data for
relationships.
In addition, auto calculating illness severity scores would be beneficial for bedside
clinicians as an illness severity surveillance tool that could be used in combination with their
physical assessment skills and intuition. This researcher believes that if more EMR measurement
tools were available for ongoing use by staff nurses, nurse practitioners, and neonatologists, this
would empower clinicians with an additional tool to provide the best care for their current
patients.
Finally, by incorporating EMR measurement instruments for daily use by bedside
clinicians, researchers would be engaging more clinicians to become active partners in
translational research. Research findings are often slow at being integrated into clinical practice.
Additional collaboration among clinicians and researchers could help to decrease this gap of time
from knowledge discovery to implementation. Together researchers and clinicians can make a
difference in the lives of these fragile babies.
Acknowledgement
These data were collected as a part of a grant funded by the National Institutes of Health
(R21NR013094).
59
REFERENCES
Agostoni, C., Buonocore, G., Carnielli, V. P., De Curtis, M., Darmaun, D., Decsi, T., . . . Ziegler,
E. E. (2010). Enteral nutrient supply for preterm infants: commentary from the European
Society of Paediatric Gastroenterology, Hepatology and Nutrition Committee on
Nutrition. Journal of Pediatric Gastroenterology and Nutrition, 50(1), 85-91. doi:
10.1097/MPG.0b013e3181adaee0
Akcan-Arikan, A., Zappitelli, M., Loftis, L. L., Washburn, K. K., Jefferson, L. S., & Goldstein,
S. L. (2007). Modified RIFLE criteria in critically ill children with acute kidney injury.
Kidney International, 71(10), 1028-1035. doi: 10.1038/sj.ki.5002231
Alexander, J. M., Gilstrap, L. C., Cox, S. M., McIntire, D. M., & Leveno, K. J. (1998). Clinical
chorioamnionitis and the prognosis for very low birth weight infants. Obstetrics and
Gynecology, 91(5 Pt 1), 725-729.
Aly, H., Hammad, T. A., Essers, J., & Wung, J. T. (2012). Is mechanical ventilation associated
with intraventricular hemorrhage in preterm infants? Brain and Development, 34(3), 201-
205. doi: 10.1016/j.braindev.2011.04.006
Ambalavanan, N., Carlo, W. A., Tyson, J. E., Langer, J. C., Walsh, M. C., Parikh, N. A., . . .
Higgins, R. D. (2012). Outcome trajectories in extremely preterm infants. Pediatrics,
130(1), e115-125. doi: 10.1542/peds.2011-3693

60
Ammari, A., Suri, M., Milisavljevic, V., Sahni, R., Bateman, D., Sanocka, U., . . . Polin, R. A.
(2005). Variables associated with the early failure of nasal CPAP in very low birth
weight infants. Journal of Pediatrics, 147(3), 341-347. doi: 10.1016/j.jpeds.2005.04.062
Avery, M. E., & Mead, J. (1959). Surface properties in relation to atelectasis and hyaline
membrane disease. A.M.A. Journal of Diseases of Children, 97(5, Part 1), 517-523.
Bartels, D. B., Kreienbrock, L., Dammann, O., Wenzlaff, P., & Poets, C. F. (2005). Population
based study on the outcome of small for gestational age newborns. Archives of Disease in
Childhood: Fetal and Neonatal Edition, 90(1), F53-59. doi: 10.1136/adc.2004.053892
Bauer, J., & Gerss, J. (2011). Longitudinal analysis of macronutrients and minerals in human
milk produced by mothers of preterm infants. Clinical Nutrition, 30(2), 215-220. doi:
10.1016/j.clnu.2010.08.003
Bezerra, C. T., Vaz Cunha, L. C., & Liborio, A. B. (2013). Defining reduced urine output in
neonatal ICU: importance for mortality and acute kidney injury classification.
Nephrology, Dialysis, Transplantation, 28(4), 901-909. doi: 10.1093/ndt/gfs604
Bhatia, J. (2013). Human milk and the premature infant. Annals of Nutrition and Metabolism, 62
Suppl 3, 8-14. doi: 10.1159/000351537
Bishara, R., Dunn, M. S., Merko, S. E., & Darling, P. (2008). Nutrient composition of hindmilk
produced by mothers of very low birth weight infants born at less than 28 weeks'
gestation. Journal of Human Lactation, 24(2), 159-167. doi: 10.1177/0890334408316085
Blencowe, H., Cousens, S., Oestergaard, M. Z., Chou, D., Moller, A. B., Narwal, R., . . . Lawn,
J. E. (2012). National, regional, and worldwide estimates of preterm birth rates in the
year 2010 with time trends since 1990 for selected countries: A systematic analysis and
implications. Lancet, 379(9832), 2162-2172. doi: 10.1016/s0140-6736(12)60820-4

61
Bonifacio, S. L., Glass, H. C., Vanderpluym, J., Agrawal, A. T., Xu, D., Barkovich, A. J., &
Ferriero, D. M. (2011). Perinatal events and early magnetic resonance imaging in
therapeutic hypothermia. Journal of Pediatrics, 158(3), 360-365. doi:
10.1016/j.jpeds.2010.09.003
Brindle, M. E., Ma, I. W., & Skarsgard, E. D. (2010). Impact of target blood gases on outcome in
congenital diaphragmatic hernia (CDH). European Journal of Pediatric Surgery, 20(5),
290-293. doi: 10.1055/s-0030-1253405
Capasso, L., Borrelli, A. C., Parrella, C., Lama, S., Ferrara, T., Coppola, C., . . . Raimondi, F.
(2013). Are IgM-enriched immunoglobulins an effective adjuvant in septic VLBW
infants? Italian Journal of Pediatrics, 39, 63. doi: 10.1186/1824-7288-39-63
Carroll, K. (2014). Body dirt or liquid gold? How the 'safety' of donated breastmilk is
constructed for use in neonatal intensive care. Social Studies of Sciences, 44(3), 466-485.
Cataldi, L., Leone, R., Moretti, U., De Mitri, B., Fanos, V., Ruggeri, L., . . . Cuzzolin, L. (2005).
Potential risk factors for the development of acute renal failure in preterm newborn
infants: a case-control study. Archives of Disease in Childhood: Fetal and Neonatal
Edition, 90(6), F514-519. doi: 10.1136/adc.2004.060434
Chen, M., Citil, A., McCabe, F., Leicht, K. M., Fiascone, J., Dammann, C. E., & Dammann, O.
(2011). Infection, Oxygen, and Immaturity: Interacting Risk Factors for Retinopathy of
Prematurity. Neonatology, 99(2), 125-132. doi: 10.1159/000312821
Chien, L. Y., Whyte, R., Aziz, K., Thiessen, P., Matthew, D., & Lee, S. K. (2001). Improved
outcome of preterm infants when delivered in tertiary care centers. Obstetrics and
Gynecology, 98(2), 247-252.

62
Chien, L. Y., Whyte, R., Thiessen, P., Walker, R., Brabyn, D., & Lee, S. K. (2002). Snap-II
predicts severe intraventricular hemorrhage and chronic lung disease in the neonatal
intensive care unit. Journal of Perinatology, 22(1), 26-30. doi: 10.1038/sj.jp.7210585
Chiesa, C., Pellegrini, G., Panero, A., Osborn, J. F., Signore, F., Assumma, M., & Pacifico, L.
(2003). C-reactive protein, interleukin-6, and procalcitonin in the immediate postnatal
period: influence of illness severity, risk status, antenatal and perinatal complications, and
infection. Clinical Chemistry, 49(1), 60-68.
Chung, M., Raman, G., Trikalinos, T., Lau, J., & Ip, S. (2008). Interventions in primary care to
promote breastfeeding: an evidence review for the U.S. Preventive Services Task Force.
Annals of Internal Medicine, 149(8), 565-582.
Clark, M. T., Vergales, B. D., Paget-Brown, A. O., Smoot, T. J., Lake, D. E., Hudson, J. L., . . .
Moorman, J. R. (2013). Predictive monitoring for respiratory decompensation leading to
urgent unplanned intubation in the neonatal intensive care unit. Pediatric Research,
73(1), 104-110. doi: 10.1038/pr.2012.155
Coleman, A. J., Brozanski, B., Mahmood, B., Wearden, P. D., Potoka, D., & Kuch, B. A. (2013).
First 24-h SNAP-II score and highest PaCO2 predict the need for ECMO in congenital
diaphragmatic hernia. Journal of Pediatric Surgery, 48(11), 2214-2218. doi:
10.1016/j.jpedsurg.2013.03.049
Contreras-Lemus, J., Flores-Huerta, S., Cisneros-Silva, I., Orozco-Vigueras, H., Hernandez-
Gutierrez, J., Fernandez-Morales, J., & Chavez-Hernandez, F. (1992). [Morbidity
reduction in preterm newborns fed with milk of their own mothers]. Boletín Medico del
Hospital Infantil de México, 49(10), 671-677.

63
Corchia, C., Ferrante, P., Da Fre, M., Di Lallo, D., Gagliardi, L., Carnielli, V., . . . Cuttini, M.
(2013). Cause-specific mortality of very preterm infants and antenatal events. Journal of
Pediatrics, 162(6), 1125-1132, 1132 e1121-1124. doi: 10.1016/j.jpeds.2012.11.093
Corpeleijn, W. E., Kouwenhoven, S. M., Paap, M. C., van Vliet, I., Scheerder, I., Muizer, Y., . . .
Vermeulen, M. J. (2012). Intake of own mother's milk during the first days of life is
associated with decreased morbidity and mortality in very low birth weight infants during
the first 60 days of life. Neonatology, 102(4), 276-281. doi: 10.1159/000341335
Cristofalo, E. A., Schanler, R. J., Blanco, C. L., Sullivan, S., Trawoeger, R., Kiechl-
Kohlendorfer, U., . . . Abrams, S. (2013). Randomized trial of exclusive human milk
versus preterm formula diets in extremely premature infants. Journal of Pediatrics,
163(6), 1592-1595.e1591. doi: 10.1016/j.jpeds.2013.07.011
Dammann, O., Naples, M., Bednarek, F., Shah, B., Kuban, K. C., O'Shea, T. M., . . . Leviton, A.
(2010). SNAP-II and SNAPPE-II and the risk of structural and functional brain disorders
in extremely low gestational age newborns: The ELGAN study. Neonatology, 97(2), 71-
82. doi: 10.1159/000232588
Dammann, O., Shah, B., Naples, M., Bednarek, F., Zupancic, J., Allred, E. N., & Leviton, A.
(2009). Interinstitutional variation in prediction of death by SNAP-II and SNAPPE-II
among extremely preterm infants. Pediatrics, 124(5), e1001-1006. doi:
10.1542/peds.2008-3233
Davis, A. S., Hintz, S. R., Van Meurs, K. P., Li, L., Das, A., Stoll, B. J., . . . Higgins, R. D.
(2010). Seizures in extremely low birth weight infants are associated with adverse
outcome. Journal of Pediatrics, 157(5), 720-725 e721-722. doi:
10.1016/j.jpeds.2010.04.065

64
De Felice, C., Toti, P., Parrini, S., Del Vecchio, A., Bagnoli, F., Latini, G., & Kopotic, R. J.
(2005). Histologic chorioamnionitis and severity of illness in very low birth weight
newborns. Pediatric Critical Care Medicine, 6(3), 298-302. doi:
10.1097/01.pcc.0000160658.35437.65
de Jager, E., Skouteris, H., Broadbent, J., Amir, L., & Mellor, K. (2012). Psychosocial correlates
of exclusive breastfeeding: A systematic review. Midwifery. doi:
10.1016/j.midw.2012.04.009
Dempsey, E., & Miletin, J. (2010). Banked preterm versus banked term human milk to promote
growth and development in very low birth weight infants. Cochrane Database of
Systematic Reviews(6), Cd007644. doi: 10.1002/14651858.CD007644.pub2
Doyle, L. W. (2004a). Evaluation of neonatal intensive care for extremely low birth weight
infants in Victoria over two decades: I. Effectiveness. Pediatrics, 113(3 Pt 1), 505-509.
Doyle, L. W. (2004b). Evaluation of neonatal intensive care for extremely low birth weight
infants in Victoria over two decades: II. Efficiency. Pediatrics, 113(3 Pt 1), 510-514.
Doyle, L. W., Ehrenkranz, R. A., & Halliday, H. L. (2014a). Early (< 8 days) postnatal
corticosteroids for preventing chronic lung disease in preterm infants. Cochrane
Database of Systematic Reviews, 5, Cd001146. doi: 10.1002/14651858.CD001146.pub4
Doyle, L. W., Ehrenkranz, R. A., & Halliday, H. L. (2014b). Late (> 7 days) postnatal
corticosteroids for chronic lung disease in preterm infants. Cochrane Database of
Systematic Reviews, 5, Cd001145. doi: 10.1002/14651858.CD001145.pub3
Eidelman, A. I., & Schanler, R. J. (2012). Breastfeeding and the use of human milk. Pediatrics,
129(3), e827-841. doi: 10.1542/peds.2011-3552

65
Evans, D. J., Levene, M. I., & Tsakmakis, M. (2007). Anticonvulsants for preventing mortality
and morbidity in full term newborns with perinatal asphyxia. Cochrane Database of
Systematic Reviews(3), CD001240. doi: 10.1002/14651858.CD001240.pub2
Fanaroff, A. A., & Fanaroff, J. M. (2006). Short- and long-term consequences of hypotension in
ELBW infants. Seminars in Perinatology, 30(3), 151-155. doi:
10.1053/j.semperi.2006.04.006
Figueras-Aloy, J., Gomez, L., Rodriguez-Miguelez, J. M., Jordan, Y., Salvia, M. D., Jimenez,
W., & Carbonell-Estrany, X. (2003). Plasma nitrite/nitrate and endothelin-1
concentrations in neonatal sepsis. Acta Paediatrica, 92(5), 582-587.
Figueras-Aloy, J., Gomez-Lopez, L., Rodriguez-Miguelez, J. M., Jordan-Garcia, Y., Salvia-
Roiges, M. D., Jimenez, W., & Carbonell-Estrany, X. (2004). Plasma endothelin-1 and
clinical manifestations of neonatal sepsis. Journal of Perinatal Medicine, 32(6), 522-526.
doi: 10.1515/jpm.2004.126
Figueras-Aloy, J., Gomez-Lopez, L., Rodriguez-Miguelez, J. M., Salvia-Roiges, M. D., Jordan-
Garcia, I., Ferrer-Codina, I., . . . Jimenez-Gonzalez, R. (2007). Serum soluble ICAM-1,
VCAM-1, L-selectin, and P-selectin levels as markers of infection and their relation to
clinical severity in neonatal sepsis. American Journal of Perinatology, 24(6), 331-338.
doi: 10.1055/s-2007-981851
Fleisher, B. E., Murthy, L., Lee, S., Constantinou, J. C., Benitz, W. E., & Stevenson, D. K.
(1997). Neonatal severity of illness scoring systems: A comparison. Clinical Pediatrics,
36(4), 223-227.
Florida Community Health Assesment Resource Tool Set. (2013). Retrieved from:
http://www.floridacharts.com/charts/BirthQuery.aspx
66
Florida Community Health Assesment Resource Tool Set. (2014). Retrieved from:
http://www.floridacharts.com/FLQUERY/Birth/BirthRateRpt.aspx
Fuchs, H., Lindner, W., Buschko, A., Almazam, M., Hummler, H. D., & Schmid, M. B. (2012).
Brain oxygenation monitoring during neonatal resuscitation of very low birth weight
infants. Journal of Perinatology, 32(5), 356-362. doi: 10.1038/jp.2011.110
Fujiwara, T., Maeta, H., Chida, S., Morita, T., Watabe, Y., & Abe, T. (1980). Artificial
surfactant therapy in hyaline-membrane disease. Lancet, 1(8159), 55-59.
Garcia-Munoz Rodrigo, F., Rivero Rodriguez, S., & Siles Quesada, C. (2013). [Hypothermia risk
factors in the very low weight newborn and associated morbidity and mortality in a
neonatal care unit.]. Anales de Pediatría (Barcelona, Spain: 2003). doi:
10.1016/j.anpedi.2013.06.029
Gartner, L. M., Morton, J., Lawrence, R. A., Naylor, A. J., O'Hare, D., Schanler, R. J., &
Eidelman, A. I. (2005). Breastfeeding and the use of human milk. Pediatrics, 115(2),
496-506. doi: 10.1542/peds.2004-2491
Groer, M., Duffy, A., Morse, S., Kane, B., Zaritt, J., Roberts, S., & Ashmeade, T. (2014).
Cytokines, Chemokines, and Growth Factors in Banked Human Donor Milk for Preterm
Infants. Journal of Human Lactation. doi: 10.1177/0890334414527795
Halbertsma, F. J., Vaneker, M., Pickkers, P., & Hoeven, J. G. (2009). The oxygenation ratio
during mechanical ventilation in children: The role of tidal volume and positive end-
expiratory pressure. Journal of Critical Care, 24(2), 220-226. doi:
10.1016/j.jcrc.2008.03.036
Hamilton, B. E., Martin, J. A., Osterman, M. J., Curtin, S. C., & Matthews, T. J. (2015). Births:
Final Data for 2014. National Vital Statistics Reports, 64(12), 1-64.
67
Hauspurg, A. K., Allred, E. N., Vanderveen, D. K., Chen, M., Bednarek, F. J., Cole, C., . . .
Dammann, O. (2011). Blood gases and retinopathy of prematurity: The ELGAN study.
Neonatology, 99(2), 104-111. doi: 10.1159/000308454
He, B. Z., Sun, X. J., Quan, M. Y., & Wang, D. H. (2014). [Macronutrients and energy in milk
from mothers of premature infants]. Zhongguo Dang Dai Er Ke Za Zhi. Chinese Journal
of Contemporary Pediatrics, 16(7), 679-683.
Henderson, J. J., Hartmann, P. E., Newnham, J. P., & Simmer, K. (2008). Effect of preterm birth
and antenatal corticosteroid treatment on lactogenesis II in women. Pediatrics, 121(1),
E92-E100. doi: 10.1542/peds.2007-1107
Hornik, C. P., Fort, P., Clark, R. H., Watt, K., Benjamin, D. K., Jr., Smith, P. B., . . . Cohen-
Wolkowiez, M. (2012). Early and late onset sepsis in very-low-birth-weight infants from
a large group of neonatal intensive care units. Early Human Development, 88 Suppl 2,
S69-74. doi: 10.1016/s0378-3782(12)70019-1
Horodynski, M., Olson, B., Arndt, M. J., Brophy-Herb, H., Shirer, K., & Shemanski, R. (2007).
Low-income mothers' decisions regarding when and why to introduce solid foods to their
infants: influencing factors. Journal of Community Health Nursing, 24(2), 101-118. doi:
10.1080/07370010701316247
Hsu, Y. C., Chen, C. H., Lin, M. C., Tsai, C. R., Liang, J. T., & Wang, T. M. (2014). Changes in
preterm breast milk nutrient content in the first month. Pediatrics and Neonatology,
55(6), 449-454. doi: 10.1016/j.pedneo.2014.03.002
Iacobelli, Silvia, Bonsante, Francesco, Quantin, Catherine, Robillard, Pierre-Yves, Binquet,
Christine, & Gouyon, Jean-Bernard. (2013). Total plasma protein in very preterm babies:
Prognostic value and comparison with illness severity scores. PloS One, 8(4).

68
Ikegami, H., Funato, M., Tamai, H., Wada, H., Nabetani, M., & Nishihara, M. (2010). Low-dose
vasopressin infusion therapy for refractory hypotension in ELBW infants. Pediatrics
International, 52(3), 368-373. doi: 10.1111/j.1442-200X.2009.02967.x
Ip, S., Chung, M., Raman, G., Trikalinos, T. A., & Lau, J. (2009). A summary of the Agency for
Healthcare Research and Quality's evidence report on breastfeeding in developed
countries. Breastfeeding Medicine, 4 Suppl 1, S17-30. doi: 10.1089/bfm.2009.0050
Iyer, N. P., & Mhanna, M. J. (2013). Non-invasively derived respiratory severity score and
oxygenation index in ventilated newborn infants. Pediatric Pulmonology, 48(4), 364-369.
doi: 10.1002/ppul.22607
Kadivar, Maliheh, Sagheb, Setareh, Bavafa, Fariba, Moghadam, Lida, & Eshrati, Babak. (2007).
Neonatal mortality risk assessment in a neonatal intensive care unit (NICU). Iranian
Journal of Pediatrics, 17(4), 325-331.
Kapadia, V. S., Chalak, L. F., DuPont, T. L., Rollins, N. K., Brion, L. P., & Wyckoff, M. H.
(2013). Perinatal asphyxia with hyperoxemia within the first hour of life is associated
with moderate to severe hypoxic-ischemic encephalopathy. Journal of Pediatrics, 163(4),
949-954. doi: 10.1016/j.jpeds.2013.04.043
Karlowicz, M. G., & Adelman, R. D. (1995). Nonoliguric and oliguric acute renal failure in
asphyxiated term neonates. Pediatric Nephrology, 9(6), 718-722.
Kaur, S., Jain, S., Saha, A., Chawla, D., Parmar, V. R., Basu, S., & Kaur, J. (2011). Evaluation of
glomerular and tubular renal function in neonates with birth asphyxia. Annals of Tropical
Paediatrics, 31(2), 129-134. doi: 10.1179/146532811x12925735813922

69
Kirpalani, H., Whyte, R. K., Andersen, C., Asztalos, E. V., Heddle, N., Blajchman, M. A., . . .
Roberts, R. S. (2006). The Premature Infants in Need of Transfusion (PINT) study: A
randomized, controlled trial of a restrictive (low) versus liberal (high) transfusion
threshold for extremely low birth weight infants. Journal of Pediatrics, 149(3), 301-307.
doi: 10.1016/j.jpeds.2006.05.011
Klingenberg, C., Embleton, N. D., Jacobs, S. E., O'Connell, L. A., & Kuschel, C. A. (2012).
Enteral feeding practices in very preterm infants: An international survey. Archives of
Disease in Childhood: Fetal and Neonatal Edition, 97(1), F56-61. doi:
10.1136/adc.2010.204123
Lam, J. C., Claydon, J., Mitton, C. R., & Skarsgard, E. D. (2006). A risk-adjusted study of
outcome and resource utilization for congenital diaphragmatic hernia. Journal of
Pediatric Surgery, 41(5), 883-887. doi: 10.1016/j.jpedsurg.2006.01.025
Laughon, M., Bose, C., Allred, E., O'Shea, T. M., Van Marter, L. J., Bednarek, F., & Leviton, A.
(2007). Factors associated with treatment for hypotension in extremely low gestational
age newborns during the first postnatal week. Pediatrics, 119(2), 273-280. doi:
10.1542/peds.2006-1138
Lee, J., Kim, H. S., Jung, Y. H., Choi, K. Y., Shin, S. H., Kim, E. K., & Choi, J. H. (2015).
Oropharyngeal colostrum administration in extremely premature infants: An RCT.
Pediatrics, 135(2), e357-366. doi: 10.1542/peds.2014-2004
Lee, S. K., Lee, D. S., Andrews, W. L., Baboolal, R., Pendray, M., & Stewart, S. (2003). Higher
mortality rates among inborn infants admitted to neonatal intensive care units at night.
Journal of Pediatrics, 143(5), 592-597.

70
Lee, T. Y., Lee, T. T., & Kuo, S. C. (2009). The experiences of mothers in breastfeeding their
very low birth weight infants. Journal of Advanced Nursing, 65(12), 2523-2531. doi:
10.1111/j.1365-2648.2009.05116.x
Lim, L., & Rozycki, H. J. (2008). Postnatal SNAP-II scores in neonatal intensive care unit
patients: relationship to sepsis, necrotizing enterocolitis, and death. Journal of Maternal-
Fetal & Neonatal Medicine, 21(6), 415-419. doi: 10.1080/14767050802046481
Logan, J. W., O'Shea, T. M., Allred, E. N., Laughon, M. M., Bose, C. L., Dammann, O., . . .
Leviton, A. (2011). Early postnatal hypotension and developmental delay at 24 months of
age among extremely low gestational age newborns. Archives of Disease in Childhood:
Fetal and Neonatal Edition, 96(5), F321-328. doi: 10.1136/adc.2010.183335
Logan, J. W., O'Shea, T. M., Allred, E. N., Laughon, M. M., Bose, C. L., Dammann, O., . . .
Leviton, A. (2011). Early postnatal hypotension is not associated with indicators of white
matter damage or cerebral palsy in extremely low gestational age newborns. Journal of
Perinatology, 31(8), 524-534. doi: 10.1038/jp.2010.201
Lucas da Silva, P. S., Euzebio de Aguiar, V., & Reis, M. E. (2012). Assessing outcome in
interhospital infant transport: The transport risk index of physiologic stability score at
admission. American Journal of Perinatology, 29(7), 509-514. doi: 10.1055/s-0032-
1310521
Ma, X. L., Xu, X. F., Chen, C., Yan, C. Y., Liu, Y. M., Liu, L., . . . Du, L. Z. (2010).
Epidemiology of respiratory distress and the illness severity in late preterm or term
infants: A prospective multi-center study. Chinese Medical Journal (Engl.), 123(20),
2776-2780.

71
Madan, J., Fiascone, J., Balasubramanian, V., Griffith, J., & Hagadorn, J. I. (2008). Predictors of
ductal closure and intestinal complications in very low birth weight infants treated with
indomethacin. Neonatology, 94(1), 45-51. doi: 10.1159/000113058
Malin, G. L., Morris, R. K., & Khan, K. S. (2010). Strength of association between umbilical
cord pH and perinatal and long term outcomes: Systematic review and meta-analysis.
BMJ, 340, c1471.
Martens, S. E., Rijken, M., Stoelhorst, G. M., van Zwieten, P. H., Zwinderman, A. H., Wit, J. M.,
. . . Veen, S. (2003). Is hypotension a major risk factor for neurological morbidity at term
age in very preterm infants? Early Human Development, 75(1-2), 79-89.
Martin, J. A., Hamilton, B. E., Osterman, M. J., Curtin, S. C., & Matthews, T. J. (2015). Births:
Final data for 2013. National Vital Statistics Reports, 64(1), 1-65.
Mathews, T. J., & MacDorman, M. F. (2010). Infant mortality statistics from the 2006 period
linked birth/infant death data set. National Vital Statistics Reports, 58(17), 1-31.
Mathews, T. J., & MacDorman, M. F. (2012). Infant mortality statistics from the 2008 period
linked birth/infant death data set. National Vital Statistics Reports, 60(5), 1-28.
Mathews, T. J., & MacDorman, M. F. (2013). Infant mortality statistics from the 2009 period
linked birth/infant death data set. National Vital Statistics Reports, 61(8), 1-28.
Mathur, N. B., & Arora, D. (2007). Role of TOPS (a simplified assessment of neonatal acute
physiology) in predicting mortality in transported neonates. Acta Paediatrica, 96(2), 172-
175.
Meadow, W., Cohen-Cutler, S., Spelke, B., Kim, A., Plesac, M., Weis, K., & Lagatta, J. (2012).
The prediction and cost of futility in the NICU. Acta Paediatrica, 101(4), 397-402. doi:
10.1111/j.1651-2227.2011.02555.x

72
Meier, P. P., Engstrom, J. L., Mingolelli, S. S., Miracle, D. J., & Kiesling, S. (2004). The Rush
Mothers' Milk Club: Breastfeeding interventions for mothers with very-low-birth-weight
infants. Journal of Obstetric, Gynecologic, and Neonatal Nursing, 33(2), 164-174.
Meyn, D. F., Jr., Ness, J., Ambalavanan, N., & Carlo, W. A. (2010). Prophylactic phenobarbital
and whole-body cooling for neonatal hypoxic-ischemic encephalopathy. Journal of
Pediatrics, 157(2), 334-336. doi: 10.1016/j.jpeds.2010.04.005
Miletin, J., Pichova, K., Doyle, S., & Dempsey, E. M. (2010). Serum cortisol values, superior
vena cava flow and illness severity scores in very low birth weight infants. Journal of
Perinatology, 30(8), 522-526.
Mills, J. A., Lin, Y., Macnab, Y. C., & Skarsgard, E. D. (2010). Perinatal predictors of outcome
in gastroschisis. Journal of Perinatology, 30(12), 809-813. doi: 10.1038/jp.2010.43
Mok, Q., Bass, C. A., Ducker, D. A., & McIntosh, N. (1991). Temperature instability during
nursing procedures in preterm neonates. Archives of Disease in Childhood, 66(7 Spec
No), 783-786.
Morken, N. H. (2012). Preterm birth: New data on a global health priority. Lancet, 379(9832),
2128-2130. doi: 10.1016/s0140-6736(12)60857-5
Morse, S., Groer, M., Shelton, M. M., Maguire, D., & Ashmeade, T. (2015). A systematic
review: The utility of the revised version of the Score for Neonatal Acute Physiology
among critically ill neonates. Journal of Perinatal and Neonatal Nursing, 29(4), 315-344;
quiz E312. doi: 10.1097/jpn.0000000000000135

73
Murray, D. M., Boylan, G. B., Ali, I., Ryan, C. A., Murphy, B. P., & Connolly, S. (2008).
Defining the gap between electrographic seizure burden, clinical expression and staff
recognition of neonatal seizures. Archives of Disease in Childhood: Fetal and Neonatal
Edition, 93(3), F187-191. doi: 10.1136/adc.2005.086314
Nakwan, N., Nakwan, N., & Wannaro, J. (2011). Predicting mortality in infants with persistent
pulmonary hypertension of the newborn with the Score for Neonatal Acute Physiology-
Version II (SNAP-II) in Thai neonates. Journal of Perinatal Medicine, 39(3), 311-315.
doi: 10.1515/jpm.2011.011
Nasr, A., & Langer, J. C. (2011). Influence of location of delivery on outcome in neonates with
congenital diaphragmatic hernia. Journal of Pediatric Surgery, 46(5), 814-816. doi:
10.1016/j.jpedsurg.2011.02.007
Okamoto, T., Shirai, M., Kokubo, M., Takahashi, S., Kajino, M., Takase, M., . . . Oki, J. (2007).
Human milk reduces the risk of retinal detachment in extremely low-birthweight infants.
Pediatrics International, 49(6), 894-897. doi: 10.1111/j.1442-200X.2007.02483.x
Parker, L. A. (2013). Necrotizing enterocolitis: Have we made any progress in reducing the risk?
Advances in Neonatal Care, 13(5), 317-324. doi: 10.1097/ANC.0b013e31829a872c
Perrine, C. G., & Scanlon, K. S. (2013). Prevalence of use of human milk in US advanced care
neonatal units. Pediatrics, 131(6), 1066-1071. doi: 10.1542/peds.2012-3823
Pineda, R. G. (2011). Predictors of breastfeeding and breastmilk feeding among very low birth
weight infants. Breastfeeding Medicine, 6(1), 15-19. doi: 10.1089/bfm.2010.0010
Quigley, M., & McGuire, W. (2014). Formula versus donor breast milk for feeding preterm or
low birth weight infants. Cochrane Database of Systematic Reviews, 4, Cd002971. doi:
10.1002/14651858.CD002971.pub3
74
Richardson, D., Gray, J., McCormick, M., Workman, K., & Goldmann, D. (1991). Score for
Neonatal Acute Physiology (Snap) - A physiology-based severity of illness index.
Pediatric Research, 29(4), A262-A262.
Richardson, D. K., Corcoran, J. D., Escobar, G. J., & Lee, S. K. (2001). SNAP-II and SNAPPE-
II: Simplified newborn illness severity and mortality risk scores. Journal of Pediatrics,
138(1), 92-100.
Richardson, D. K., Gray, J. E., McCormick, M. C., Workman, K., & Goldmann, D. A. (1993).
Score for Neonatal Acute Physiology: A physiologic severity index for neonatal intensive
care. Pediatrics, 91(3), 617-623.
Richardson, D. K., Phibbs, C. S., Gray, J. E., McCormick, M. C., Workman-Daniels, K., &
Goldmann, D. A. (1993). Birth weight and illness severity: Independent predictors of
neonatal mortality. Pediatrics, 91(5), 969-975.
Romieu, I., Werneck, G., Ruiz Velasco, S., White, M., & Hernandez, M. (2000). Breastfeeding
and asthma among Brazilian children. Journal of Asthma, 37(7), 575-583.
Schanler, R. J. (2007). Mother's own milk, donor human milk, and preterm formulas in the
feeding of extremely premature infants. Journal of Pediatric Gastroenterology and
Nutrition, 45 Suppl 3, S175-177. doi: 10.1097/01.mpg.0000302967.83244.36
Schanler, R. J. (2011). Outcomes of human milk-fed premature infants. Seminars in
Perinatology, 35(1), 29-33. doi: 10.1053/j.semperi.2010.10.005
Sehgal, A., Osborn, D., & McNamara, P. J. (2012). Cardiovascular support in preterm infants: A
survey of practices in Australia and New Zealand. Journal of Paediatrics and Child
Health, 48(4), 317-323. doi: 10.1111/j.1440-1754.2011.02246.x

75
Sink, D. W., Hope, S. A., & Hagadorn, J. I. (2011). Nurse:patient ratio and achievement of
oxygen saturation goals in premature infants. Archives of Disease in Childhood: Fetal
and Neonatal Edition, 96(2), F93-98. doi: 10.1136/adc.2009.178616
Skarsgard, E. D., MacNab, Y. C., Qiu, Z., Little, R., & Lee, S. K. (2005). SNAP-II predicts
mortality among infants with congenital diaphragmatic hernia. Journal of Perinatology,
25(5), 315-319. doi: 10.1038/sj.jp.7211257
Smith, H. and Embleton, N. D. (2013). Improving expressed breast milk (EBM) provision in the
neonatal unit: A rapid and effective quality improment (QI) intervention. Journal of
Neonatal Nursing, 10, 149-153.
Soraisham, A. S., Singhal, N., McMillan, D. D., Sauve, R. S., & Lee, S. K. (2009). A multicenter
study on the clinical outcome of chorioamnionitis in preterm infants. American Journal
of Obstetrics and Gynecology, 200(4), 372 e371-376. doi: 10.1016/j.ajog.2008.11.034
Srinivasakumar, P., Zempel, J., Wallendorf, M., Lawrence, R., Inder, T., & Mathur, A. (2013).
Therapeutic hypothermia in neonatal hypoxic ischemic encephalopathy: Electrographic
seizures and magnetic resonance imaging evidence of injury. Journal of Pediatrics,
163(2), 465-470. doi: 10.1016/j.jpeds.2013.01.041
Stanger, J., Mohajerani, N., & Skarsgard, E. D. (2014). Practice variation in gastroschisis:
Factors influencing closure technique. Journal of Pediatric Surgery, 49(5), 720-723. doi:
10.1016/j.jpedsurg.2014.02.066
Subhedar, N. V., Tan, A. T., Sweeney, E. M., & Shaw, N. J. (2000). A comparison of indices of
respiratory failure in ventilated preterm infants. Archives of Disease in Childhood: Fetal
and Neonatal Edition, 83(2), F97-100.

76
Sundaram, V., Dutta, S., Ahluwalia, J., & Narang, A. (2009). Score for neonatal acute
physiology II predicts mortality and persistent organ dysfunction in neonates with severe
septicemia. Indian Pediatrics, 46(9), 775-780.
Sutton, L., Bajuk, B., Berry, G., Sayer, G. P., Richardson, V., & Henderson-Smart, D. J. (2002).
Score of neonatal acute physiology as a measure of illness severity in mechanically
ventilated term babies. Acta Paediatrica, 91(4), 415-423.
Tabachnick, B. G., & Fidell, L. S. (2013). Using multivariate statistics (6th ed.). Boston:
Pearson.
Tamim, M. M., Alesseh, H., & Aziz, H. (2003). Analysis of the efficacy of urine culture as part
of sepsis evaluation in the premature infant. Pediatric Infectious Disease Journal, 22(9),
805-808. doi: 10.1097/01.inf.0000083822.31857.43
ter Horst, H. J., Jongbloed-Pereboom, M., van Eykern, L. A., & Bos, A. F. (2011). Amplitude-
integrated electroencephalographic activity is suppressed in preterm infants with high
scores on illness severity. Early Human Development, 87(5), 385-390. doi:
10.1016/j.earlhumdev.2011.02.006
Viswanathan, S., Manyam, B., Azhibekov, T., & Mhanna, M. J. (2012). Risk factors associated
with acute kidney injury in extremely low birth weight (ELBW) infants. Pediatric
Nephrology, 27(2), 303-311. doi: 10.1007/s00467-011-1977-8
Vohr, B. R., Poindexter, B. B., Dusick, A. M., McKinley, L. T., Higgins, R. D., Langer, J. C., &
Poole, W. K. (2007). Persistent beneficial effects of breast milk ingested in the neonatal
intensive care unit on outcomes of extremely low birth weight infants at 30 months of
age. Pediatrics, 120(4), e953-959. doi: 10.1542/peds.2006-3227

77
Vohr, B. R., Poindexter, B. B., Dusick, A. M., McKinley, L. T., Wright, L. L., Langer, J. C., &
Poole, W. K. (2006). Beneficial effects of breast milk in the neonatal intensive care unit
on the developmental outcome of extremely low birth weight infants at 18 months of age.
Pediatrics, 118(1), e115-123. doi: 10.1542/peds.2005-2382
Wilson, Marnie Goodwin, Beres, Alana, Baird, Robert, Laberge, Jean-Martin, Skarsgard, Erik
D., & Puligandla, Pramod S. (2013). Congenital diaphragmatic hernia (CDH) mortality
without surgical repair? A plea to clarify surgical ineligibility. Journal of Pediatric
Surgery, 48(5), 924-929.
Wong, C., Mak, M., Shivananda, S., Yang, J., Shah, P. S., Seidlitz, W., . . . Cameron, B. H.
(2013). Outcomes of neonatal patent ductus arteriosus ligation in Canadian neonatal units
with and without pediatric cardiac surgery programs. Journal of Pediatric Surgery, 48(5),
909-914. doi: 10.1016/j.jpedsurg.2013.02.004
Yu, B., Cohen, A., Adams-Thames, A., Lowry, J., Hylton, T., & Cui, D. Florida Pregnancy Risk
Assessment Monitoring System (PRAMS) 2000-2011 Trend Report (Bureau of
Epidemiology Florida Department of Health, Trans.). Tallahassee.
Zardo, M. S., & Procianoy, R. S. (2003). [Comparison between different mortality risk scores in
a neonatal intensive care unit]. Revista de Saúde Publica, 37(5), 591-596.
Zupancic, J. A., Richardson, D. K., Horbar, J. D., Carpenter, J. H., Lee, S. K., & Escobar, G. J.
(2007). Revalidation of the Score for Neonatal Acute Physiology in the Vermont Oxford
Network. Pediatrics, 119(1), e156-163. doi: 10.1542/peds.2005-2957

78
Zwicker, J. G., Grunau, R. E., Adams, E., Chau, V., Brant, R., Poskitt, K. J., . . . Miller, S. P.
(2013). Score for neonatal acute physiology-II and neonatal pain predict corticospinal
tract development in premature newborns. Pediatric Neurology, 48(2), 123-129 e121.
doi: 10.1016/j.pediatrneurol.2012.10.016

79
APPENDICES
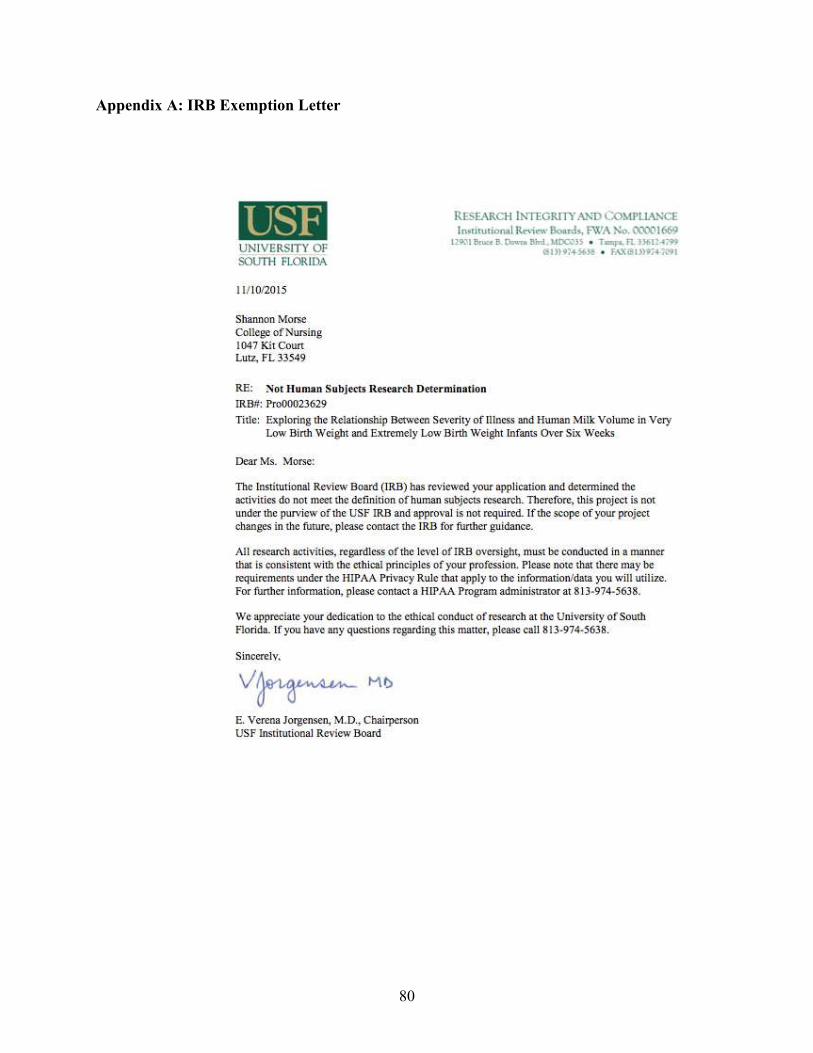
80
Appendix A: IRB Exemption Letter
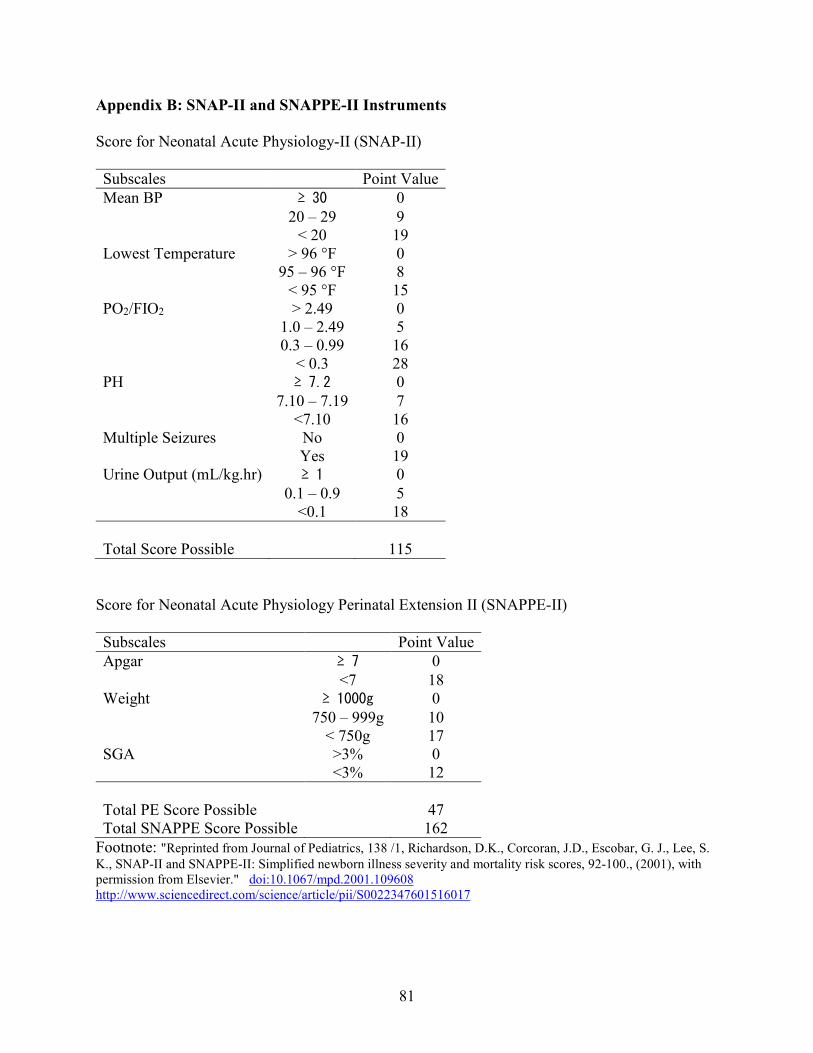
81
Appendix B: SNAP-II and SNAPPE-II Instruments
Score for Neonatal Acute Physiology-II (SNAP-II)
Subscales Point Value
Mean BP ≥ 30 0
20 – 29 9 < 20 19 Lowest Temperature > 96 °F 0 95 – 96 °F 8 < 95 °F 15 PO2/FIO2 > 2.49 0 1.0 – 2.49 5 0.3 – 0.99 16 < 0.3 28 PH ≥ 7.2 0
7.10 – 7.19 7 <7.10 16 Multiple Seizures No 0 Yes 19 Urine Output (mL/kg.hr) ≥ 1 0
0.1 – 0.9 5 <0.1 18
Total Score Possible 115
Score for Neonatal Acute Physiology Perinatal Extension II (SNAPPE-II)
Subscales Point Value
Apgar ≥ 7 0
<7 18 Weight ≥ 1000g 0
750 – 999g 10 < 750g 17 SGA >3% 0
<3% 12
Total PE Score Possible 47 Total SNAPPE Score Possible 162
Footnote: "Reprinted from Journal of Pediatrics, 138 /1, Richardson, D.K., Corcoran, J.D., Escobar, G. J., Lee, S.
K., SNAP-II and SNAPPE-II: Simplified newborn illness severity and mortality risk scores, 92-100., (2001), with permission from Elsevier." doi:10.1067/mpd.2001.109608 http://www.sciencedirect.com/science/article/pii/S0022347601516017

82
Appendix C: Copyright Permission Letters

83
84

85

86

87

88

89
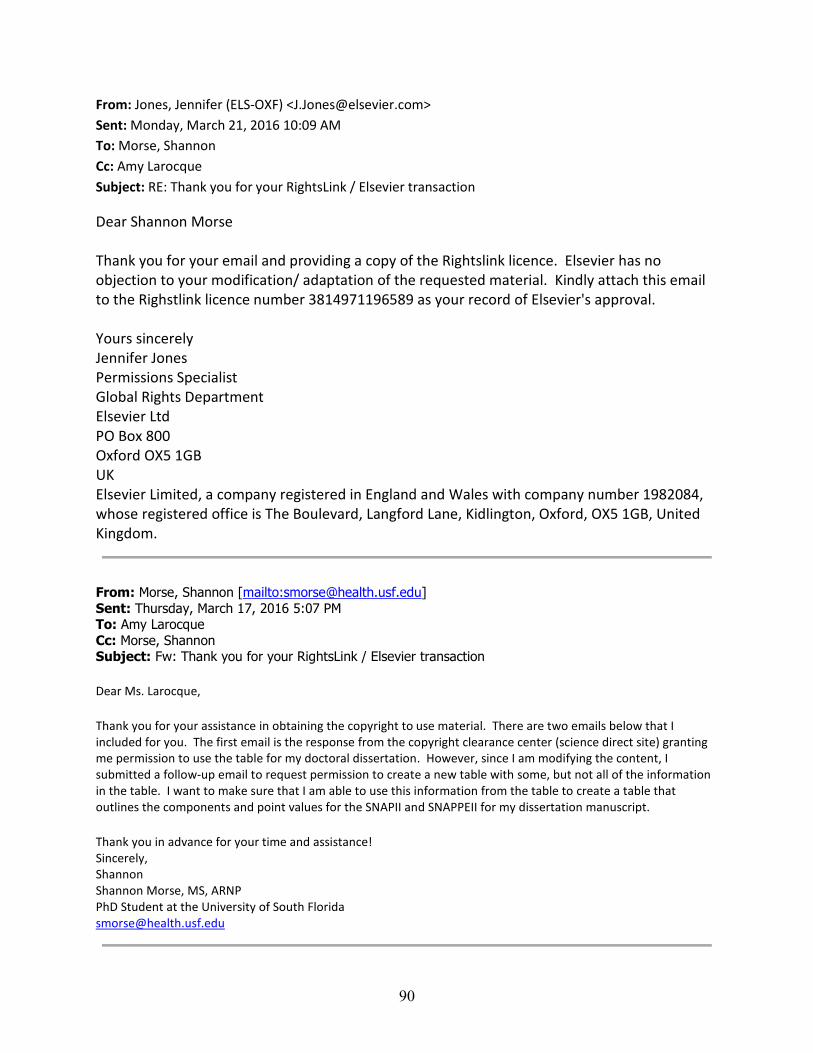
90
From: Jones, Jennifer (ELS-OXF) <[email protected]>
Sent: Monday, March 21, 2016 10:09 AM
To: Morse, Shannon
Cc: Amy Larocque
Subject: RE: Thank you for your RightsLink / Elsevier transaction
Dear Shannon Morse
Thank you for your email and providing a copy of the Rightslink licence. Elsevier has no
objection to your modification/ adaptation of the requested material. Kindly attach this email
to the Righstlink licence number 3814971196589 as your record of Elsevier's approval.
Yours sincerely
Jennifer Jones
Permissions Specialist
Global Rights Department
Elsevier Ltd
PO Box 800
Oxford OX5 1GB
UK
Elsevier Limited, a company registered in England and Wales with company number 1982084,
whose registered office is The Boulevard, Langford Lane, Kidlington, Oxford, OX5 1GB, United
Kingdom.
From: Morse, Shannon [mailto:[email protected]]
Sent: Thursday, March 17, 2016 5:07 PM To: Amy Larocque
Cc: Morse, Shannon Subject: Fw: Thank you for your RightsLink / Elsevier transaction
Dear Ms. Larocque,
Thank you for your assistance in obtaining the copyright to use material. There are two emails below that I
included for you. The first email is the response from the copyright clearance center (science direct site) granting
me permission to use the table for my doctoral dissertation. However, since I am modifying the content, I
submitted a follow-up email to request permission to create a new table with some, but not all of the information
in the table. I want to make sure that I am able to use this information from the table to create a table that
outlines the components and point values for the SNAPII and SNAPPEII for my dissertation manuscript.
Thank you in advance for your time and assistance!
Sincerely,
Shannon
Shannon Morse, MS, ARNP
PhD Student at the University of South Florida

91
From: Morse, Shannon
Sent: Tuesday, February 23, 2016 5:42 PM
Cc: Morse, Shannon
Subject: Fw: Thank you for your RightsLink / Elsevier transaction
Good Evening!
I am a doctoral student at the University of South Florida. I am interested in using information from table 2 that
was published in the article below in my dissertation. I completed the reuse request and gained permission for
use of this table in my dissertation. (Please see the email below for reference.) However, I do not want to use all
of the information in this table. I am specifically interested in creating a table that outlines each variable used in
the SNAP-II and SNAPPE-II. I would also like to include the associated point value for each variable and the total
score. I am emailing the permissions department per the terms and conditions since I am interested in decreasing
some of the data that is presented in this table.
Thank you in advance for considering my request to use this information for my dissertation at the University of
South Florida that will be submitted to ProQuest per the USF Graduate School requirements.
Sincerely,
Shannon Morse, MS, ARNP
PhD Student at the University of South Florida