Embed Size (px)
Citation preview
Copyright ©, 2018 Ala-Too International University.
Eurasian Journal of Business and Economics 2018, 11(21), 101-116.
Exploring the Relationship between Financial Ratios and Market Stock Returns
Sami RM MUSALLAM*1
Received: December 1, 2017 Revised: May 15, 2018 Accepted: May 19, 2018
Abstract
This paper explores the relationship between financial ratios and market stock returns of 26 Qatari listed firms from 2009 to 2015. The results of Weighted Least Square (WLS) show that earnings per share, earnings yield ratio, and dividend yield ratio have significant and positive relationship with market stock returns while market to book value ratio, return on assets, return on equity, price to earnings ratio, dividends earnings ratio, and net profit margin have insignificant relationship with market stock returns. The implications will be for policymakers of government in selecting and deciding their policies. It will also be for investors and managers to make better decisions.
Keywords: Financial Ratios; Market Stock Returns; Weighted Least Square; Qatar
JEL Codes Classification: C33, E44, G11, G12, G17 UDC: 336.051+ 336.761 DOI: https://doi.org/10.17015/ejbe.2018.021.06
*Corresponding author. Assistant Professor, International University of Sarajevo (IUS), Sarajevo, Bosnia and Herzegovina. Email: samimslam @ yahoo.com

Sami RM MUSALLAM
Page | 102 EJBE 2018, 11(21)
1. Introduction
The main goal of investors to invest in the company stocks is to maximize their wealth which will be accomplished through market stock return. Market stock return is considered as a key factor in selecting the best opportunity of investments. In order to select the best opportunity with high return and low risk; investor needs more information about the financial reporting of acompany to identify its fiscal health and financial performance. Anwaar (2016) argues that investors can use financial information as one of the essential components that can help them in setting choices to put resources into a firm. Emamgholipour et al. (2013) argue that firm information exists based on internal or external information. The internal information of a firm includes its financial statements such as balance sheet statement, cash flow statement, and income statement while external information of a firm exists in the stock market. Such those internal or external information may effect on investor making decisions to determine the stock return in the market.
During investment in stocks, investors would use financial information to evaluate the past, current, and future amount of stock return of a company. The preparation of financial ratios is among the most common techniques to evaluate financial information. In fact, financial ratio analyses are used for all type of purposes. These include the assessment of the ability of a company to pay its obligations, the evaluation of business and managerial achievement and even the statutory regulation of a company performance. Generally, financial ratios are recognized as being accurate in determining the investment opportunities. Namazi and Rostami (2006) argue that financial ratios are considered as a summary of the financial reports of a company to provide more information about the internal situation of a company. Furthermore, financial ratios are one of the most common used tools in assessing the performance of a firm.
Financial ratio analyses allow comparing different measurements of a firm performance between equivalent units and inside a solitary unit after some time periods. As relative devices, financial ratios are utilized to measure a company’s performance after some time (trend analysis) and to compare it with that of its rivals (comparative analysis). The figures utilized as a part of computing financial ratios essentially originated from balance sheet statements, income statements, and cash flow statements prepared, for example, under Generally Acceptable Accounting Practice Standards. Therefore, financial ratios are expansion of other financial statement analytical techniques. The five major categories of financial ratios measure profitability, efficiency, leverage, liquidity, and market value ratios.
Financial ratios and their effects on market stock return have been received more attention over the past few decades. Barnes (1987) explores the actual relationship between financial ratios and stock returns since ratios are perceived as helpful in predicting future rates of returns. Beaver (1966) argue that financial ratios are

Exploring the Relationship between Financial Ratios and Market Stock Returns
EJBE 2018, 11(21) Page | 103
generally used as inputs to predict a number of business related situations i.e., risk, financial distress, future cash flows, and credit ratings, and, among others. Delen, Kuzey, and Uyar (2013) indicate that the most significant variables in forecasting future returns is net profit margin ratio and earnings before interest and tax to equity ratio. Katchova and Enlow (2013) evaluate Du Pont ratios to compare return on equity components among agri-businesses and all companies. The results of Du Pont ratios show that agri-businesses outperform at the median the sample of all companies in terms of financial ratios associated with liquidity, market ratios, and profitability, but had marginally lower debt ratios and liquidity ratios.
Pech, Noguera, and White (2015) provide evidence that the estimates of financial ratios is the most favored used as a part of practices by equity analysts which have predictive power on one year future stock returns while no evidence of predictive power on two years stock returns. Wang and Lee (2010) use profitability, leverage, turnover, and solvency ratios in Taiwan to generate a matrix that offer an estimate of the strength of a company within the shipping industry. Lewellen (2004) argue that financial ratios are used as a tool of predicting for market stock returns. Bower and Bower (1969), Lewellen (2004), Shafana, Fathima, and Inunjariya (2013), Kheradyar, Ibrahim, and Mat Nor (2011), and Zahir (1992) also argue that financial ratios consider as an effective tools in predicting stock returns with the lowest level of risks as compared to historical returns, observations, movements, and other alternative variables. Chen and Shen (2009), Lewellen (2004) and Shafna et al.’s (2013) state that the most three effective and useful financial ratiosin predicting the ability of stock returns are dividend yield ratio, book to market value ratio, and earning yield ratio among the most respected ratios. Jais, Jakpar, Doris, and Shaikh (2012) reveal that historical accounting signs can anticipate stock returns.
Prior research on the relationship between financial ratios and market stock return is conducted in different nations (see for example, Anwaar, 2016; Bower & Bower, 1969; Chen & Shen, 2009; Lewellen, 2004; Shafana et al., 2013; Kheradyaret, al.’s, 2011; Pech et al., 2015; Zahir, 1992). Consequently, the relationship between financial ratios and market stock return might be diverse in various nations (Konijn, Kraussl, & Lucas, 2011). However, an extended research is required in different nations. This paper is one of the primary endeavors to research to explore the relationship between financial ratios and market stock returns of companies that are listed on Qatar stock exchange.
Over the past time in Qatar, the economic environment and foreign investments have been obtained improvements due to the main key factors such as the country's political stability, an investment law passed in 2010, and the lowest tax rates which allow foreign investors to own the whole of a company stock in certain sectors i.e., sports, information technology, and counseling. Furthermore, Qatar investment fund has offered an introduction to a country with developing gross domestic product as a result of government strategy to diversify away of reliance on hydrocarbon derived incomes and infrastructure expenditure ahead of the FIFA
Sami RM MUSALLAM
Page | 104 EJBE 2018, 11(21)
2022 World Cup and a nation populace development. Stocks are picked in light of their potential for long-term capital growth, dividend yield, and attractive valuations. Hence, the government of Qatar has been recently effective in enhancing the economy away of a reliance on hydrocarbon based development. Moreover, the stock market in Qatar is trading a lower its long-term average forward price to earnings multiple and offers an attractive dividend yield. An adjustment in the status of the market by FTSE Russell should incite a great deal of uninvolved investment interest in the nation within 2016 and 2017. Finally, a lot of amount of foreign investors will surely inflow into Qatar next coming years because of the organization of the FIFA 2022 World Cup. Basically, this study is important for policymakers of government to support its economic policies. It is also important for investors and managers to make right decisions.
2. Literature Review
Since financial ratios are used as a significant tool of forecasting future rate of returns, existing research has been examining the relationship between financial ratios and market stock return. It is revealed that price to earnings ratio is not reflected share prices and stock return is very fast (Basu, 1977). He also reveals that generally stock equation in the coefficients of different profit is incorrectly priced as compared to other pricing or chances could be attained for market abnormal return which would be provided for the investors. Basu (1975) in his prior study also shows that high earning yield ratio perform better than low earning yield ratio regardless of a higher level of systematic risks. Rozeff (1982) studies the predictive of dividend yield ratio and finds that there is a positive relationship between the dividend yield ratio and the expected market stock return. The reason for this relationship is that dividend yield ratio acts as a measure of the ex-ante risk premium. Furthermore, Campbell and Shiller (1988) claim that dividend yield ratio has the ability to restrict with expected market stock return, thus dividend yield ratio is considered as a good predictive of market stock returns. Lewellen (2004) uses a sample of companies listed on New York stock exchange to examine the predictability of dividend yield ratio, earnings yield ratio and book to market ratio. His results provide evidence that dividend yield ratio is a good predictive for market stock return over the period of 1946 to 2000 while earnings yield ratio and book to market ratio as predictors seem to have limited predictive power. Daniel and Titman (1997) suggest that dividend yield ratio, earnings yield ratio, and book to market ratio as a company characteristic have explanatory power for the market stock returns.
Tudor (2010) uses the two way fixed effects model and indicates that earnings yield ratio and book to market ratio have strong explanatory power for the market stock returns of the Romanian stock market during the period from 2002 to 2008. Chan, Hamao, and Lakonishok (1991) use the fundamental ratios such as price to earnings ratio, dividend yield, and book to market ratio and find that all ratios have significant effect on the stock returns of Japanese market. They also argue that the
Exploring the Relationship between Financial Ratios and Market Stock Returns
EJBE 2018, 11(21) Page | 105
earning yield ratio has indirect relationship with stocks returns in Japan. Fama and French (1993) test the relationship between stockholders’ bond value toearning to price ratioand market valuewith stock return on average. They find that stockholders’ bond value to market value is significant related tomarket stock return on average while other financial ratiosare insignificant related tomarket stock return on average. Mukerji, Dhatt, and Kim, (1997) show that each of book to market value ratio and dividend yield ratio have direct relationship withstock return of Korean market over a period of 1982 to 1992. They also find that price to earnings ratio is less trustworthy indicator than book to market value ratio. They also note that book to market value ratio is responsible for the direct relationship between debt to equity ratio and market stock return. Furthermore, Kothari and Shanken (1997) also show that the book to market value ratio and dividend yield ratio related to market stock return in US market has reliable proof for expected stock returns during a period of 1926 to 1991.
Cheung, Chung and Kim (1997) examine the incremental and relative usefulness of book to price ratio and earnings to price ratio for predicting market stock returns of Hong Kong listed firms. They show that book to price ratio and earnings to price ratio are strong in predicting market stock returns. Alexakis, Patra, and Poshakwale (2010) use accounting information to test the predictability of stock returns of companies that are listed on Athens Stock Exchange over a period from 1993 to 2006. They conclude that the financial ratios selected contain significant information in predicting the cross section of stock return. They also find that the portfolio selected on the basis of financial ratios produce higher than average stock returns, indicating that the emerging Greek market is not fully incorporated with accounting information for stock prices and thus the market is not considered as semi strong efficient. Lau, Lee, and Mcinish (2002) investigate the effect of financial ratios onmarket stock returns of 163 firms listed on Bursa Malaysia and 82 firms listed on the Singapore stock exchange over a period of 1988 to1996. The results of Malaysian firmsshow that earnings to price ratio is significant related to market stock return while book to market value ratio is not significant related to market stock return. Furthermore, the results of Singaporean firms show that book to market value ratio and earnings to price ratio are not significant related to market stock return. Lewellen (2004) indicate that the highest power in predicting market stock return is dividend yield ratio as compared to price to earnings ratio and book to market value ratio in United States (US) market.
Omran (2004) uses a sample of 46 Egyptian firms over a period of 1996 to 2000 to examine the linearity relationship between financial ratios and market stock return. He finds that nonlinear relationships exist between financial ratios and market stock return which are more descriptive of the behaviors of stock returns. This result is in line with Mramor and Pahor (1998) and Mramor and Mramor-Kosta (1997), who indicates that linear relationships may not generally exist. Auret and Sinclaire (2006) use a sample of all companies that are listed on the Johannesburg stock exchange in years 1990 to 2000 to test the influence of financial ratios on

Sami RM MUSALLAM
Page | 106 EJBE 2018, 11(21)
market stock return. They find that the effect of book to market value ratio is positive on stock return whereas the impact of price to earnings ratio is not significant on stock return. Aono and Iwaisako (2011) compare the financial ratios as a predictor of market stock return between companies listed on US and Japan markets. They find that Japanese financial ratios as a predictor of market stock return is weaker than US financial ratios i.e., price to dividend ratio and price to earnings ratio. Kheradyar et al.’s (2011) investigate the role of financial ratios as predictors of market stock return. Using a panel data of 100 listed companies in Bursa Malaysia from 2000 to 2009. The result of Generalized Least Square (GLS) method show that earnings yield, dividend yield, and book to market value ratio are positive related tomarket stock return of next coming year. Furthermore, it shows that book to market value ratio is greater against other two ratiosin clarifying market stock return of next coming year. However, Chairakwattana and Nathaphan (2014) employ a Bayesian model averaging to test the predictability power of future market stock returns of listed companies in Thailand during a period from 2001 to 2011. They find that book to market value ratio is useful predictors of future market stock returns, especially in favor of large cap stocks. However, Hjalmarsson (2010) examines test the predictability power of global stock returns and shows finds that earnings yield ratio does not have predictive power for global stock returns especially in Thailand case.
Zeytinoglu, Akarim, and Çelik (2012) examine the impacts of earnings per share ratio, price to earnings ratio, and marketto book value ratio on market stock return of current and future year. Using a sample of all insurance companies listed onTurkishmarket over the period of 2000 to 2009. They find that earnings per share ratio and price to earnings ratio are not significant related to market stock return of current and future year whereas market to book value ratio is significant related to market stock return of current and future year. Jais et al.’s (2012) conduct a research in Malaysia to testwhether a simple of a fundamental analyses strategy based on historical information on return of equity, price earning and debt to equitycan predict stock returns. They find that historical accounting information signs can predict stock return. Their result also reveals that all ratios are positively associated with future stock return. Khan et al. (2012) investigate the ability of financial ratios in predicting stock returns amongst 100 non-financial companies listed on the Karachi Stock Exchange in Pakistan during 7 years period from 2005 to 2011. The results of GLS model show that earning yield ratio and dividend yield ratio positively affect stock returns whereas book to market ratio negatively affects stock returns. The results also show that financial ratios have significant power of predictability in anticipating market stock return and they can also predict future market stock returnin Pakistan. Furthermore, the book to market value ratio is found to be more predictive as compared to other financial ratios. Also, the predictability of market return would be improved by the combination of financial ratios.

Exploring the Relationship between Financial Ratios and Market Stock Returns
EJBE 2018, 11(21) Page | 107
Iqbal, Khattak, and Khattak, (2013) investigate whether historical accounting information of financial ratios (return on assets and market to book ratio) using a quality of fundamental analysis to predict future market stock returns of all non-financial companies that are listed on Karachi stock exchange in Pakistan for ten years period from 2000 to 2009. They find that fundamental analysis used is not able to predict market stock returns. Emamgholipour et al. (2013) investigate the influences of financial ratios include price to earnings ratio, earnings per share, and market value to book value ratio on market stock return of Tehran listed companies over the period 2006 to 2010. They find that earnings per share is positive related to current and future market stock return while market to book value ratio and price to earnings ratio are negative related to current and future stock returns. Petcharabul and Suppanunta (2014) use a panel data of technology industries listed on Thailand stock exchange from 1997 to 2011 covering 15 years based on quarterly data selected. Five ratios from each category of financial ratios which are return on equity ratio from profitability ratios, current ratio from liquidity ratios, debt to equity ratio from debt ratios, price to earnings ratio from market value ratios, and inventory turnover ratio from asset activity ratios are used to determine the stock returns. The results of least squares regression model show that return on equity and price to earnings ratio are significantly associated with stock returns while other financial ratios are insignificantly associated with stock returns, indicating that only quarterly price to earnings ratio and return on equity can explain the quarterly market stock returns of technology industries.
Wijaya (2015) analyses the effect of financial ratios on market stock returns using a sample of 20 major manufacturing companies that are listed on Indonesian composite index during period of 2008 to 2013. He shows that return on assets, dividend yield, earnings yield, and book to market ratio are significantly affected market stock returns. However, debt to equity ratio is insignificantly effected market stock returns. Zaheri, and Barkhordary, (2015) use a panel data of listed companies on Tehran stock exchange over a period from 2004 to 2011 to investigate the relationship between financial characteristics include return on equity, return on assets, price to earnings ratio, book to market equity ratio, and net profit margin ratio with market stock return. They show that Book to market equity ratio, return on assets, and return on equity are significantly associated with market stock returns, while net margin profit is not associated with market stock returns. Arkan (2016) investigates the most importance of financial ratios derived from financial statements to predict stock return using a data sample of 15 firms distributed on 3 sectors of Kuwaiti Financial market over a period from 2005 to 2014. He finds that some ratios give strong significant and positive relationships with market stock return. He also find that the most effective ratios in predicting market stock return in the industrial sector are return on equity, return on assets, and net profit ratio. In addition, he also finds that the most effective ratios in predicting market stock return in the service sector and the investment sector are return on equity, return on assets, price to earnings ratio, and earning per share

Sami RM MUSALLAM
Page | 108 EJBE 2018, 11(21)
ratio. Furthermore, he concludes that it could depend on some of financial ratios for each sector in predicting market stock return; the decision makers of such investor can depend on the financial analyses presented by the financial ratios when making financial and operational decisions.
Moshavegh and Montazerhojat (2016) test the effects of total debt to earnings before interest and taxes, the rate of earnings before interest and taxes, stock market price to book value, dividends and earnings per share on market stock returns of chemical products industries and non-metallic minerals industry that are listed on Tehran Stock Exchange. Their results show that total debt to earnings before interest and taxes ratio effects positively on market stock return, however other ratios are significantly affect market stock returns. Allozi and Obeidat (2016) examine the relationship between net profit margin, gross profit margin, return on assets, return on equity, earnings per share, and debt to equity ratio with market stock returns of sample of 65 manufacturing companies that are listed on Amman Stock Exchange over a 10 years period from 2001 to 2011. They find that a significant relationship between gross profit margin, return on assets, return on equity, and earnings per share with market stock returns while insignificant relationship between debt to equity ratio with market stock return. Their study recommends the managers of manufacturing companies to concentrate much more on financial ratios that have significant relationship with market stock returns for more profits and less debts. Anwaar (2016) test the relationship between return on equity, net profit margin, return on assets, and earnings per share with market stock return using all firms listed on London marketfrom 2005 to 2014. The results of panel regression model show that a positive relationship between net profit margin and return on assets with market stock return, suggesting that market stock return will automatically increase if the firm will keep more cash and net profit margin increases. But if net profit increases that will lead to raise return on assets which enhances market stock return. On the other hand, the results show that a negative relationship between earning per share with stock returns. This result demonstrates that if earning per share increments, than each one of those investors who needs short term return and cognizant for return offer their stock into the market because of which in not so distant future the stock returns of the firm will be diminishing because of excess supply of stocks, while quick ratio and return on equity show insignificant relationship with stock returns.
3. Research Methodology
This paper is used a secondary data to empirically examine the influence of financial ratios on market stock return. A sample of 26 companies listed on Qatar Stock Exchange has been selected from total number population of 44 companies after excluding 18 banks and financial institutions. The set data is collected for a period of 2009 to 2015 covering 7 years period in order to determine the effect of financial ratios and market stock return of the companies listed on Qatar Stock Exchange from 2009 to 2015. This paper has nine independent variables and one

Exploring the Relationship between Financial Ratios and Market Stock Returns
EJBE 2018, 11(21) Page | 109
dependent variable (see Table 1). The data on all independent variables used is collected from annual reports of the selected companies listed on Qatar Stock Exchange and stock return data has collected from other sources such as DataStream. Table 1 shows the descriptions of variables.
Table 1. Descriptions of Variables Variables Descriptions
Dependent variable:
Market Stock Return (MSRit)
(Dividend Per Share + Capital gain) divided by Market price in Company i year t.
Independent variable: Price-Earning (PEit) Current Share Price divided byEarnings Per Share in
Company i year t. Dividends-Yield (DYit) Dividend per Share divided byMarket rate per share in
Company i year t. Market-Book- Value (MTBVit)
Market Value divided byBook Value in Company i year t.
Earning-Yield (EYit) Earnings Per Share divided byShare Price in Company i year t.
Dividends-Earning (DEit) Dividend per Share divided by Earnings Per Share in Company i year t.
Earnings Per Share (EPSit) (Net Income – Dividend on Preferred Stock) divided byAverage Outstanding Shares in Company i year t.
Return on Equity (ROE it) Net Income divided byAverage Shareholders’ Equity in Company i year t.
Net Profit Margin (NPM it) Net Profit divided by Revenue in Company i year t. Return on Assets (ROA it) Net Income divided by Average Total Assets in Company i
year t.
To examine the effects of financial ratio analyses and market stock return, WLS regression model is used in the present study as the model of Ordinary Least Squares (OLS) does not meet its assumptions that display heteroskedasticity based on the White Test (WT) or Breusch-Pagan (BP) test. Therefore, the following WLS regression model is used:
MSRi,t = B0 + B1 PEi,t + B2 DYi,t + B3 MTBVi,t+ B4 EYi,t + B5 DEi,t + B6 EPSi,t+ B7 ROEi,t+ B8 ROAi,t + B9 NPMi,t+ei,t
Where, the measurement of variables are described in Table 1 above.
4. Findings and Discussions
Descriptive analyses is used as a measure to provide information about mean, minimum, median, maximum, and standard deviation of the present study to explain the data variation in Qatarilisted companies over a period from 2009 to 2015. The results of descriptive statistics obtained are shown in Table 2. The mean values for Market stock return during 2009 to 2015 are 64.159, which shows that within the period, the market appreciate Qatari listed companies in average. It is

Sami RM MUSALLAM
Page | 110 EJBE 2018, 11(21)
higher than the mean value 10.48 reported for the companies listed on London Stock Exchange (FTSE-100 Index) during a period from 2005 to 2014 (Anwaar, 2016). However, it is lower than the mean value 5117.47 reported for the sample of 60 members of the Tehran Stock Exchange over a period of 2005 to 2012 (Foroghi & Jahromy, 2015).The range of market stock return is from lowest value of 0.000 to highest value of 250.8 with standard deviation of 23.56.
Table 2. Descriptive Analyses of the Variables (Total 182 observations) Variable Mean Minimum Median Maximum Std. Deviation
MSR 64.159 0.000 110.405 250.8 23.56 PE 1.436 -1.450 0.840 33.430 3.060 DY 1.399 -0.750 0.855 28.950 2.773 MTBV 1.011 -41.740 0.710 18.5100 5.510 EY 9.089 -29.820 8.775 15.070 20.070 DE 6.712 -49.690 3.935 27.360 23.532 EPS 0.234 0.000 0.070 4.580 0.559 ROE 7.821 -51.770 6.670 57.280 20.735 ROA 4.686 -18.190 3.845 21.220 22.881 NPM 4.318 -12.220 6.420 43.170 41.305 Note. For the definition of variables refer to the table 1.
Table 2 above also shows that the median and highest average values among financial ratios have been reported for the variable of earning yield ratio, following by the median value of earning yield ratio is 8.775 and maximum value is 15.070 while mean is 9.089 having standard deviation of 20.070. However, the median and lowest mean values among them have been reported for the variable of earning per share ratio, following by the median value of earning per share ratio is 0.070 and maximum value is 4.580 while mean is 9.089 with standard deviation of 0.559. The highest maximum and lowest minimum values in the variable of return on equity which are 57.280 and -51.190 while average value is 7.821 with standard deviation of 20.881.
The outcomes of the analysis of regression models are presented inTable 3. As shown in Column 2 of Table 3, that the model of OLS suffers from heteroskedasticity issue in view of White Test (WT) or Breusch–Pagan (BP) test that gives estimation value of 153.03 with p-value of 0.000. Thus, the model of WLS is used to tackle this problem. The results of analysis using WLS model are also presented in Column 3 of Table 3. The results of the model shows that the coefficient value of dividend yield ratio is 189.394 percent, indicating that 189.394 percent variation of market stock return explained by the variation of dividend yield ratio. The p-value of dividend yield ratio is < 0.01finds that dividend yield ratio has obtained positive significant effect on market stock return. If one percent increases in dividend yield ratio, than market stock return increases at 189.394 percent. This result is in line with Chan et al.’s (1991), Chen and Shen (2009), Khan et al.’s (2012), and Lewellen (2004).
Exploring the Relationship between Financial Ratios and Market Stock Returns
EJBE 2018, 11(21) Page | 111
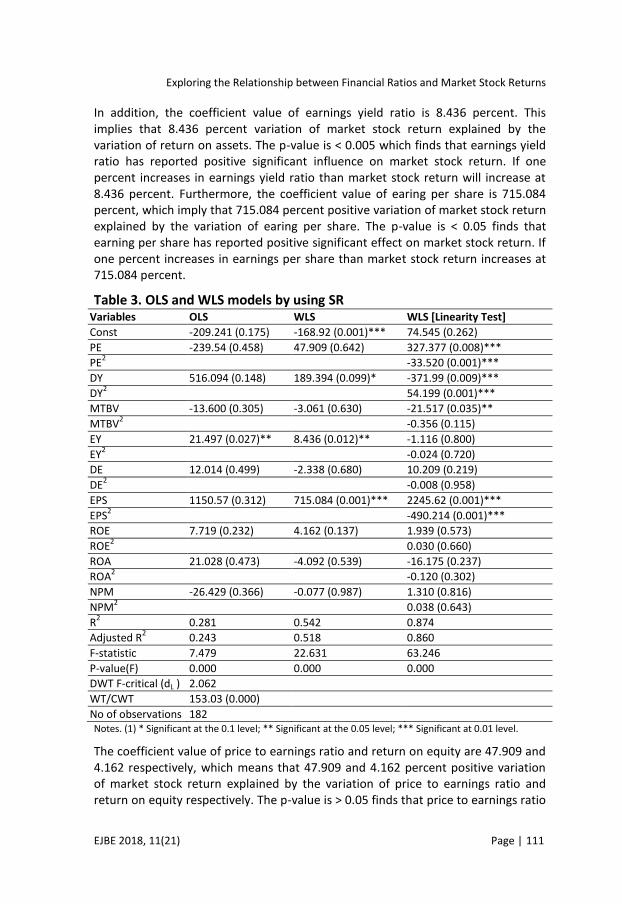
In addition, the coefficient value of earnings yield ratio is 8.436 percent. This implies that 8.436 percent variation of market stock return explained by the variation of return on assets. The p-value is < 0.005 which finds that earnings yield ratio has reported positive significant influence on market stock return. If one percent increases in earnings yield ratio than market stock return will increase at 8.436 percent. Furthermore, the coefficient value of earing per share is 715.084 percent, which imply that 715.084 percent positive variation of market stock return explained by the variation of earing per share. The p-value is < 0.05 finds that earning per share has reported positive significant effect on market stock return. If one percent increases in earnings per share than market stock return increases at 715.084 percent.
Table 3. OLS and WLS models by using SR Variables OLS WLS WLS [Linearity Test]
Const -209.241 (0.175) -168.92 (0.001)*** 74.545 (0.262)
PE -239.54 (0.458) 47.909 (0.642) 327.377 (0.008)***
PE2 -33.520 (0.001)***
DY 516.094 (0.148) 189.394 (0.099)* -371.99 (0.009)***
DY2 54.199 (0.001)***
MTBV -13.600 (0.305) -3.061 (0.630) -21.517 (0.035)**
MTBV2 -0.356 (0.115)
EY 21.497 (0.027)** 8.436 (0.012)** -1.116 (0.800)
EY2 -0.024 (0.720)
DE 12.014 (0.499) -2.338 (0.680) 10.209 (0.219)
DE2 -0.008 (0.958)
EPS 1150.57 (0.312) 715.084 (0.001)*** 2245.62 (0.001)***
EPS2 -490.214 (0.001)***
ROE 7.719 (0.232) 4.162 (0.137) 1.939 (0.573)
ROE2 0.030 (0.660)
ROA 21.028 (0.473) -4.092 (0.539) -16.175 (0.237)
ROA2 -0.120 (0.302)
NPM -26.429 (0.366) -0.077 (0.987) 1.310 (0.816)
NPM2 0.038 (0.643)
R2 0.281 0.542 0.874
Adjusted R2 0.243 0.518 0.860
F-statistic 7.479 22.631 63.246
P-value(F) 0.000 0.000 0.000
DWT F-critical (dL ) 2.062
WT/CWT 153.03 (0.000)
No of observations 182 Notes. (1) * Significant at the 0.1 level; ** Significant at the 0.05 level; *** Significant at 0.01 level.
The coefficient value of price to earnings ratio and return on equity are 47.909 and 4.162 respectively, which means that 47.909 and 4.162 percent positive variation of market stock return explained by the variation of price to earnings ratio and return on equity respectively. The p-value is > 0.05 finds that price to earnings ratio

Sami RM MUSALLAM
Page | 112 EJBE 2018, 11(21)
and returns on equity have reported positive insignificant influence on market stock return. These results are in line with Lau at al., (2002) for price to earnings ratio and Anwaar (2016) for return on equity. However, the results are not in line with Petcharabul and Suppanunta (2014), who find that return on equity and price to earnings ratio are significantly associated with stock returns, indicating that equity and price to earnings ratio can explain the quarterly stock returns of technology industries. However, the coefficient value of market to book value ratio, dividends to earnings ratio, net profit margin, and return on assets are - 3.061, - 2.338, - 0.077, and - 4.092, respectively, which means that - 3.061, -2.338, - 0.077, and - 4.092 percent negative variation of market stock return explained by the variation of market to book value ratio, dividends to earnings ratio, and net profit margin, and return on assets, respectively. The p-value is > 0.05 shows that market to book value ratio, dividends to earnings ratio, net profit margin, and return on assets has obtained negative insignificant effect on market stock return.
5. Robust Analyses
Previous research argues that the relationship financial ratios and stock returns may be nonlinear (e.g., Omran, 2004; Mramor & Pahor, 1998; Mramor & Mramor-Kosta, 1997). Thus, the WLS regression model are re-estimated by including dividends yield ratio and the square of dividends yield ratio, price to earnings ratio and the square of price to earnings ratio, market to book value ratio and the square of market to book value ratio, earning yield ratio and the square of earning yield ratio, dividends earnings ratio and the square of dividends earnings ratio, earnings per share and the square of earnings per share, return on equity and the square of return on equity, return on assets and the square of return on assets, and net profit margin and the square of net profit margin. The results of analysis using WLS model are also summarized in Column 4 of Table 3. The results of the model show that price to earnings ratio and earnings per share have an inverted U-shaped function for market stock return. The inverted U-shaped relationship implies that higher price to earnings ratio and earnings per share lead to better stock returns up to a certain point and beyond that point, price to earnings ratio and earnings per share lower stock returns. On the other hand, the results show that dividend yield ratio has a U-shaped relationship with market stock return. The U-shaped relationship indicates that at the lower level of dividend yield ratio, market stock returnis better and at the higher level of dividend yield ratio, market stock return is worse. However, the result shows that a linear relationship between other financial ratios and market stock return.
6. Conclusion
This paper explored the relationship between financial ratios and market stock return using a data set of 26 companies that are listed on the Qatar Stock Exchange over a period of 2009 to 2015, the paper utilized WLS to analyze the full data. The WLS results show that earnings per share, earnings yield ratio, and dividend yield
Exploring the Relationship between Financial Ratios and Market Stock Returns
EJBE 2018, 11(21) Page | 113
ratio are positive and significant associated with market stock return while return on assets, market to book value ratio, return on equity dividends earnings ratio, price to earnings ratio, and net profit margin are insignificant associated with market stock return.
In practical perspectives, this paper is useful for policymakers to select and decide their policies. It is also provide evidence for investors and managers that dividend yield ratio, earnings yield ratio, and earnings per share are significant determinant of market stock returns in Qatar. The theoretical implication of this paper is that the paper is the primary endeavors to research to explore the relationship between financial ratios and market stock in Qatar. The results show that earnings per share, earnings yield ratio, and dividend yield ratio enhance market stock returns while other ratios do not effect on market stock returns in Qatar.
Further research could be conducted on the companies listed on Qatar Stock Exchange by employing other financial ratios using different econometrics techniques i.e., variance decompositions and impulse responses. Further research could also be conducted on explored the relationship between financial ratios and market stock return in companies listed on stock exchange markets of other Middle East countries because of Arab Spring of 2011.
References
Anwaar, M. (2016). Impact of firms’ performance on stock returns (evidence from listed companies of FTSE-100 Index London, UK). Global Journal of Management and Business Research: D Accounting and Auditing, 0975-5853.
Alexakis, C., Patra, T., & Poshakwale, S. (2010). Predictability of stock returns using financial statement information: Evidence on semi-strong efficiency of emerging Greek stock market. Journal of Applied Financial Economics, 20(16), 1321-1326. https://doi.org/10.1080/09603107.2010.482517
Allozi, N. M., & Obeidat, G. S. (2016). The Relationship between the Stock Return and Financial Indicators (Profitability, Leverage): An Empirical Study on Manufacturing Companies Listed in Amman Stock Exchange. Journal of Social Sciences Journal of Social Sciences (COES&RJ-JSS), 55(33), 408-424. https://doi.org/10.25255/jss.2016.5.3.408.424
Aono, K. & Iwaisako, T. (2011). Forecasting Japanese stock returns with financial ratios and other variables. Asia-Pacific Financial Markets, 18(4), 373-384. https://doi.org/10.1007/s10690-010-9135-z
Arkan, T. (2016). The importance of financial ratios in predicting stock price trends: A case study in emerging markets. Finanse, Rynki Finansowe, Ubezpieczenia, DOI: 10.18276 / frfu. 2016.79-01. https://doi.org/10.18276/frfu.2016.79-01
Auret, C. J, & Sinclaire, R. A. (2006). Book to market ratio and returns on the JSE. Investment Analysts Journal, 63, 31-38.
Barnes, P. (1987). The analysis and use of financial ratios: A review article. Journal of Business Finance and Accounting, 14(4), 449–461. https://doi.org/10.1111/j.1468-5957.1987.tb00106.x

Sami RM MUSALLAM
Page | 114 EJBE 2018, 11(21)
Basu, S. (1975).The information content of price-earnings ratios. Financial Management, 4(2),. 53-64. https://doi.org/10.2307/3665200
Basu, S., (1977).Investment performance of common in relation to their price earnings ratios: Atest of the efficient market hypothesis. The Journal of Finance, 32(3), 663-82. https://doi.org/10.1111/j.1540-6261.1977.tb01979.x
Beaver, W. (1966). Financial ratios as predictors of failure. Supplement to vol. 4 (Empirical Research in Accounting:Selected Studies). Journal of Accounting Research, 71–111. https://doi.org/10.2307/2490171
Bower, R. & Bower, D. (1969), Risk and the valuation of common stock, Journal of Political Economy, 349–362. https://doi.org/10.1086/259520
Campbell, J., & Shiller, R. (1988). Stock prices earnings and expected dividends. The Journal of Finance, 43(3), 661-676.
Chan, K., Hamao, & Lakonishok, J. (1991). Foundamentals and stock returns in Japan. Journal of Finance, 46, 1739-1764. https://doi.org/10.1111/j.1540-6261.1991.tb04642.x
Chen, S. W. & Shen, C. H. (2009). Is the stock price higher than that implied by the fundamentals? International Research Journal of Finance and Economics, 29, 87–109.
Cheung J. K., Chung R. & Kim J. B. (1997). The profitability of trading strategies based on book value and earnings in Hong Kong: Market inefficiency vs risk premia. Journal of International Financial Management and Accounting, Vol. 8, pp. 204- 233. https://doi.org/10.1111/1467-646X.00025
Chairakwattana, K., & Nathaphan, S. (2014). Stock return predictability by baysian model averaging: Evidence from stock exchange of Thailand”. International Journal of Economic Sciences, 3(1), 47-63.
Daniel, K., & Titman, S. (1997). Evidence on the characteristics of cross-sectional variation in stock returns. Journal of Finance, 52 (1), 1-33. https://doi.org/10.1111/j.1540-6261.1997.tb03806.x
Delen, D., Kuzey, C., & Uyar, A. (2013). Measuring firm performance using financial ratios: A decision tree approach. Expert Systems with Applications, 40(10), 3970–3983. https://doi.org/10.1016/j.eswa.2013.01.012
Emamgholipour, M., Pouraghajan, A., Tabari, N. A. Y., Haghparast, M & shirsavar, A. A. A. (2013). The effects of performance evaluation market ratios on the stock return: Evidence from the Tehran stock exchange. International Research Journal of Applied and Basic Sciences, 4(3), 696-703.
Fama, E. & French, K., (1993). Common risk factors in the returns on stocks and bonds. Journal of Financial Economics, 33(1), 3-56. https://doi.org/10.1016/0304-405X(93)90023-5
Foroghi , D. & Jahromy, S. M. E. (2015). Impact of profitability on stock returns based on the price, return and differenced modelsin Tehran stock exchanage. International Journal of Applied Business and Economic Research , 13(2), 955-970.
Hjalmarsson, E. (2010). Predicting global stock returns. Journal of Financial and Quantitative Analysis, 45(1), 49-80.
Iqbal, N, Khattak, S. R, & Khattak, M. A. (2013). Does fundamental analysis predict stock returns? Evidence from non-financial companies listed on KSE. Knowledge Horizons – Economics, 5(4), 182–190.

Exploring the Relationship between Financial Ratios and Market Stock Returns
EJBE 2018, 11(21) Page | 115
Lewellen, J. (2004). Predicting returns with financial ratios. Journal of Financial Economics, 74, 209–235. https://doi.org/10.1016/j.jfineco.2002.11.002
Lau, S. T., Lee, C. T, & McInish, T. H. (2002). Stock returns and beta, firms size, E/P, CF/P, book-to-market, and sales growth: evidence from Singapore and Malaysia. Journal of Multinational Financial Management, 12, 207-222. https://doi.org/10.1016/S1042-444X(01)00051-2
Jais, M., Jakpar, S., Doris, T. K. P., & Shaikh, J. M. (2012). The financial ratio usage towards predicting stock returns in Malaysia. International Journal of Managerial and Financial Accounting, 4(4), 377-401. https://doi.org/10.1504/IJMFA.2012.049677
Jozeff, M. (1982). Growth, beta and agency costs as determinants of dividend payout ratios. Journal of Finance Research, 5(3), 249-259.
Khan, M. B., Gul, S., Rehman, S. U., Razzaq, N., & Kamran, A. (2012). Financial Ratios and Stock Return Predictability (Evidence from Pakistan). Research Journal of Finance and Accounting, 3(10), 1-6.
Katchova, A., & Enlow, S. (2013). Financial performance of publicly traded agribusinesses. Agricultural Finance Review, 73 (1), 58–73. https://doi.org/10.1108/00021461311321311
Kheradyar, S., Ibrahim, I., & Nor, F. M. (2011). Stock return predictability with financial ratios. International Journal of Trade, Economics and Finance, 2(5), 391
Konijn, S., R. Kräussl, & A. Lucas, (2011). Blockholder dispersion and firm value. Journal of Corporate Finance, 17(5), 1330-1339.
Kothari, S.P. & Shanken, J. (1997). Book-to-market, dividend yield, and expected market returns: A time-series analysis. Journal of Financial Economics, 44, 169-203. https://doi.org/10.1016/S0304-405X(97)00002-0
Moshavegh, S. & Montazerhojat, A. (2016). Examining the relationship between financial ratios and stock returns of companies listed on Tehran stock exchange (chemical, biotechnology products and non-metallic minerals industry. Bulletin of Environment, Pharmacology and Life Sciences, 1, 31-34
Mramor, D., & Mramor-Kosta, N., (1997). Accounting ratios as factors of rate on equity. New Operational Approaches for Financial Modeling, Heidelberg: Physica-Verlag, 335-48. https://doi.org/10.1007/978-3-642-59270-6_25
Mramor, D., & Pahor, M., (1998). Testing non-linear relationships between excess rate of return on equity and financial ratios, 23rd Meeting of the Euro Working Group on Financial Modeling, Polonia College.
Mukherji, S., Dhatt, M. S., & Kim, Y. H. (1997). A fundamental analysis of Korean stock returns. Finance Analysts Journal, 53, 75–80. https://doi.org/10.2469/faj.v53.n3.2086
Namazi, M. & Rostami, N. (2006). The survey of the relationship between financial ratios and stock returns rate of companies listed in Tehran Stock Exchange. Review of Accounting and Auditing, 13(2), 105-127.
Omran, M., & Ragab, A. (2004). Linear versus non-linear relationships between financial ratios and stock returns: empirical evidence from Egyptian firms. Review of Accounting and Finance, 3(2), 84-102.
Petcharabul, P. & Suppanunta, R. (2014). Technology industry on financial ratios and stock returns. Journal of Business and Economics, 5(5), 739-746

Sami RM MUSALLAM
Page | 116 EJBE 2018, 11(21)
Pech, C. O. T, Noguera, M., & White, S. (2015). Financial ratios used by equity analysts in Mexicoand stock returns. Contaduríay Administración, 60, 578–592. https://doi.org/10.1016/j.cya.2015.02.001
Shafana, A . L., Fathima, R. & Inunjariya, A. M. (2013). Relationship between stock returns and firm size, and book to market equity: Empirical evidence from selected companies listed on on Milanka Price Index in Colombo Stock Exchange. Journal of Emerging Trends in Economics and Management Sciences (JETEMS), 4(2), 217-225
Tudor, C. (2010). Firm-specific factors as predictors of future returns for Romanian common stocks: empirical evidence. Recent Researches in Business Administration, Finance and Product Management. Proceed. ICFA, 10
Wang, Y. & Lee, H. (2010). Evaluating financial performance of Taiwan container shipping companies by strength and weakness indices. International Journal of Computer Mathematics, 87(1), 38–52. https://doi.org/10.1080/00405000701489412
Wijaya, J. A. (2015). The effect of financial ratios toward stock returns among Indonesian manufacturing companies. International Business and Management, 3(2), 261-271
Zahir, M. A. (1992). Factors affecting equity prices in India. The Chartered Accountant, 40(9), 743-748
Zaheri, F. & Barkhordary, S. (2015). Relationship between financial characteristics of companies in cement industry and their stock returns in Tehran stock exchange. Research Journal of Recent Sciences, 4(8), 77-83
Zeytinoglu, E., Akarim, Y.D, & Çelik, S. (2012). The impact of market-based ratios on stock returns: The evidence from insurance sector in Turkey. International Research Journal of Finance and Economics, 84, 41-48.