Embed Size (px)
Citation preview

EXPLORING SMART INTENSE USE THROUGH TAM: A GREEK CASE STUDY
Journal of Information Technology Management Volume XXVII, Number 3, 2016
121
Journal of Information Technology Management
ISSN #1042-1319
A Publication of the Association of Management
EXPLORING THE PROFILE OF SMARTPHONE USERS AND
DETERMINING THE FACTORS AFFECTING THE SMART
INTENSE USE (SMI) THROUGH THE TECHNOLOGY
ACCEPTANCE MODEL: A GREEK CASE STUDY
FRONIMAKI EVGENIA
UNIVERSITY OF THE AEGEAN [email protected]
MAVRI MARIA
UNIVERSITY OF THE AEGEAN [email protected]
ABSTRACT
Smartphones have become an integral and necessary part of everyday life since they first launched in the mobile industry. The advanced functionalities of a smartphone have changed the “traditional phone” to a machine with multiple services, making rural life easier and users always reachable. Smartphones offer to their users, apart from traditional services, such as phone calling and messaging, a window to the “cloud world”. Every user can check emails in real time, connect to social media, exchange files and participate in network meetings. The objective of this paper is to identify factors that influence consumers’ behaviours in terms of smartphone acceptance; then, based on these factors and on consumers’ demographic characteristics, the paper will identify various groups of users. Six groups of users were defined, including “enthusiastic”, “insecure”, “alternative”, sceptic”, “workaholic” and “main” users. Finally, as the development of technology is rapid, digital use seems to differ from the traditional use of technological devices; thus, this paper suggests a new dimension of the Technology Acceptance Model (TAM), called “SMart Intense Use” (SMI)”, to describe the intensity of the use of the smart features of a device.
Keywords: Smartphones’ Acceptance and Satisfaction; Technology Acceptance Model; Smart Intense
INTRODUCTION
Information technology has rapidly changed our lives. The development of the information technology industry can be divided into the following five (5) periods: the information technology mainframe in the ‘60s; the minis in the ‘70s; the personal computer in the ‘80s; the emergence of the Internet in the ‘90s and nowadays, computers, Internet and wireless communication (Wi-Fi) are embodied in portable mobile
devices, such as smartphones and tablets [3]. The first generation of mobile phones (1G cellular network) dominated the early ‘80s, while the second generation dominated the ‘90s (2G digital networks), and the third generation was launched in 2001 (3G high-speed IP data networks and mobile broadband). By 2009, it was clear that 3G networks would be overwhelmed by the growth of bandwidth-intensive applications, such as streaming media [19].

EXPLORING SMART INTENSE USE THROUGH TAM: A GREEK CASE STUDY
Journal of Information Technology Management Volume XXVII, Number 3, 2016
122
The mobile phone industry is a highly competitive industry. To maintain their position in the global market, companies are forced to become more and more competitive. Understanding customers’ needs and trying to satisfy them seem to be appropriate solutions to increase their market shares. A mobile phone is a device that many consumers adore and feel uncomfortable living without. They use mobile phones as personal devices to stay connected with friends and family and sometimes, they consider these devices a strong aspect of their personality. As technology evolves, mobile phones are becoming more and more sophisticated; in other words, devices offer to their clients many services and applications. According to Ting et al. [30], the mobile phone has transitioned from an interpersonal communication device to a multimedia machine, known as a “smartphone”.
Despite the lack of a standard definition, it is possible to simply define a smartphone as a combination of a regular phone set with features, including a camera, touch screen, Wi-Fi and 3G capabilities and portable media player, and that runs on a mobile operating system [6]. According to La Rue et al. [16], a smartphone is a mobile phone with built-in applications, e.g. an MP3 player, video, camera and the ability to access the Internet. The first smartphone models became available in 2002, but their use became widespread after 2008, specifically after Apple launched the first iPhone model.
In addition, the usability of various applications (called “apps”) has enabled smartphones to replace many existing computing devices, such as personal computers (PCs) and electronic handheld devices, as smartphones give users the opportunity to check their email and connect to social media anywhere and anytime. The rapid rate of smartphone ownership raises the question of why smartphone adoption has experienced such a high growth rate and what features draw people to this new mobile
device [13]. According to behaviour experts, there are five
(5) categories of adopters: innovators, early adopters, the early majority, the late majority and laggards. Innovators are those who first adopt an innovation and who are willing to take risks and try new technologies; they are the youngest in age, are situated in the highest social class, have great financial lucidity, are very social and have the closest contact with scientific sources and with other innovators [27]. Smartphones were monopolised by businessmen, and early adopters have increased due to the growing consumer demand for multimedia and games [29]. People who use smartphones for professional reasons will have different purposes for using smartphones than the general buyer [31]. People use IT devices, including smartphones, not only for
communication but also for improving their job efficiency and effectiveness.
The most important theories and models explaining IT acceptance are: (a) the Innovation Diffusion Theory (IDT) [26], which deals with an individual’s innovation adoption speed, as determined by a wide range of personal (i.e. gender, ethnicity, age and innovativeness), social (i.e. education and income status) and technological factors (i.e. perceived usefulness and perceived benefits) [17]; (b) the Theory of Reasoned Action (TRA) [10], which posits that people’s actual behaviours are determined by their intentions to behave in a certain way, and those intentions are influenced by their own attitudes and by a subjective standard (social influences); (c) the Theory of Planned Behaviour (TPB) [1], which was proposed as an extension of the TRA by including the variable of “perceived behavioural control”, which measures a person’s perception of control over performing a given behaviour; (d) the Technology Acceptance Model (TAM) [9], which predicts people’s intentions to use a technology based on their perception of its ease of use and usefulness and which is the most influential theoretical approach in the study of determinants related to the use of IT due to its robustness, flexibility and explanatory strength; (e) the Task-Technology Fit Model (TTF) [11], which argues that users will choose the technology that is most appropriate for the task they intend to perform, and (f) the General Model of Technology Acceptance [20], which is a combination of the TPB and the TAM.
Over the last two decades, numerous studies on technology acceptance have been conducted in several fields. In the case of smartphones, according to Ling et al. [18], the context of user satisfaction includes a number of different factors, such as colour screens, voice-activated dialling and Internet browsing features. Park and Chen [22] posit that the most representative of these factors are the cost of purchase, familiarity with technology, ease of use, rapid communication, connection with social networks and ease of Internet access at any time and in any place. In the pilot study of Park and Lee [23], the factors that affect smartphone acceptance based on user satisfaction are instant connectivity, perceived enjoyment and a simplified user-device interface. Regarding the TAM, Anetta et al. [2] found that perceived usefulness is influenced both by social norms and behavioural control, while perceived enjoyment is not. Teenagers, for example, use smartphones for utilitarian and not hedonic necessity. In the pilot study of Choudrie et al. [7], the researchers explored the considerations made when consumers want to purchase a smartphone. The top ten consideration factors were determined to be brand, price, appearance, camera, screen size, operating system, battery

EXPLORING SMART INTENSE USE THROUGH TAM: A GREEK CASE STUDY
Journal of Information Technology Management Volume XXVII, Number 3, 2016
123
life, memory size, weight and the quality of applications. However, among users aged 50 years and above, individuals were far less concerned with the price and operating system.
As technology is being developed rapidly, digital use seems to differ from the traditional use of technological devices, and a measurement of the intensity of the smart use of smart devices is needed. Based on transaction speed and a phone’s characteristics (model and software), users find it easier to adopt new technological achievements. According to our knowledge, although there are studies about the intention to use IT, there are no references to the Smart Intense (SMI) of use. The goals of this study are (a) to identify factors affecting the adoption of smartphones; (b) then, based on these results, users will be classified into groups according to their demographic characteristics and their attitudes towards new technology. The third goal will be to add a new dimension to the TAM that affects the adoption of smartphone usage.
The remainder of this paper is organised as follows. Section 2 provides the hypotheses under examination, while section 3 describes the data collection and the empirical results. Section 4 presents the factor analysis and provides the results of the analysis, and Section 5 presents the revised version of the TAM model. Finally, section 6 summarises the conclusions of this work and suggests further research.
HYPOTHESES
Since 1996, one of the fastest growing technologies in the mobile phone industry has been the smartphone market. The number of smartphone users reached 1 billion in 2012 and Rushton [28] correctly argued that this number will double in 2015. Customer personalities and smartphone characteristics are factors that play a crucial role in the decision of whether to adopt or reject this kind of mobile device and use the supplied mobile services. As customers differ systematically in gender, age, education, occupation or income, some will readily adapt to the changes brought about by technological developments, while others are wary of this new entry into the mobile phone industry.
As the perceived usefulness and perceived ease of use of mobile technology have been recognised as important factors from previous literature [34], we excluded them from our hypotheses to identify the significance of other factors that likely affect customers’ decisions.
The study therefore focused on identifying the significance of the following factors:
1. Satisfaction with transaction speed is associated
with the selection of network type (Wi-Fi or
3G/4G).
H01: Satisfaction with transaction speed and network type are independent variables.
versus
H11: Satisfaction with transaction speed and network type are dependent variables.
As mobile communication technology has developed, people have gained the ability to use Internet services at any time and in any place. Because smartphones provide wireless Internet function, a variety of services have been activated and the market has grown. In a similar way, wireless Internet technology has evolved with the development of smartphones. Therefore, the functional attributes of wireless Internet should be considered in identifying this type of network. The second relevant technology is mobile service technology, whose representative characteristics are portability and mobility. The development of mobile services will result in the more widespread use of smartphones [31].
The contribution of this factor to people’s satisfaction or dissatisfaction with transaction speed is assessed through a four-point differential scale.
2. The number of calls via the Internet is
associated with the use of smartphones for
professional reasons.
H02: The number of calls via the Internet and the professional use of smartphones are independent variables.
versus
H12: The number of calls via the Internet and professional use of smartphones are dependent variables.
Today, users expect technology availability 24/7 on their terms. Smartphones make up 60% of the current purchases in the US market, and smartphones will reach an estimated $31 billion in market value by 2016 [15]. Because users have instant access to information wherever they are, their productivity can be increased. It was found that the main reason that a user accesses mobile Internet is to increase productivity [12].
We want to determine the contribution of professional smartphone use to the maximum number of calls via the Internet.
3. Satisfaction with the variety of applications is
associated with sales of smartphones due to
their capabilities.
H03: Satisfaction with the variety of applications and sales of smartphones due to their capabilities are independent variables.
versus
EXPLORING SMART INTENSE USE THROUGH TAM: A GREEK CASE STUDY
Journal of Information Technology Management Volume XXVII, Number 3, 2016
124
H13: Satisfaction with the variety of applications and sales of smartphones due to their capabilities are dependent variables.
Parasuraman [21] acknowledged perceived value as one of the most important measures for gaining a competitive advantage. In addition, a few studies demonstrate that consumers' perceptions of value are related to their overall satisfaction [24; 35]. These studies indicate a strong and positive relationship between perceived value and satisfaction. Perceived value is an individual’s overall assessment of the utility of a product/service based on the perceptions of what is received and what is given [36]. Perceived costs include not only the actual monetary price of a product, but also its nonmonetary aspects, such as effort and time. Therefore, the perceived benefits include the perceived usefulness, defined as the total value that an individual perceives from using a new technology [26]. Not surprisingly, high costs tend to prohibit technology adoption, and high benefits are likely to be a strong motivation for technology adoption [13].
A four-point scale was used to measure the significance of the variety of smartphone applications, and a divided question (Y/N) was used to register the reasons for choosing a significant type of smartphone due to its capabilities.
4. Satisfaction with a smartphone model is
associated with the sales of smartphones due to
their software.
H04: Satisfaction with a smartphone model and sales of smartphones due to their software are independent variables.
versus
H14: Satisfaction with a smartphone model and sales of smartphones due to their software are dependent variables.
Cellular phones have been transformed from conventional phone calling devices to highly interactive multimedia systems providing Internet access. Smartphones are intended to satisfy users through a variety of advanced technological characteristics and functionalities [5]. They present features in common with conventional mobile phones, such as the phone’s physical design, colour and size. These features can contribute to user satisfaction [4]. Additional features, such as power-efficient microprocessors, modern operating systems and extra available memory, increase the smartphones’ capabilities and more greatly support acceptance. This diversity of characteristics/functionalities positively impacts smartphone user satisfaction, which can be attributed to issues such as perceived convenience, usability, efficiency and security [14; 22; 25]. Smartphone users may confront usability problems and difficulties
with learning how to use smartphones than with conventional mobile phones. A potential buyer should balance the cost of purchasing a device with the level of offered functionalities.
A four-point scale was used to measure the significance of choosing a particular type of smartphone, and a divided question (Y/N) was used to examine whether the software of a smartphone drives sales.
5. Satisfaction with the type of network (Wi-Fi or
3G/4G) is associated with the selection of a
network during smartphone use.
H05: Satisfaction with a type of network and the selection of a network are independent variables.
versus
H15: Satisfaction with a type of network and the selection of a network are dependent variables.
Wireless Internet enables access to online information universally from anywhere and at any time. Wireless connectivity allows for the establishment of a small-scale information network among electronic devices and access to information stored in other close electronic devices wirelessly [18].
The contribution of this factor to people’s satisfaction or dissatisfaction with the selected type of network is assessed through a four-point differential scale (slightly to extremely very much).
6. Gender is associated with the use of
smartphones for professional reasons.
H06: Gender and the professional use of smartphones are independent variables.
versus
H16: Gender and the professional use of smartphones are dependent variables.
Mobile phones have a huge user population coming from different cultures with different capabilities, characteristics and preferences. Users from different ethnic backgrounds and genders may have different attitudes towards the new means of information access provided by the new mobile phone features [18]. On the other hand, firms need to understand how users utilise mobile technologies, such as smartphones, for work, leisure or entertainment, as well as what leads to further involvement with their smartphones.
It would be interesting to determine how differences in the user population play a role in attitudes towards new mobile phone features in relation to universal information access. We want to determine the contribution of professional smartphone use in relation to gender.
7. Age is associated with the type of social media
that users access through their smartphones.
EXPLORING SMART INTENSE USE THROUGH TAM: A GREEK CASE STUDY
Journal of Information Technology Management Volume XXVII, Number 3, 2016
125
H07: Age and type of social media are independent variables.
versus
H17: Age and type of social media are dependent variables.
In a recent pilot study, Choudrie et al. [7] examined the main reason for using a smartphone device. In terms of usage, the top ten features were making a phone call, taking a photograph, text messaging, emailing, browsing a website, accessing social networks, downloading applications (apps), mapping and navigator functions and playing games. For users above 50 years in age, the numbers of respondents using smartphones to make a phone call, SMS, email, take a photo and browse a website were rated as important. However, filming a video, playing games, mapping, downloading apps and accessing social media are less popular than the previous apps. Contrastingly, users above 50 years in age use their smartphones less to access social accounts.
We want to determine the contribution of the type of social media access through a smartphone device to age.
DATA COLLECTION
Hypotheses 1–7 were tested in terms of survey data obtained via a questionnaire. We chose the survey research because this type of research is determined as the systematic collection of data to explain or forecast the behaviour of a certain population (in our case, the group is smartphone users).
The population of this survey is Internet users aged 18-65+ years. Random sampling was used to collect all necessary data for our study. As the penetration rate of smartphone usage is high, we used a sampling unit of Internet users from social media (Facebook, Twitter, etc.). The questionnaire had been uploaded to a special link and all the answers were received electronically. We chose a link in Google Drive as the method of questionnaire distribution instead of a face-to-face interview because (a) it is easier than other methods for the participants, as they had the opportunity to fill out the questionnaire whenever they wanted; (b) it is cheaper than the other methods and (c) the participants were not influenced by the researchers.
According to a survey of the National Network of Research and Technology in 2014, the penetration of smartphone usage in Greece was estimated at 51.0%. The penetration rate of cell phone usage in Greece during the same period was estimated at 95.0%.
To determine the number questionnaires required to estimate the probability that an individual is willing to use smartphone services and applications, we supposed
that P = 0.510 (the percentage of smartphone usage in Greece). A 7% tolerable error is desired with a 93% reliability, while the error was equal to 0.07 and Z = 1.48. Thus, we obtained:
Z = �
��(���) � ⇔ n =
��[�(���)]�� ⇔ n =
�.���[�.���(�.���)](�.��)�
⇔ n = 112 The total number of fulfilled questionnaires was
approximately 180, while the number of effective questionnaires was 169. A questionnaire of 24 items was developed to measure the significance of the seven hypotheses mentioned in the previous unit. Each question focused directly on a specific issue. The questionnaire invited Internet users (a) to evaluate the acceptance and use of smartphone applications offered today and (b) to measure consumers’ perceptions concerning smartphone services. The aim was to determine the reasons for accessing online services via smartphones and outline the needs of users.
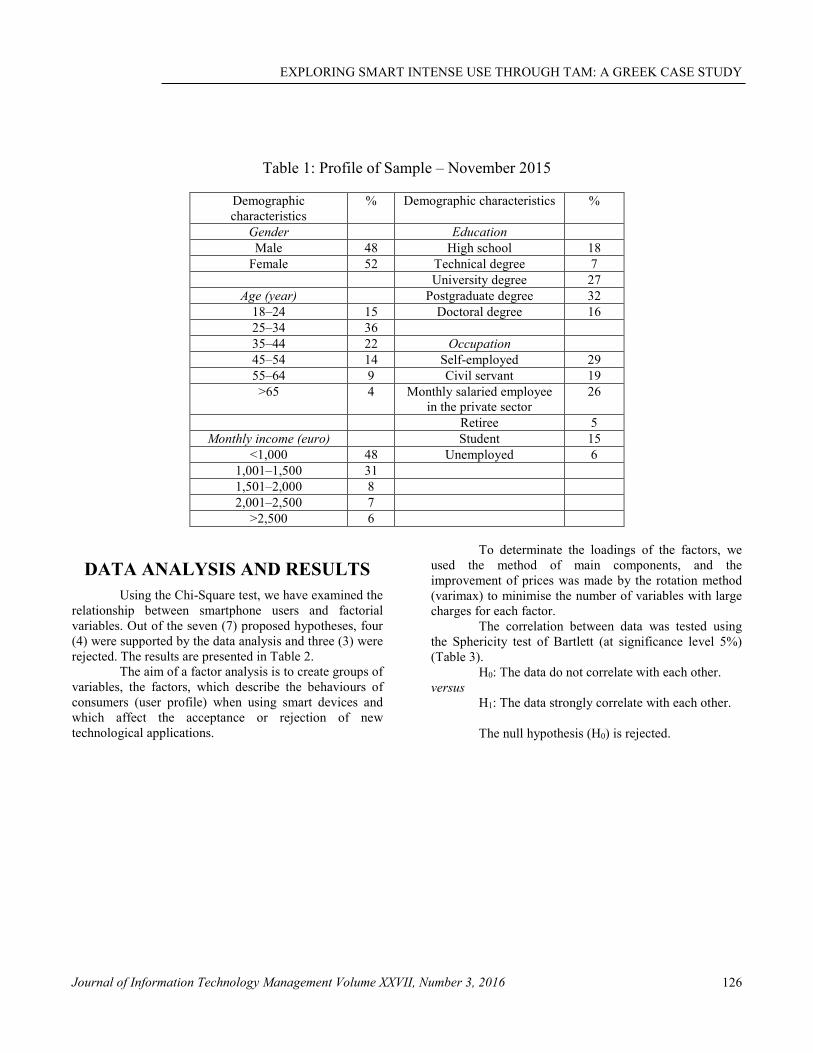
Of the 24 questions, six (6) were related to demographic characteristics (gender, age, education, occupation, monthly income and location). Of 169 respondents, 48% were male and 52% were female. The majority of the respondents were 25–44 years old and only 13% were older than 55 years. Of the total participants, 18% had completed high school, 27% held a university degree and 48% had a postgraduate or doctoral degree. In terms of occupation, 29% were self-employed, 19% were civil servants, 26% were monthly salaried employees in the private sector and the rest (26%) were retirees, students or unemployed. Table 1 presents these demographic results.
The results found that 79.3% of respondents currently have a smartphone device. For those aged below 54 years, 88% were smartphone users. In terms of the brand of smartphone, in overall terms, the Apple iPhone was most popular, followed by Samsung, Sony and HTC. However, the percentage of older adults using the Apple iPhone is lower than the younger participants (only 4% of Apple iPhone users are older than 55 years old). Moreover, 57% of Apple iPhone users have a postgraduate or a doctoral degree and only 14% of Apple iPhone users were retirees, students or unemployed.
In terms of application usage, the top twelve (12) features were browsing a website, accessing social networks, emailing, video and photo Internet messaging, text Internet messaging, phone calling via the Internet, mapping and navigator functions, using smartphones for transactions via the Internet, web streaming TV/radio, music via the Internet, playing games and reading e-books.
EXPLORING SMART INTENSE USE THROUGH TAM: A GREEK CASE STUDY
Journal of Information Technology Management Volume XXVII, Number 3, 2016
126
Table 1: Profile of Sample – November 2015
Demographic characteristics
% Demographic characteristics %
Gender Education
Male 48 High school 18
Female 52 Technical degree 7
University degree 27
Age (year) Postgraduate degree 32
18–24 15 Doctoral degree 16
25–34 36
35–44 22 Occupation
45–54 14 Self-employed 29
55–64 9 Civil servant 19
>65 4 Monthly salaried employee in the private sector
26
Retiree 5
Monthly income (euro) Student 15
<1,000 48 Unemployed 6
1,001–1,500 31
1,501–2,000 8
2,001–2,500 7
>2,500 6
DATA ANALYSIS AND RESULTS
Using the Chi-Square test, we have examined the relationship between smartphone users and factorial variables. Out of the seven (7) proposed hypotheses, four (4) were supported by the data analysis and three (3) were rejected. The results are presented in Table 2.
The aim of a factor analysis is to create groups of variables, the factors, which describe the behaviours of consumers (user profile) when using smart devices and which affect the acceptance or rejection of new technological applications.
To determinate the loadings of the factors, we used the method of main components, and the improvement of prices was made by the rotation method (varimax) to minimise the number of variables with large charges for each factor.
The correlation between data was tested using the Sphericity test of Bartlett (at significance level 5%) (Table 3).
H0: The data do not correlate with each other. versus
H1: The data strongly correlate with each other. The null hypothesis (H0) is rejected.

EXPLORING SMART INTENSE USE THROUGH TAM: A GREEK CASE STUDY
Journal of Information Technology Management Volume XXVII, Number 3, 2016
127
Table 2: Hypothesis testing results
No Hypothesis Statistic test
Asymp. Sig.
(2-sided)
Expected count less
than 5
Results Variables
1 Satisfaction with transaction speed and network type
Pearson chi-square
0.278 12.5% Accepted H01 Independent
2 Number of calls via Internet and professional use of smartphones
Pearson chi-square
0.901 55.6% Rejected H02 Dependent
3 Satisfaction with the variety of applications and sales of
smartphones due to their capabilities
Pearson chi-square
0.002 37.5% Rejected H03 Dependent
4 Satisfaction with a smartphone model and sales of smartphones due
to their software
Pearson chi-square
0.067 25.0% Accepted H04 Independent
5 Satisfaction with type of network and selection of network
Pearson chi-square
0.412 25.0% Accepted H05 Independent
6 Gender and professional use of smartphones
Pearson chi-square
0.128 0.0% Accepted H06 Independent
7 Age and type of social media Pearson chi-square
0.145 83.3% Rejected H07 Dependent
Table 3: KMO and Bartlett’s Test
Kaiser-Meyer-Olkin Measure of Sampling Adequacy
0.651
Bartlett’s Test of
Sphericity
Approx. Chi-Square 768,523
Df 105
Sig. ,000
Figure 1 shows the scree plot of eigenvalues and
the number of variables and as a result, we will draw a total of six (6) factors.
Figure 1: Scree plot
The total variance explained by the first six (6) factors was 75.261%, as shown in Table 4. Among these factors, the first factor explained 22.913% of the total variance, while the second factor accounted for 16.745%. From these results, we concluded that the survey items were statistically valid.
Table 4: Total Variance Explained
Component Cumulative % Cumulative % after rotation
1 22,913 17,664
2 16,745 15,550
3 11,142 13,086
4 8,968 12,541
5 8,401 8,688
6 7,092 7,731
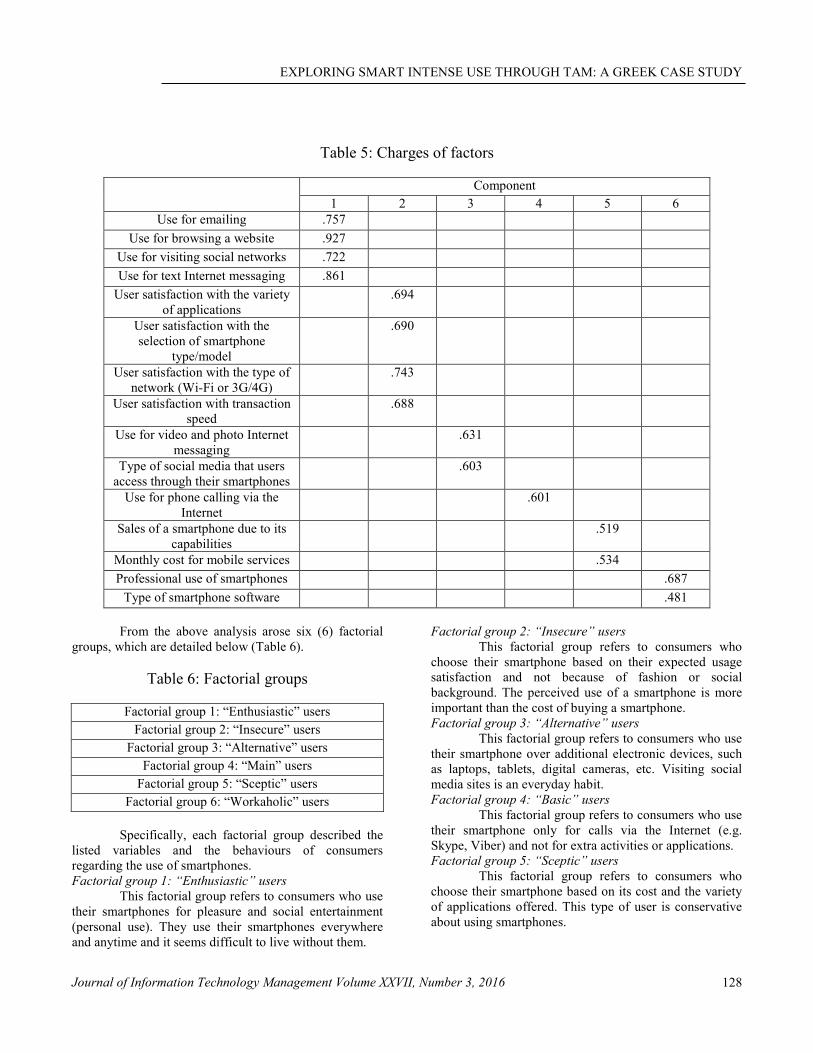
Table 5 shows the charges of factors.
EXPLORING SMART INTENSE USE THROUGH TAM: A GREEK CASE STUDY
Journal of Information Technology Management Volume XXVII, Number 3, 2016
128
Table 5: Charges of factors
Component
1 2 3 4 5 6
Use for emailing .757
Use for browsing a website .927
Use for visiting social networks .722
Use for text Internet messaging .861
User satisfaction with the variety of applications
.694
User satisfaction with the selection of smartphone
type/model
.690
User satisfaction with the type of network (Wi-Fi or 3G/4G)
.743
User satisfaction with transaction speed
.688
Use for video and photo Internet messaging
.631
Type of social media that users access through their smartphones
.603
Use for phone calling via the Internet
.601
Sales of a smartphone due to its capabilities
.519
Monthly cost for mobile services .534
Professional use of smartphones .687
Type of smartphone software .481
From the above analysis arose six (6) factorial
groups, which are detailed below (Table 6).
Table 6: Factorial groups
Factorial group 1: “Enthusiastic” users
Factorial group 2: “Insecure” users
Factorial group 3: “Alternative” users
Factorial group 4: “Main” users
Factorial group 5: “Sceptic” users
Factorial group 6: “Workaholic” users
Specifically, each factorial group described the
listed variables and the behaviours of consumers regarding the use of smartphones. Factorial group 1: “Enthusiastic” users
This factorial group refers to consumers who use their smartphones for pleasure and social entertainment (personal use). They use their smartphones everywhere and anytime and it seems difficult to live without them.
Factorial group 2: “Insecure” users
This factorial group refers to consumers who choose their smartphone based on their expected usage satisfaction and not because of fashion or social background. The perceived use of a smartphone is more important than the cost of buying a smartphone. Factorial group 3: “Alternative” users
This factorial group refers to consumers who use their smartphone over additional electronic devices, such as laptops, tablets, digital cameras, etc. Visiting social media sites is an everyday habit. Factorial group 4: “Basic” users
This factorial group refers to consumers who use their smartphone only for calls via the Internet (e.g. Skype, Viber) and not for extra activities or applications. Factorial group 5: “Sceptic” users
This factorial group refers to consumers who choose their smartphone based on its cost and the variety of applications offered. This type of user is conservative about using smartphones.
EXPLORING SMART INTENSE USE THROUGH TAM: A GREEK CASE STUDY
Journal of Information Technology Management Volume XXVII, Number 3, 2016
129
Factorial group 6: “Workaholic” users
This factorial group refers to consumers who use their smartphones for their work (professional use) and not for pleasure, and the type of software plays a crucial role when choosing a smartphone.
To explore the characteristics of the users of the above six (6) groups, we examined all the groups of users against gender, age and education. To achieve this goal, we used box plots. The results are shown as follows:
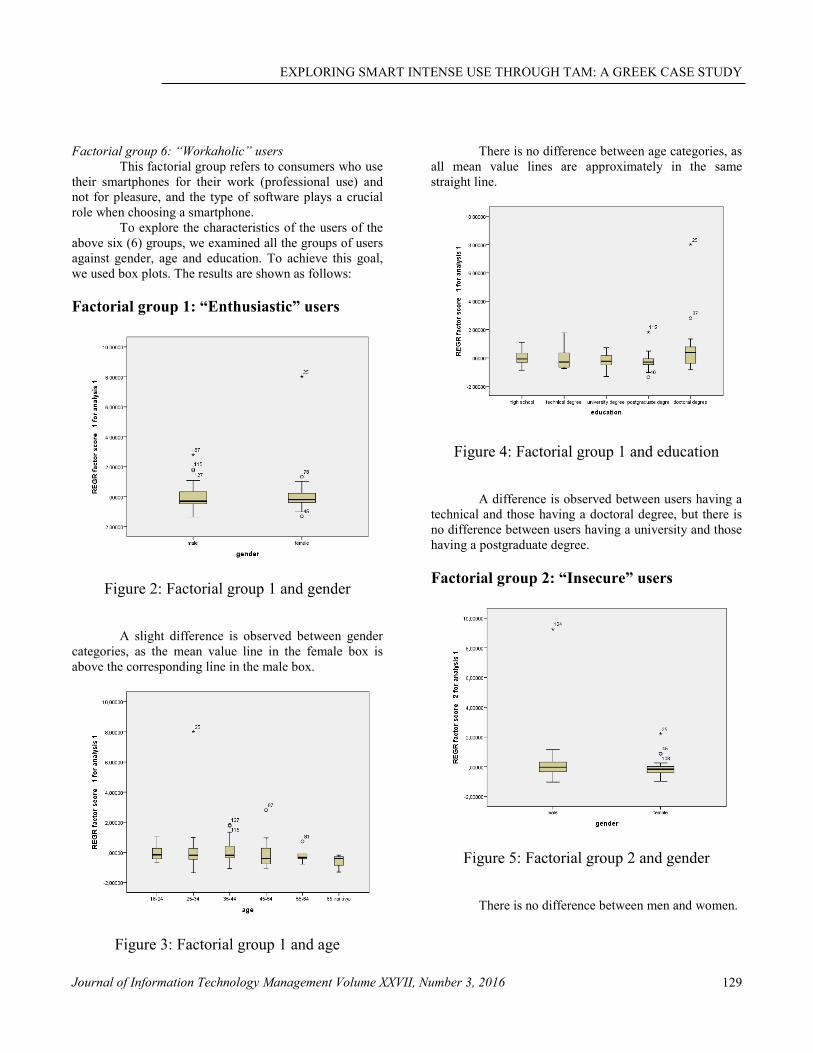
Factorial group 1: “Enthusiastic” users
Figure 2: Factorial group 1 and gender
A slight difference is observed between gender categories, as the mean value line in the female box is above the corresponding line in the male box.
Figure 3: Factorial group 1 and age
There is no difference between age categories, as all mean value lines are approximately in the same straight line.
Figure 4: Factorial group 1 and education
A difference is observed between users having a technical and those having a doctoral degree, but there is no difference between users having a university and those having a postgraduate degree.
Factorial group 2: “Insecure” users
Figure 5: Factorial group 2 and gender
There is no difference between men and women.

EXPLORING SMART INTENSE USE THROUGH TAM: A GREEK CASE STUDY
Journal of Information Technology Management Volume XXVII, Number 3, 2016
130
Figure 6: Factorial group 2 and age
A difference is observed between two (2) age categories, 35–44 and above 65 years old.
Figure 7: Factorial group 2 and education
A difference is observed between two (2) education categories, technical and doctoral degree.
Factorial group 3: “Alternative” users
Figure 8: Factorial group 3 and gender
There is no difference observed between gender categories.
Figure 9: Factorial group 3 and age
According to age categories, users between 35–44 and 45–54 years old show a similar behaviour.

EXPLORING SMART INTENSE USE THROUGH TAM: A GREEK CASE STUDY
Journal of Information Technology Management Volume XXVII, Number 3, 2016
131
Figure 10: Factorial group 3 and education
Users with a technical degree differ from the other categories.
Factorial group 4: “Main” users
Figure 11: Factorial group 4 and gender
There is no difference observed between men and women.
Figure 12: Factorial group 4 and age
We can see a difference between users who are 18–24 and 55–64 years old and between users who are 35–44 and above 65 years old. This type of user is more intense in older ages.
Figure 13: Factorial group 4 and education
Users with a technical degree differ from those who have a postgraduate degree. Furthermore, a difference is observed between users whose educational category is characterised as “high school” and those who have a doctoral degree.

EXPLORING SMART INTENSE USE THROUGH TAM: A GREEK CASE STUDY
Journal of Information Technology Management Volume XXVII, Number 3, 2016
132
Factorial group 5: “Sceptic” users
Figure 14: Factorial group 5 and gender
A slight difference is observed between men and women.
Figure 15: Factorial group 5 and age
According to age category, we can observe a large difference between users aged 35–44 and 55–64 years and users aged above 65 years.
Figure 16: Factorial group 5 and education
Users with a university or a doctoral degree differ from those in the other categories.
Factorial group 6: “Workaholic” users
Figure 17: Factorial group 6 and gender
A slight difference is observed between gender categories.

EXPLORING SMART INTENSE USE THROUGH TAM: A GREEK CASE STUDY
Journal of Information Technology Management Volume XXVII, Number 3, 2016
133
Figure 18: Factorial group 6 and age
Users aged between 25–34 years and 35–44 years show a similar behaviour. In addition, a difference is observed between users who are 55–64 years or above 65 years old. This type of user is more intense in older age.
Figure 19: Factorial group 6 and education
Users with a technical degree differ from users with a doctoral degree.
Based on the above results:
1. There is no difference between men and women in terms of smartphone usage in any of the factorial groups.
2. Based on the age segmentation of users, we notice that users belonging to the youth categories (18–24 and 25–34 years) have the same or almost the same attitudes towards smartphone usage. Differences are observed among users aged 35–44 and 65+ years in the “insecure”, “main” and “sceptic” factorial groups. In addition, a difference is identified among users aged between 55–64 years and belonging to the “main” and “sceptic” factorial groups. Finally, a slight difference is noticed between users aged “55–64” and “65+” years in the “workaholic” factorial group.
3. According to educational categories, a difference is observed between those who are graduates from a technical educational institution and those who are have a doctorate (fulfilled a doctorate in philosophy) in the “enthusiastic”, “insecure” and “workaholic” factorial groups. Users with a technical degree differ from those in the other categories when characterised as “alternative” or “main”, and users with a doctoral degree differ from those in the remaining categories when characterised as “sceptic” or “main”. There is no difference between users with a university or those with a postgraduate degree in terms of smartphone usage. We can see that education plays a crucial role in behavioural usage when users have a technical or doctoral degree.
REVISED TECHNOLOGY
ACCEPTANCE MODEL
The TAM claims that users evaluate the system based on the system’s Perceived Ease of Use (PEOU) and Perceived Usefulness (PU). Davis [8] stated that perceived usefulness is “the degree to which a person believes that using a particular system would enhance his or her job performance”, while perceived ease of use is “the degree to which a person believes that using a particular system would be free of effort”. If the system is easy to use and useful, a user would have a positive attitude towards the system (AT), which in turn increases a user’s actual intention to use (BI). Then, the intention improves the user’s decision to use the system [5]. External variables (EV) (such as individual abilities or situational constraints) are used to determine undefined externally controllable factors [8].

EXPLORING SMART INTENSE USE THROUGH TAM: A GREEK CASE STUDY
Journal of Information Technology Management Volume XXVII, Number 3, 2016
134
Figure 20: Technology Acceptance Model [9]
Davis et al. [9] believes that AT and PU influence an individual‘s BI to use the technology, and PU is influenced by PEOU as well, because PEOU can indirectly influence the acceptance of technology through PU, while BI is also considered to have an influence on subsequent adoption behaviours.
Davis et al. [9] proposed the TAM to explain the impact of IT on user behaviours. Over time, the original TAM model was slightly modified to incorporate new findings. Three (3) major upgrades were proposed: the TAM2 [33], the UTAUT model [34] and the TAM3 [32]. The TAM2 incorporates additional theoretical constructs spanning social influence processes (subjective norm, voluntariness and image) and cognitive instrumental processes (job relevance, output quality, result demonstrability and perceived ease of use). The UTAUT theory holds the following constructs: (a) performance expectancy, (b) effort expectancy, (c) social influence and (d) facilitating conditions. In the extended model, the TAM3, Venkatesh and Bala [32] added constructs including computer self-efficacy, perceptions of external control, computer anxiety, computer playfulness, perceived enjoyment and objective usability.
Since Davis et al. [9] proposed the TAM, several approaches that focus on the degree of consumers’ technological acceptance have been examined. However, the TAM only provides general information about
whether a technology has been adopted by users. With the development of mobile devices and the release of Internet access, smartphones are becoming an increasingly important communication aspect of everyday life. Park and Chen [22] reported that perceived ease of use is positively related to the adoption of smartphones, suggesting an indicator regarding smartphone adoption.
Based on our analysis, we introduced a new dimension to the TAM model, which is related to the characteristics of smartphones and attitudes of smartphone users. We call this dimension “SMart Intense” (SMI). Based on transaction speed and a phone’s characteristics (model and software), users more easily adopt new technological achievements. None of the identified groups use smartphones more or less, but all types of users believe that smartphones are necessary in rural life; however, “enthusiastic”, “main” and “workaholic” users intend greater use.
We claim that although the TAM examines individuals’ behaviours concerning technology, a dimension that expresses the use of smart devices is necessary in the model to measure the intensity of smart use. As the development of technology is rapid, digital use seems to differ from the traditional use of technological devices, which led to the claim that it is important to add this new dimension.
Figure 21: TAM with the new dimension of SMI
Perceived
Usefulness
Attitude towards
Use
Behavioural Intention to
Use
Smart
Intense
Actual System of
Use
Perceived Ease of Use

EXPLORING SMART INTENSE USE THROUGH TAM: A GREEK CASE STUDY
Journal of Information Technology Management Volume XXVII, Number 3, 2016
135
Our empirical study validates the proposed research model and hypotheses and demonstrates that the hypotheses can be supported. Based on empirical evidence, the majority of calls via the Internet are calls made for professional reasons. If this system is useful (the perceived usefulness is increased), a user would have a positive attitude towards the use of this system, which in turn improves users’ attitudes (behavioural intention) and the final decision to use this technology. When users choose their smartphone based on its features, their satisfaction from application usage and the phone’s functionalities will be high (the perceived usefulness will increase, attitudes towards use will be improved and behavioural intention will increase). When the system design is developed in a more user-friendly form, users will feel more comfortable and will find the system more compatible and easier to use.
CONCLUSION AND FURTHER
RESEARCH
The goal of this study was to identify the factors affecting the adoption or rejection of new technological applications by Internet users. From this analysis, we found the model and the software of the smartphone, the used network and the variety of applications to be factors related to customer satisfaction with a smartphone. Using a factor analysis, we classified users into six (6) categories based on their attitudes towards smartphone usage: “enthusiastic”, “insecure”, “alternative”, “main”, “sceptic” and “workaholic” users. Examining the differences between these groups according to users’ demographic characteristics (age, education, gender), we found that there was no statistical difference between “enthusiastic” and “insecure” users, while a difference was demonstrated among “alternative”, “main” and “workaholic” users regarding the variables of age and education. There is a big difference between age categories among “sceptic” users. Technical degree plays an essential role in “alternative”, “main” and “workaholic” users. “Main” and “sceptic” usage is more intense in older ages. Users who have a doctoral degree are more sceptical than other educational backgrounds. Gender does not play a crucial role among any kind of user.
This paper proposes a revised TAM framework for enhancing our understanding of smartphone users’ attitudes towards usage. We have proposed an extension to the TAM, incorporating a new dimension, called the SMI. We claim that smart use differs from traditional technological use, which is the reason why it is necessary to have a separate dimension in the TAM model. We
suggest that SMI has an impact on the original model's constructs of perceived usefulness, attitudes towards use and behavioural intention.
However, the current study has a few limitations that must be recognised. First, as the survey was conducted among a group of individual Internet users in Greece, the results should be interpreted with caution, particularly with respect to the generalisation of research findings of Internet users as a whole. Next, our total sample population invited to participate in our survey still represents a small fraction of the millions of smartphones users. Future research needs to focus on a larger cross-section of Internet users and a more diversified random sample to verify the findings of the current study. Despite these limitations, we remain confident that the current empirical study on the revised TAM model can be helpful for future researchers and companies in the smartphone industry.
REFERENCES
[1] Ajzen, I. “The theory of planned behavior”, Organizational Behavior and Human Decision
Processes, Volume 50, 1991, pp.179-211. [2] Anetta, A. M., Zsuzsa, P., Lazlo, S. “Using the
theory of technology acceptance model to explain teenagers’ adoption of smartphones in Transylvania”, Studia Universitatis Babes Bolyai, Volume 1, 2012, pp.3-19.
[3] Chang, Y. F. and Chen, C. S. “Smart phone-the choice of client platform for mobile commerce”, Computer Standards & Interfaces, Volume 27, Number 4, 2005, pp.329-336.
[4] Chang, Y., Chen, C., Zhou, H. “Smartphone for mobile commerce”, Computer Standards &
Interfaces, Volume 31, Number 4, 2009, pp.740-747.
[5] Chen, J., Park, Y., Putzer, G. “An examination of the components that increase acceptance of smartphones among healthcare professionals”, Electronic Journal of Health Informatics, Volume 5, Number 2, 2010, pp.1-12.
[6] Chen, K., Chen, V. J., Yen, C. D. “Dimensions of self-efficacy in the study of smartphone acceptance”, Computer Standards & Interfaces, Volume 33, Number 4, 2011, pp.422-431.
[7] Choudrie, J., Pheeraphuttharangkoon, S., Zamani, E., Giaglis, G. “Investigating the adoption and use of smartphones in the UK: a silver-surfers perspective”, Proceedings of the Twenty Second
European Conference on Information Systems, Tel Aviv, 2014.
EXPLORING SMART INTENSE USE THROUGH TAM: A GREEK CASE STUDY
Journal of Information Technology Management Volume XXVII, Number 3, 2016
136
[8] Davis, F. “Perceived usefulness, perceived ease of use, and user acceptance of information technology”, MIS Quarterly, Volume 13, Number 3, 1989, pp.319-339.
[9] Davis, F. D., Bagozzi, R. P., Warshaw, P. R. “User acceptance of computer technology: a comparison of two theoretical models”, Management Science, Volume 35, 1989, pp.982-1003.
[10] Fishbein, M. and Ajzen I., Belief, attitude, intention
and behaviour: An introduction to theory and
research, Addison-Wesley, Boston, 1975. [11] Goodhue, D. L. “Development and Measurement
Validity of a Task-Technology Fit Instrument for User Evaluations of Information Systems”, Decision Sciences, Volume 29, Number 1, 1998, pp.105-138.
[12] Jarvenpaa, S., Lang, K., Takeda, Y., Tuunainen, V. “Mobile commerce at crossroads”, Commun ACM, Volume 46, Number 12, 2003, pp.41-44.
[13] Kim, D., Chun, H., Lee, H. “Determining the factors that influence college students’ adoption of smartphones”, Journal of association for
information science and technology, Volume 65, Number 3, 2014, pp.578-588.
[14] Kim, M., Park, M., Jeong, D. “The effects of customer satisfaction and switching barrier on customer loyalty in Korean mobile telecommunication services”, Telecommunications
Policy, Volume 28, Number 9-10, 2004, pp.145-159.
[15] Kourouthanassis, P. E. and Giaglis, G. M. “Introduction to special issue mobile commerce: the past, present, and future of mobile commerce research”, International Journal of Electronic
Commerce, Volume 16, Number 4, 2012, pp.5-17. [16] La Rue, M. E., Mitchell, M. A., Terhorst, L.,
Karimi, A. H. “Assessing mobile phone communication utility preferences in a social support network”, Telematics & Informatics, Volume 27, Number 4, 2010, pp.363-369.
[17] Leung, L. and Wei, R. A. N. “Who are the mobile phone have-nots? Influences and consequences”, New Media and Society, Volume 1, Number 2, 1999, pp.209-226.
[18] Ling, C., Hwang, W., Salvendy, G. 2006. “Diversified users’ satisfaction with advanced mobile phone features” Universal Access in the
Information Society, Volume 5, Number 2, 2006, pp.239-249.
[19] Literral, M. “What are 1st, 2nd and 3rd Generation Mobile Phones?”, http://www.articlesbase.com/technology-
articles/what-are-1st-2nd-and-3rd-generation-mobile-phones-467075.html, 2008.
[20] Mathieson, K., Peacock, E., Chin, W. W. “Extending the Technology Acceptance Model: The Influence of Perceived User Resources” The
DATA BASE for Advances in Information Systems, Volume 32, Number 3, 2001, pp.86-112.
[21] Parasuraman, A. “Reflections on gaining competitive advantage through customer value”, Journal of the Academy of Marketing Science, Volume 25, Number 2, 1997, pp.154-161.
[22] Park, Y. and Chen, J. V. “Acceptance and adoption of the innovative use of Smartphone”, Industrial
Management and Data Systems, Volume 107, Number 9, 2007, pp.1349-1365.
[23] Park, B. and Lee, K. “A pilot study to analyze the effects of user experience and device characteristics on the customer satisfaction of smartphone users”, Communications in Computer and Information
Science, Volume 151, Number 2, 2011, pp.421-427.
[24] Reichheld, F. F. “Learning from customer defections”, Harvard Business Review, Volume 74, 1996, pp.56-67.
[25] Rodriguez-Repiso, L., Setchi, R., Salmeron, J. L. “Modeling IT projects success: emerging methodologies reviewed”, Technovation, Volume 27, Number 10, 2007, pp.582-594.
[26] Rogers, E. M., Diffusion of Innovations, 3rd Edition, New York: Free Press, 1983.
[27] Rogers, E. M., Diffusion of Innovations, 1st Edition, New York: Free Press, 1962, pp.31-52.
[28] Rushton, K. “Number of smartphones tops one billion. The Telegraph”, http://www.telegraph.co.uk/finance/9616011/Number-of-smartphones-tops-one-billion.html, 2012.
[29] Steven, J. V. N. “OSs battle in the smart-phone market”, IEEE Computer, Volume 36, Number 6, 2003, pp.10-12.
[30] Ting, D. H., Lim, S. F., Patanmacia, T. S., Low, C. G., Ker, G. C. “Dependency on smartphone and the impact on purchase behavior”, Young consumers, Volume 12, Number 3, 2011, pp.193-203.
[31] Young Mo, K., Cho, C., Lee, S. “Analysis of factors affecting the adoption of smartphones”, Proceedings of the Technology Management
Conference (ITMC), IEEE International, 2011. [32] Venkatesh, V. and Bala, H. “Technology
Acceptance Model 3 and a Research Agenda on Interventions”, Decision Sciences, Volume 39, Number 2, 2008, pp.273-315.
[33] Venkatesh, V. and Davis, F. D. “A theoretical extension of the technology acceptance model: four
EXPLORING SMART INTENSE USE THROUGH TAM: A GREEK CASE STUDY
Journal of Information Technology Management Volume XXVII, Number 3, 2016
137
longitudinal field studies”, Management Science, Volume 46, Number 2, 2000, pp.186-204.
[34] Venkatesh, V., Morris, M. G., Davis, G. B., Davis, F. D. “User acceptance of information technology: Toward a unified view”, MIS Quarterly, Volume 27, Number 3, 2003, pp.425-478.
[35] Woodruff, R. B. “Customer value: the next source for competitive edge”, Journal of the Academy of
Marketing Science, Volume 25, Number 2, 1997, pp.139-153.
[36] Zeithaml, V. A. “Consumer perceptions of price, quality, and value: A means-end model and Synthesis of Evidence”, Journal of Marketing, Volume 52, Number 3, 1988, pp.2-22.
AUTHOR BIOGRAPHIES
Evgenia Fronimaki holds a B.Sc. in Business Administration from the University of the Aegean (specialization track in Accounting and Finance), a M.Sc. in Tourism Planning, Management and Policy and a MBA (specialization track in Production and Operations Management) from the same University. Since April 2015 is a PhD Candidate (Department of Business Administration) on the “Redesigning operations management with the use of Information and Communications Technology”. Her fields of interest include the re-engineering and re-manufacturing of production systems in additive manufacturing (3D printing). Her research is funded by the Scholarship Program “Hypatia” of the University of the Aegean.
Maria Mavri is Assistant Professor of
Quantitative Methods at the Department of Business Administration, University of the Aegean. She holds a first degree in Mathematics from the University of Athens, a M.Sc. degree in Decision Sciences from Athens University of Business & Economics and a PhD in Operational Research from the same University. Her scientific interests apply in the field of Operational Research; Data Analysis, Banking Management and Redesign of production operations through Information and Communication Technology. Part of her research work has been published in international refereed academic journals or presented in international conferences.