Embed Size (px)
Citation preview
Exploring the Labour Patterns of Women and Mothers Through
the COVID-19 Pandemic: The Impact of School Closures and a
New Kind of Recession
Renee Isabel Utter
May 2021
University of California, Berkeley
Department of Economics
Undergraduate Honors Thesis
Advised by Professor Martha Olney*
Abstract
This paper uses the IPUMS CPS survey and state school-closure data from Education Week to
analyze the economic impacts of the COVID-19 pandemic’s school closures and economic
shutdowns on married couples in the United States. I find that existing inequalities for both
gender and racial minorities in the labour force were exacerbated during the COVID-19
recession. Additionally, both partial and full school closures were associated with a ~2
percentage point decrease in labour force participation for the entire sample and could have long-
term impacts on the demographic indicators of labour force participation. When isolating parents
during COVID-19, I found that mothers who were able to telework were able to complete more
of their full-time work schedule compared to fathers who could telework, and full school
closures decreased the fraction of full-time work parents were able to complete by ~2 percentage
points. An intersectional analysis of labour force participation showed Black women and
mothers experienced the pandemic recession differently from other racial groups in the sample.
* A special thank you to Professor Olney, for your guidance and encouragement during this past year. And a special
note to my grandfathers, whose hands I didn’t get to hold once more and who didn’t make it to read this final
document, but who I know would be proud that academia and feminism is being carried on in the family.
2
1 Introduction
March of 2020, the first month of the state-wide lockdowns due to the COVID-19
pandemic, marks the beginning of one of the most challenging years in the economic history of
the United States. With local and global economies under restriction and school closures, this
recession made an impact unlike those in recent history as its impacts were felt in both the work
life and home life of many adults (Zamarro & Prados 2021). Many public schools and daycare
services, which provide essential childcare for many households, faced closures that forced
parents to make decisions on employment and the division of housework; as all of these
disruptions to daily life were being introduced, America was being pushed into a new recession.
This recession has been unlike any other because the labour force is shrinking along
gendered lines (Collins et al. 2021) (Ewing-Nelson 2021) (Alon et al. 2020). According to the
National Women’s Law Center, the United States net job loss in December of 2020 was 140,000.
All of these jobs were held by women. Additionally, in Black and Latina women over the age of
20, the December 2020 unemployment rate has remained at 8.4% and 9.1%, respectively, despite
the relative economic recovery experienced within other demographics (Ewing-Nelson 2021).
For the first time in American history, this recession appears to be impacting women’s
employment more than men’s; this could be a consequence of the massive hit to the service
industry during stay-at-home orders and the increased childcare needs due to school closures
(BLS 2020) (Zamarro & Prados 2021). Research suggests that, in line with previous trends,
women have continued to take on more of the household and childcare responsibilities in single
and dual-income families (Alon et al. 2020) (Bertrand et al. 2013). Significant breaks from the
workforce can have large perceived impact on the skills of women as they return to the
workplace (Lovejoy & Stone 2012). Consequently, women who return to the labour force tend to
3
pursue more female-dominated career fields; in this large-scale pandemic, this could lead to even
greater gender gaps in particular fields (Jacobson & Levin 1995). Even if we were to assume that
the employment rates will return to the pre-pandemic state immediately after the COVID vaccine
is released, the temporary decrease in female employees can hinder the long-term progress of the
closing wage gap by further segregating industries and strengthening the impacts of the
motherhood penalty (Alon et al. 2020) (Budig & Hodges 2010). Consequently, it has been shown
that earlier school reopening may have a positive impact on “recession-induced relative skill
losses that women experience” (Alon et al. 2020).
As this COVID recession is ongoing and data measuring the real consequences on gender
equality will likely not be available for decades, I will use Current Population Survey (CPS) data
from married couples, with present spouses, from 2015-2021 to build a model that examines
labour force participation patterns of men and women in childless and non-childless marriages
using predictive variables such as pandemic school closures, race, family income, education,
while controlling for other factors. Modeling COVID-19’s impact on labour force participation
will be an important starting point to understand the possible impact of various socio-political
and economic factors on how particular communities have suffered under the COVID recession.
The future gender composition of the workforce can not only have an impact on closing the
gender pay gap, but also on the structural discrimination that could lead to an unnecessary
depression in America’s GDP growth. A study by Hsieh et al. (2019) shows that gender
inequalities in the workforce can negatively impact GDP growth overall by misallocating talent,
so this could be an important moment to evaluate the possible future consequences of the
pandemic and respond with adequate policy (Hsieh et al. 2019). In addition to labour force
participation, I will be using survey responses from parents on teleworking (being able to work
4
remotely for pay) and the portion of their normal schedule they were able to work during 2020,
to understand the relationship between telework and productivity of working mothers and
fathers. This will provide some insight into the way COVID-19, school closures, and working
from home has impacted productivity across different communities.
The structure of the paper will be as follows. I will begin with a survey of the pre-
pandemic state of women in the workforce, and their contributions to housework in domestic
partnerships. I will be using the body of work on the impact of maternity leave and childbearing
on women’s income trajectory and labour force participation, to estimate how the effects of
sudden school closures (and re-introduction of full-time childcare requirements to home life) can
mirror some of those impacts. Then, I will evaluate the ways in which this pandemic-related
recession is different from previous recessions, and the impact of school closures on family
demands. I will introduce my primary dataset (IPUMS-CPS) on employment statistics and my
secondary dataset (Education Week) on state-by-state school closure orders, the methods by
which I organized the data, and then I will compare the sample’s demographics to those of the
United States as a whole. I will then introduce two multilinear regression models: 1. A
probability model on the labour force participation of the sample both before and after the start
of the pandemic and 2. A model estimating the percentage of a full-time work schedule a parent
during COVID-19 will work based on demographic properties, telework, and school closures. I
will discuss my findings in relation to previous literature before concluding.
2 The Pre-Pandemic State of Women in the Labour Force
Female participation in the labour force has been on the rise since the mid-twentieth
century. The entire United States economy has benefitted from this increase of women in the
5
workplace; the country’s 2012 GDP would have been 11 percent lower had women not increased
their work hours in the last forty years (Appelbaum et al. 2014). This increase in labour force
participation rate among women appears to have leveled off since its peak at 60 percent in 1999,
it currently sits around 57 percent, a pattern that may suggest some stabilization and
predictability in the rate of women entering the workforce (Appelbaum et al. 2014) (Toossi
2006). In a 2006 study, the participation rate of women in the labour force was projected to
decline to 55.1 percent, men to 66 percent, in 2050 (Toossi 2006) (England et al. 2020). This
would suggest that, while there is an upward pressure of female participation rates (likely due to
accessible education, resources, and public policy), the overall downward pressure due to the
composition of the population and social security suggests an eventual decline in both male and
female labour force participation rates (Sonfield et al. 2013) (England et al. 2020). Overall,
women’s participation is not projected to reach that of men in the next 30 years (Toossi 2006)
(England et al. 2020). This is an important consideration as the field moves forward in studying
the impacts of public policy on working women because it is an indicator that perhaps the United
States is falling behind other countries in supporting working families (Blau & Khan 2013).
In addition to, and in part a result of, the demographic makeup of the American
workforce, the gender pay gap has persisted in the last century for working men and women
(Litman et al. 2020) (Mandel 2014) (Blau & Khan 2017). Despite some theories that the gap can
be explained by women’s career fields, much research has been done to suggest that the choice
of career path for women may be heavily impacted by their early mathematics and STEM
education, the hurdles of discrimination and harassment in male-dominated fields, and potentials
for mentorship being lower in high-paying, male-dominated fields (Cimpian et al. 2016) (Martin
& Barnard 2013) (Foster et al. 2011). Additionally, research has shown that when more women
6
enter a field, the wages and perceived job quality in the field decline as a result of devaluation
(Levanon et al. 2009) (Stier & Yaish 2014). This combination of evidence makes clear that
American women face a pay gap both within and among their fields due to gender discrimination
(Castilla 2008). The gender pay gap appears to be closing, but full gender equality seems out of
reach without expanding the conversation into the household, where an increase in men’s
participation in unpaid household work is the primary barrier to full equality (England et al.
2020) (Zamarro & Prados 2021).
3 Existing Patterns of Household Labour Division
Since the start of 2020, stay-at-home orders have been implemented and lifted throughout
the entire country. With many families facing school and office closures, assessing the division
of both paid and unpaid labour in dual-income households is important in understanding the
decisions women are making. Past research on the division of labour within households
illustrates just how much social norms and gender expectations impact housework (Schneider
2012) (McClintock 2018). Through this paper, I will define household labour as the unpaid work
done to maintain a family unit: laundry, childcare, cooking, and other manual and emotional
labour that goes without financial benefit. In heterosexual couples, the burden of household
labour is most commonly placed on the woman; however, even when gender is removed, studies
have shown that the type and amount of paid work done by each partner is a key indicator of the
household labour and childcare responsibilities in early parenthood (McClintock 2018) (Van
Rijn - Van Gelderen 2020). This could suggest that relative income levels could greatly impact a
couples’ chosen allocation of housework. It is however important to note that the probability of a
woman making more than her male partner is lower, as research suggests such a strong aversion
7
to a wife making more than her husband that, facing a wage higher than her husband, a wife may
leave the workforce altogether (Fortin 2005) (Bertrand et al. 2013). Specifically, in a model
defined by Bertrand et al. (2013), a 10 percent increase in the probability that, should she enter
the workforce, a wife’s income would surpass her husband’s, corresponds with a 1.8 percent
decrease in the probability that she will enter the workforce at all. However, even in households
where the wife earns more than her husband, wives in dual-earning households tend to spend
more hours on non-market work and family caregiving (Bertrand et al. 2013) (Bittman et al.
2003). These previously studied patterns in household labour allocations suggest that the default
trend in couples’ behavior puts the burden of childcare and “homemaking” on the woman,
regardless of her relative economic advantage in the paid labour force (Bittman et al. 2003)
(Cooke 2006) (West & Zimmerman 1987). An argument can be made that the pandemic
recession will increase men’s participation in childcare activities and narrow the gender gaps in
the labour market by altering social norms (Alon et al. 2020). In this paper, I will operate under
the assumption that a full reversal of these patterns during the COVID crisis is highly
improbable, and recent data suggests a clutching to existing gender attitudes and patterns
(Reichelt et al. 2020). To strengthen the assumption that existing patterns of labour distribution
will continue in the pandemic recession, the literature suggests a tendency for men to
consistently overestimate their contributions to housework (Carlson 2020) (Koropeckyj-Cox et
al. 2007) (McClintock 2018). In this paper, I will consider time to consist of either housework or
paid work, I will also be factoring the idea of multitasking (given the prevalence of teleworking)
into the time frame in which I have data (Offer & Schneider 2011).
4 The Impacts of Children on Short-run and Long-run Earnings
8
One of the most common breaks from the workforce is pregnancy and the birth of a child.
The United States mandates only 12 weeks of unpaid leave for new mothers, and even this small
improvement has been linked to improved health outcomes for both the mother and the child
(Jou et al. 2018) (Gruber 1994) (Milkman & Applebaum 2013). COVID-19 parallels maternity
leaves and childbirth in the wage and childcare shock it has had on working families. To model a
couple’s behavior during the unplanned COVID-emergency, I can look to past research on the
impact of family planning on a woman’s labour force participation. Overall, mothers’
intermittent attachment to the labour force impacts their life-long earnings via wage cuts and
workplace biases (Staff & Mortimer 2012) (Jacobsen 1995) (Lovejoy & Stone 2012). For women
in their early 20s, research has shown that access to oral contraception, as a method of family
planning, increases their labour force participation rates and lifetime earnings by allowing
women to plan pregnancies around career goals (Bailey 2005) (Mills et al. 2011) (Sonfield et al.
2013). Pregnancies and childbirth are expensive, time-consuming events that, when unplanned,
can impact earnings, educational attainment, and mental health of mothers (Hotchkiss 2017)
(Sonfield et al. 2013) (Foster et al. 2018). A longitudinal study of lifetime labour practices
indicates that women who have children in their early 20s are likely to return to the labour force
in their late thirties, just as the childcare responsibilities are diminishing (Bailey 2005). In
observing fertility and work trends it should be noted that preference plays a large role within
certain cohorts, as some women just have a stronger preference to work over having a child;
preference towards flexibility can also determine the industry and nature of the work women
chose (Desai & Waite 1991) (Bolotnyy & Emanuel 2018). The time and financial cost of a child
can now be a factor impacting the family planning of a couple as well as their decision on
workforce re-entry after any maternity leave is taken (Ericksen et al. 2008). In later stages of
9
their careers, family interference with work increases a woman’s likelihood of leaving the
workforce but reduces a man’s (Xue et al. 2018). So, the ability of families to plan such a career
interruption like pregnancy can impact whether or not the gender norms of labour force
participation are reinforced in later stages of the couple’s career. In the case of an unplanned
childcare cost – such as an unexpected loss of childcare services and public school during
COVID-19 – the impact of the pandemic on gender norms and long-term career outcomes within
households will be an interesting topic of future research.
Even in planned pregnancies, the financial impact of having a child at all can be felt
throughout a woman’s life as mothers face greater friction in advancing through the labour
market (Budig & England 2001) (Correll et al. 2007). Pepping & Maniam (2020) suggest that the
largest increase in wage penalties for mothers, when controlling for experience and education,
comes with the birth of the first child (14 percent) and increases with each additional child up to
17 percent with the third child. Not only does motherhood impact a woman’s overall
productivity in her occupation, but the time away from the workforce also decreases human
capital and the potential for seniority (Pepping & Maniam 2020) (Gallen 2018). Gender norms
greatly impact the intensity of the motherhood penalty, as research shows a negative bias
towards childless couples overall and a positive correlation between long-run child penalties and
the fraction of a country agreeing that women with school-age children should stay home
(Koropeckyj-Cox 2007) (Henrik et al. 2019) (Kleven et al. 2019). Additionally, the penalty is felt
in varying magnitudes among income and racial/ethnic groups, which is important to remember
as we analyze the intersectional impact of COVID-19 on parents (Budig & Hodges 2010) (Ortiz
& Roscingo 2009) (Willson 2003). During a pandemic recession, as with any recession, a
decrease in income is to be expected in the short run, but studies show a persistent and
10
significant gap between the child penalties of men and women in the long run (Henrik et al.
2019) (Cooke 2014). Furthermore, parental leave policies seemed to have a negligible impact on
long-term child penalties in countries; however, childcare accessibility has been linked to
improved work hours and wages of mothers compared to non-mothers (Kleven et al. 2019)
(Henrik et al.) (Misra et al. 2011). Given this emphasis on childcare, I suspected that, in the
absence of schooling, mothers’ access to remote work and flexible work hours may have a
positive impact on the hours they can work during the short term of 2020. Observing the impacts
of maternity/paternity breaks from the labour force can be an interesting proxy for the potential
long-term impact of pandemic-related breaks from the labour force on the long-term income
levels of women. If these two phenomena mirror the effects of one another, the country may be
headed for a larger gap between men and women’s earnings as they move through their careers,
beyond 2020.
5 COVID-19 and the Features of a Pandemic Recession
Despite the lack of data available on recent shocks to the workforce in the United States,
there have been preliminary investigations done into the sociological and economic impacts of
COVID-19 on gender equality. Previous work has categorized the causes of disproportionately
female unemployment in the COVID-recession into two primary mechanisms: the large hit to the
service industry caused by rolling economic shutdowns and the increased burden of childcare
due to school closures (Alon et al. 2020) (Bui et al. 2020). The focus of this paper will be on the
latter of the two, but it is important to understand that, in the recovery, fewer available jobs in
female-dominated industries and the increased turnover of layoffs and rehires could impact
women’s decision to return to work (Alon et al. 2020) (Chodorow-Reich & Coglianese 2020).
11
These factors, however, don’t necessarily imply that this recession will impact women more than
men by pure employment statistics. While most previous recessions have disproportionately
impacted men and subsequently pushed women into the labour force to subsidize lost income,
this recession will likely negatively impact both sexes equally (Toossi & Morisi 2017) (Albanesi
2019) (Alon et al. 2020). This is an important research topic, because mothers have a unique
experience with unemployment due to psychological factors, and the financial struggles of
unemployment can be an even larger strain on marriages (Rao 2020) (Langner 2020). This strain
on marriages can put women at risk of violence by their domestic partners, who account for
roughly three-quarters of all violence against women, as the bargaining household model and
2020 data on rising intimate partner violence would suggest (Aizer 2010) (Evans et al. 2020). It
is important to be mindful of the dangers many women may experience in the face of both stay-
at-home orders and massive unemployment; to this end, I will be analyzing respondents who are
both married and have present spouses.
Without the influx of women in the workforce caused by regular recessions and instead a
pressure out of the workforce, women’s loss of skill from this pandemic-related break in
employment could decrease potential earnings and increase the wage gap by an estimated 5
percent (Alon et al. 2020). However, research suggests convenience is a large determining factor
in labour force participation after birth and that greater flexibility can increase a woman’s
likelihood of returning to work, but the caveat is that this flexibility has traditionally meant a
shift to part-time work, minimum-wage positions, and/or positions with little to no benefits
(Desai & Waite 1991) (Hakim 2002) (Buehler & O'Brien 2011) (Powell 1998). This is an
interesting consideration in the COVID recession, because the shift to remote work should,
hypothetically, be making all jobs more flexible. How, then, are so many women leaving the
12
workforce? This draws an interesting parallel to the emerging “gig” economy, where presumably
the flexible work schedule would accommodate mothers and eliminate the motherhood penalty,
but the gender pay gap persists (Cook et al. 18). One possible explanation for the pandemic-
related, female-dominated exodus from the labour force is the notion of productivity. During
normal times, a significant portion, but not the entirety, of the gender pay gap for mothers in
more liberal countries is explained by the gender productivity gap between men and mothers
(Gallen 2018) (McDevitt et al. 2009). If the burden of childcare in normal times decreases the
productivity of working mothers, then a world without schools, after-school centers, day-care,
and other vital services for dual-income households, could widen that productivity gap far
enough to impact pay and promotions long into the future.
In terms of childcare responsibilities, a key consideration is the age of the child. Roughly
32 percent of the U.S workforce has a child at home under the age of 14, and 30 percent of those
with children have one under the age of 6, so daycare re-openings have alleviated the burden on
those families (Alon et al. 2020). One of the important mechanisms for dual-income families is
that of family insurance; when one partner is forced to leave the labour force in some fashion, the
other can enter or increase their hours in the labour force to make up for lost income. The
question of which partner will involuntarily leave the workforce is arbitrary and has a variety of
external influences; however, determining which partner will voluntarily leave the workforce can
have inter-household, gendered components. In Europe, studies have already shown the burden
of these changes in unpaid work caused by school closures has disproportionately been placed on
women and mothers (Kulic 2020) (Hazarika & Das 2020). Exchange and bargaining theories
would suggest that the decision would be simple: the partner with the higher salary, in other
words, the higher opportunity cost, would continue in the workforce, and the other would take on
13
more of the unpaid labour and step out of the labour force (Kulic 2020). These theories don’t
seem to hold in observational research which suggests that, in households where the woman
provides more than half of the family’s income, she is more likely to take on more of the unpaid
housework; additionally, a woman’s work hours have little impact on her childcare hours
regardless of wage (Bittman et al. 2003) (Buehler & O'Brien 2011). Gender roles and cultural
norms play a large role in married, heterosexual couples’ decisions on who will do paid and
unpaid work (Van Rijn - Van Gelderen 2020) (Schneider 2012). So, a woman’s voluntary exit
from the workforce may violate our general assumptions that a couple will choose a labour
distribution that maximizes household income. The mass exodus of women from the workforce
appears to have accentuated cultural gender norms and the combination of the two could impact
the eventual recovery of the economy as a whole.
6 Data and Methodology
6.1 CPS Data Overview
The primary dataset I will be using in my analysis is the IPUMS-CPS, University of
Minnesota, www.ipums.org. The IPUMS-CPS site organizes and combines both the monthly
Current Population Survey (CPS) and the Annual Social and Economic Supplement (ASEC)
collected by both the U.S Census Bureau and the Bureau of Labor Statistics. Created by the
Minnesota Population Center and the Unicon Research Group, the IPUMS-CPS compiles
microdata from the last fifty years of CPS and ASEC surveys, while recoding some of the
variables to be consistent over time. IPUMS-CPS is not a set of statistics and the data itself is
untouched, so the following discussion on collection and potential bias will be focused on the
U.S Census Bureau and the Bureau of Labor Statistics, who gathered the microdata.
14
Because the latest March supplement available at the time of this research is from 2020,
the start of the pandemic, my analysis will use variables collected exclusively in the CPS. The
CPS is a survey conducted monthly via telephone and field representatives. Once households are
selected, they are sampled for four consecutive months, then not included for the following eight
months, then are again sampled for four consecutive months. So, after 16 months in the survey,
each sample household has eight total months of data. All sample respondents are over the age of
15 and not in the armed forces or other institutions (such as prisons and long-term care facilities).
This is useful to my analysis because those employed in the armed services have inflexible
schedules that may impact calculations of weekly hours worked. Another important feature is
that this is a household survey, so only one member of the household submits responses for all
other members. This can lead to inaccuracies in reporting for those living with other adult
roommates and non-family members whose employment activities may not be well known to the
respondent. When the respondent admits not knowing their cohabitant’s information, the field
representatives attempt to reach the cohabitant individually.
The CPS data follows a sample pattern that makes my analysis of the month-to-month
changes throughout 2020, and the year-to-year changes before and after COVID more accurate,
as it is designed to minimize the variance of estimates. The addresses are interviewed in the
previously mentioned 4-8-4 scheme, so 75% of the sample group remains unchanged month-to-
month and 50% remains unchanged year-to-year.† This will allow me to analyze the change in
each month’s averages by working against sampling bias of respondents in one given month, but
also providing continuity over months. The continuity should make it very unlikely to see rapid
differences in averages from one month to the next.
† For more information on the sample rotation and charts outlining the design see:
https://www.census.gov/prod/2006pubs/tp-66.pdf
15
Although I am interested in the patterns of 2020, I will be using monthly samples from
2015-2021 to get an accurate idea of how much variation in work can be attributed to long-term
changes in the labour force. Additionally, because I am analyzing the difference between men
and women in the context of family and household responsibilities, I have filtered the dataset to
only include adults with a “married” status and a present partner in their household. There are
3,688,046 total observations in the sample; just under half (1,842,688) of the sample identifies as
male, the rest as female.
In addition to the IPUMS-CPS data, I also used data on school re-openings by state from
Education Week. The data is updated weekly from press releases and government websites. The
details of the methodology aren’t clear or available, but the dataset included the status of full
closure, partial closure, varied between districts, no order, and hybrid/remote only. The only
alterations made were to correct inconsistencies in label names (ex. “no order” vs. “no order in
effect”).
6.2 Demographics of Sample vs. Population
Since I limited the sample to married couples, I reviewed some key statistics of the
sample to the United States population demographics from the 2019 US Census Bureau’s
population estimates.‡ In terms of racial composition, this sample appears relatively
representative, however, it is difficult to perfectly compare these percentages due to the different
options provided on the Census and the CPS. Keeping this in mind, when I attempt to predict the
country-wide impact of the crisis, I will consider the weight of the white population represented
‡ See full table here: https://www.census.gov/quickfacts/fact/table/US/PST045219
16
in the sample. Since the sample is chosen by random address selection, the CPS data includes
weights for households that may be overrepresented, to ensure the data is most consistent with
the area’s population.
Figure 1: Demographics of IPUMS CPS sample versus the U.S. Population
Race Sample % U.S. Population
White non-Hispanic 75.61 62.8
Black non-Hispanic 6.05 12.1
American Indian 0.88 1.30
Hispanic 10.66 18.50
Asian/P.I. 5.81 6.10
More than one race present 1.12 2.80
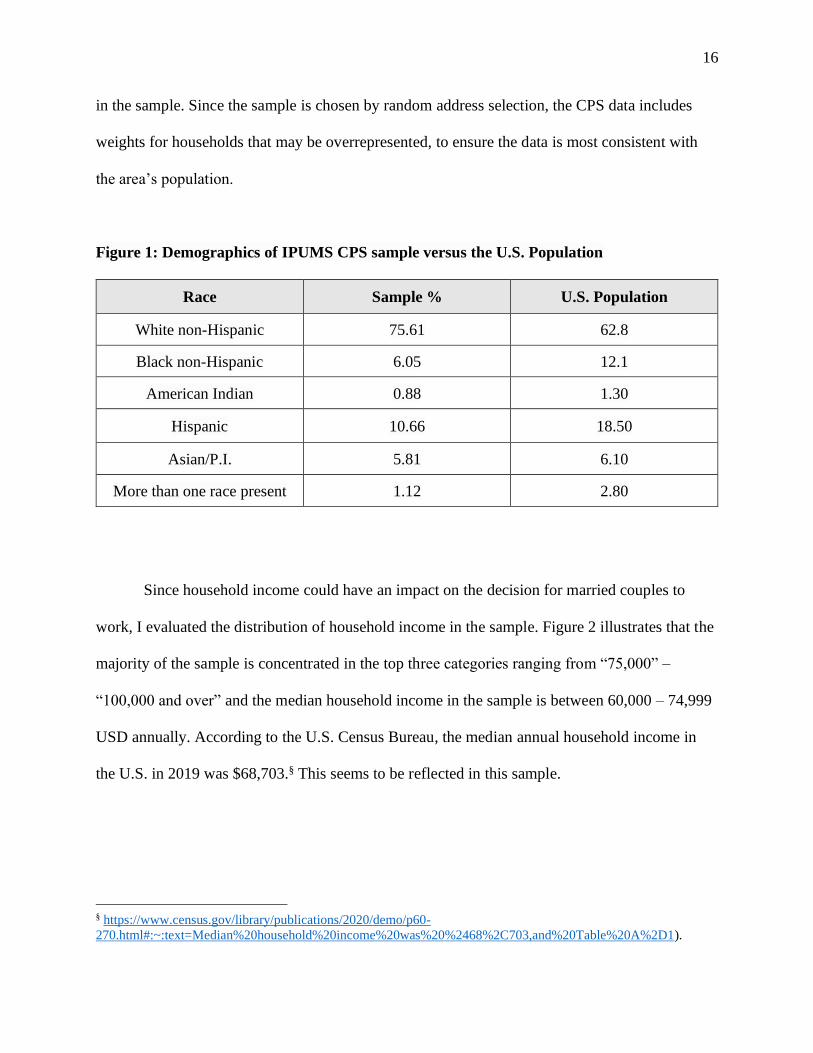
Since household income could have an impact on the decision for married couples to
work, I evaluated the distribution of household income in the sample. Figure 2 illustrates that the
majority of the sample is concentrated in the top three categories ranging from “75,000” –
“100,000 and over” and the median household income in the sample is between 60,000 – 74,999
USD annually. According to the U.S. Census Bureau, the median annual household income in
the U.S. in 2019 was $68,703.§ This seems to be reflected in this sample.
§ https://www.census.gov/library/publications/2020/demo/p60-
270.html#:~:text=Median%20household%20income%20was%20%2468%2C703,and%20Table%20A%2D1).
17
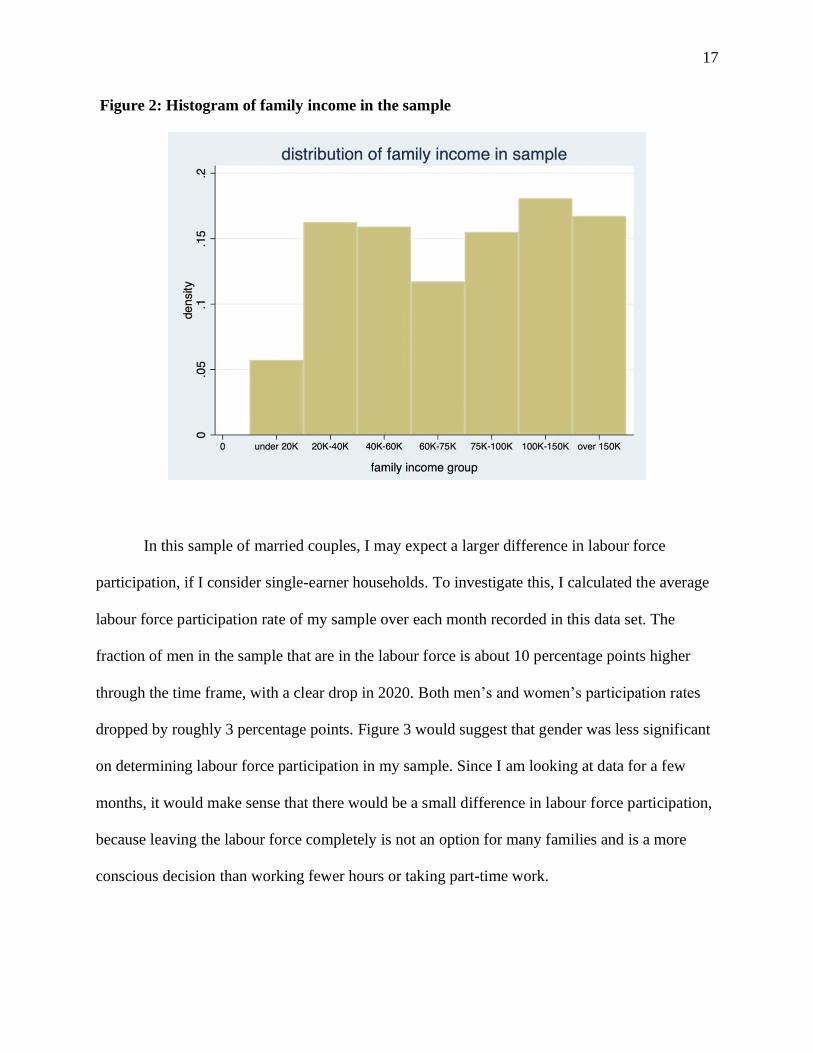
Figure 2: Histogram of family income in the sample
In this sample of married couples, I may expect a larger difference in labour force
participation, if I consider single-earner households. To investigate this, I calculated the average
labour force participation rate of my sample over each month recorded in this data set. The
fraction of men in the sample that are in the labour force is about 10 percentage points higher
through the time frame, with a clear drop in 2020. Both men’s and women’s participation rates
dropped by roughly 3 percentage points. Figure 3 would suggest that gender was less significant
on determining labour force participation in my sample. Since I am looking at data for a few
months, it would make sense that there would be a small difference in labour force participation,
because leaving the labour force completely is not an option for many families and is a more
conscious decision than working fewer hours or taking part-time work.
18
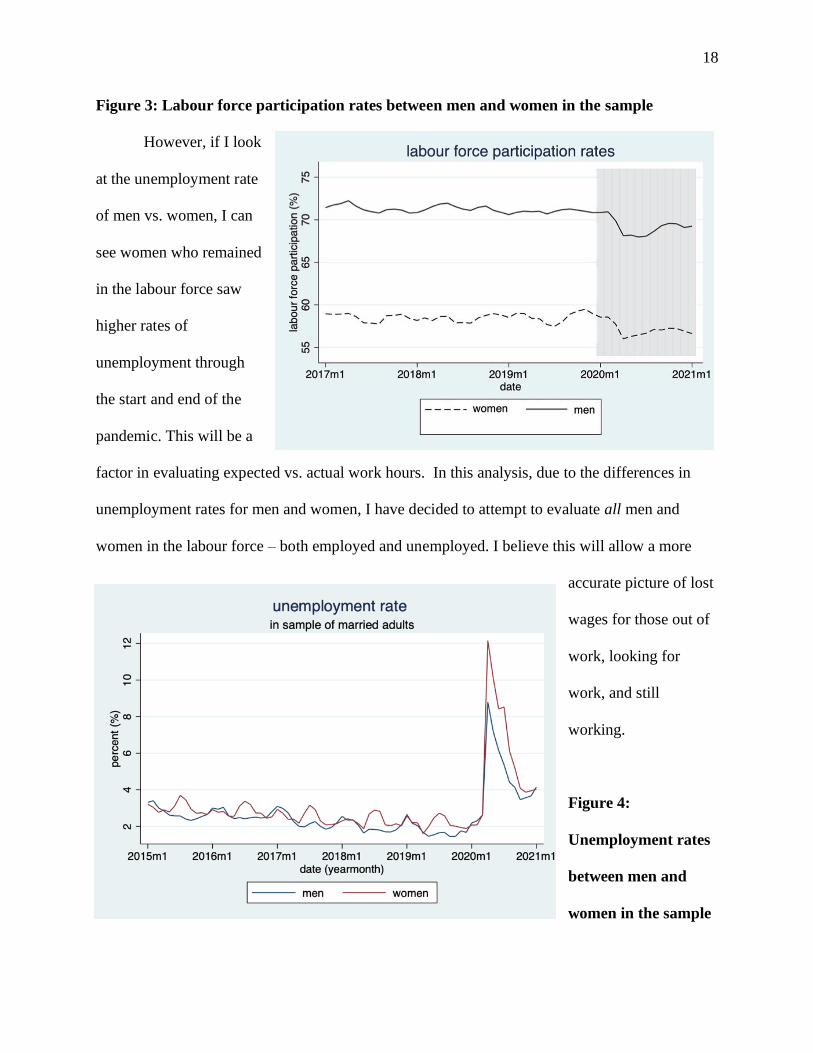
Figure 3: Labour force participation rates between men and women in the sample
However, if I look
at the unemployment rate
of men vs. women, I can
see women who remained
in the labour force saw
higher rates of
unemployment through
the start and end of the
pandemic. This will be a
factor in evaluating expected vs. actual work hours. In this analysis, due to the differences in
unemployment rates for men and women, I have decided to attempt to evaluate all men and
women in the labour force – both employed and unemployed. I believe this will allow a more
accurate picture of lost
wages for those out of
work, looking for
work, and still
working.
Figure 4:
Unemployment rates
between men and
women in the sample
19
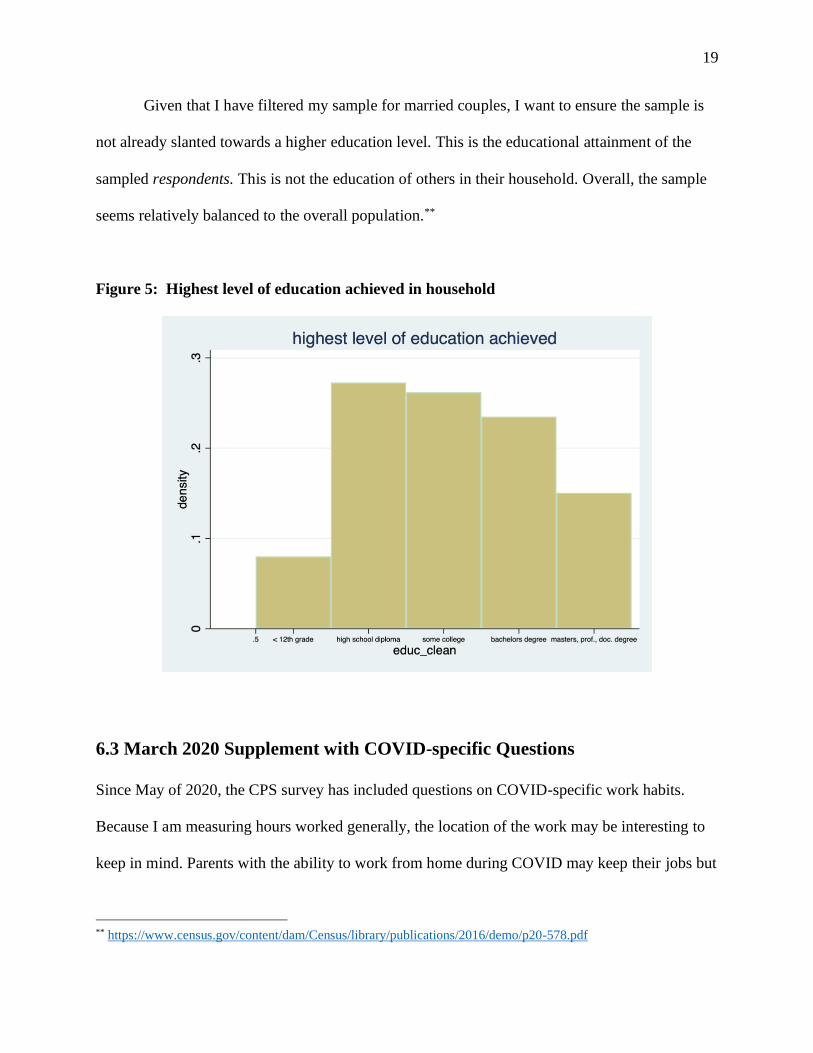
Given that I have filtered my sample for married couples, I want to ensure the sample is
not already slanted towards a higher education level. This is the educational attainment of the
sampled respondents. This is not the education of others in their household. Overall, the sample
seems relatively balanced to the overall population.**
Figure 5: Highest level of education achieved in household
6.3 March 2020 Supplement with COVID-specific Questions
Since May of 2020, the CPS survey has included questions on COVID-specific work habits.
Because I am measuring hours worked generally, the location of the work may be interesting to
keep in mind. Parents with the ability to work from home during COVID may keep their jobs but
** https://www.census.gov/content/dam/Census/library/publications/2016/demo/p20-578.pdf
20
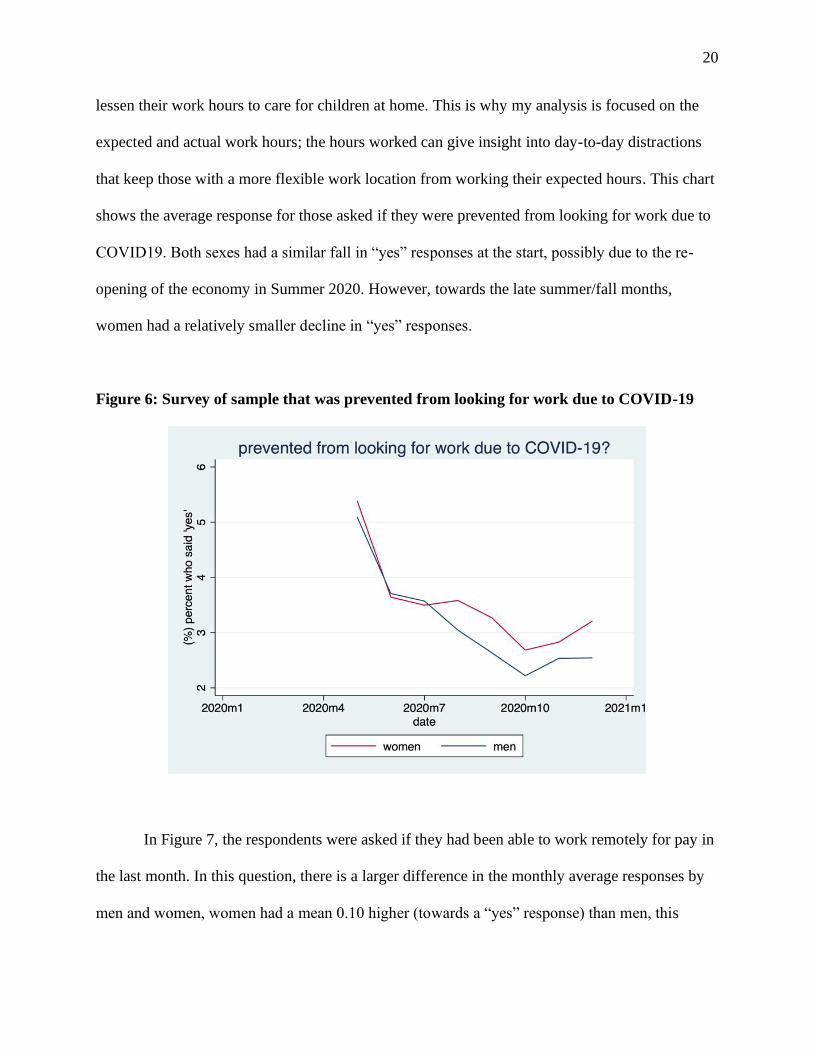
lessen their work hours to care for children at home. This is why my analysis is focused on the
expected and actual work hours; the hours worked can give insight into day-to-day distractions
that keep those with a more flexible work location from working their expected hours. This chart
shows the average response for those asked if they were prevented from looking for work due to
COVID19. Both sexes had a similar fall in “yes” responses at the start, possibly due to the re-
opening of the economy in Summer 2020. However, towards the late summer/fall months,
women had a relatively smaller decline in “yes” responses.
Figure 6: Survey of sample that was prevented from looking for work due to COVID-19
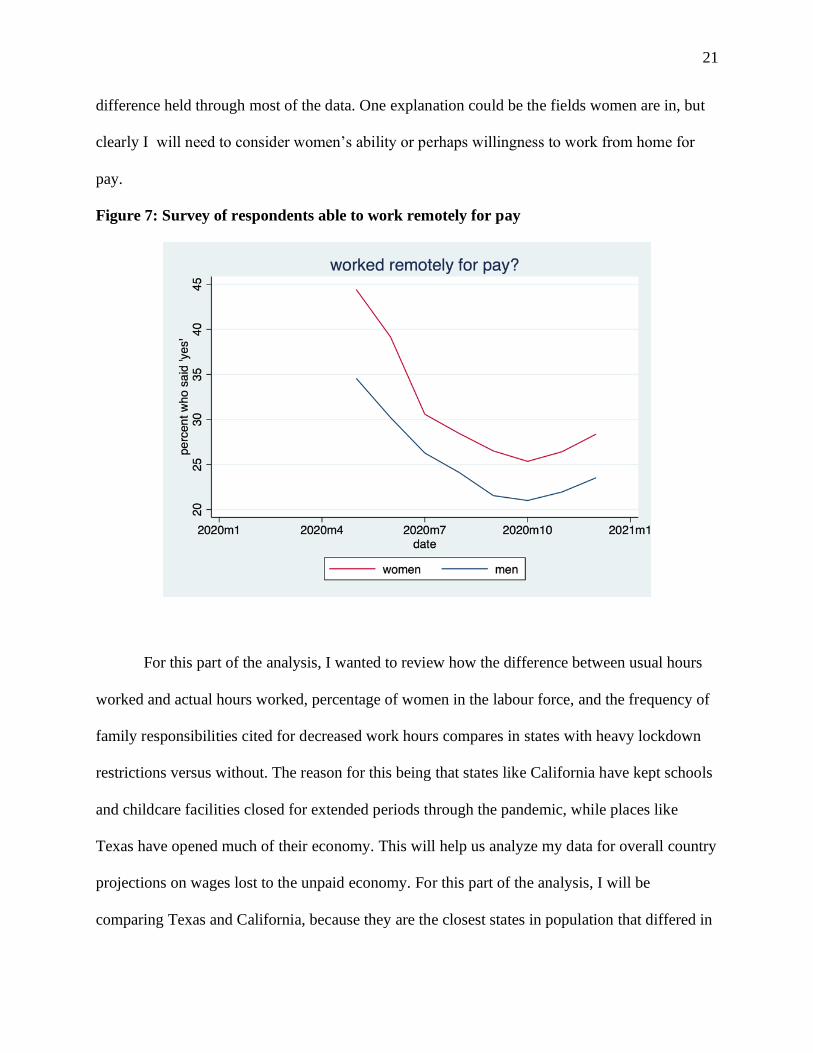
In Figure 7, the respondents were asked if they had been able to work remotely for pay in
the last month. In this question, there is a larger difference in the monthly average responses by
men and women, women had a mean 0.10 higher (towards a “yes” response) than men, this
21
difference held through most of the data. One explanation could be the fields women are in, but
clearly I will need to consider women’s ability or perhaps willingness to work from home for
pay.
Figure 7: Survey of respondents able to work remotely for pay
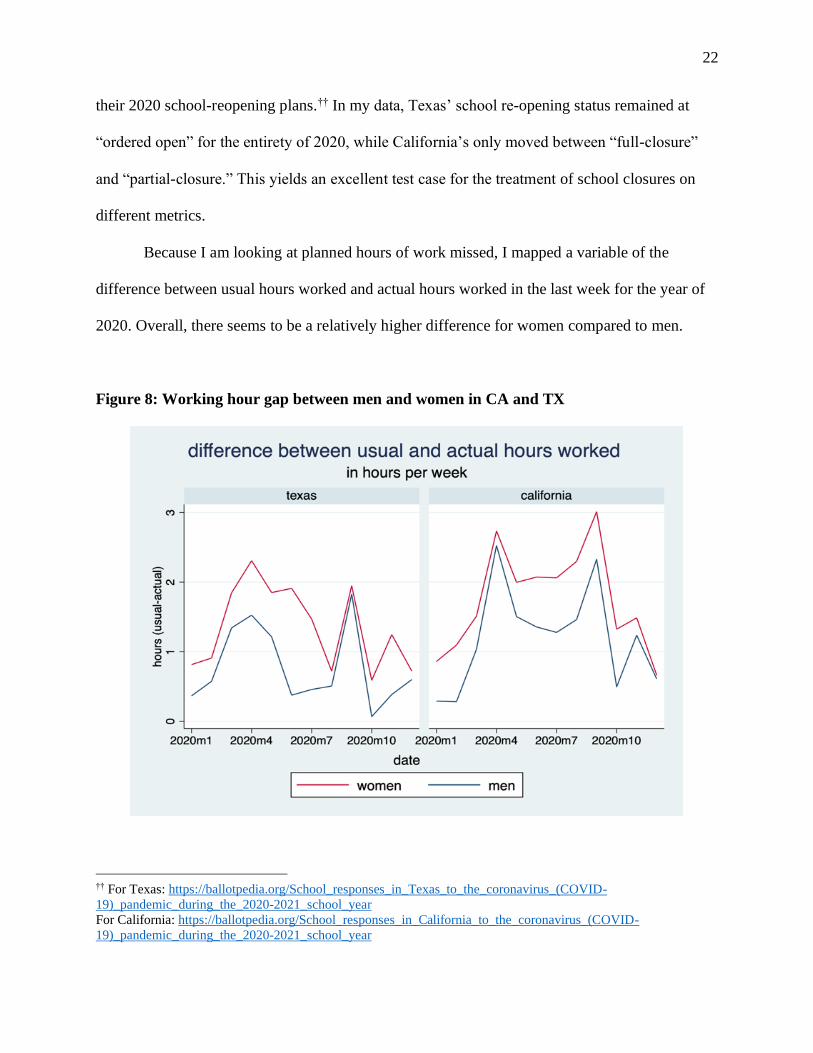
For this part of the analysis, I wanted to review how the difference between usual hours
worked and actual hours worked, percentage of women in the labour force, and the frequency of
family responsibilities cited for decreased work hours compares in states with heavy lockdown
restrictions versus without. The reason for this being that states like California have kept schools
and childcare facilities closed for extended periods through the pandemic, while places like
Texas have opened much of their economy. This will help us analyze my data for overall country
projections on wages lost to the unpaid economy. For this part of the analysis, I will be
comparing Texas and California, because they are the closest states in population that differed in
22
their 2020 school-reopening plans.†† In my data, Texas’ school re-opening status remained at
“ordered open” for the entirety of 2020, while California’s only moved between “full-closure”
and “partial-closure.” This yields an excellent test case for the treatment of school closures on
different metrics.
Because I am looking at planned hours of work missed, I mapped a variable of the
difference between usual hours worked and actual hours worked in the last week for the year of
2020. Overall, there seems to be a relatively higher difference for women compared to men.
Figure 8: Working hour gap between men and women in CA and TX
†† For Texas: https://ballotpedia.org/School_responses_in_Texas_to_the_coronavirus_(COVID-
19)_pandemic_during_the_2020-2021_school_year
For California: https://ballotpedia.org/School_responses_in_California_to_the_coronavirus_(COVID-
19)_pandemic_during_the_2020-2021_school_year
23
This difference is seen prominently in the early part of the pandemic in Texas but closes
significantly with the beginning of the traditional school year. Figure 8 is only measuring those
still in the labour force and employed, so it doesn’t account for all hours lost. In my analysis, I
will be focused on those with full-time work schedules. The two peaks in each graph correspond
directly with the initial shutdown of schools in March of 2020, and the start of the 2020-2021
school year (August-September of 2020). Despite starting at roughly the same level, the gap in
California remains higher than that of Texas, and the difference between men and women
appears more consistent throughout 2020. My prediction is that there are two factors at play in
each state during the September 2020 spike: increased parental involvement due to new
regulations on those going to in-person school and the impact of remote learning on parents’
childcare responsibilities. The latter being most notable in California, where schools remained
ordered closed throughout the state. This is only two states, but between these two I see a
variation in the data that indicates factoring COVID-related school restrictions in states will be
important in the analysis of labour patterns.
6.4 Creating COVID School Closure Variables
For school closures, I used data from Education Week. The group compiled information
on press releases and government websites to create an interactive map for parents and educators
on reopening restrictions in various states. The data was collected roughly every two weeks and
labels were not consistent throughout the dataset, so I had to pool some of the closure categories.
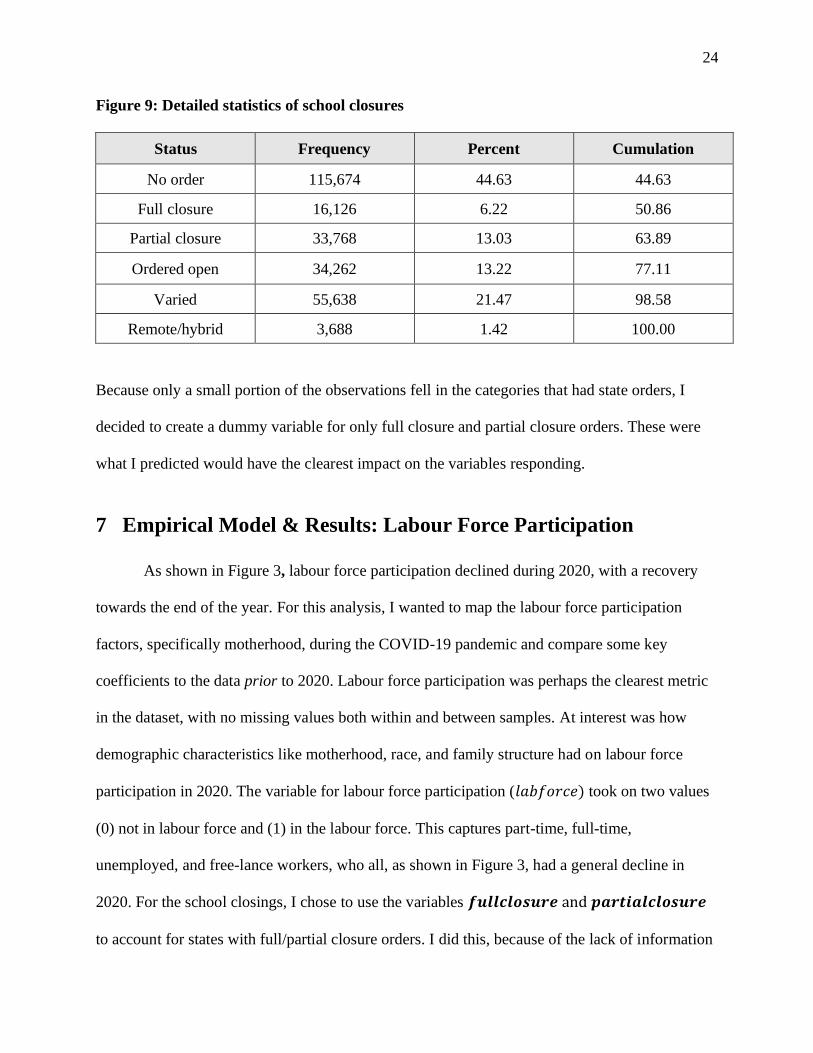
After cleaning the data, I was left with 6 categories for states’ school districts: no order (1), full
closure (2), partial closure (3), ordered open (4), varied (5), remote/hybrid (6). The statistical
summary of these categories in the data is seen in Figure 9.
24
Figure 9: Detailed statistics of school closures
Status Frequency Percent Cumulation
No order 115,674 44.63 44.63
Full closure 16,126 6.22 50.86
Partial closure 33,768 13.03 63.89
Ordered open 34,262 13.22 77.11
Varied 55,638 21.47 98.58
Remote/hybrid 3,688 1.42 100.00
Because only a small portion of the observations fell in the categories that had state orders, I
decided to create a dummy variable for only full closure and partial closure orders. These were
what I predicted would have the clearest impact on the variables responding.
7 Empirical Model & Results: Labour Force Participation
As shown in Figure 3, labour force participation declined during 2020, with a recovery
towards the end of the year. For this analysis, I wanted to map the labour force participation
factors, specifically motherhood, during the COVID-19 pandemic and compare some key
coefficients to the data prior to 2020. Labour force participation was perhaps the clearest metric
in the dataset, with no missing values both within and between samples. At interest was how
demographic characteristics like motherhood, race, and family structure had on labour force
participation in 2020. The variable for labour force participation (𝑙𝑎𝑏𝑓𝑜𝑟𝑐𝑒) took on two values
(0) not in labour force and (1) in the labour force. This captures part-time, full-time,
unemployed, and free-lance workers, who all, as shown in Figure 3, had a general decline in
2020. For the school closings, I chose to use the variables 𝒇𝒖𝒍𝒍𝒄𝒍𝒐𝒔𝒖𝒓𝒆 and 𝒑𝒂𝒓𝒕𝒊𝒂𝒍𝒄𝒍𝒐𝒔𝒖𝒓𝒆
to account for states with full/partial closure orders. I did this, because of the lack of information
25
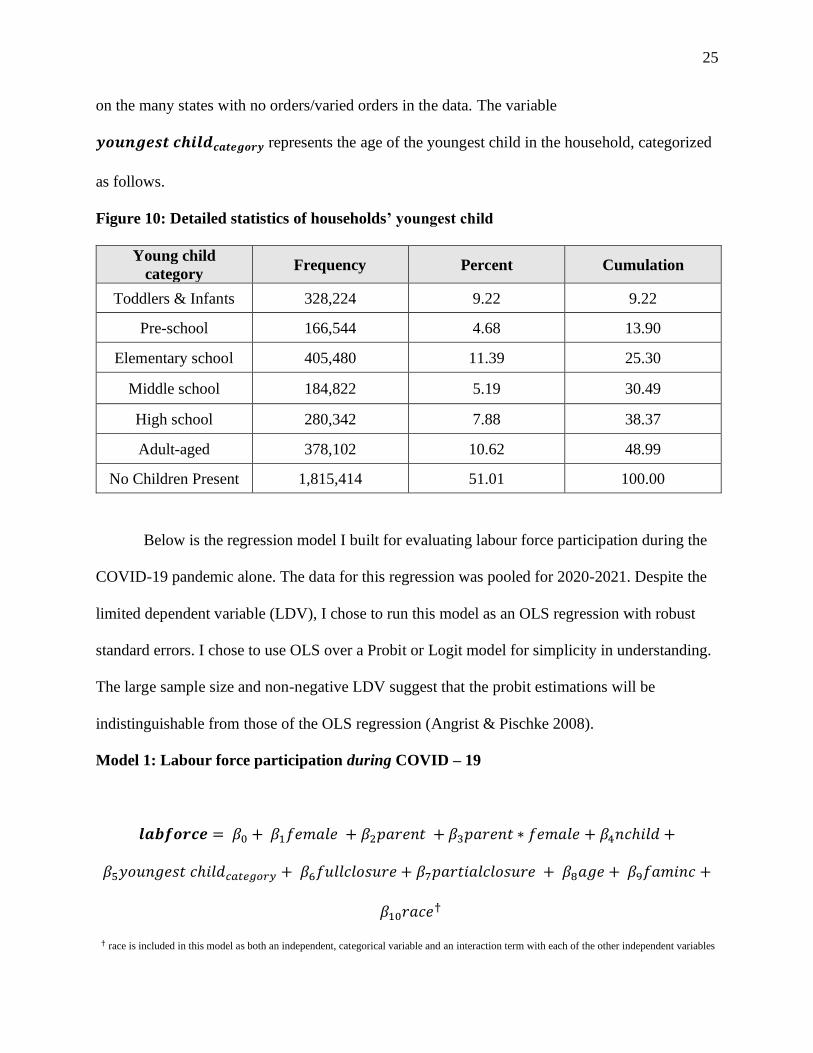
on the many states with no orders/varied orders in the data. The variable
𝒚𝒐𝒖𝒏𝒈𝒆𝒔𝒕 𝒄𝒉𝒊𝒍𝒅𝒄𝒂𝒕𝒆𝒈𝒐𝒓𝒚 represents the age of the youngest child in the household, categorized
as follows.
Figure 10: Detailed statistics of households’ youngest child
Young child
category Frequency Percent Cumulation
Toddlers & Infants 328,224 9.22 9.22
Pre-school 166,544 4.68 13.90
Elementary school 405,480 11.39 25.30
Middle school 184,822 5.19 30.49
High school 280,342 7.88 38.37
Adult-aged 378,102 10.62 48.99
No Children Present 1,815,414 51.01 100.00
Below is the regression model I built for evaluating labour force participation during the
COVID-19 pandemic alone. The data for this regression was pooled for 2020-2021. Despite the
limited dependent variable (LDV), I chose to run this model as an OLS regression with robust
standard errors. I chose to use OLS over a Probit or Logit model for simplicity in understanding.
The large sample size and non-negative LDV suggest that the probit estimations will be
indistinguishable from those of the OLS regression (Angrist & Pischke 2008).
Model 1: Labour force participation during COVID – 19
𝒍𝒂𝒃𝒇𝒐𝒓𝒄𝒆 = 𝛽0 + 𝛽1𝑓𝑒𝑚𝑎𝑙𝑒 + 𝛽2𝑝𝑎𝑟𝑒𝑛𝑡 + 𝛽3𝑝𝑎𝑟𝑒𝑛𝑡 ∗ 𝑓𝑒𝑚𝑎𝑙𝑒 + 𝛽4𝑛𝑐ℎ𝑖𝑙𝑑 +
𝛽5𝑦𝑜𝑢𝑛𝑔𝑒𝑠𝑡 𝑐ℎ𝑖𝑙𝑑𝑐𝑎𝑡𝑒𝑔𝑜𝑟𝑦 + 𝛽6𝑓𝑢𝑙𝑙𝑐𝑙𝑜𝑠𝑢𝑟𝑒 + 𝛽7𝑝𝑎𝑟𝑡𝑖𝑎𝑙𝑐𝑙𝑜𝑠𝑢𝑟𝑒 + 𝛽8𝑎𝑔𝑒 + 𝛽9𝑓𝑎𝑚𝑖𝑛𝑐 +
𝛽10𝑟𝑎𝑐𝑒†
† race is included in this model as both an independent, categorical variable and an interaction term with each of the other independent variables
26
I chose to run the regression with race as a dummy variable applied to each of the
individual independent variables. So, each independent variable had three interaction terms
applied for each racial category. This allowed me to see the difference between coefficients in
racial groups and the statistical significance of that difference from the base group (White non-
Hispanics).
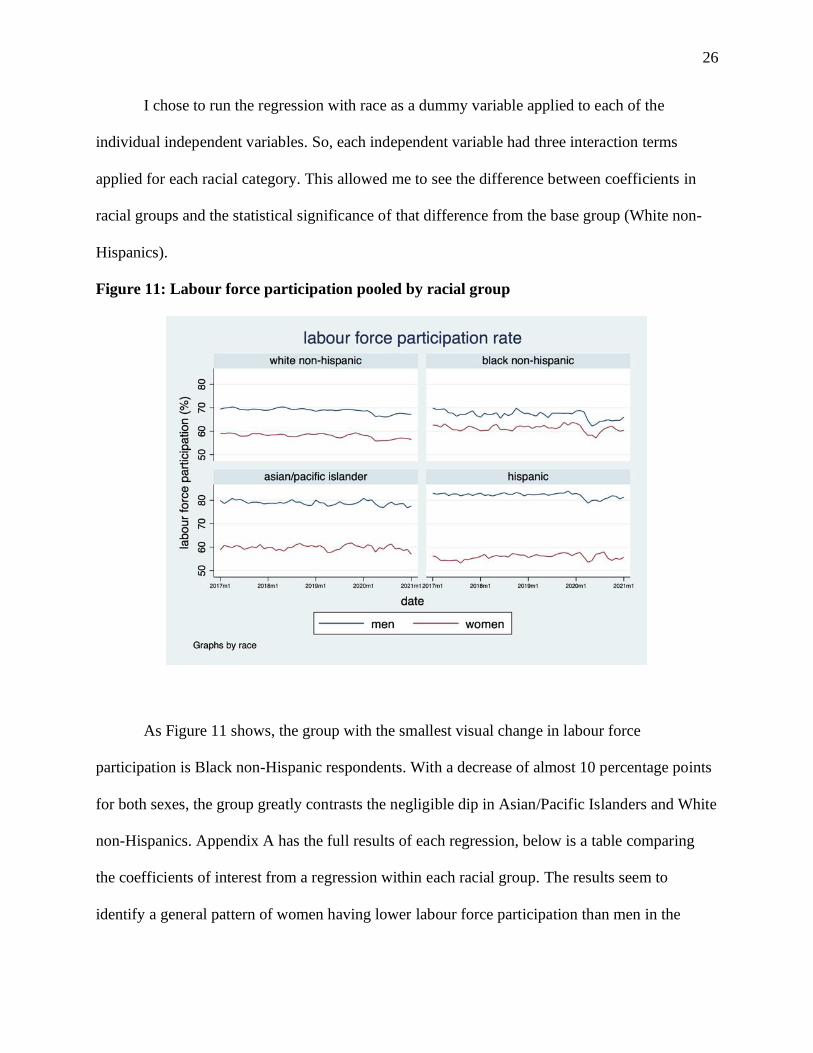
Figure 11: Labour force participation pooled by racial group
As Figure 11 shows, the group with the smallest visual change in labour force
participation is Black non-Hispanic respondents. With a decrease of almost 10 percentage points
for both sexes, the group greatly contrasts the negligible dip in Asian/Pacific Islanders and White
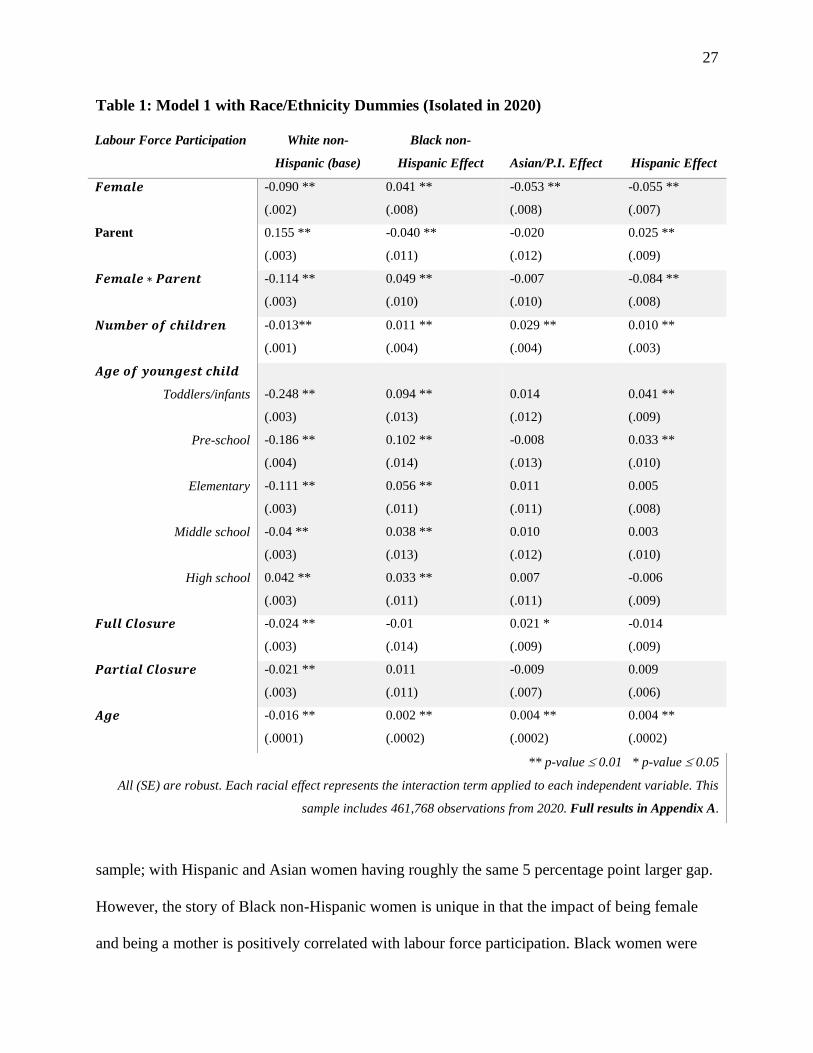
non-Hispanics. Appendix A has the full results of each regression, below is a table comparing
the coefficients of interest from a regression within each racial group. The results seem to
identify a general pattern of women having lower labour force participation than men in the
27
Table 1: Model 1 with Race/Ethnicity Dummies (Isolated in 2020)
Labour Force Participation White non-
Hispanic (base)
Black non-
Hispanic Effect Asian/P.I. Effect Hispanic Effect
𝑭𝒆𝒎𝒂𝒍𝒆 -0.090 **
(.002)
0.041 **
(.008)
-0.053 **
(.008)
-0.055 **
(.007)
Parent
0.155 **
(.003)
-0.040 **
(.011)
-0.020
(.012)
0.025 **
(.009)
𝑭𝒆𝒎𝒂𝒍𝒆 ∗ 𝑷𝒂𝒓𝒆𝒏𝒕
-0.114 **
(.003)
0.049 **
(.010)
-0.007
(.010)
-0.084 **
(.008)
𝑵𝒖𝒎𝒃𝒆𝒓 𝒐𝒇 𝒄𝒉𝒊𝒍𝒅𝒓𝒆𝒏 -0.013**
(.001)
0.011 **
(.004)
0.029 **
(.004)
0.010 **
(.003)
𝑨𝒈𝒆 𝒐𝒇 𝒚𝒐𝒖𝒏𝒈𝒆𝒔𝒕 𝒄𝒉𝒊𝒍𝒅
Toddlers/infants
Pre-school
Elementary
Middle school
High school
-0.248 **
(.003)
-0.186 **
(.004)
-0.111 **
(.003)
-0.04 **
(.003)
0.042 **
(.003)
0.094 **
(.013)
0.102 **
(.014)
0.056 **
(.011)
0.038 **
(.013)
0.033 **
(.011)
0.014
(.012)
-0.008
(.013)
0.011
(.011)
0.010
(.012)
0.007
(.011)
0.041 **
(.009)
0.033 **
(.010)
0.005
(.008)
0.003
(.010)
-0.006
(.009)
𝑭𝒖𝒍𝒍 𝑪𝒍𝒐𝒔𝒖𝒓𝒆 -0.024 **
(.003)
-0.01
(.014)
0.021 *
(.009)
-0.014
(.009)
𝑷𝒂𝒓𝒕𝒊𝒂𝒍 𝑪𝒍𝒐𝒔𝒖𝒓𝒆 -0.021 **
(.003)
0.011
(.011)
-0.009
(.007)
0.009
(.006)
𝑨𝒈𝒆 -0.016 **
(.0001)
0.002 **
(.0002)
0.004 **
(.0002)
0.004 **
(.0002)
** p-value 0.01 * p-value 0.05
All (SE) are robust. Each racial effect represents the interaction term applied to each independent variable. This
sample includes 461,768 observations from 2020. Full results in Appendix A.
sample; with Hispanic and Asian women having roughly the same 5 percentage point larger gap.
However, the story of Black non-Hispanic women is unique in that the impact of being female
and being a mother is positively correlated with labour force participation. Black women were
28
the only group in which being a mother had a statistically significant, positive effect on labour
force participation probability. This finding is consistent with Sayer & Fine’s (2011) findings
that Black married couples have the smallest gender differences in housework because of the
historically high employment rates for Black women. As mentioned previously, this is a sample
of married couples with present spouses, so this effect indicates a prevalence of Black working
mothers during 2020 rather than single mothers. Interestingly, being a parent alone seemed to
decrease the probability of labour force participation in Black non-Hispanics and Asian/P.I.
respondents (though the ladder is not statistically significant). This is interesting and could be
indicative of a lack of access to childcare, either due to fiscal or societal conditions for Black and
Asian parents. The story of Hispanic women is very different. Unlike with white mothers, the
negative interaction of being female and a parent alone outweighs the positive impact of being a
parent generally on labour force participation in Hispanic women. This appears to be explained
by the notably large gap between male and female labour force participation in the Hispanic
group and could suggest a general social norm of single-earner households in heterosexual
Hispanic couples (Sayer & Fine 2011) (Lam et al. 2012).
While parenthood generally had a large impact on labour force participation, the age of
the youngest child indicated how racialized the impact of parenthood is. White parents were the
only group with statistically significant, negative impacts of having a child aged below middle
school in the household. Having a toddler/infant as the household’s youngest child decreases
labour force participation probability by almost 25 percentage points. This is likely because the
labour force participation of mothers is already low, so they are pulling down the average
negative impact. While the negative impact of the youngest child being in pre-school (an age
where public childcare becomes more available) is lower in magnitude than that of
29
toddlers/infants, it is still almost double the negative impact of the youngest child being in
elementary school. While for both white and Black respondents, the negative effect on labour
force participation is negatively correlated with the age of the youngest child, the sign of each
coefficient are opposites. Having a youngest child that is in pre-school, for Black parents,
increases the labour force participation relative to white parents by nearly double that of having a
youngest child that is in elementary school. This inverted effect between white and Black parents
is consistent with the coefficient value for both parents, mothers, and women generally.
There appears to be no significant difference in the magnitude of the effect for partial and
full closures of school, however, full closures seemed to have a lower impact on Asian couples
overall; there was no indication that the percentage of Asian couples that are parents is
inconsistent with other racial groups or the general population. Overall, as one would expect, any
closing order (partial or full) for schools negatively impacts the labour force participation of an
individual.
7.1 Comparing Labour Force Participation Before/During COVID
For ease of understanding, the same model above was applied to the respondents from
January 2015 – December 2019 (inclusive). Variables dropped are 𝜷𝟔 𝒂𝒏𝒅 𝜷𝟕 as they do not
apply to the population before COVID school closures. There were not enough observations in
this selected sample to run this regression on each racial group individually, so they were all
pooled for this part of the analysis. The rest of the independent variables were used to generate
an interaction term for observations recorded after March of 2020. For reasons identical to those
in Section 7, I chose to run an OLS regression instead of a probit regression. For detailed results,
see Appendix B.
30
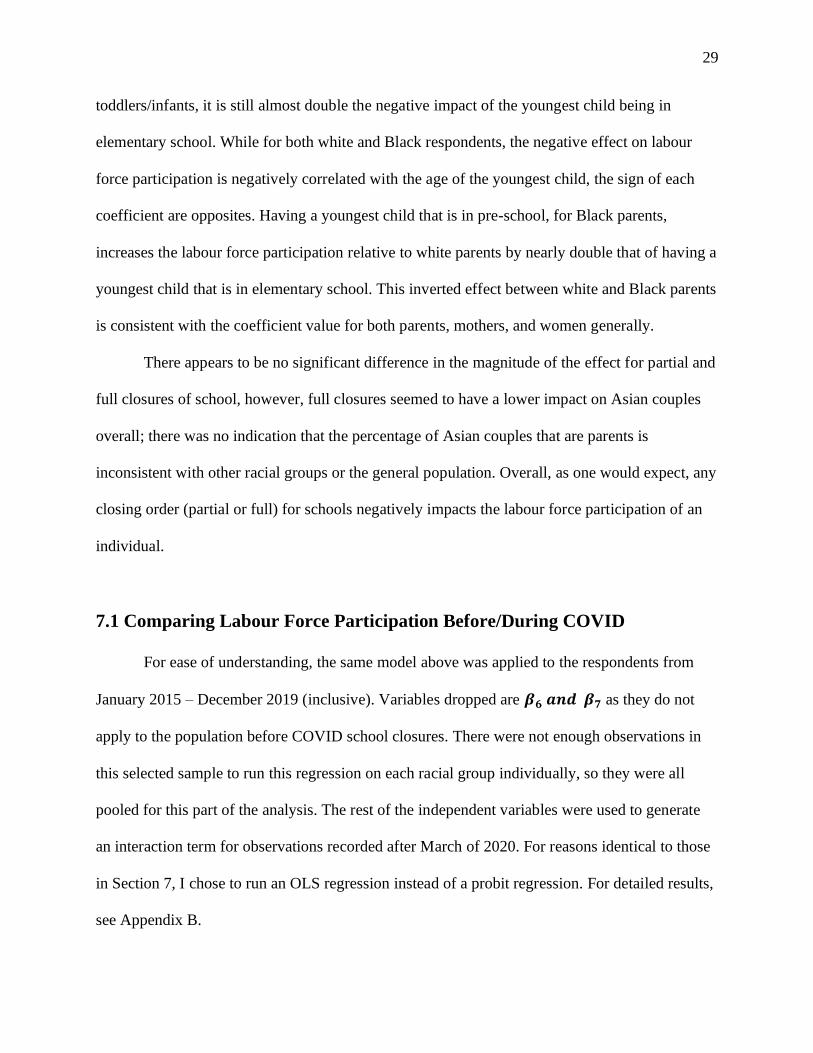
Model 2: Labour Force Participation 2015-2021 (COVID as an Interaction)
𝒍𝒂𝒃𝒇𝒐𝒓𝒄𝒆 = 𝛽0 + 𝛽1𝑓𝑒𝑚𝑎𝑙𝑒 + 𝛽2𝑝𝑎𝑟𝑒𝑛𝑡 + 𝛽3𝑝𝑎𝑟𝑒𝑛𝑡 ∗ 𝑓𝑒𝑚𝑎𝑙𝑒 + 𝛽4𝑛𝑐ℎ𝑖𝑙𝑑
+ 𝛽6𝑦𝑜𝑢𝑛𝑔𝑒𝑠𝑡 𝑐ℎ𝑖𝑙𝑑𝑐𝑎𝑡𝑒𝑔𝑜𝑟𝑦 + 𝛽8𝑓𝑎𝑚𝑖𝑛𝑐 + 𝛽9𝑎𝑔𝑒 + 𝛽10𝑟𝑎𝑐𝑒
+ 𝛽11𝑓𝑒𝑚𝑎𝑙𝑒𝑐𝑜𝑣𝑖𝑑 + 𝛽12𝑝𝑎𝑟𝑒𝑛𝑡𝑐𝑜𝑣𝑖𝑑 + 𝛽13𝑝𝑎𝑟𝑒𝑛𝑡 ∗ 𝑓𝑒𝑚𝑎𝑙𝑒𝑐𝑜𝑣𝑖𝑑
+ 𝛽14𝑛𝑐ℎ𝑖𝑙𝑑𝑐𝑜𝑣𝑖𝑑 + 𝛽15𝑦𝑜𝑢𝑛𝑔𝑒𝑠𝑡 𝑐ℎ𝑖𝑙𝑑𝑐𝑎𝑡𝑒𝑔𝑜𝑟𝑦𝑐𝑜𝑣𝑖𝑑+ 𝛽16𝑓𝑎𝑚𝑖𝑛𝑐𝑐𝑜𝑣𝑖𝑑
+ 𝛽17𝑎𝑔𝑒𝑐𝑜𝑣𝑖𝑑 + 𝛽18𝑟𝑎𝑐𝑒𝑐𝑜𝑣𝑖𝑑
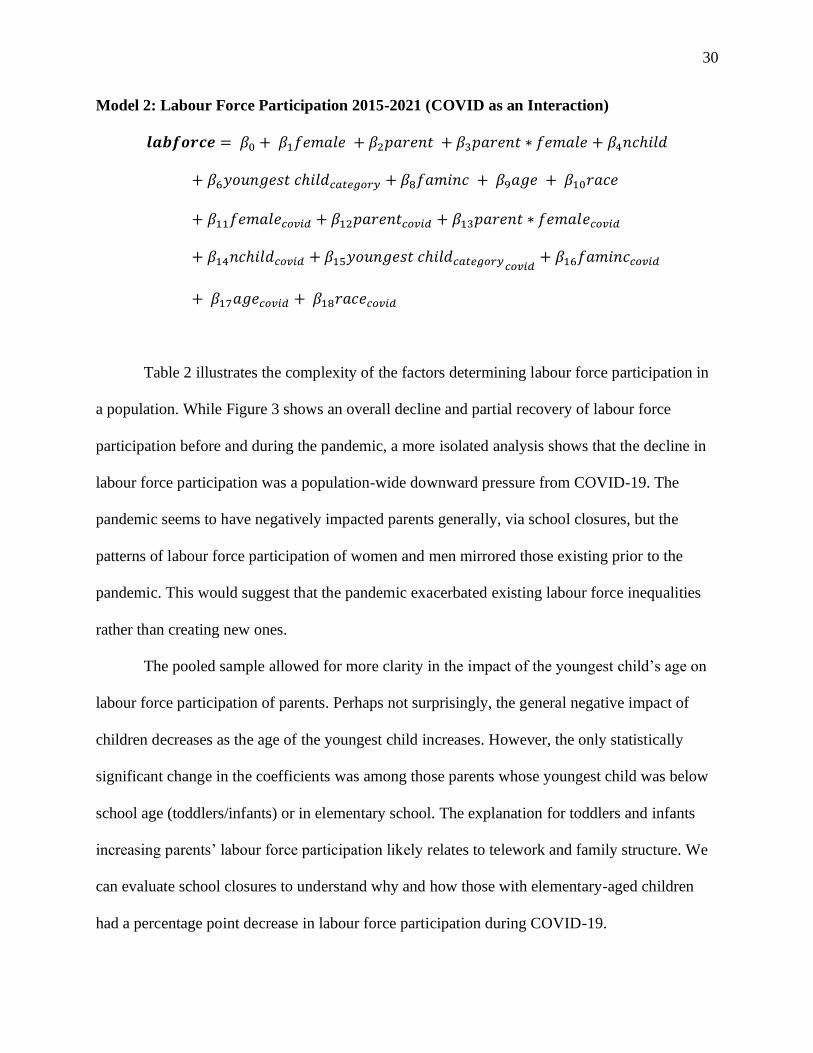
Table 2 illustrates the complexity of the factors determining labour force participation in
a population. While Figure 3 shows an overall decline and partial recovery of labour force
participation before and during the pandemic, a more isolated analysis shows that the decline in
labour force participation was a population-wide downward pressure from COVID-19. The
pandemic seems to have negatively impacted parents generally, via school closures, but the
patterns of labour force participation of women and men mirrored those existing prior to the
pandemic. This would suggest that the pandemic exacerbated existing labour force inequalities
rather than creating new ones.
The pooled sample allowed for more clarity in the impact of the youngest child’s age on
labour force participation of parents. Perhaps not surprisingly, the general negative impact of
children decreases as the age of the youngest child increases. However, the only statistically
significant change in the coefficients was among those parents whose youngest child was below
school age (toddlers/infants) or in elementary school. The explanation for toddlers and infants
increasing parents’ labour force participation likely relates to telework and family structure. We
can evaluate school closures to understand why and how those with elementary-aged children
had a percentage point decrease in labour force participation during COVID-19.
31
Table 2: The effects of COVID-19 on existing determinant of labour force participation
Labour force participation Base COVID effect
𝑭𝒆𝒎𝒂𝒍𝒆 -0.096 **
(.001)
0.0023
(.002)
𝑷𝒂𝒓𝒆𝒏𝒕 0.201 **
(.001)
0.006
(.004)
𝑭𝒆𝒎𝒂𝒍𝒆 ∗ 𝑷𝒂𝒓𝒆𝒏𝒕
-0.140 **
(.00111)
0.008 **
(.003)
𝑨𝒈𝒆 𝒐𝒇 𝒚𝒐𝒖𝒏𝒈𝒆𝒔𝒕 𝑪𝒉𝒊𝒍𝒅
Toddlers/infants
Pre-school
Elementary
Middle school
High school
-0.246 **
(.001)
-0.186 **
(001)
-0.106 **
(.001)
-0.040 **
(.001)
-0.038 **
(.001)
0.040 **
(.004)
-0.001
(.003)
-0.01 **
(.003)
-0.003
(.003)
-0.006
(.003)
𝑭𝒖𝒍𝒍 𝑪𝒍𝒐𝒔𝒖𝒓𝒆
-0.023 **
(.003)
𝑷𝒂𝒓𝒕𝒊𝒂𝒍 𝑪𝒍𝒐𝒔𝒖𝒓𝒆
-0.019 **
(.002)
𝑹𝒂𝒄𝒆
Black non-Hispanic
Asian/Pacific Islander
Hispanic
0.020 **
(.001)
-0.030 **
(001)
0.001
(.001)
-0.023
(.003)
0.007 *
(.003)
0.001
(.002)
** p-value 0.01 * p-value 0.05. All (SE) are robust.
The COVID effect is an interaction term applied to each independent variable. This sample includes 3,504,128
observations. Full results in Appendix B.
32
Table 2 exhibits more clearly the difference between states with partial and full closures
of schools. The impacts of both full and partial closures are statistically significant, and full
closures decreased the probability of labour force participation by 0.4 percentage points more
than partial school closures (from a 1.9 to a 2.3 percentage point decrease). The impact of school
closures could have largely captured the negative impacts on parents of children of all ages, and
it provides some explanatory background on why elementary-aged children (who require more
care when out of school) had the only significant negative impact of school-aged children on
their parents’ labour force participation. Given the long-term nature of labour force participation
decisions, the impact of school closures on the decisions of parents to re-enter or leave the
workforce will continue to be an interesting area for future research.
8 Empirical Model & Results: Missed Work Hours & School
Closures
As seen in the analysis previously, it appears as though COVID’s effect on labour force
participation was largely on parents generally, given the significant negative impacts of
full/partial closures of school districts. IPUMS-CPS data includes a question on the respondent’s
work status with options for what hours they are currently working and if it is consistent with
their usual work schedules. For example, there is an option for “Full-time hours, usually part-
time” and “Not at work, usually full time.” These were combined to identify those who usually
work full time (whether they reported those hours or not). The actual hours worked
(𝑎ℎ𝑟𝑠𝑤𝑜𝑟𝑘𝑒𝑑) for those respondents were put over 40 hours (the usual “full-time” schedule).
The only respondents considered in this sub-sample were those that identified as being in the
33
labour force. The percentage of full-time hours the respondent reported working (𝑓𝑟𝑎𝑐𝑓𝑢𝑙𝑙𝑡𝑖𝑚𝑒)
the prior week is calculated as:
𝑓𝑟𝑎𝑐𝑓𝑢𝑙𝑙𝑡𝑖𝑚𝑒 = (𝑎ℎ𝑟𝑠𝑤𝑜𝑟𝑘𝑒𝑑
40) ∗ 100
For this analysis, I looked exclusively at this metric during the COVID pandemic (March
2020 – January 2021). Once again, my primary variable of interest is the sex of the respondent,
but an additional variable of interest was the interaction between condensed school reopening
status and the respondent’s answer to the question “have you worked remotely for pay in the last
month?” (𝑡𝑒𝑙𝑒𝑤). While also controlling for age, family income, number of children, and the age
of the youngest child for each race (White non-Hispanic, Black non-Hispanic, Asian/Pacific
Islander, Hispanic). The model for this group exclusively included those in the labour force at
the time, and those who reported usually working full time. The significance of this analysis is to
model how many hours are lost from respondents’ normal full-time schedules during the
pandemic. In this model, I have removed the interaction between the age category of the
youngest child and the school-closure variables. This is because a parent working full-time has
already made the decision of being in the labour force (impacted by family structure among other
things), so the school-closures will have an effect regardless of the child’s age. The interaction is
hence non-relevant in this analysis, there were too many missing entries for telew (roughly
61.38% of the total entries for 2020 were missing responses) to obtain a large enough sample
size to run regressions for each racial/ethnic group. So, I ran one regression over the entire
sample. Find the full results in Appendix C. Note: this regression was done on parents alone.
34
Model 3: Percentage of Full-time Schedule Worked during COVID – 19
𝒇𝒓𝒂𝒄𝒇𝒖𝒍𝒍𝒕𝒊𝒎𝒆 = 𝛽0 + 𝛽1𝑚𝑜𝑡ℎ𝑒𝑟 + 𝛽2𝑚𝑜𝑡ℎ𝑒𝑟 ∗ 𝑡𝑒𝑙𝑒𝑤𝑜𝑟𝑘 + 𝛽3𝑡𝑒𝑙𝑒𝑤𝑜𝑟𝑘 +
𝛽4𝑡𝑦𝑜𝑢𝑛𝑔𝑒𝑠𝑡 𝑐ℎ𝑖𝑙𝑑𝑐𝑎𝑡𝑒𝑔𝑜𝑟𝑦 + 𝛽5𝑓𝑢𝑙𝑙𝑐𝑙𝑜𝑠𝑢𝑟𝑒 + 𝛽6𝑝𝑎𝑟𝑡𝑖𝑎𝑙𝑐𝑙𝑜𝑠𝑢𝑟𝑒 + 𝛽7𝑛𝑐ℎ𝑖𝑙𝑑 +
𝛽8𝑓𝑎𝑚𝑖𝑛𝑐 + 𝛽9𝑎𝑔𝑒 + 𝛽10𝑟𝑎𝑐𝑒
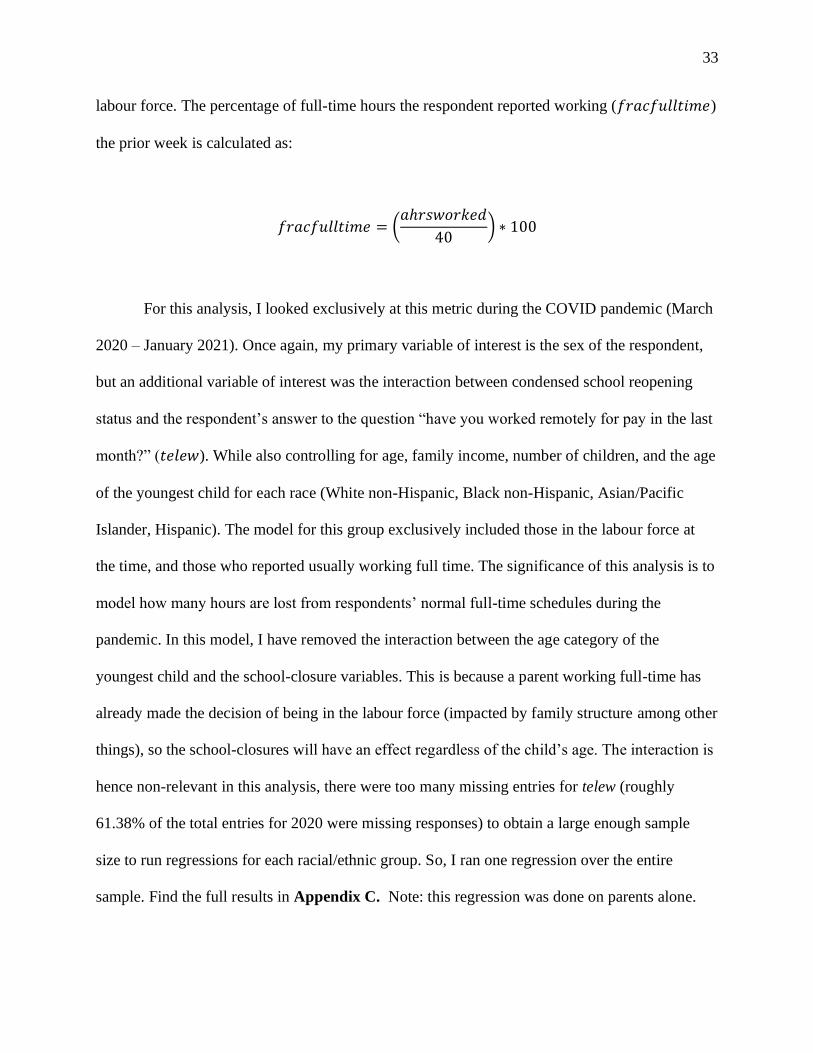
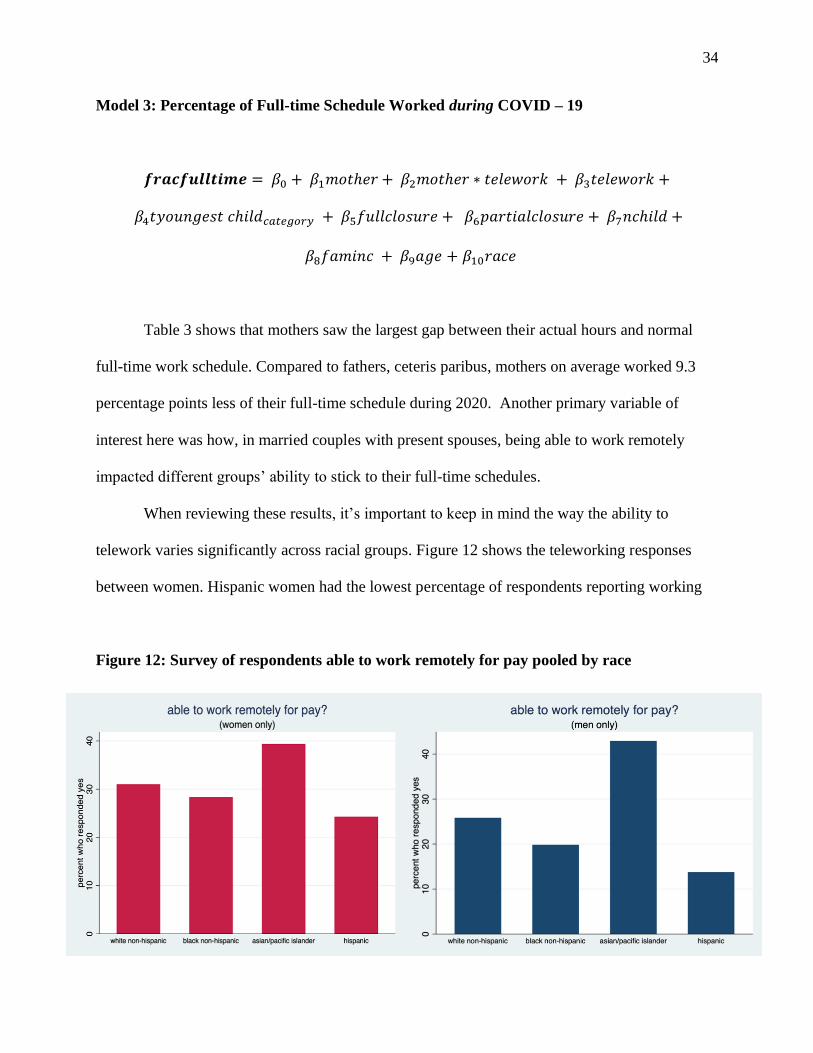
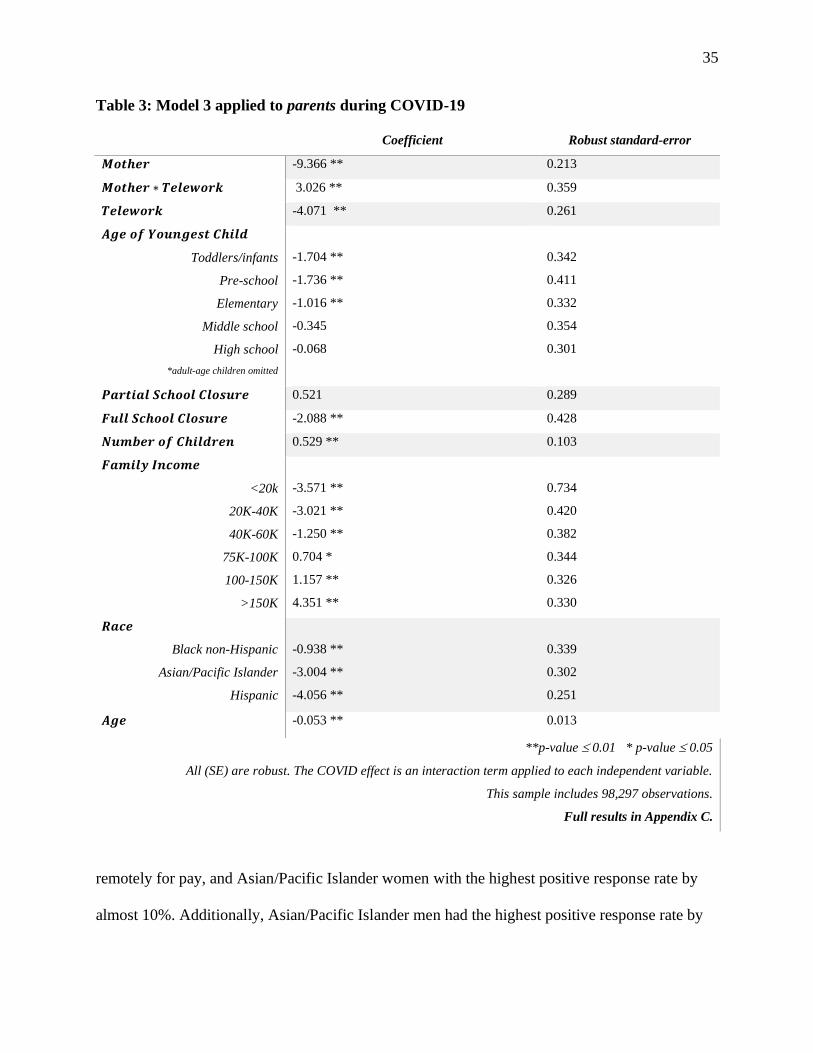
Table 3 shows that mothers saw the largest gap between their actual hours and normal
full-time work schedule. Compared to fathers, ceteris paribus, mothers on average worked 9.3
percentage points less of their full-time schedule during 2020. Another primary variable of
interest here was how, in married couples with present spouses, being able to work remotely
impacted different groups’ ability to stick to their full-time schedules.
When reviewing these results, it’s important to keep in mind the way the ability to
telework varies significantly across racial groups. Figure 12 shows the teleworking responses
between women. Hispanic women had the lowest percentage of respondents reporting working
Figure 12: Survey of respondents able to work remotely for pay pooled by race
35
Table 3: Model 3 applied to parents during COVID-19
Coefficient Robust standard-error
𝑴𝒐𝒕𝒉𝒆𝒓 -9.366 ** 0.213
𝑴𝒐𝒕𝒉𝒆𝒓 ∗ 𝑻𝒆𝒍𝒆𝒘𝒐𝒓𝒌 3.026 ** 0.359
𝑻𝒆𝒍𝒆𝒘𝒐𝒓𝒌 -4.071 ** 0.261
𝑨𝒈𝒆 𝒐𝒇 𝒀𝒐𝒖𝒏𝒈𝒆𝒔𝒕 𝑪𝒉𝒊𝒍𝒅
Toddlers/infants
Pre-school
Elementary
Middle school
High school
*adult-age children omitted
-1.704 **
-1.736 **
-1.016 **
-0.345
-0.068
0.342
0.411
0.332
0.354
0.301
𝑷𝒂𝒓𝒕𝒊𝒂𝒍 𝑺𝒄𝒉𝒐𝒐𝒍 𝑪𝒍𝒐𝒔𝒖𝒓𝒆 0.521 0.289
𝑭𝒖𝒍𝒍 𝑺𝒄𝒉𝒐𝒐𝒍 𝑪𝒍𝒐𝒔𝒖𝒓𝒆 -2.088 ** 0.428
𝑵𝒖𝒎𝒃𝒆𝒓 𝒐𝒇 𝑪𝒉𝒊𝒍𝒅𝒓𝒆𝒏 0.529 ** 0.103
𝑭𝒂𝒎𝒊𝒍𝒚 𝑰𝒏𝒄𝒐𝒎𝒆
<20k
20K-40K
40K-60K
75K-100K
100-150K
>150K
-3.571 **
-3.021 **
-1.250 **
0.704 *
1.157 **
4.351 **
0.734
0.420
0.382
0.344
0.326
0.330
𝑹𝒂𝒄𝒆
Black non-Hispanic
Asian/Pacific Islander
Hispanic
-0.938 **
-3.004 **
-4.056 **
0.339
0.302
0.251
𝑨𝒈𝒆 -0.053 ** 0.013
**p-value 0.01 * p-value 0.05
All (SE) are robust. The COVID effect is an interaction term applied to each independent variable.
This sample includes 98,297 observations.
Full results in Appendix C.
remotely for pay, and Asian/Pacific Islander women with the highest positive response rate by
almost 10%. Additionally, Asian/Pacific Islander men had the highest positive response rate by
36
almost 20%. The vast difference in the ability to work remotely suggests strong variation in the
nature of work done by each group, this creates an interesting challenge for evaluating how
discrimination or underrepresentation in different fields could have impacted how each racial
group experienced the recession financially. This evaluation would be a rewarding topic for
future research.
Mothers had a larger gap between usual versus actual hours worked, compared to fathers.
This is consistent with other recent work on this subject (Collins et al. 2021). That gap increased
for both mothers and fathers who could telework. This would make sense, considering working
from home provides greater opportunities for interruption by children or other household
activities. However, mothers who could telework were able to work a larger percentage of their
usual full-time schedule compared to their male counterparts. The net effect of telework,
regardless, for both mothers and fathers was a decrease in the percentage of full-time schedule
they actually worked. This could be an indication that women benefitted more from the increased
availability of teleworking at large companies compared to men.
Looking at school closures’ impact on parents, a full school closure appeared to be the
only significant school order on parent’s working schedules. For parents living in states with full
school closures, they worked roughly 2 percent less of their full schedule in comparison to those
in states without such strict orders. This is consistent with the findings in Figure 8. Additionally,
those whose youngest child is young (toddlers/infants, pre-school, and elementary-aged) worked
a 1-2 percent lower fraction of their full-time schedules, when compared to parents of adult
children. Considering the negative impact of teleworking, this impact is largely representative of
those who took full leave from work and those who were less efficient working from home with
children.
37
One consideration in reviewing the working patterns of parents during COVID-19 should
be family income as those with higher income levels will likely have more access to paid
childcare or be in a household where one partner can afford to stay home. Those below the
median U.S income (60K and under), had a negative hit to the fraction of full-time work they
completed. Those in higher-income categories were able to work more of their full-time
schedules compared to those in average income earners. This would suggest less flexibility in
work schedules for those in lower-income groups than higher, and, potentially, a
disproportionate negative impact of loss of childcare access on those with below-average family
income.
Once again, race played a key role in determining the impact of the independent
variables. Black parents saw a small, but statistically significant, decrease in their actual working
hours compared to white parents. Both Hispanic and Asian parents had a 3-4 percentage point
larger negative gap than white parents. One possible explanation for this could be found in the
information from Figure 12; since Asian/P.I. men and women saw a larger ability to work from
home compared to other racial categories, those couples may have had more flexible work hours
from compassionate employers or just the tendency for both parents to face distraction from
children. Conversely to Asian/P.I. couples, Hispanic men and women reported the lowest ability
to work remotely for pay and yet saw the same (but slightly larger) negative impact on their
ability to fulfill their normal work schedules. One explanation could be that the nature of the
work these parents do, being in-person, presented these parents the option to either go to work or
care for their children. Given this, many Hispanic parents may have had to sacrifice more of their
normal work schedules or face termination as a result of economic shutdowns.
38
9 Conclusions
Overall, my findings are consistent with existing literature that women, especially
mothers, have been disproportionately impacted by the COVID-19 pandemic. The mechanisms
of this disproportionality, however, seem to be rooted in existing labour force inequities. This is
exemplified in the comparison between Model 1 and Model 2, where the negative impacts of
being a woman on labour force participation are roughly consistent before and after the
pandemic. Model 2 does capture the burden of parenthood by introducing the variables of school
closure status in respondents’ states. Factoring in the existing literature on the time use of
working mothers, as well as the pre-pandemic, negative effect of being a woman on labour force
participation, these two models exhibit the mechanisms by which women were
disproportionately impacted by the 2020 recession. Additionally, an intersectional approach
indicates that the impacts of the recession have fallen along racial lines in both labour force
participation and productivity. My analysis suggests that school closure orders have had
temporary negative impacts on the productivity of mothers during COVID-19. Perhaps more
permanently, full and partial school closures have been associated with lower labour force
participation rates for parents overall. Additionally, despite the assumption that remote work
would provide parents with the ability to handle both childcare demands and working, there was
a correlation between parents who could work remotely and those unable to meet their planned
full-time schedule. Despite this, mothers actually benefitted from telework, as they saw a greater
ability to balance their full-time work schedule compared to fathers. A study into the time-use of
American families during this time could provide explanatory insight into the ability for women
to meet their normal work hours under greater childcare responsibilities.
39
The true impacts of this recession and pandemic will likely not be fully understood for
decades to come. It should be noted that the lives saved by these disease-mitigating policies are
priceless. However, it is important to introduce the concept of nuance to this public debate by
recognizing how the shutdowns have exacerbated existing inequalities in the labour force. We
can mitigate some of the damage, and prevent falling further behind in gender equality progress,
by ensuring women and mothers are at the center of the United States’ economic recovery.
40
References
Aizer, A. (2010). The Gender Wage Gap and Domestic Violence. American Economic Review,
100(4), 1847–1859. https://doi.org/10.1257/aer.100.4.1847
Albanesi, S. (2019). Changing Business Cycles: The Role of Women’s Employment (No.
w25655; p. w25655). National Bureau of Economic Research.
https://doi.org/10.3386/w25655
Alon, T., Doepke, M., Olmstead-Rumsey, J., & Tertilt, M. (2020a). The Impact of COVID-19 on
Gender Equality (No. w26947; p. w26947). National Bureau of Economic Research.
https://doi.org/10.3386/w26947
Alon, T., Doepke, M., Olmstead-Rumsey, J., & Tertilt, M. (2020b). This Time It’s Different: The
Role of Women’s Employment in a Pandemic Recession (No. w27660; p. w27660).
National Bureau of Economic Research. https://doi.org/10.3386/w27660
Alon, T., Doepke, M., Olmstead-Rumsey, J., & Tertilt, M. (2020c). This Time It’s Different: The
Role of Women’s Employment in a Pandemic Recession (No. w27660). National Bureau
of Economic Research. https://doi.org/10.3386/w27660
Angrist, J.D., & Pischke, J. (2008). Mostly Harmless Econometrics: An Empiricist's Companion
(pp. 94-107). Princeton: Princeton University Press.
Appelbaum, E., Boushey, H., & Schmitt, J. (2014). The Economic Importance of Women’s
Rising Hours of Work. 34.
Bailey, M. J. (2005). More Power to the Pill: The Impact of Contraceptive Freedom on Women’s
Labor-Force Participation (SSRN Scholarly Paper ID 652521). Social Science Research
Network. https://doi.org/10.2139/ssrn.652521
41
Bertrand, M., Pan, J., & Kamenica, E. (2013). Gender Identity and Relative Income within
Households (No. w19023). National Bureau of Economic Research.
https://doi.org/10.3386/w19023
Bittman, M., England, P., Sayer, L., Folbre, N., & Matheson, G. (2003a). When Does Gender
Trump Money? Bargaining and Time in Household Work. American Journal of
Sociology, 109(1), 186–214. https://doi.org/10.1086/378341
Bittman, M., England, P., Sayer, L., Folbre, N., & Matheson, G. (2003b). When Does Gender
Trump Money? Bargaining and Time in Household Work. American Journal of
Sociology, 109(1), 186–214. https://doi.org/10.1086/378341
Blau, F. D., & Kahn, L. M. (2013). Female Labor Supply: Why Is the United States Falling
Behind? American Economic Review, 103(3), 251–256.
https://doi.org/10.1257/aer.103.3.251
Blau, F. D., & Kahn, L. M. (2017). The Gender Wage Gap: Extent, Trends, and Explanations.
Journal of Economic Literature, 55(3), 789–865. https://doi.org/10.1257/jel.20160995
Bolotnyy, V., & Emanuel, N. (2018). Why Do Women Earn Less Than Men? Evidence from Bus
and Train Operators. 86.
Budig, M. J., & England, P. (2001). The Wage Penalty for Motherhood. American Sociological
Review, 66(2), 204–225. https://doi.org/10.2307/2657415
Budig, M. J., & Hodges, M. J. (2010). Differences in Disadvantage: Variation in the Motherhood
Penalty across White Women’s Earnings Distribution. American Sociological Review,
75(5), 705–728. https://doi.org/10.1177/0003122410381593
42
Buehler, C., & O’Brien, M. (2011). Mothers’ part-time employment: Associations with mother
and family well-being. Journal of Family Psychology, 25(6), 895–906.
https://doi.org/10.1037/a0025993
Bui, T. T. M., Button, P., & Picciotti, E. G. (2020). Early Evidence on the Impact of Coronavirus
Disease 2019 (COVID-19) and the Recession on Older Workers. Public Policy & Aging
Report, 30(4), 154–159. https://doi.org/10.1093/ppar/praa029
Carlson, M. W., & Hans, J. D. (2020). Maximizing benefits and minimizing impacts: Dual-
earner couples’ perceived division of household labor decision-making process. Journal
of Family Studies, 26(2), 208–225. https://doi.org/10.1080/13229400.2017.1367712
Castilla, E. J. (n.d.). Gender, Race, and Meritocracy in Organizational Careers. American
Journal of Sociology, 48.
Child penalties across countries .pdf. (n.d.).
Chodorow-Reich, G., & Coglianese, J. (2020). Projecting Unemployment Durations: A Factor-
Flows Simulation Approach With Application to the COVID-19 Recession (No. w27566).
National Bureau of Economic Research. https://doi.org/10.3386/w27566
Cimpian, J. R., Lubienski, S. T., Timmer, J. D., Makowski, M. B., & Miller, E. K. (2016). Have
Gender Gaps in Math Closed? Achievement, Teacher Perceptions, and Learning
Behaviors Across Two ECLS-K Cohorts. AERA Open, 2(4), 2332858416673617.
https://doi.org/10.1177/2332858416673617
Collins, C., Landivar, L. C., Ruppanner, L., & Scarborough, W. J. (2021). COVID-19 and the
gender gap in work hours. Gender, Work & Organization, n/a(n/a).
https://doi.org/10.1111/gwao.12506
43
Cooke, L. P. (2006). “Doing” Gender in Context: Household Bargaining and Risk of Divorce in
Germany and the United States. American Journal of Sociology, 112(2), 442–472.
https://doi.org/10.1086/506417
Cooke, L. P. (2014). Gendered Parenthood Penalties and Premiums across the Earnings
Distribution in Australia, the United Kingdom, and the United States. European
Sociological Review, 30(3), 360–372. https://doi.org/10.1093/esr/jcu044
Correll, S. J., Benard, S., & Paik, I. (2007). Getting a Job: Is There a Motherhood Penalty?
American Journal of Sociology, 112(5), 1297–1339. https://doi.org/10.1086/511799
Desai, S., & Waite, L. J. (1991). Women’s Employment During Pregnancy and After the First
Birth: Occupational Characteristics and Work Commitment. American Sociological
Review, 56(4), 551–566. https://doi.org/10.2307/2096274
Educational Attainment in the United States: 2015. (n.d.). 12.
England, P. (2020). Has the Gender Revolution Stalled? The Economic and Social Review, Vol.
51, No. 4, Winter 2020, Pp. 463-488. https://www.esri.ie/publications/has-the-gender-
revolution-stalled
Ericksen, K. S., Jurgens, J. C., Garrett, M. T., & Swedburg, R. B. (2008). Should I Stay at Home
or Should I Go Back to Work? Workforce reentry influences on a mother’s decision-
making process. Journal of Employment Counseling, 45(4), 156–167.
https://doi.org/10.1002/j.2161-1920.2008.tb00055.x
Evans, M. L., Lindauer, M., & Farrell, M. E. (2020). A Pandemic within a Pandemic—Intimate
Partner Violence during Covid-19. New England Journal of Medicine, 383(24), 2302–
2304. https://doi.org/10.1056/NEJMp2024046
Ewing-Nelson, C. (2021). All of the Jobs Lost in December Were Women’s Jobs. 3.
44
Flood, S., King, M., Rodgers, R., Ruggles, S., and Warren, J. Integrated Public Use Microdata
Series, Current Population Survey: Version 8.0 [dataset]. Minneapolis, MN: IPUMS,
2020. https://doi.org/10.18128/D030.V8.0
Fortin, N. M. (2005). Gender Role Attitudes and the Labour-market Outcomes of Women across
OECD Countries. Oxford Review of Economic Policy, 21(3), 416–438.
https://doi.org/10.1093/oxrep/gri024
Foster, B., Lonial, S., & Shastri, T. (2011). Mentoring, Career Plateau Tendencies, Turnover
Intentions And Implications For Narrowing Pay And Position Gaps Due To Gender
Structural Equations Modeling. Faculty Scholarship.
https://doi.org/10.19030/jabr.v27i6.6467
Foster, D. G., Biggs, M. A., Ralph, L., Gerdts, C., Roberts, S., & Glymour, M. M. (2018).
Socioeconomic Outcomes of Women Who Receive and Women Who Are Denied
Wanted Abortions in the United States. American Journal of Public Health, 108(3), 407–
413. https://doi.org/10.2105/AJPH.2017.304247
Gallen, Y. (2018a). Motherhood and the Gender Productivity Gap. SSRN Electronic Journal.
https://doi.org/10.2139/ssrn.3198356
Gallen, Y. (2018b). Motherhood and the Gender Productivity Gap (SSRN Scholarly Paper ID
3198356). Social Science Research Network. https://doi.org/10.2139/ssrn.3198356
Gruber, J. (1994). The Incidence of Mandated Maternity Benefits. The American Economic
Review, 84(3), 622–641.
Hakim, C. (2002). Lifestyle Preferences as Determinants of Women’s Differentiated Labor
Market Careers. Work and Occupations, 29(4), 428–459.
https://doi.org/10.1177/0730888402029004003
45
Hazarika, O. B., & Das, S. (2020). Paid and unpaid work during the Covid-19 pandemic: A study
of the gendered division of domestic responsibilities during lockdown. Journal of Gender
Studies, 0(0), 1–11. https://doi.org/10.1080/09589236.2020.1863202
Hotchkiss, J. L., Pitts, M. M., & Walker, M. B. (2017). Impact of first birth career interruption
on earnings: Evidence from administrative data. Applied Economics, 49(35), 3509–3522.
Hsieh, C.-T., Hurst, E., Jones, C. I., & Klenow, P. J. (2019). The Allocation of Talent and U.S.
Economic Growth. Econometrica, 87(5), 1439–1474.
https://doi.org/10.3982/ECTA11427
Jacobsen, J. P., & Levin, L. M. (1995). Effects of Intermittent Labor Force Attachment on
Women’s Earnings. Monthly Labor Review, 118(9), 14–19.
Jou, J., Kozhimannil, K. B., Abraham, J. M., Blewett, L. A., & McGovern, P. M. (2018). Paid
Maternity Leave in the United States: Associations with Maternal and Infant Health.
Maternal and Child Health Journal, 22(2), 216–225. https://doi.org/10.1007/s10995-017-
2393-x
Kleven, H., Landais, C., Posch, J., Steinhauer, A., & Zweimüller, J. (2019). Child Penalties
across Countries: Evidence and Explanations. AEA Papers and Proceedings, 109, 122–
126. https://doi.org/10.1257/pandp.20191078
Koropeckyj-Cox, T., Romano, V., & Moras, A. (2007). Through the Lenses of Gender, Race,
and Class: Students’ Perceptions of Childless/Childfree Individuals and Couples. Sex
Roles, 56(7), 415–428. https://doi.org/10.1007/s11199-006-9172-2
Kulic, N., Sani, G. M. D., Strauss, S., & Bellani, L. (2020). Economic disturbances in the
COVID-19 crisis and their gendered impact on unpaid activities in Germany and Italy.
European Societies, 0(0), 1–17. https://doi.org/10.1080/14616696.2020.1828974
46
Lam, C. B., McHale, S. M., & Updegraff, K. A. (2012). Gender Dynamics in Mexican American
Families: Connecting Mothers’, Fathers’, and Youths’ Experiences. Sex Roles, 67(1–2),
17–28. https://doi.org/10.1007/s11199-012-0137-3
Langner, L. (2020). Desperate Housewives and Happy Working Mothers: Are Parent-Couples
with Equal Income More Satisfied throughout Parenthood? A Dyadic Longitudinal
Study. Work, Employment and Society, 0950017020971548.
https://doi.org/10.1177/0950017020971548
Levanon, A., England, P., & Allison, P. (2009). Occupational Feminization and Pay: Assessing
Causal Dynamics Using 1950–2000 U.S. Census Data. Social Forces, 88(2), 865–891.
https://doi.org/10.1353/sof.0.0264
Litman, L., Robinson, J., Rosen, Z., Rosenzweig, C., Waxman, J., & Bates, L. M. (2020). The
persistence of pay inequality: The gender pay gap in an anonymous online labor market.
PLoS ONE, 15(2). https://doi.org/10.1371/journal.pone.0229383
Lovejoy, M., & Stone, P. (2012). Opting Back In: The Influence of Time at Home on
Professional Women’s Career Redirection after Opting Out. Gender, Work &
Organization, 19(6), 631–653. https://doi.org/10.1111/j.1468-0432.2010.00550.x
Mandel, H., & Semyonov, M. (2014). Gender pay gap and employment sector: Sources of
earnings disparities in the United States, 1970-2010. Demography, 51(5), 1597–1618.
https://doi.org/10.1007/s13524-014-0320-y
Map: Where Has COVID-19 Closed Schools? Where Are They Open? (2020, July 28).
Education Week. Retrieved Month Day, Year
from https://www.edweek.org/ew/section/multimedia/map-covid-19-schools-open-
closed.html.
47
Martin, P., & Barnard, A. (2013). The experience of women in male-dominated occupations: A
constructivist grounded theory inquiry. SA Journal of Industrial Psychology, 39.
https://doi.org/10.4102/sajip.v39i2.1099
McClintock, E. A. (2018). Changing Jobs and Changing Chores? The Longitudinal Association
of Women’s and Men’s Occupational Gender-Atypicality and Couples’ Housework
Performance. Sex Roles, 78(3), 165–181. https://doi.org/10.1007/s11199-017-0794-3
McDevitt, C. L., Irwin, J. R., & Inwood, K. (2009). Gender Pay Gap, Productivity Gap and
Discrimination in Canadian Clothing Manufacturing in 1870. Eastern Economic Journal,
35(1), 24–36. https://doi.org/10.1057/palgrave.eej.9050041
Milkman, R., & Appelbaum, E. (2013). Unfinished Business: Paid Family Leave in California
and the Future of U.S. Work-Family Policy. Cornell University Press.
Mills, M., Rindfuss, R. R., McDonald, P., te Velde, E., & on behalf of the ESHRE Reproduction
and Society Task Force. (2011). Why do people postpone parenthood? Reasons and
social policy incentives. Human Reproduction Update, 17(6), 848–860.
https://doi.org/10.1093/humupd/dmr026
Misra, J., Budig, M., & Boeckmann, I. (2011). Work-family policies and the effects of children
on women’s employment hours and wages. Community, Work & Family, 14(2), 139–157.
https://doi.org/10.1080/13668803.2011.571396
Ortiz, S. Y., & Roscigno, V. J. (2009). Discrimination, Women, and Work: Processes and
Variations by Race and Class. The Sociological Quarterly, 50(2), 336–359.
https://doi.org/10.1111/j.1533-8525.2009.01143.x
Powell, L. M. (1998). Part-time versus full-time work and childcare costs: Evidence for married
mothers. Applied Economics, 30(4), 503–511. https://doi.org/10.1080/000368498325769
48
Rao, A. H. (2020). From Professionals to Professional Mothers: How College-educated Married
Mothers Experience Unemployment in the US. Work, Employment and Society, 34(2),
299–316. https://doi.org/10.1177/0950017019887334
Reichelt, M., Makovi, K., & Sargsyan, A. (2020). The impact of COVID-19 on gender inequality
in the labor market and gender-role attitudes. European Societies, 0(0), 1–18.
https://doi.org/10.1080/14616696.2020.1823010
Sayer, L. C., & Fine, L. (2011). Racial-Ethnic Differences in U.S. Married Women’s and Men’s
Housework. Social Indicators Research, 101(2), 259–265.
https://doi.org/10.1007/s11205-010-9645-0
Schneider, D. (2012). Gender Deviance and Household Work: The Role of Occupation.
American Journal of Sociology, 117(4), 1029–1072. https://doi.org/10.1086/662649
Sonfield, A., Hasstedt, K., Kavanaugh, M. L., & Anderson, R. (n.d.). The Social and Economic
Benefits of Women’s Ability To Determine Whether and When to Have Children. 48.
Staff, J., & Mortimer, J. T. (2012). Explaining the Motherhood Wage Penalty During the Early
Occupational Career. Demography, 49(1), 1–21. https://doi.org/10.1007/s13524-011-
0068-6
Stier, H., & Yaish, M. (2014). Occupational segregation and gender inequality in job quality: A
multi-level approach. Work, Employment and Society, 28(2), 225–246.
https://doi.org/10.1177/0950017013510758
Pepping, A. & Maniam, B. (2020). The Motherhood Penalty. Journal of Business and
Behavioral Sciences, 32(2), 110-125. Retrieved January 31, 2021, from
https://search.proquest.com/openview/8a8c0e8497fac1653db04239033dd628/1.pdf?pq-
origsite=gscholar&cbl=2030637
49
Toossi, M. (2006) A new look at long-term labor force projections to 2050. 21.
Toossi, M., & Morisi, T. L. (n.d.). Women In The Workforce Before, During, And After The
Great Recession. 20.
Van Rijn - Van Gelderen, L., Ellis-Davies, K., Huijzer-Engbrenghof, M., Jorgensen, T. D.,
Gross, M., Winstanley, A., Rubio, B., Vecho, O., Lamb, M. E., & Bos, H. M. W. (2020).
Determinants of Non-paid Task Division in Gay-, Lesbian-, and Heterosexual-Parent
Families With Infants Conceived Using Artificial Reproductive Techniques. Frontiers in
Psychology, 11. https://doi.org/10.3389/fpsyg.2020.00914
West, C., & Zimmerman, D. H. (1987). Doing Gender. Gender & Society, 1(2), 125–151.
https://doi.org/10.1177/0891243287001002002
Willson, A. E. (2003). Race and Women’s Income Trajectories: Employment, Marriage, and
Income Security over the Life Course. Social Problems, 50(1), 87–110.
https://doi.org/10.1525/sp.2003.50.1.87
Xue, B., Fleischmann, M., Head, J., McMunn, A., & Stafford, M. (2020). Work-Family Conflict
and Work Exit in Later Career Stage. The Journals of Gerontology: Series B, 75(3), 716–
727. https://doi.org/10.1093/geronb/gby146
Zamarro, G., Prados, M.J. Gender differences in couples’ division of childcare, work and mental
health during COVID-19. Rev Econ Household 19, 11–40 (2021).
https://doi.org/10.1007/s11150-020-09534-7
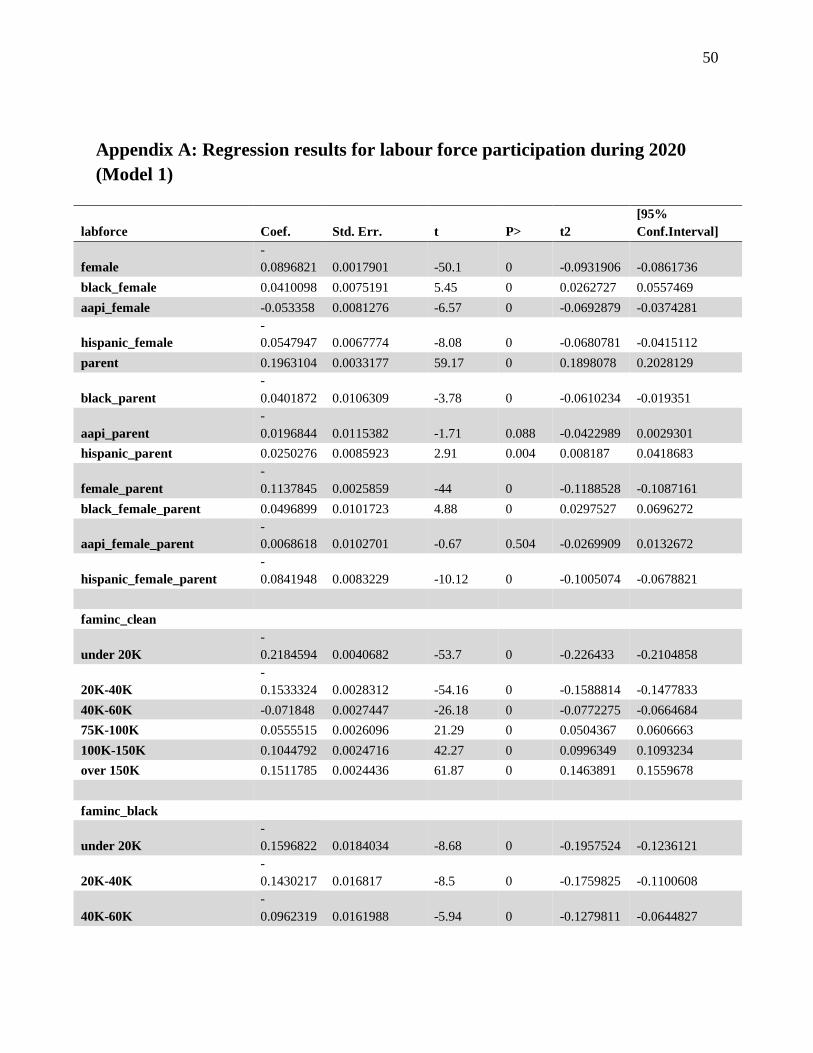
50
Appendix A: Regression results for labour force participation during 2020
(Model 1)
labforce Coef. Std. Err. t P> t2
[95%
Conf.Interval]
female
-
0.0896821 0.0017901 -50.1 0 -0.0931906 -0.0861736
black_female 0.0410098 0.0075191 5.45 0 0.0262727 0.0557469
aapi_female -0.053358 0.0081276 -6.57 0 -0.0692879 -0.0374281
hispanic_female
-
0.0547947 0.0067774 -8.08 0 -0.0680781 -0.0415112
parent 0.1963104 0.0033177 59.17 0 0.1898078 0.2028129
black_parent
-
0.0401872 0.0106309 -3.78 0 -0.0610234 -0.019351
aapi_parent
-
0.0196844 0.0115382 -1.71 0.088 -0.0422989 0.0029301
hispanic_parent 0.0250276 0.0085923 2.91 0.004 0.008187 0.0418683
female_parent
-
0.1137845 0.0025859 -44 0 -0.1188528 -0.1087161
black_female_parent 0.0496899 0.0101723 4.88 0 0.0297527 0.0696272
aapi_female_parent
-
0.0068618 0.0102701 -0.67 0.504 -0.0269909 0.0132672
hispanic_female_parent
-
0.0841948 0.0083229 -10.12 0 -0.1005074 -0.0678821
faminc_clean
under 20K
-
0.2184594 0.0040682 -53.7 0 -0.226433 -0.2104858
20K-40K
-
0.1533324 0.0028312 -54.16 0 -0.1588814 -0.1477833
40K-60K -0.071848 0.0027447 -26.18 0 -0.0772275 -0.0664684
75K-100K 0.0555515 0.0026096 21.29 0 0.0504367 0.0606663
100K-150K 0.1044792 0.0024716 42.27 0 0.0996349 0.1093234
over 150K 0.1511785 0.0024436 61.87 0 0.1463891 0.1559678
faminc_black
under 20K
-
0.1596822 0.0184034 -8.68 0 -0.1957524 -0.1236121
20K-40K
-
0.1430217 0.016817 -8.5 0 -0.1759825 -0.1100608
40K-60K
-
0.0962319 0.0161988 -5.94 0 -0.1279811 -0.0644827
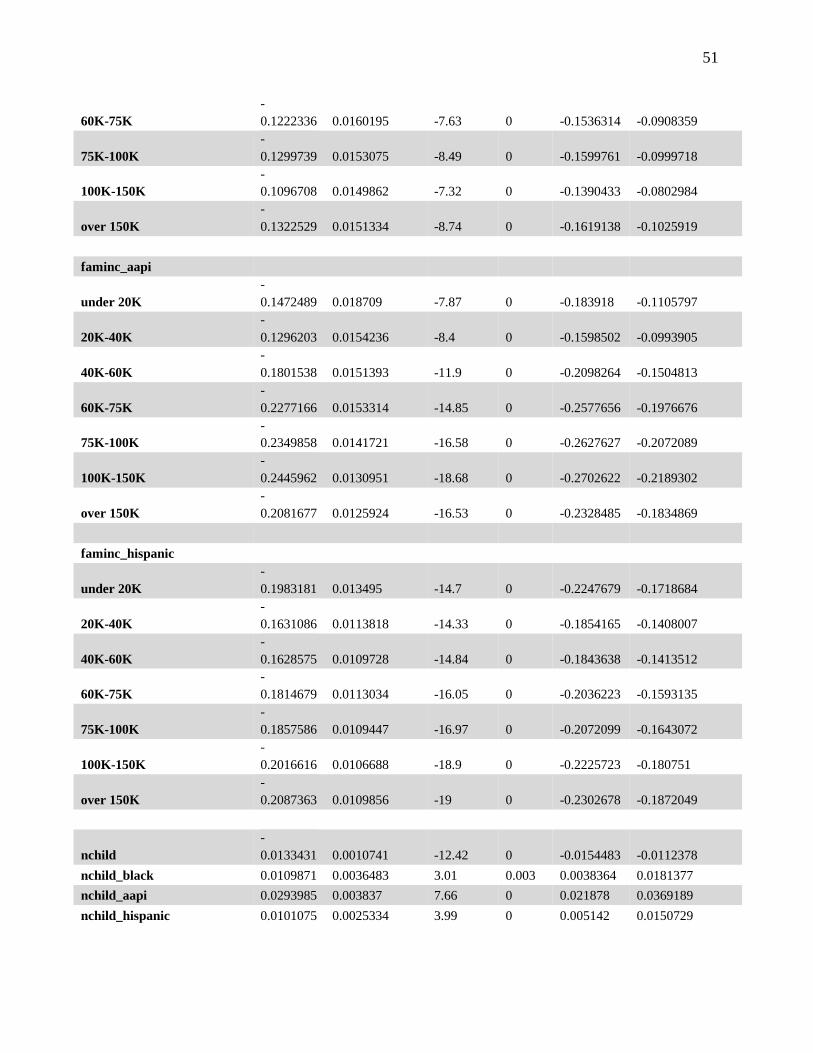
51
60K-75K
-
0.1222336 0.0160195 -7.63 0 -0.1536314 -0.0908359
75K-100K
-
0.1299739 0.0153075 -8.49 0 -0.1599761 -0.0999718
100K-150K
-
0.1096708 0.0149862 -7.32 0 -0.1390433 -0.0802984
over 150K
-
0.1322529 0.0151334 -8.74 0 -0.1619138 -0.1025919
faminc_aapi
under 20K
-
0.1472489 0.018709 -7.87 0 -0.183918 -0.1105797
20K-40K
-
0.1296203 0.0154236 -8.4 0 -0.1598502 -0.0993905
40K-60K
-
0.1801538 0.0151393 -11.9 0 -0.2098264 -0.1504813
60K-75K
-
0.2277166 0.0153314 -14.85 0 -0.2577656 -0.1976676
75K-100K
-
0.2349858 0.0141721 -16.58 0 -0.2627627 -0.2072089
100K-150K
-
0.2445962 0.0130951 -18.68 0 -0.2702622 -0.2189302
over 150K
-
0.2081677 0.0125924 -16.53 0 -0.2328485 -0.1834869
faminc_hispanic
under 20K
-
0.1983181 0.013495 -14.7 0 -0.2247679 -0.1718684
20K-40K
-
0.1631086 0.0113818 -14.33 0 -0.1854165 -0.1408007
40K-60K
-
0.1628575 0.0109728 -14.84 0 -0.1843638 -0.1413512
60K-75K
-
0.1814679 0.0113034 -16.05 0 -0.2036223 -0.1593135
75K-100K
-
0.1857586 0.0109447 -16.97 0 -0.2072099 -0.1643072
100K-150K
-
0.2016616 0.0106688 -18.9 0 -0.2225723 -0.180751
over 150K
-
0.2087363 0.0109856 -19 0 -0.2302678 -0.1872049
nchild
-
0.0133431 0.0010741 -12.42 0 -0.0154483 -0.0112378
nchild_black 0.0109871 0.0036483 3.01 0.003 0.0038364 0.0181377
nchild_aapi 0.0293985 0.003837 7.66 0 0.021878 0.0369189
nchild_hispanic 0.0101075 0.0025334 3.99 0 0.005142 0.0150729
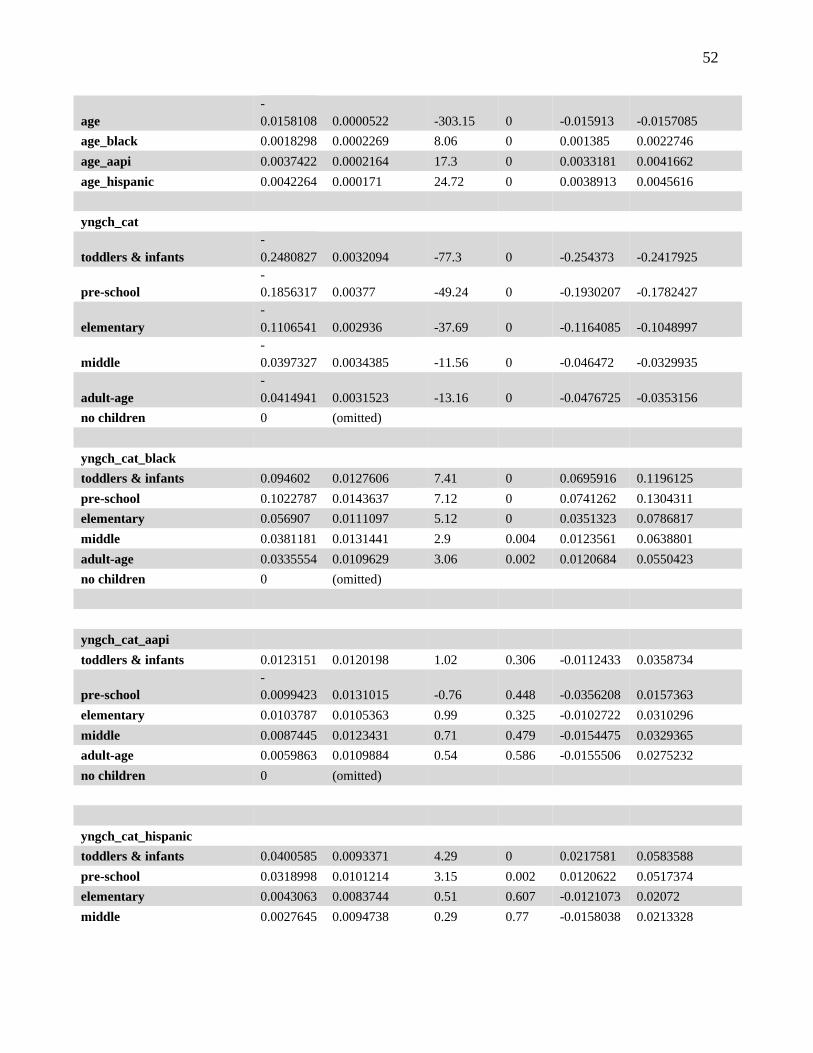
52
age
-
0.0158108 0.0000522 -303.15 0 -0.015913 -0.0157085
age_black 0.0018298 0.0002269 8.06 0 0.001385 0.0022746
age_aapi 0.0037422 0.0002164 17.3 0 0.0033181 0.0041662
age_hispanic 0.0042264 0.000171 24.72 0 0.0038913 0.0045616
yngch_cat
toddlers & infants
-
0.2480827 0.0032094 -77.3 0 -0.254373 -0.2417925
pre-school
-
0.1856317 0.00377 -49.24 0 -0.1930207 -0.1782427
elementary
-
0.1106541 0.002936 -37.69 0 -0.1164085 -0.1048997
middle
-
0.0397327 0.0034385 -11.56 0 -0.046472 -0.0329935
adult-age
-
0.0414941 0.0031523 -13.16 0 -0.0476725 -0.0353156
no children 0 (omitted)
yngch_cat_black toddlers & infants 0.094602 0.0127606 7.41 0 0.0695916 0.1196125
pre-school 0.1022787 0.0143637 7.12 0 0.0741262 0.1304311
elementary 0.056907 0.0111097 5.12 0 0.0351323 0.0786817
middle 0.0381181 0.0131441 2.9 0.004 0.0123561 0.0638801
adult-age 0.0335554 0.0109629 3.06 0.002 0.0120684 0.0550423
no children 0 (omitted)
yngch_cat_aapi toddlers & infants 0.0123151 0.0120198 1.02 0.306 -0.0112433 0.0358734
pre-school
-
0.0099423 0.0131015 -0.76 0.448 -0.0356208 0.0157363
elementary 0.0103787 0.0105363 0.99 0.325 -0.0102722 0.0310296
middle 0.0087445 0.0123431 0.71 0.479 -0.0154475 0.0329365
adult-age 0.0059863 0.0109884 0.54 0.586 -0.0155506 0.0275232
no children 0 (omitted)
yngch_cat_hispanic toddlers & infants 0.0400585 0.0093371 4.29 0 0.0217581 0.0583588
pre-school 0.0318998 0.0101214 3.15 0.002 0.0120622 0.0517374
elementary 0.0043063 0.0083744 0.51 0.607 -0.0121073 0.02072
middle 0.0027645 0.0094738 0.29 0.77 -0.0158038 0.0213328
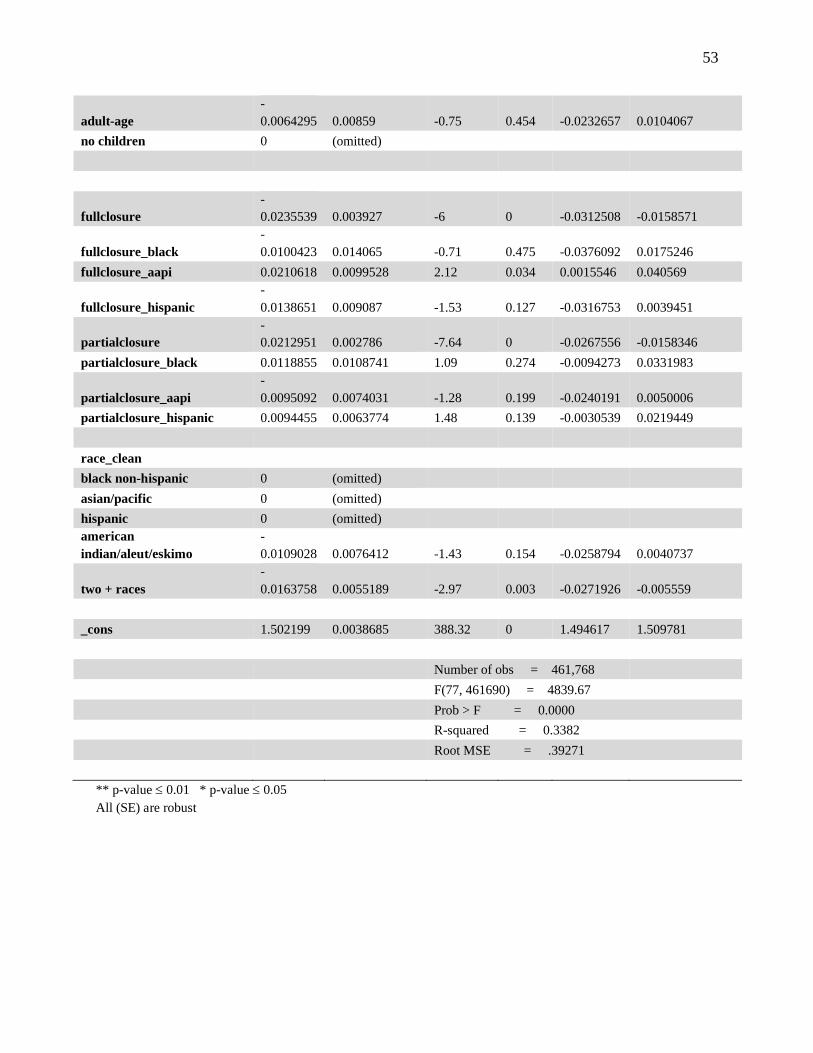
53
adult-age
-
0.0064295 0.00859 -0.75 0.454 -0.0232657 0.0104067
no children 0 (omitted)
fullclosure
-
0.0235539 0.003927 -6 0 -0.0312508 -0.0158571
fullclosure_black
-
0.0100423 0.014065 -0.71 0.475 -0.0376092 0.0175246
fullclosure_aapi 0.0210618 0.0099528 2.12 0.034 0.0015546 0.040569
fullclosure_hispanic
-
0.0138651 0.009087 -1.53 0.127 -0.0316753 0.0039451
partialclosure
-
0.0212951 0.002786 -7.64 0 -0.0267556 -0.0158346
partialclosure_black 0.0118855 0.0108741 1.09 0.274 -0.0094273 0.0331983
partialclosure_aapi
-
0.0095092 0.0074031 -1.28 0.199 -0.0240191 0.0050006
partialclosure_hispanic 0.0094455 0.0063774 1.48 0.139 -0.0030539 0.0219449
race_clean black non-hispanic 0 (omitted) asian/pacific 0 (omitted) hispanic 0 (omitted) american
indian/aleut/eskimo
-
0.0109028 0.0076412 -1.43 0.154 -0.0258794 0.0040737
two + races
-
0.0163758 0.0055189 -2.97 0.003 -0.0271926 -0.005559
_cons 1.502199 0.0038685 388.32 0 1.494617 1.509781
Number of obs = 461,768
F(77, 461690) = 4839.67
Prob > F = 0.0000
R-squared = 0.3382
Root MSE = .39271
** p-value 0.01 * p-value 0.05
All (SE) are robust
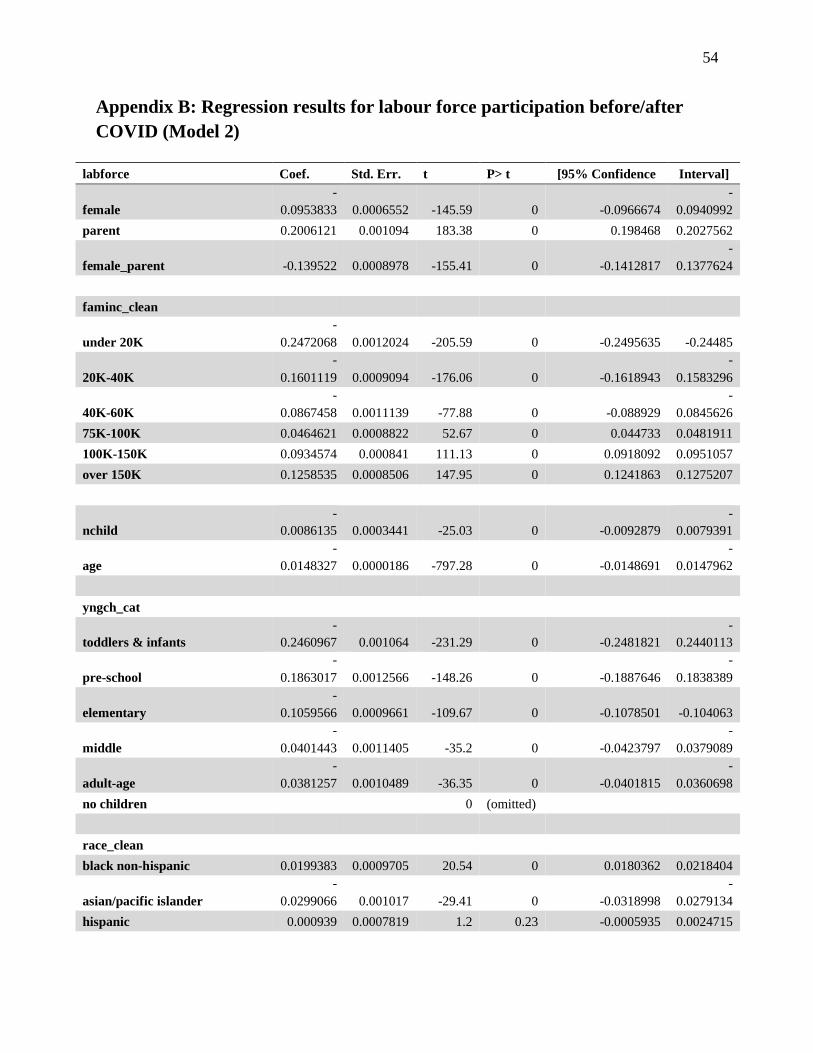
54
Appendix B: Regression results for labour force participation before/after
COVID (Model 2)
labforce Coef. Std. Err. t P> t [95% Confidence Interval]
female
-
0.0953833 0.0006552 -145.59 0 -0.0966674
-
0.0940992
parent 0.2006121 0.001094 183.38 0 0.198468 0.2027562
female_parent -0.139522 0.0008978 -155.41 0 -0.1412817
-
0.1377624
faminc_clean
under 20K
-
0.2472068 0.0012024 -205.59 0 -0.2495635 -0.24485
20K-40K
-
0.1601119 0.0009094 -176.06 0 -0.1618943
-
0.1583296
40K-60K
-
0.0867458 0.0011139 -77.88 0 -0.088929
-
0.0845626
75K-100K 0.0464621 0.0008822 52.67 0 0.044733 0.0481911
100K-150K 0.0934574 0.000841 111.13 0 0.0918092 0.0951057
over 150K 0.1258535 0.0008506 147.95 0 0.1241863 0.1275207
nchild
-
0.0086135 0.0003441 -25.03 0 -0.0092879
-
0.0079391
age
-
0.0148327 0.0000186 -797.28 0 -0.0148691
-
0.0147962
yngch_cat
toddlers & infants
-
0.2460967 0.001064 -231.29 0 -0.2481821
-
0.2440113
pre-school
-
0.1863017 0.0012566 -148.26 0 -0.1887646
-
0.1838389
elementary
-
0.1059566 0.0009661 -109.67 0 -0.1078501 -0.104063
middle
-
0.0401443 0.0011405 -35.2 0 -0.0423797
-
0.0379089
adult-age
-
0.0381257 0.0010489 -36.35 0 -0.0401815
-
0.0360698
no children 0 (omitted)
race_clean
black non-hispanic 0.0199383 0.0009705 20.54 0 0.0180362 0.0218404
asian/pacific islander
-
0.0299066 0.001017 -29.41 0 -0.0318998
-
0.0279134
hispanic 0.000939 0.0007819 1.2 0.23 -0.0005935 0.0024715
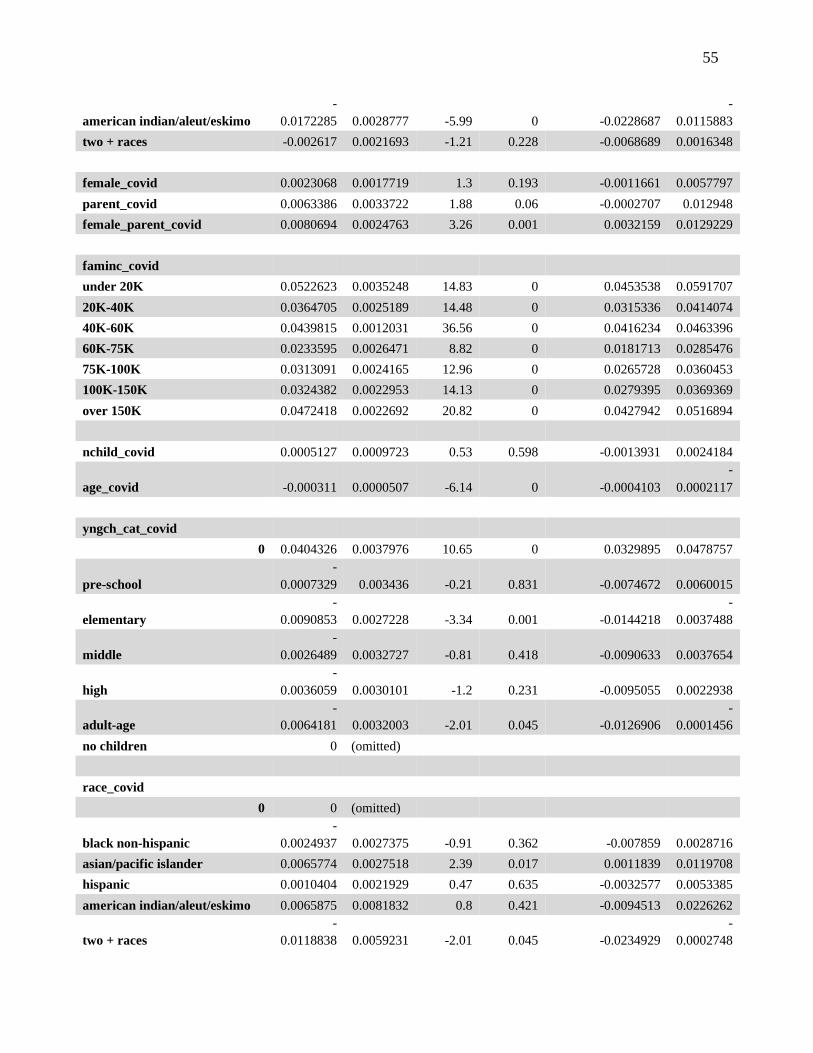
55
american indian/aleut/eskimo
-
0.0172285 0.0028777 -5.99 0 -0.0228687
-
0.0115883
two + races -0.002617 0.0021693 -1.21 0.228 -0.0068689 0.0016348
female_covid 0.0023068 0.0017719 1.3 0.193 -0.0011661 0.0057797
parent_covid 0.0063386 0.0033722 1.88 0.06 -0.0002707 0.012948
female_parent_covid 0.0080694 0.0024763 3.26 0.001 0.0032159 0.0129229
faminc_covid
under 20K 0.0522623 0.0035248 14.83 0 0.0453538 0.0591707
20K-40K 0.0364705 0.0025189 14.48 0 0.0315336 0.0414074
40K-60K 0.0439815 0.0012031 36.56 0 0.0416234 0.0463396
60K-75K 0.0233595 0.0026471 8.82 0 0.0181713 0.0285476
75K-100K 0.0313091 0.0024165 12.96 0 0.0265728 0.0360453
100K-150K 0.0324382 0.0022953 14.13 0 0.0279395 0.0369369
over 150K 0.0472418 0.0022692 20.82 0 0.0427942 0.0516894
nchild_covid 0.0005127 0.0009723 0.53 0.598 -0.0013931 0.0024184
age_covid -0.000311 0.0000507 -6.14 0 -0.0004103
-
0.0002117
yngch_cat_covid
0 0.0404326 0.0037976 10.65 0 0.0329895 0.0478757
pre-school
-
0.0007329 0.003436 -0.21 0.831 -0.0074672 0.0060015
elementary
-
0.0090853 0.0027228 -3.34 0.001 -0.0144218
-
0.0037488
middle
-
0.0026489 0.0032727 -0.81 0.418 -0.0090633 0.0037654
high
-
0.0036059 0.0030101 -1.2 0.231 -0.0095055 0.0022938
adult-age
-
0.0064181 0.0032003 -2.01 0.045 -0.0126906
-
0.0001456
no children 0 (omitted)
race_covid
0 0 (omitted)
black non-hispanic
-
0.0024937 0.0027375 -0.91 0.362 -0.007859 0.0028716
asian/pacific islander 0.0065774 0.0027518 2.39 0.017 0.0011839 0.0119708
hispanic 0.0010404 0.0021929 0.47 0.635 -0.0032577 0.0053385
american indian/aleut/eskimo 0.0065875 0.0081832 0.8 0.421 -0.0094513 0.0226262
two + races
-
0.0118838 0.0059231 -2.01 0.045 -0.0234929
-
0.0002748
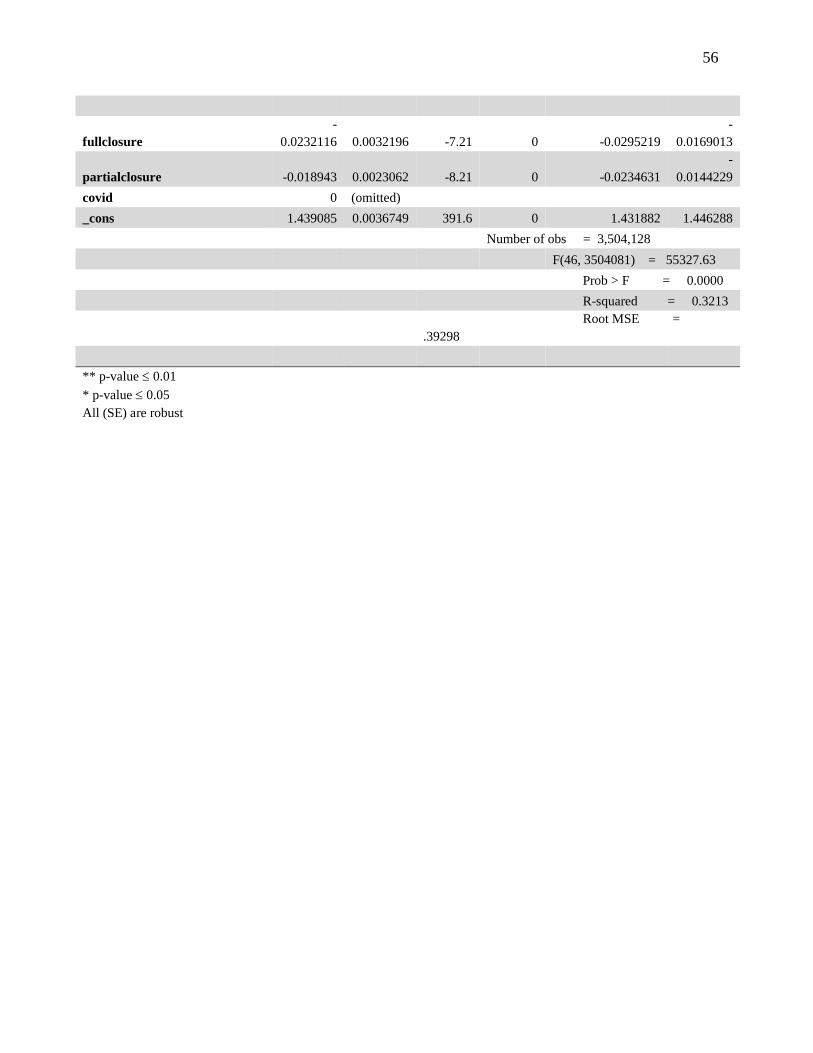
56
fullclosure
-
0.0232116 0.0032196 -7.21 0 -0.0295219
-
0.0169013
partialclosure -0.018943 0.0023062 -8.21 0 -0.0234631
-
0.0144229
covid 0 (omitted)
_cons 1.439085 0.0036749 391.6 0 1.431882 1.446288
Number of obs = 3,504,128
F(46, 3504081) = 55327.63
Prob > F = 0.0000
R-squared = 0.3213
Root MSE =
.39298
** p-value 0.01
* p-value 0.05
All (SE) are robust
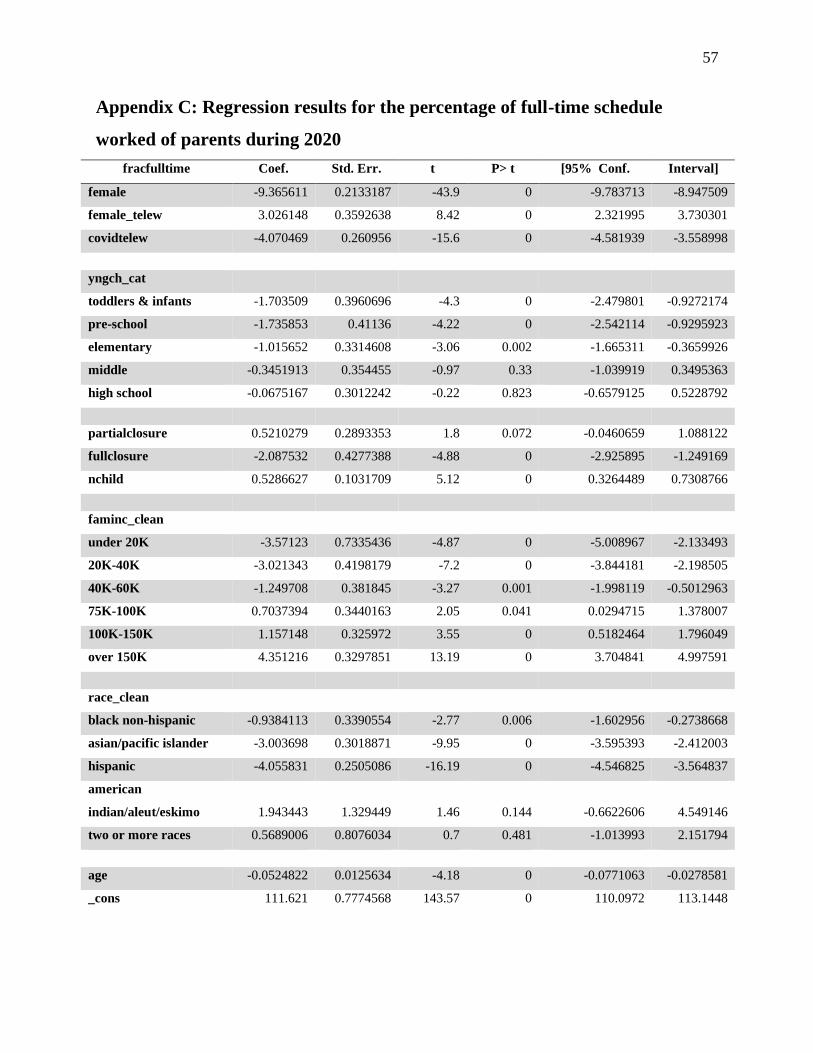
57
Appendix C: Regression results for the percentage of full-time schedule
worked of parents during 2020
fracfulltime Coef. Std. Err. t P> t [95% Conf. Interval]
female -9.365611 0.2133187 -43.9 0 -9.783713 -8.947509
female_telew 3.026148 0.3592638 8.42 0 2.321995 3.730301
covidtelew -4.070469 0.260956 -15.6 0 -4.581939 -3.558998
yngch_cat
toddlers & infants -1.703509 0.3960696 -4.3 0 -2.479801 -0.9272174
pre-school -1.735853 0.41136 -4.22 0 -2.542114 -0.9295923
elementary -1.015652 0.3314608 -3.06 0.002 -1.665311 -0.3659926
middle -0.3451913 0.354455 -0.97 0.33 -1.039919 0.3495363
high school -0.0675167 0.3012242 -0.22 0.823 -0.6579125 0.5228792
partialclosure 0.5210279 0.2893353 1.8 0.072 -0.0460659 1.088122
fullclosure -2.087532 0.4277388 -4.88 0 -2.925895 -1.249169
nchild 0.5286627 0.1031709 5.12 0 0.3264489 0.7308766
faminc_clean
under 20K -3.57123 0.7335436 -4.87 0 -5.008967 -2.133493
20K-40K -3.021343 0.4198179 -7.2 0 -3.844181 -2.198505
40K-60K -1.249708 0.381845 -3.27 0.001 -1.998119 -0.5012963
75K-100K 0.7037394 0.3440163 2.05 0.041 0.0294715 1.378007
100K-150K 1.157148 0.325972 3.55 0 0.5182464 1.796049
over 150K 4.351216 0.3297851 13.19 0 3.704841 4.997591
race_clean
black non-hispanic -0.9384113 0.3390554 -2.77 0.006 -1.602956 -0.2738668
asian/pacific islander -3.003698 0.3018871 -9.95 0 -3.595393 -2.412003
hispanic -4.055831 0.2505086 -16.19 0 -4.546825 -3.564837
american
indian/aleut/eskimo 1.943443 1.329449 1.46 0.144 -0.6622606 4.549146
two or more races 0.5689006 0.8076034 0.7 0.481 -1.013993 2.151794
age -0.0524822 0.0125634 -4.18 0 -0.0771063 -0.0278581
_cons 111.621 0.7774568 143.57 0 110.0972 113.1448
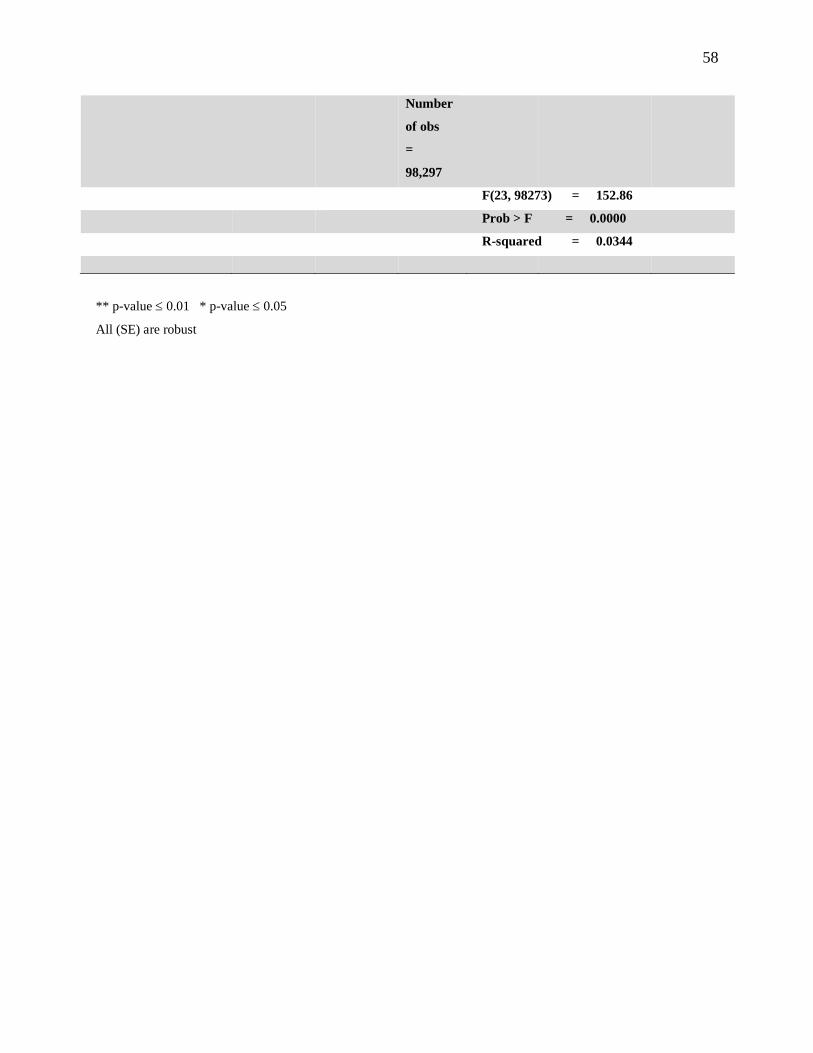
58
Number
of obs
=
98,297
F(23, 98273) = 152.86
Prob > F = 0.0000
R-squared = 0.0344
** p-value 0.01 * p-value 0.05
All (SE) are robust