Embed Size (px)
Citation preview
Exploring the Inner 1-100 microarcseconds
of AGN using the
Space Interferometry Mission
"SIM Lite"
Ann E. Wehrle
Principal Investigator, SIM AGN Key Project
Space Science Institute
Team Members: Steve Unwin, David L. Meier, Dayton
Jones, Glenn Piner
New science Enabled by Microarcsecond Astrometry
Socorro, New Mexico
July 21-23, 2009
Microarcsecond Astrometry – Socorro, NM – July 21-23, 2009 Ann E. Wehrle - 2
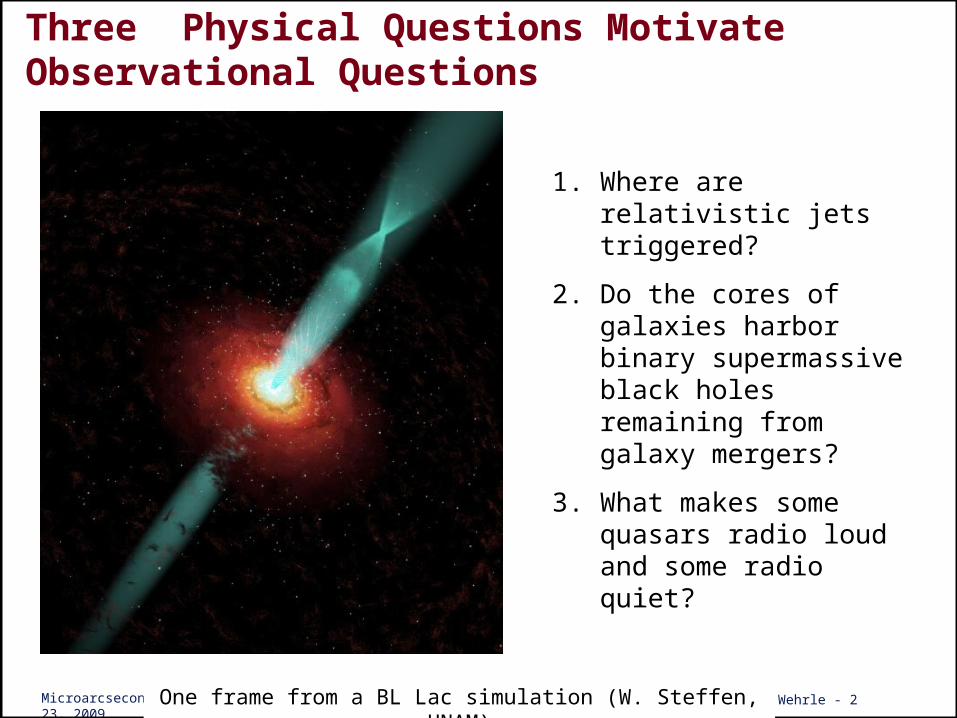
Three Physical Questions Motivate Observational Questions
One frame from a BL Lac simulation (W. Steffen, UNAM)
1. Where are relativistic jets triggered?
2. Do the cores of galaxies harbor binary supermassive black holes remaining from galaxy mergers?
3. What makes some quasars radio loud and some radio quiet?
Microarcsecond Astrometry – Socorro, NM – July 21-23, 2009 Ann E. Wehrle - 3
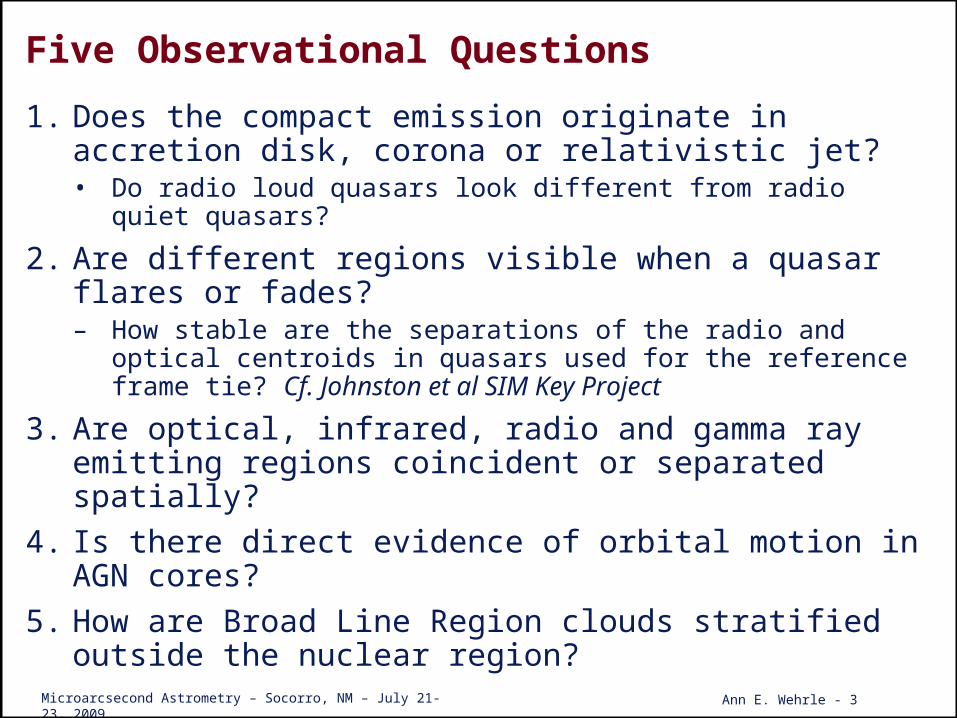
Five Observational Questions
1. Does the compact emission originate in accretion disk, corona or relativistic jet?• Do radio loud quasars look different from radio quiet quasars?
2. Are different regions visible when a quasar flares or fades?– How stable are the separations of the radio and optical centroids in
quasars used for the reference frame tie? Cf. Johnston et al SIM Key Project
3. Are optical, infrared, radio and gamma ray emitting regions coincident or separated spatially?
4. Is there direct evidence of orbital motion in AGN cores?
5. How are Broad Line Region clouds stratified outside the nuclear region?
Microarcsecond Astrometry – Socorro, NM – July 21-23, 2009 Ann E. Wehrle - 4
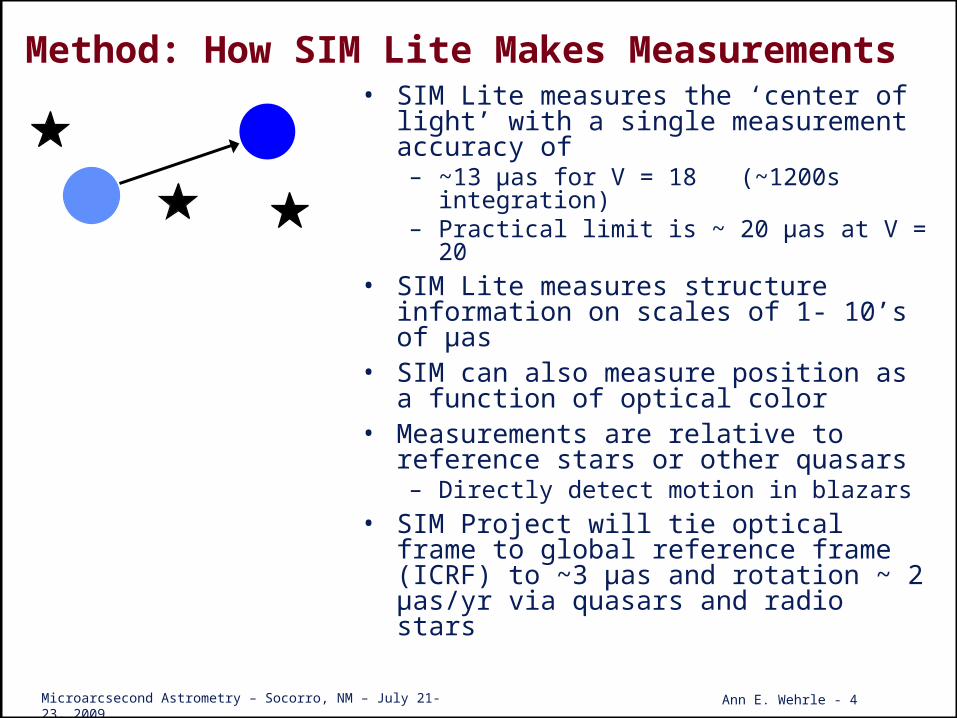
Method: How SIM Lite Makes Measurements• SIM Lite measures the ‘center of light’ with a
single measurement accuracy of – ~13 µas for V = 18 (~1200s integration)– Practical limit is ~ 20 µas at V = 20
• SIM Lite measures structure information on scales of 1- 10’s of µas
• SIM can also measure position as a function of optical color
• Measurements are relative to reference stars or other quasars– Directly detect motion in blazars
• SIM Project will tie optical frame to global reference frame (ICRF) to ~3 µas and rotation ~ 2 µas/yr via quasars and radio stars
Microarcsecond Astrometry – Socorro, NM – July 21-23, 2009 Ann E. Wehrle - 5
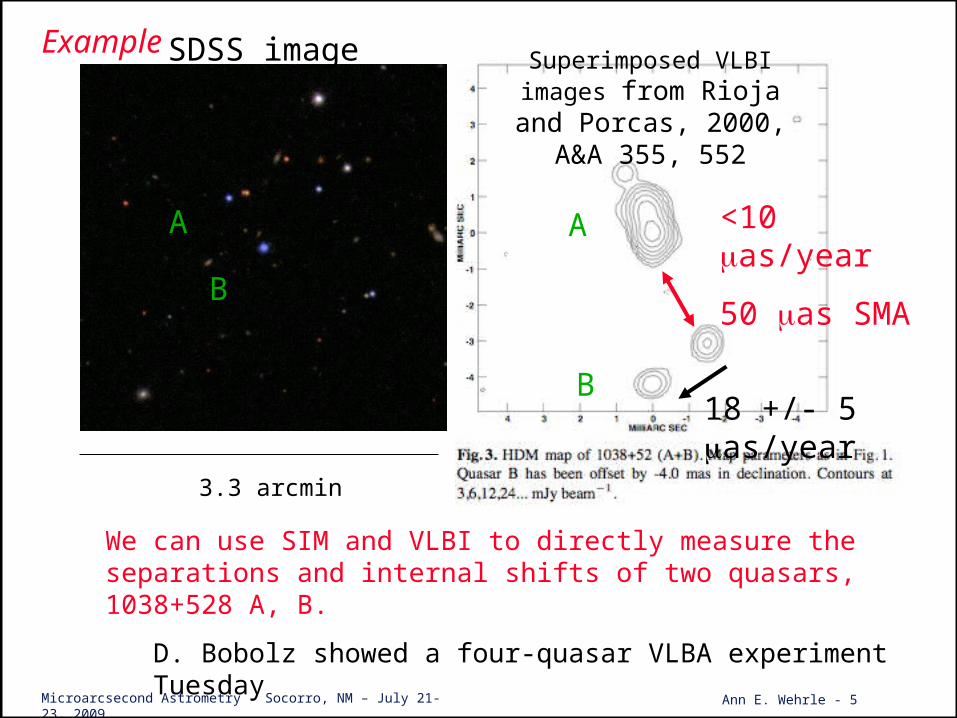
3.3 arcmin
A A
B
B
<10 as/year
50 as SMA
18 +/- 5 as/year
We can use SIM and VLBI to directly measure the separations and internal shifts of two quasars, 1038+528 A, B.
D. Bobolz showed a four-quasar VLBA experiment Tuesday
Superimposed VLBI images from Rioja and Porcas,
2000, A&A 355, 552
SDSS imageExample
Microarcsecond Astrometry – Socorro, NM – July 21-23, 2009 Ann E. Wehrle - 6
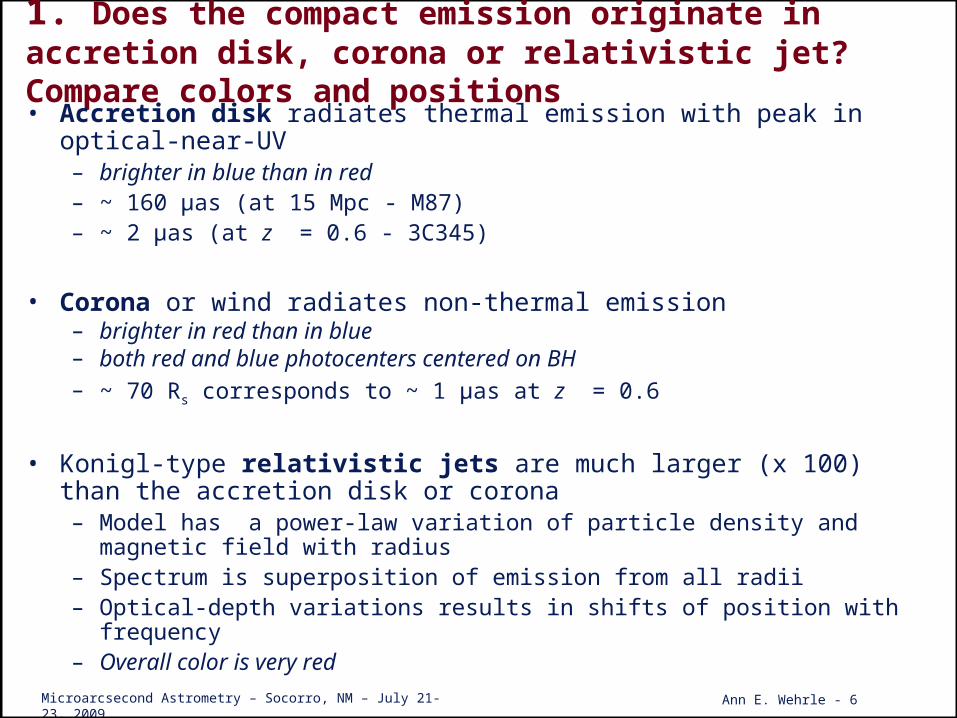
1. Does the compact emission originate in accretion disk, corona or relativistic jet? Compare colors and positions• Accretion disk radiates thermal emission with peak in optical-near-UV
– brighter in blue than in red– ~ 160 µas (at 15 Mpc - M87)– ~ 2 µas (at z = 0.6 - 3C345)
• Corona or wind radiates non-thermal emission– brighter in red than in blue– both red and blue photocenters centered on BH – ~ 70 Rs corresponds to ~ 1 µas at z = 0.6
• Konigl-type relativistic jets are much larger (x 100) than the accretion disk or corona– Model has a power-law variation of particle density and magnetic field with
radius– Spectrum is superposition of emission from all radii– Optical-depth variations results in shifts of position with frequency– Overall color is very red
Microarcsecond Astrometry – Socorro, NM – July 21-23, 2009 Ann E. Wehrle - 7
Which Emission Region is dominant?
• Predictions of jet dominated model:– Expect astrometric shift for variable quasars to be aligned with the jet– Expect red photocenter offset from blue photocenter in the jet
direction– Expect color-dependent shift between blue and red, with blue-red
pointing in the jet direction
• Test Method: Motions demonstrated in Steve Unwin’s animation on Tuesday, see also radio loud quasar on next slide
Microarcsecond Astrometry – Socorro, NM – July 21-23, 2009 Ann E. Wehrle - 8
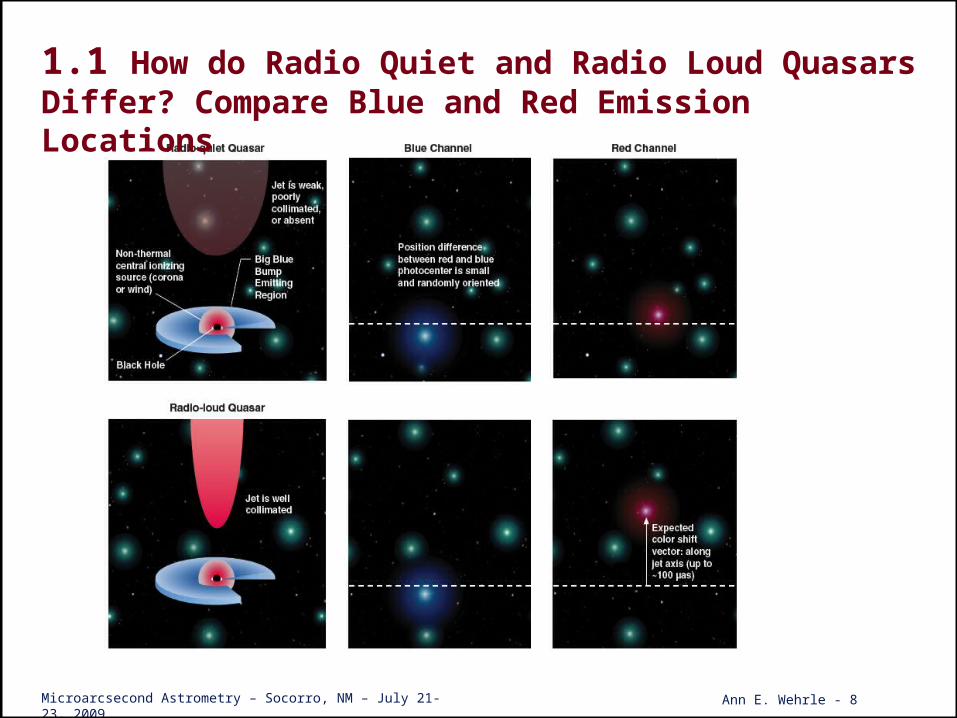
1.1 How do Radio Quiet and Radio Loud Quasars Differ? Compare Blue and Red Emission Locations
Microarcsecond Astrometry – Socorro, NM – July 21-23, 2009 Ann E. Wehrle - 9
2. Are different regions visible when a quasar flares or fades? Compare centroid locations.
– Blazar emission is highly variable- factor of ~5 in radio, factor of ~10-100 in optical.
– When blazar is optically faint, spectroscopy shows flattened spectrum, presumably the accretion disk.
– When blazar flares, spectroscopy shows strong, polarized synchrotron emission completely swamping the accretion disk emission.
– We can compare the position of the centroid when the quasar is flaring to when it is fading.
Microarcsecond Astrometry – Socorro, NM – July 21-23, 2009 Ann E. Wehrle - 10
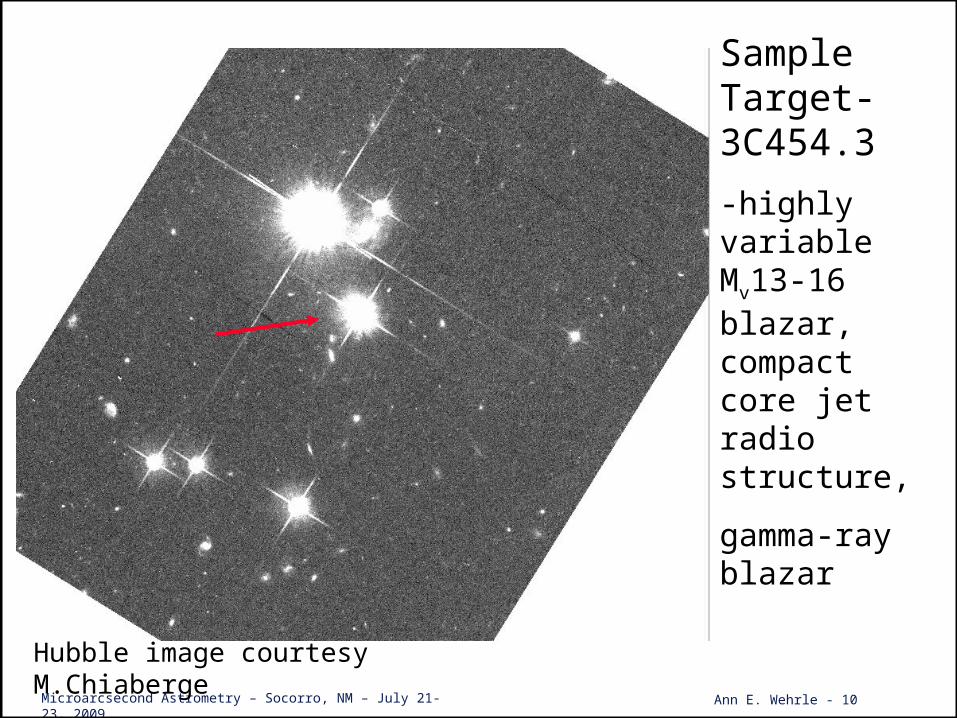
Sample Target- 3C454.3
-highly variable Mv13-16 blazar, compact core jet radio structure,
gamma-ray blazar
Hubble image courtesy M.Chiaberge
Microarcsecond Astrometry – Socorro, NM – July 21-23, 2009 Ann E. Wehrle - 11
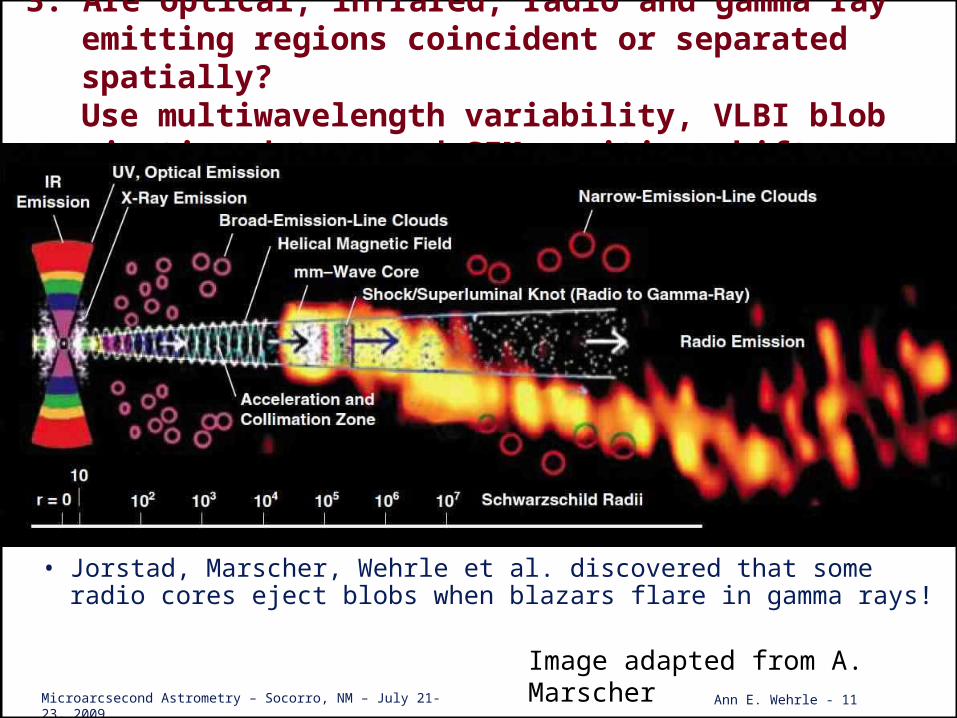
3. Are optical, infrared, radio and gamma ray emitting regions coincident or separated spatially?Use multiwavelength variability, VLBI blob ejection dates, and SIM position shifts
• Jorstad, Marscher, Wehrle et al. discovered that some radio cores eject blobs when blazars flare in gamma rays!
Image adapted from A. Marscher
Microarcsecond Astrometry – Socorro, NM – July 21-23, 2009 Ann E. Wehrle - 12
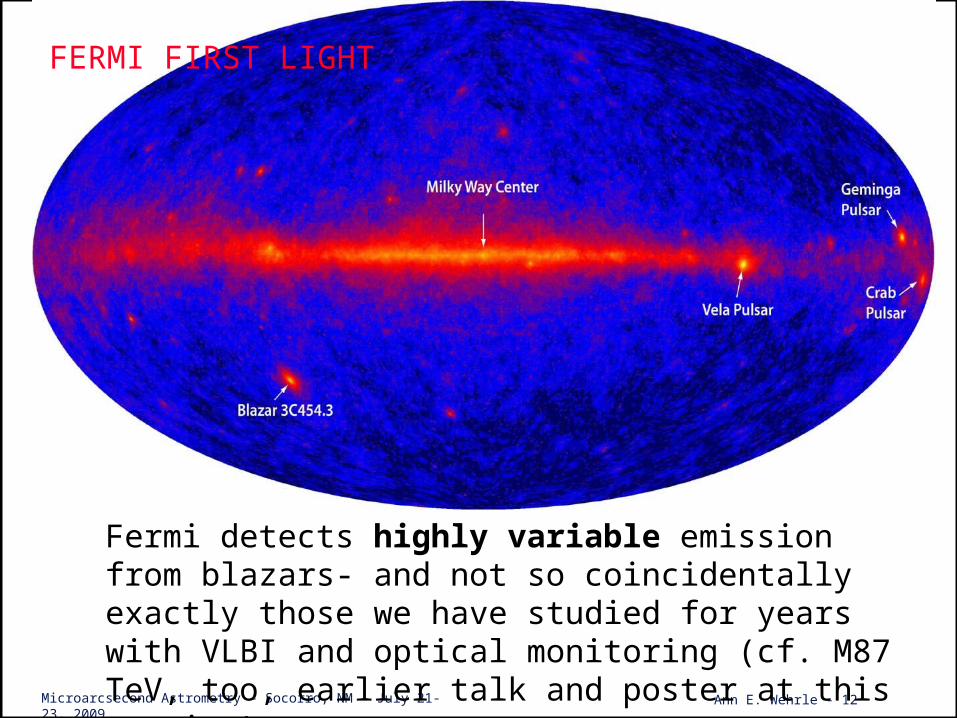
Fermi detects highly variable emission from blazars- and not so coincidentally exactly those we have studied for years with VLBI and optical monitoring (cf. M87 TeV, too, earlier talk and poster at this meeting)
FERMI FIRST LIGHT
Microarcsecond Astrometry – Socorro, NM – July 21-23, 2009 Ann E. Wehrle - 13
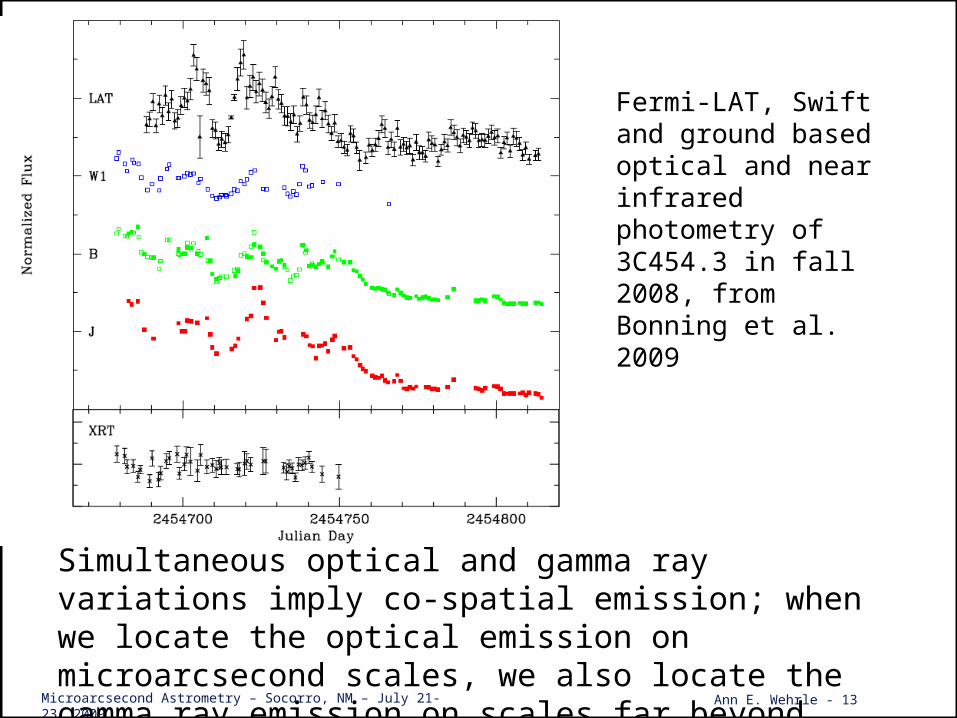
Simultaneous optical and gamma ray variations imply co-spatial emission; when we locate the optical emission on microarcsecond scales, we also locate the gamma ray emission on scales far beyond Fermi LAT resolution
Fermi-LAT, Swift and ground based optical and near infrared photometry of 3C454.3 in fall 2008, from Bonning et al. 2009
Microarcsecond Astrometry – Socorro, NM – July 21-23, 2009 Ann E. Wehrle - 14
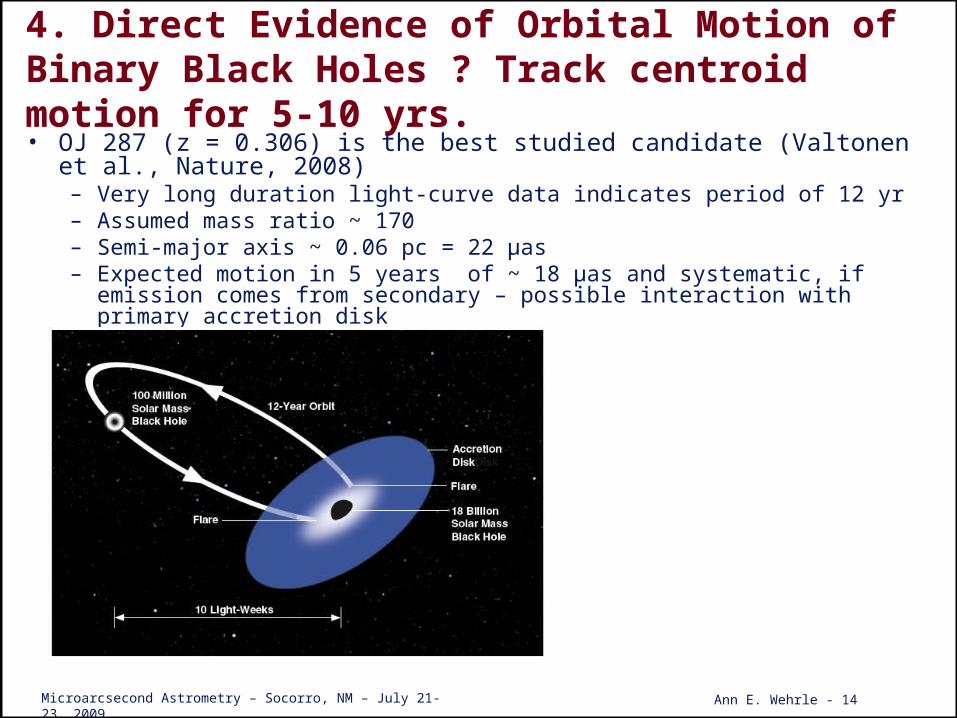
4. Direct Evidence of Orbital Motion of Binary Black Holes ? Track centroid motion for 5-10 yrs.• OJ 287 (z = 0.306) is the best studied candidate (Valtonen et al.,
Nature, 2008)– Very long duration light-curve data indicates period of 12 yr– Assumed mass ratio ~ 170– Semi-major axis ~ 0.06 pc = 22 µas– Expected motion in 5 years of ~ 18 µas and systematic, if emission comes
from secondary – possible interaction with primary accretion disk
Microarcsecond Astrometry – Socorro, NM – July 21-23, 2009 Ann E. Wehrle - 15
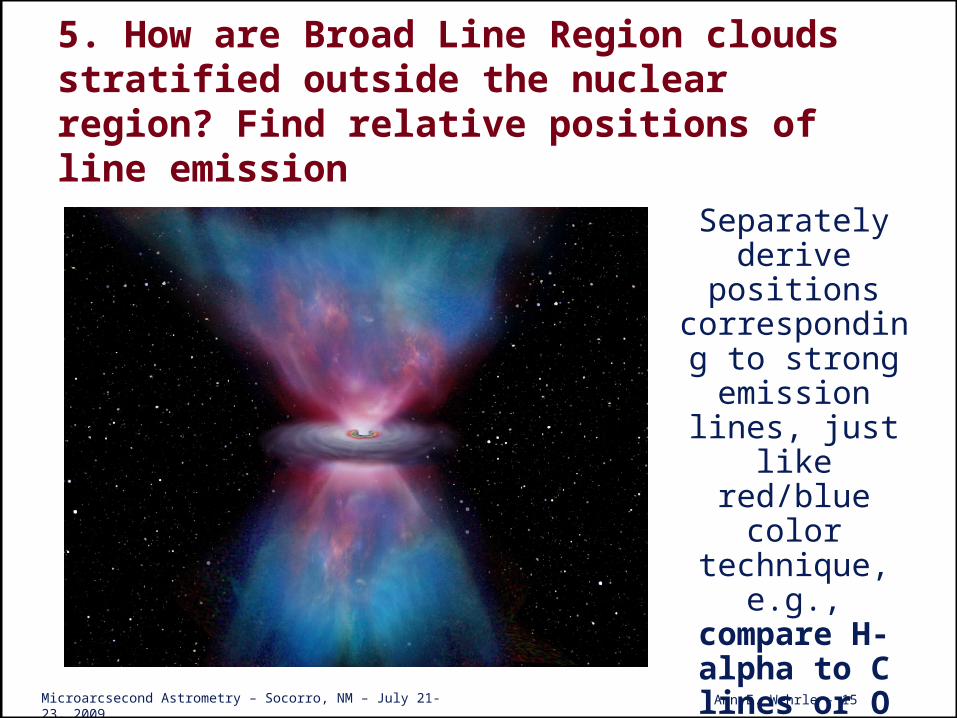
5. How are Broad Line Region clouds stratified outside the nuclear region? Find relative positions of line emission
Separately derive positions corresponding to strong emission lines, just like red/blue color
technique, e.g., compare H-
alpha to C lines or O lines; see
if higher ionization
species are closer to BH
Microarcsecond Astrometry – Socorro, NM – July 21-23, 2009 Ann E. Wehrle - 16
Concluding Remarks• We can use SIM Lite to measure the positions and motions of quasars on scales from 4-16 microarcseconds at optical wavebands.
• These scales are comparable to the best that can be achieved with VLBA and other VLBI astrometry, enabling us to understand the relationship between radio and optical emission.
• If SIM Lite gets high ranking in Astro2010 Decadal Review, and NASA starts funding ramp-up, launch could be as early as 2015
QuickTime™ and aTIFF (Uncompressed) decompressor
are needed to see this picture.
Microarcsecond Astrometry – Socorro, NM – July 21-23, 2009 Ann E. Wehrle - 17
BACKUP SLIDES
Microarcsecond Astrometry – Socorro, NM – July 21-23, 2009 Ann E. Wehrle - 18
Microarcsecond Astrometry – Socorro, NM – July 21-23, 2009 Ann E. Wehrle - 19
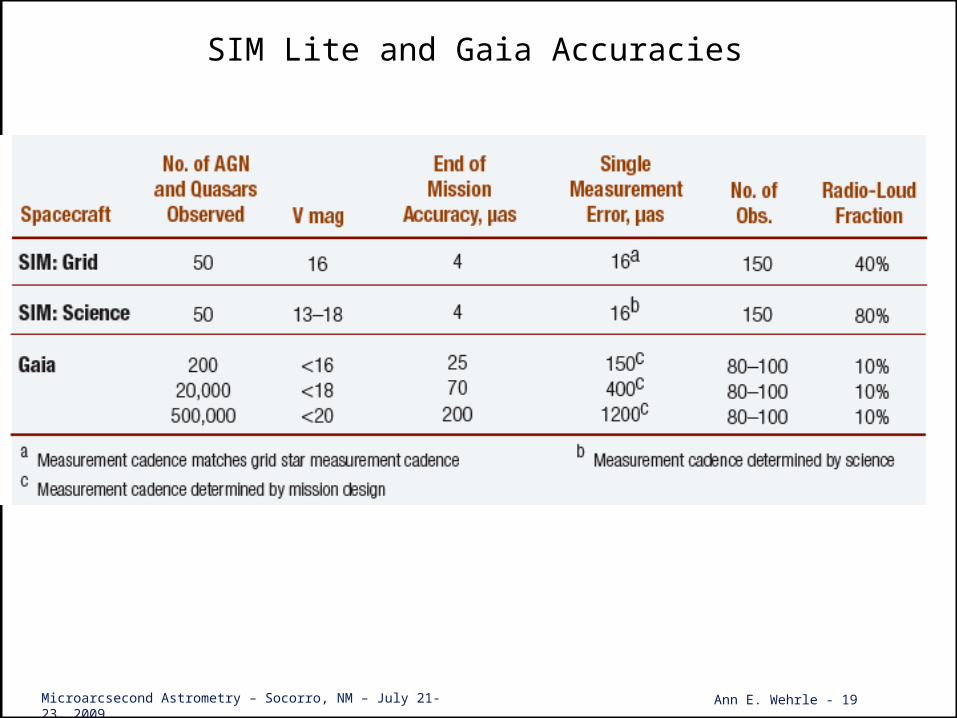
SIM Lite and Gaia Accuracies