Embed Size (px)
Citation preview

GPOPAI ReseaRch GRoup on public policies foR infoRmation access COLAB colaboRatoRy on Development anD paRticipation
UnIversIty Of sãO PAULO
Exploring the impacts of web publishing of budgetary information at the sub-national level in Brazil
The case study of the Cuidando do Meu Bairro (Caring for My Neighborhood) Project in São Paulo
Gisele CrAveIrO JoRGe MAChAdO anDRes MArtAnO tamiRis sOUzA Jutta MAChAdO

GPOPAI
Research Group on Public Policies for Information Access
COLAB
Colaboratory on Development and Participation
UnIversIty Of sãO PAULO
Final Research Report: Exploring the impacts of web publishing of budgetary information at
the sub-national level in Brazil – the case study of the Cuidando do Meu Bairro (Caring for My
Neighborhood) Project in São Paulo
reseArCh COOrdInAtOr
Gisele S. Craveiro
reseArChers
Jorge A. S. Machado
Andres M. R. Martano
Tamiris Jesus Souza
Jutta S. Machado
trAnsLAtIOn
Frank Hanson
desIGn And COver
MOOA Estúdio
COver ImAGe
Leandro Fontana
The funding for this work has been provided through the World Wide Web Foundation ‘Exploring the Emerging Impacts
of Open Data in Developing Countries’ research project, supported by grant 107075 from Canada’s International
Development Research Centre (web.idrc.ca). Find out more at www.opendataresearch.org/emergingimpacts.
Final Research Report: Exploring the impacts of web publishing of
budgetary information at the sub-national level in Brazil. São Paulo,
Craveiro, G. S. et al : 2015.
ISBN:
Xxx. 2. Xxx. 3. Xxxx. 2015.
This is a publication of Colaboratory on Development and
Participation. All opinions expressed herein do not necessarily reflect
the opinion of the ODDC network, the World Wide Web Foundation
or Canada’s International Development Research Centre. Its contents
may be freely used, provided that the source is acknowledged. For ac-
cessing the databases of the quantitative research in an open format,
kindly contact .
Colaboratory on Development and Participation
School of Arts, Science and Humanities
University of São Paulo
Room 17, Bl. 3 Conj. Didático
phone: +55 11 3091-8134
Av. Arlindo Bétio, 1000 – Ermelino Matarazzo
São Paulo – SP CEP 03828-000
Brazil
This work is licensed under a Creative
Commons Attribution 4.0 International License.

Exploring the impacts of web publishing of budgetary information at the sub-national level in BrazilThe case study of the Cuidando do Meu Bairro (Caring for My Neighborhood) Project in São Paulo
reseArCh rePOrt
OPen dAtA In deveLOPInG COUntrIes
Gisele S. Craveiro, Jorge A. S. Machado, Andres M. R. Martano, Tamiris J. Souza, Jutta S. Machado
Gpopai / colab – Colaboratory of Development and Participation – University of São Paulo


Executive summary ................................................................................................. 9
Introduction ........................................................................................................... 12
1 Research Questions and Objectives ...........................................................................16
2 Methodology .........................................................................................................17
2.1 Interaction with the communityof the Citizenship School in the East Zone of São Paulo ...............................................................19
2.2 Interaction with the participants of the Week of Budgetary Transparency ....................................................................21
2.3 Interaction with public officials ......................................................................22
3 Context – Legal framework ......................................................................................23
4 Supply of Open Data ............................................................................................... 27
5 The “Caring for My Neighbourhood” scheme and the geo-codification of public spending ............................................................. 28
5.1 Related Initiatives ......................................................................................... 34
6 Context – The communities .................................................................................... 36
6.1 School of Citizenship of the East Zone – Pedro Yamaguchi Ferreira .................. 36
6.2 Participants of the workshop on budgetary activism .........................................51
7 Project Outputs – Actions and Impact ...................................................................... 54
8 Final Considerations............................................................................................... 62
References ............................................................................................................. 66
Annex 1. Questionnaire Workshop Attendants .......................................................... 65
Annex 2. Interview guide – Workshop Attendants..................................................... 65
Table of Contents


9
Executive summary
the trAnsPArenCy LAw In Brazil forces all public entities to web publish detailed budget data in real time. This law started in 2009, and 2013 was the final deadline for more than 5,500 Brazilian municipalities to comply with this legislation. There is a lack in the literature about how public managers and civil society organizations deal with budgetary data.
In this project, we analyze the uses of a tool Cuidando do Meu Bairro (Caring for my neighborhood) that geocodes expenditures from open budget data. The aim of this project is to understand how access to budget information affects the relationship between civil society and public ad-ministrators in district/municipal level. Following this, we have these re-search questions:
◼ Is budget data geolocation effective for better control and supervision over the use of public resources?
◼ Can this project contribute to the engagement or empowerment of citizens? ◼ Better access to budgetary information can influence the construction of
policy agendas within social organizations?To have the answers, we carried out three workshops gathering around
250 social leaders, grassroots movements and interested citizens. In these occasions budget concepts were explained with the help of the tool. We also interviewed in depth a participant sample and public managers.
Despite the fact that budget data provided by São Paulo municipal ad-ministration has no lat./lon. coordinates, the Cuidando do Meu Bairro tool searches for textual elements that can give some detail about the location of expenditure and generates a geo-coded dataset.
However, many budget activities are described in an aggregated/generic way. This prevents the Cuidando do Meu Bairro being presented as a tool to

10
track and monitor public budget implementation in full. Insufficient data quality could frustrate peoples initial interests and motivation to use the tool. However, very positive feedback was received from the use that could be made of the tool, including among others: invitations to give workshops and to replicate the project in other cities, a MoU with São Paulo public administration and nationwide recognition given by Brazilian media and Google Global Impact Challenge-Brazil prize. Due to these results, we con-clude that budget geo-location is a good strategy to make difficult and/or abstract budget concepts, data and information more accessible to a wider audience.
The project interviews and outputs raise a series of new questions. First of all, the civil society ecosystem and the quality of its components and connections may counterbalance poor data quality supplied by govern-ments. Results suggested the importance of better understanding the role of intermediaries and consumers, as well as their context. Besides the heterogeneity inside each category, their role can interchange depending on the situation, disrupting the static notion of passive-active relationship. In order to understand how actions and impacts are achieved is also impor-tant to understand which are the steps of data transformation, infor-mation and knowledge generation carried out through interaction of particular consumers and intermediaries.
Other important findings come from the supply side of public sector information, represented through an iceberg metaphor. The visible pub-lished open data masks deeper underlying resource, process and cultural issues and constraints which potentially make open data initiatives unsus-tainable. On the other hand, moving towards open data can lead to changes in these underlying and hidden process, leading to shifts in the way gov-ernment handles its own data.
The project has completed its first cycle of development with some important accomplishments and lessons learned both from the demand

11
side (civil society organizations, academia and hacker activist) and the sup-ply side. Using an action research methodology, the authors have worked since data collection and tool development stages: presenting and discuss-ing budget data and public policies with civil society organizations and grassroots movements. In this scenario we could see that open data clear-ly disrupted the Data-Information-Knowledge value relationship, where the value of Data-in-use can be as important as the value of knowledge. Traditionally, consumers are presented with information (statistics) and knowledge, but increasingly consumers or intermediaries want to get ac-cess to the data at the core.
More research work has to be done to fully address the issue of open data impact assessment methodologies, in particular, focusing on the in-termediary ecosystem, rather than starting from data and tracing down.

12
Introduction
PUBLIC BUdGetInG mUst Be accompanied by an action plan to meet the needs and concerns of the people. Its implementation should be as trans-parent as possible so that it can be fully to monitored by society. Since 2000, Brazil has achieved a greater degree of accountability and transparency as a result of the Fiscal Responsibility Law [1], (which was amended in 2009 with the inclusion of the Supplementary Law 131 [2], also known as the Transparency Law). This law stipulates that all Brazilian public entities have to publish detailed budgetary data on the web on a 24-hour basis.
Since 2008 the open data movement has introduced new features re-lated to the way public data is accessed, used and reused [3]. Open govern-ment data (OGD) refers to the release of freely accessible, standardized and readable data. It is designed to make governments more transparent, accountable and efficient. Moreover, it is claimed that it can foster greater civic engagement and open up new business opportunities. Governments, entrepreneurs and civil society organizations all over the world are interest-ed in exploring the potential of open data. As a result, several governments have set up open data portals to release budgetary information and other public datasets on the Internet.
As the Transparency Law is previous to this, there is no reference in it to machine- readability or other OGD principles [4]. The only approximate guidelines in the legal framework state that all Brazilian public entities must provide budgetary data in downloadable datasets; however, OGD has been attracting an increasing amount of attention and some transparency web portals are now compliant with some of the OGD principles [5]. The Government has released hundreds of datasets which form the basis for several stakeholders to use and re-use information. Its aim is to provide
13
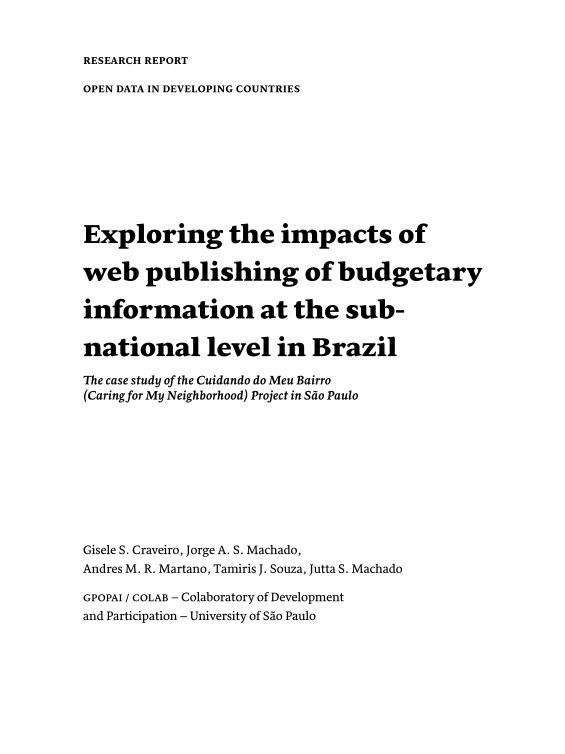
collaborative space for a partnership to be formed with civil society and civic entrepreneurs in the improvement of public services. Individuals and civil society organizations have been developing digital applications to form a wide range of opinions about these data [6].
As well as the data supply, the question of readability and the accessibil-ity of the open data also needs to be addressed, as public information is the cornerstone of an open data ecosystem. But public information alone is not enough to create participation; it is essential to understand the demands of the public, and the growing importance of the kind of citizenship that is empowered by these data. This can be a complex matter, as can be seen in the case of open budget data . Understanding open budget data has to overcome at least, two hurdles : proficiency in the use of technological tools and knowledge of the public accounting domain.
The fact that it might lead to social participation in public affairs is a strong argument in favor of the benefits that can be derived from open government data. But a number of social, technical and cognitive obsta-cles must be overcome before this goal can be achieved . The workshops conducted by the research team - in particular the questionnaires and con-ducted interviews – have brought to light the kind of difficulties involved by showing that civic applications must take account of cultural and social factors as well as technical areas. In this research study, as it will be dis-cussed, there is an awareness that many difficulties must be faced by those who are not “digital natives”1 especially people with a low level of education.
This research seeks to extend the debate on social participation which is made possible by open government data. Although there are numerous works that claim that social participation can be encouraged or enhanced by open data, there is still a lack of studies in the literature that discuss how the social, technical and congnitive barriers can be overcome to achieve this goal. Knowledge apropriation and resignification from open data initia-tives are of greater value, in some respects, than disclosing data in reusable
1 http://www.nossasaopaulo.org.br/institucional/our-sao-paulo-network
14
formats. With regard to budgetary transparency, although there is data supply on government portals, it is not yet understandable by a broader audience.
With regard to the demand for budget data, civil society is generally more concerned about the subnational level (cities, districts, counties) of budget-ary planning and monitoring its execution. This can be explained by several factors that range from local requirements (to include and monitor specific projects that benefit a particular community) to broader concerns ( moni-toring and evaluation of national policymaking). The growing trend towards decentralization is particularly important in Brazil, since the municipal level plays a fundamental role in providing public health and education services.
In view of these factors we have carried out a project called Cuidando do Meu Bairro” (Caring for my Neighborhood, henceforth CMN). This project aims to provide a tool for citizens that can allow them to exercise a degree of social control and oversee individual expenditure on the public facilities of their cities. This involves geocoding the public expenditure of São Paulo City and displaying the findings on a map, which can allow those who are inter-ested to follow how expenses have been used by different individuals. The purpose of the tool is to bridge the gap between the supply and demand side.
On the basis of unstructured and semi- structured information about public spending, some types of expenditure are geocoded and displayed on the city map. The color code used in its pinpoints, reflects the real time spending status, and can thus provide budgetary informtion in a more ac-cessible form to the public. This tool has been used since 2012 by many so-cial leaders and civil society organizations and operates in a network known as Rede Nossa São Paulo (Our São Paulo Network)2. It is employed for more than 600 civil society organizations working in areas as diverse as educa-tion, health, housing, the environment, security and leisure activities.
This case study involves the systematic use of CMN by two different groups to determine if this tool is effective in ensuring a better control and supervision of the use of public resources and if it can foster citizen engage-
2 http://www.nossasaopaulo.org.br/institucional/our-sao-paulo-network

15
ment or empowerment . The first meeeting comprises 200 participants who attend Escola de Cidadania da Zona Leste Pedro Yamaguchi Ferreira (Pedro Yamaguchi Ferreira School of Citizenship), which is a space for knowledge transfer among specialists and social leaders from the eastern neighbour-hoods of São Paulo. It should be mentioned that the districts in the east of São Paulo have about 3 million inhabitants and suffer from serious poverty and a lack of urban facilities.
The second group brings together activists from social movements, po-litical advisors, civil servants and the people involved in policy-making who took part in the 1st Week of Budget Transparency (run by the Chamber of Councillors of São Paulo and the civil society organizations that are involved in budget transparency). The tool was displayed to both groups and some practical activities were suggested which could enable factors involved in the appropriation of the offered concepts and budgetary data to be analyzed.
16
1
Research questions and objectives
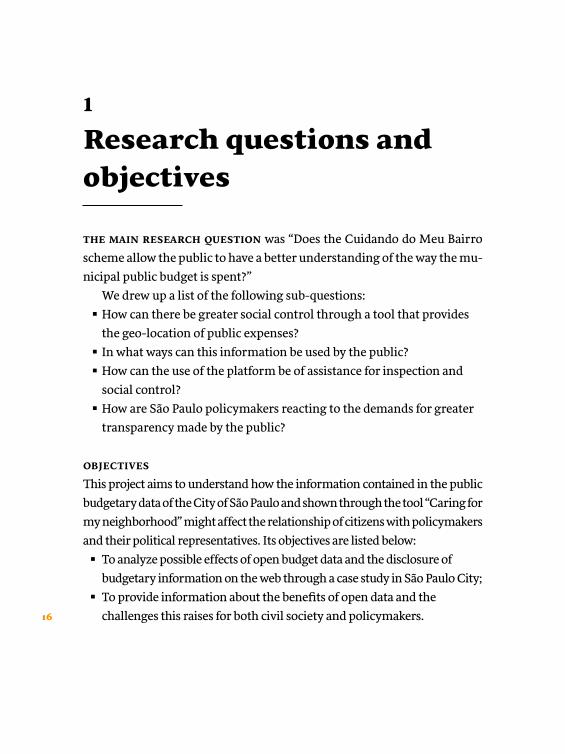
the mAIn reseArCh qUestIOn was “Does the Cuidando do Meu Bairro scheme allow the public to have a better understanding of the way the mu-nicipal public budget is spent?”
We drew up a list of the following sub-questions: ◼ How can there be greater social control through a tool that provides the geo-location of public expenses?
◼ In what ways can this information be used by the public? ◼ How can the use of the platform be of assistance for inspection and social control?
◼ How are São Paulo policymakers reacting to the demands for greater transparency made by the public?
OBjeCtIvesThis project aims to understand how the information contained in the public budgetary data of the City of São Paulo and shown through the tool “Caring for my neighborhood” might affect the relationship of citizens with policymakers and their political representatives. Its objectives are listed below:
◼ To analyze possible effects of open budget data and the disclosure of budgetary information on the web through a case study in São Paulo City;
◼ To provide information about the benefits of open data and the challenges this raises for both civil society and policymakers.

17
thIs seCtIOn OUtLInes the methodology that is being employed to achieve the set of objectives. Section 6.1 describes the activities that have been planned to allow an interaction to occur with the community under study in the Eastern districts of São Paulo, which includes ordinary citizens and some community leaders who act as intermediaries. Section 6.2 exam-ines another studied group comprising members of the audience during the 1st Budget Transparency Week: policymakers, city councillors, activists and political advisors.
The following four groups were selected as the sample for the interviews: ◼ The leaders of the social movements who are involved in the
Citizenship School; ◼ The supervisors responsible for the Citizenship School; ◼ The participants of the event “1st Week of Budgetary Transparency”
held at the Municipal Chamber of São Paulo; ◼ The municipal public officials responsible for policymaking with
regard to access to information (the Municipal Board of Control) planning and budgeting (the Municipal Secretary of Planning, Budget and Management).
2
Methodology

18
specific
impa
cts
context
open data
technical p
latf
orm
sinterm
ediaries
governance setting
acti
on & supply of
& standa
rds
EMERGING OUTCOMES
»Transparency &Accountability»Innovation &
Economic Growth»Inclusion &
Empowerment
DOMAINS OF GOVERNANCE»Political Domains
»Economic Domains»Social Domains
OPEN DATA»About Government»About Companies
& Markets»About Citizens
It should be pointed out that as well as the questionnaires and inter-views, were carried out 2 technical visits and 6 observation visits were made to the Citizenship School.
As well as the interaction with selected groups, a bibliographical re-search study was conducted. The purpose of was to enable us to investigate key contextual information about the legal and political background and determine whether or not there was an offer of open data. It also defined the main actors involved and established if they were consumers, interme-diaries or suppliers. This study is guided by the conceptual framework put forward by Davies et al.[7] and shown in Figure 2.1.
Figure 2.1: Conceptual framework for Open Data in research studies of Developing Countries [7]

19
2.1
Interaction with the community of the Citizenship School in the East Zone of São Paulo
ArOUnd 150-250 PeOPLe tOOk part in the meetings at the Citizenship School; they were mainly from the East Zone districts of São Paulo and the neighbor-ing municipalities of this zone where there are some close ties with the local community. It is for this reason that this group have been referred to as “social leaders”. In reality, they are a heterogeneous group and include people of all ages and different educational levels.
As most of the participants have moved from more faraway places – and thus are not involved because they are living in the surrounding area of the district but because they are interested in political activities – we believe that this collection of individuals who go to the meetings cannot be classified as “ordinary” citizens. It is for this reason that we employ the term “social leaders”. This distinction is important because – although it is impossible to prove this hypothesis – it can be assumed that these individuals have access to information and feel motivated to become more involved in social and political matters than the rest of the public.
After carrying out the workshops with a presentation of how the public budget and the “Taking care of my Neighborhood” operate, questionnaires were handed out to the participants, together with a sheet of exercises to be done at home. From the questionnaire, we seek: 1. to have a better idea of the profile of the participants of the workshop (school-
ing, age, gender, where they live, if they are taking part in any social move-ment, if they have access to the Internet/and with what device,
2. to find out the level of knowledge of the public budget,3. to find out if they know how to use any kind of map,4. to know what information they require from public bodies and5. their name telephone number and e-mail address for a possible interview at
a subsequent date3.
3 The questionnaire can be found in the Appendix of this Report.
20
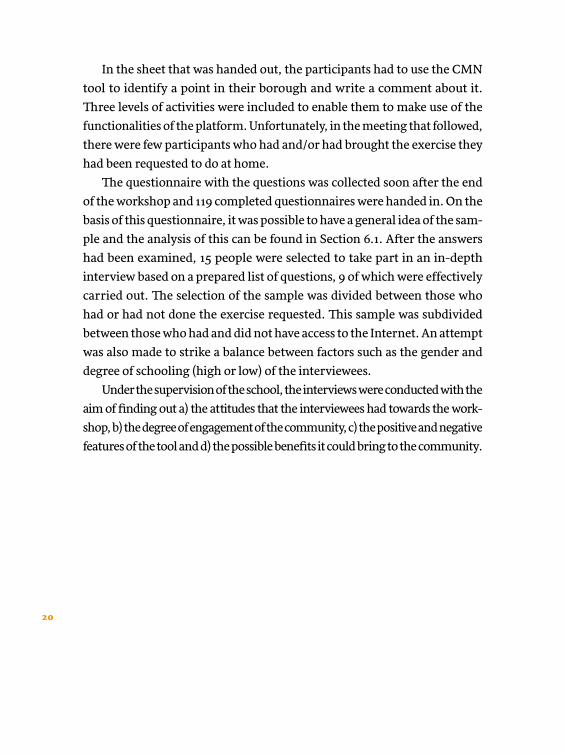
In the sheet that was handed out, the participants had to use the CMN tool to identify a point in their borough and write a comment about it. Three levels of activities were included to enable them to make use of the functionalities of the platform. Unfortunately, in the meeting that followed, there were few participants who had and/or had brought the exercise they had been requested to do at home.
The questionnaire with the questions was collected soon after the end of the workshop and 119 completed questionnaires were handed in. On the basis of this questionnaire, it was possible to have a general idea of the sam-ple and the analysis of this can be found in Section 6.1. After the answers had been examined, 15 people were selected to take part in an in-depth interview based on a prepared list of questions, 9 of which were effectively carried out. The selection of the sample was divided between those who had or had not done the exercise requested. This sample was subdivided between those who had and did not have access to the Internet. An attempt was also made to strike a balance between factors such as the gender and degree of schooling (high or low) of the interviewees.
Under the supervision of the school, the interviews were conducted with the aim of finding out a) the attitudes that the interviewees had towards the work-shop, b) the degree of engagement of the community, c) the positive and negative features of the tool and d) the possible benefits it could bring to the community.

21
2.2
Interaction with the participants of the 1st Week of Budgetary Transparency
the sChOOL Of the São Paulo Municipal Parliamentary Chamber4 and some civil society organizations5 held the 1st Week of Budgetary Transparency6 to show society why it is important for the municipal, State and federal govern-ments to open up their budgets to the public and the extent to which social con-trol is essential to ensure that public funds are wisely spent in the municipality.
As well as lectures, there were workshops with specialists to find out about what experiences governments and civil society had had of scrutinizing and opening up the public budget. One of the practices employed was the use of the CMN tool in a workshop for a group of 20 participants formed of people attached to social movements, civil society organizations and public servants.
The activities planned for this group were as follows: establishing the platform and defining concepts of public budgeting for the community under study, training in the workshop, the completion of questionnaires by the participants and observation of the way they interact with the CMN tool in the guided exercises.
The presentation of the tool primarily consisted of an explanation of the way the public budget was handled and the type of public data used. We also explained the different stages of planning the budget , its importance as well as the practicality of using the tool to exert social pressure.
The main difference between this group and the other one at the Citizen School is that it was possible to carry out practical activities. It was of great value to observe the interaction between the users and detect possible de-fects in the platform used by its target-public. In view of this , the presenta-tions and workshops always have a dual purpose: the appropriation of the platform by the users and the collection of significant information that can be used to bring about its improvement.
4 http://www.camara.sp.gov.br/institucional/escola-parlamento/5 http://retps.org.br/6 http://www5.camara.sp.gov.br/index.php?option=com_content&view=article&id=17558:sema
na-da-transparencia-orcamentaria-seminario-de-abertura&catid=133:eventos-anteriores

22
2.3
Interaction with public officials
IntervIews were COndUCted wIth twO public officials from the São Paulo city hall who play a key role in i) planning, ii) budgeting and iii) ensur-ing transparency and accountability. The purpose of these interviews was to find out how the government regards the use of this tool and what possible effects its use can have on the administrative and political sphere. We also examined the question from the perspective of finding a means of disclos-ing government data, together with factors regarding the planning, pub-lication and transparency of budgetary information in the municipality.

23
3
Context – legal framework
In Art.5º Of the BrAzILIAn Constitution, it is stated that every citizen has the right to receive information from public bodies, whether for personal or collective reasons, within a statute of limitations and with safeguards for information concerning the safety of society and security of the State. If the public body fails to provide this information service, it can be penalized.
In 2000, Supplementary Law 101, also called the Fiscal Responsibility Law, was enacted and laid down rules for the management of the public budget in Brazil and the accountability of the public administration for acts within its area of responsibility. Later on, in 2009 a mandatory obligation to publish material on the web was added through Supplementary Law 131, which stipulates in Art. 48, that transparency about budgetary planning must be ensured through “the release of detailed knowledge about budget-ary control and its implementation under the scrutiny of society by electron-ic means of public access” This applies to all the entities of the Federation in an integrated system of financial administration which must provide at least a minimum standard of quality, as stipulated by the same Law.
Through the Brazilian framework, all the municipalities , as is the case of São Paulo, must publish on the web their invoices and expenses in detail, within 24 hours of the time when transactions related to these took place. The final deadline for all the entities involved to adapt to the new measure, passed on 27th May, 2013. However, according to a survey carried out by the [8] the main cities of Brazil have still not complied with the requirement to provide the minimum standard of information about budgetary control

24
and implementation, which is stipulated in the Law (as will be described in Section 4 with regard to the provision of open data).
It should also be mentioned that access to public information, whether in a reactive or proactive form, was made a statutory condition in the Access to Information Law. It is a law that has sought to reflect the values of the community with regard to their understanding of open data and discloses some of the 8 open government data principles in its wording (as shown in Table 3.1 ) which are clearly set out.
OPen GOvernment dAtA (OGd) PrInCIPLe
LeGAL wOrdInG Of the BrAzILIAn LAw Of ACCess tO InfOrmAtIOn
Non-proprietary“to enable reports to be recorded in various non-propri-etary formats ”
Machine readable “to make automatic access possible through external systems”
Primary “formats used for the structuring of primary, straightfor-ward and authentic information”
Table 3.1 OGD Principles and their transcription in the Brazilian Law of Access to Information.
The Law of Access to Information is a considerable advance but there still remain huge challenges in its enforcement, particularly at a local level. Some Brazilian municipalities have made it mandatory while others have come up against obstacles through a number of factors such as a lack of a system for arranging files or qualified technical personnel and cultural resistance.
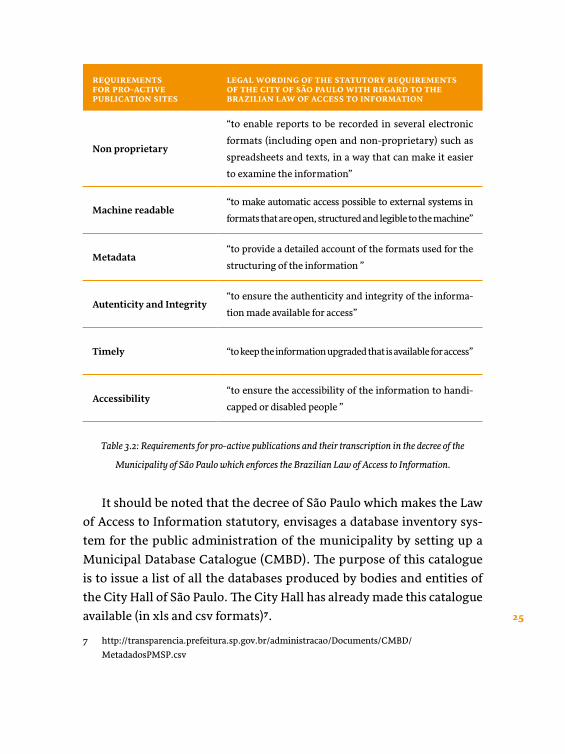
In the case of the city of São Paulo, the national law became a statutory requirement in 2012, approximately one year after it was enacted. In this decree, one can also find the presence of some of the 8 OGD Principles (as shown in Table 3.2)
25
reqUIrements fOr PrO-ACtIve PUBLICAtIOn sItes
LeGAL wOrdInG Of the stAtUtOry reqUIrements Of the CIty Of sãO PAULO wIth reGArd tO the BrAzILIAn LAw Of ACCess tO InfOrmAtIOn
Non proprietary
“to enable reports to be recorded in several electronic formats (including open and non-proprietary) such as spreadsheets and texts, in a way that can make it easier to examine the information”
Machine readable“to make automatic access possible to external systems in formats that are open, structured and legible to the machine”
Metadata“to provide a detailed account of the formats used for the structuring of the information ”
Autenticity and Integrity“to ensure the authenticity and integrity of the informa-tion made available for access”
Timely “to keep the information upgraded that is available for access”
Accessibility “to ensure the accessibility of the information to handi-capped or disabled people ”
It should be noted that the decree of São Paulo which makes the Law of Access to Information statutory, envisages a database inventory sys-tem for the public administration of the municipality by setting up a Municipal Database Catalogue (CMBD). The purpose of this catalogue is to issue a list of all the databases produced by bodies and entities of the City Hall of São Paulo. The City Hall has already made this catalogue available (in xls and csv formats)7.
7 http://transparencia.prefeitura.sp.gov.br/administracao/Documents/CMBD/MetadadosPMSP.csv
Table 3.2: Requirements for pro-active publications and their transcription in the decree of the
Municipality of São Paulo which enforces the Brazilian Law of Access to Information.
26
The CMBD also lays down that the database framework and each of its variables must comply with the standards defined by the Brazilian National Open Data Infrastructure (INDA)8 and, when applicable, to the National Spatial Data Infrastructure (INDE)9. The catalogue is still being prepared and undergoing constant upgrading. In November 2014, it had 4,867 reg-istered bases.
8 http://www.governoeletronico.gov.br/acoes-e-projetos/Dados-Abertos/inda-infraestrutura-nacional-de-dados-abertos
9 http://www.inde.gov.br/

27
4
Supply of Open Data
OUr AnALysIs Is COnfIned to the provision of open data and it is only matters concerning the implementation of the public budget that fall within the scope of this study. With regard to the city of São Paulo, the Municipal Secretary for Planning, Budgeting and Management is the body responsible for supplying information about the municipal budget. Its page on the Internet10 provides information, reports and data spread-sheets about public expenditure. The information was made available in the period from 2003 to 2014, since there is already data available on a daily basis for the current year.
It is worth noting that the data for the period 2003- 2012 is in some pdf files and in a Table in a e.xls format. From 2013 onwards, it can be seen that there is an alternative offer in the .ods format. One explanation for this is the growing demand for open data and the influence of the values of this community on the municipal public administration of São Paulo, which can be observed in the legal framework displayed in Section 3.
Although there has been a degree of responsiveness with regard to the provision of data in non-proprietary formats, other requirements are still not being completely (or even partly) complied with because they are far more complex than simply carrying out the activity in another format. One of these concerns a more detailed account of expenses so that can be monitored in a more satisfactory way or the ability to establish a closer link between objectives and results in determining what has been achieved in the provision of public services of quality. The geocoding of public expenditure to a certain extent addresses both concerns and will be discussed in the next section.
10 http://sempla.prefeitura.sp.gov.br/orcamento/execucao.html
28
5
The “Caring for My Neighbourhood” scheme and the geo-codification of public spending
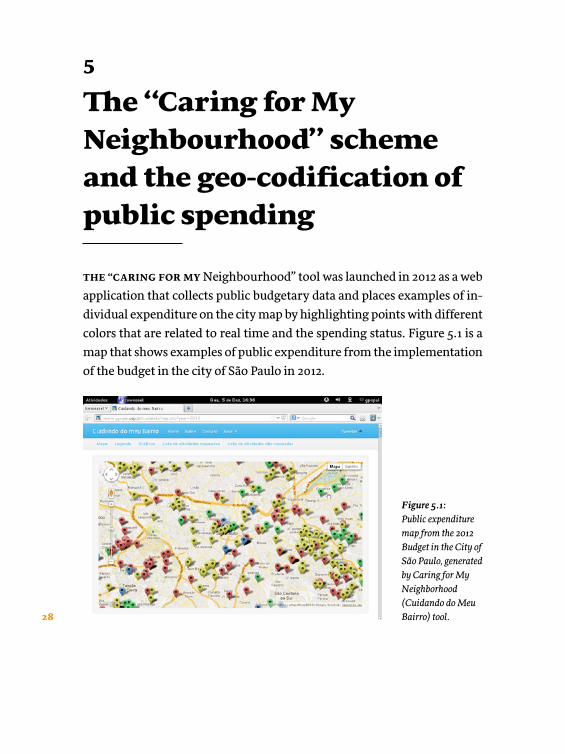
the “CArInG fOr my Neighbourhood” tool was launched in 2012 as a web application that collects public budgetary data and places examples of in-dividual expenditure on the city map by highlighting points with different colors that are related to real time and the spending status. Figure 5.1 is a map that shows examples of public expenditure from the implementation of the budget in the city of São Paulo in 2012.
Figure 5.1:Public expenditure map from the 2012 Budget in the City of São Paulo, generated by Caring for My Neighborhood (Cuidando do Meu Bairro) tool.
29
In the entire period from 2008 to 2013, the tool is employed to visualize the data available when the implementation has been completed on the last day of the year. In the case of the current year, the tool seeks to upgrade the data in the government portal on a daily basis and checks if there has been any alteration in the status of each expense that has been geocoded. The purpose of doing this is to explore the temporal, and not just the spatial character of the use of the budget.
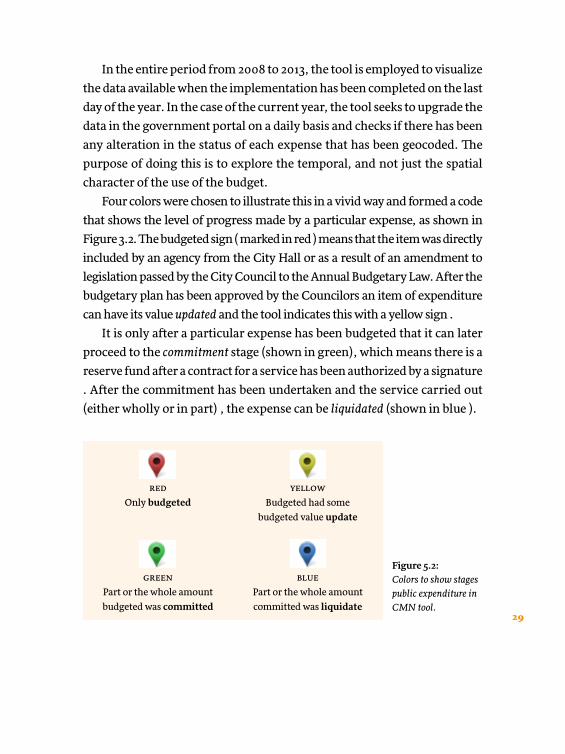
Four colors were chosen to illustrate this in a vivid way and formed a code that shows the level of progress made by a particular expense, as shown in Figure 3.2. The budgeted sign ( marked in red ) means that the item was directly included by an agency from the City Hall or as a result of an amendment to legislation passed by the City Council to the Annual Budgetary Law. After the budgetary plan has been approved by the Councilors an item of expenditure can have its value updated and the tool indicates this with a yellow sign .
It is only after a particular expense has been budgeted that it can later proceed to the commitment stage (shown in green), which means there is a reserve fund after a contract for a service has been authorized by a signature . After the commitment has been undertaken and the service carried out (either wholly or in part) , the expense can be liquidated (shown in blue ).
Figure 5.2:Colors to show stages public expenditure in CMN tool.
ReDOnly budgeted
GReenPart or the whole amount budgeted was committed
yellowBudgeted had some
budgeted value update
bluePart or the whole amount committed was liquidate

30
As well as showing the types of expenditure on the map with their cor-responding stages, the following information is provided to gives details of specific expenses , as shown in the example in Figure 3.3:
◼ Identification number; ◼ Description; ◼ Budgeted, updated, committed and liquidated values; ◼ Agency responsible for each expense; ◼ Agency; ◼ Function - what is the purpose of the expenditure and ◼ Sub-function, more specific information about the purpose of the
expenditure .
Figure 3.3: Example of expenses incurred in Cuidando do Meu Bairro
It should be stressed that there are no latitude and longitude coordinates and hardly any of the expenses include a zipcode in their description. The tool currently analyses the description field for recurring expenses and seeks some feature that can allow geolocation in the analysis of the nat-ural language. Figure 3.4 shows the percentage of expenses (in terms of

31
activities) that were geolocated by the CMN tool for each year in the peri-od 2008-2014 (shown in the black line). In the same chart, information is shown about the percentage of budgetary funds devoted to these activities (which are mapped by the orange line).
20080%
5%
10%
15%
20%
25%
30%
35%
40%
2009 2010 2011 2012 2013 2014 2015
Mapped Activities (%)
Mapped budget (%)
Figure 3.4: Percentage of individual expenses (activities) and funds mapped by the tool.
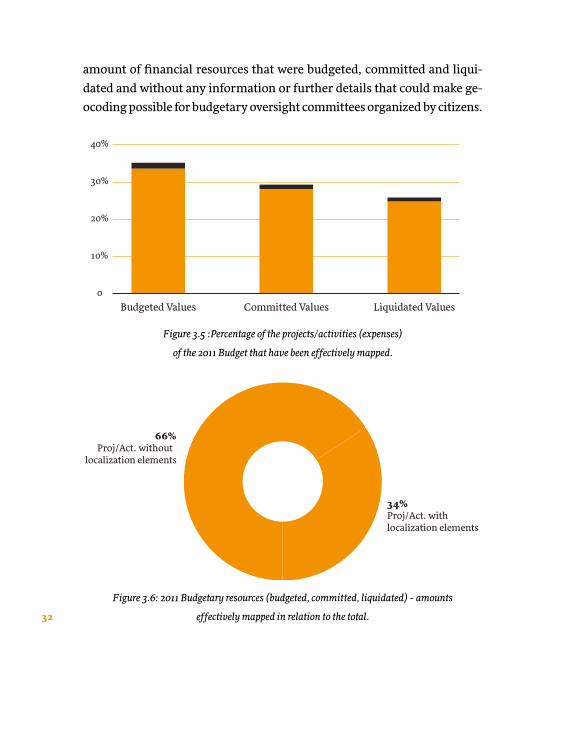
Let us analyze the scenario of quality from the budgetary data found in the best dataset with regard to geocodification in the period 2008-2014, which is the implementation in 2011. The scenario found in the 2011 budget was initially very promising, with 56% of the expenses on features that can be inferred from the geographical location and 34% effectively visualized in the CMN map . Figure 3.5 gives the percentage of expenses (also appointed by project or activity), which have features that allow CMN tool to place them on the map in the City of São Paulo. However, Figure 3.6 shows that the amount of money involved in these expenses is very small when com-pared with the entire public budget at the government´s disposal.
As already mentioned, the survey was able to describe the types of ex-penditure quite well , although they had ¨symbolic resources¨ (budgeted value). On the other hand, there were other expenses which entailed a large
32
amount of financial resources that were budgeted, committed and liqui-dated and without any information or further details that could make ge-ocoding possible for budgetary oversight committees organized by citizens.
40%
30%
20%
10%
Budgeted Values Commied Values Liquidated Values0
Figure 3.5 :Percentage of the projects/activities (expenses)
of the 2011 Budget that have been effectively mapped.
34%Proj/Act. with localization elements
66%Proj/Act. without
localization elements
Figure 3.6: 2011 Budgetary resources (budgeted, committed, liquidated) - amounts
effectively mapped in relation to the total.
33
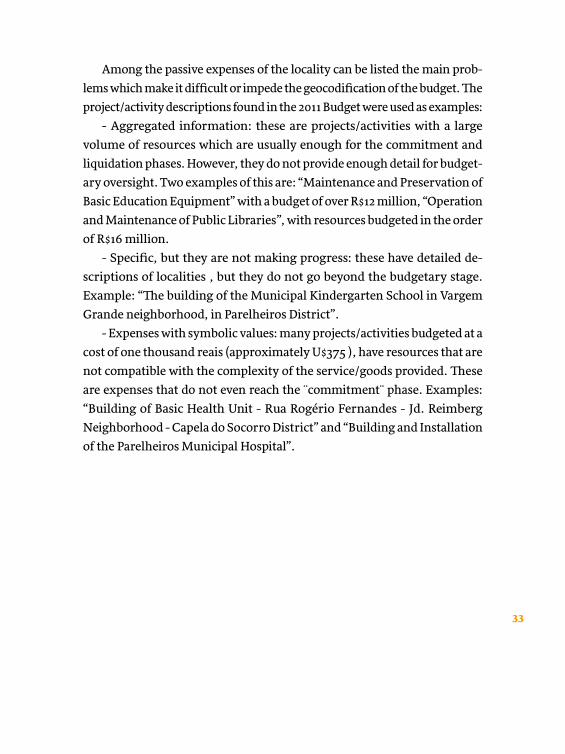
Among the passive expenses of the locality can be listed the main prob-lems which make it difficult or impede the geocodification of the budget. The project/activity descriptions found in the 2011 Budget were used as examples:
- Aggregated information: these are projects/activities with a large volume of resources which are usually enough for the commitment and liquidation phases. However, they do not provide enough detail for budget-ary oversight. Two examples of this are: “Maintenance and Preservation of Basic Education Equipment” with a budget of over R$12 million, “Operation and Maintenance of Public Libraries”, with resources budgeted in the order of R$16 million.
- Specific, but they are not making progress: these have detailed de-scriptions of localities , but they do not go beyond the budgetary stage. Example: “The building of the Municipal Kindergarten School in Vargem Grande neighborhood, in Parelheiros District”.
- Expenses with symbolic values: many projects/activities budgeted at a cost of one thousand reais (approximately U$375 ), have resources that are not compatible with the complexity of the service/goods provided. These are expenses that do not even reach the ¨commitment¨ phase. Examples: “Building of Basic Health Unit - Rua Rogério Fernandes - Jd. Reimberg Neighborhood - Capela do Socorro District” and “Building and Installation of the Parelheiros Municipal Hospital”.
34
5.1
Related Initiatives
the InternAtIOnAL AId trAnsPArenCy Initiative (IATI) which is a mul-ti-stakeholder undertaking that seeks to improve the transparency of aid, has developed an XML standard used to share details about aid projects. The standard is documented11 and data is available12. The standard includes a Transaction element13 which may contain detailed information on financial elment and also a Location element14 which now makes use of the Mapping for Results geocoding methodology to represent information about loca-tion. The tools are available in the AidData platform15. Development Tracker is another platform that has been developed by the UK Department for International Development (DfID) on top of some IATI files.
In addition, another important initiative to analyse and visualize pub-lic spending is developed by the World Bank in the BOOST program16. This seeks to enhance accessibility and the use of scaled data for enhanced expenditure analysis as an input to improve budgeting and outcomes. Geographical tagging is carried out at a more aggregated level to assess the performance achieved in the implementation of public policies rather than tracking individual projects or activities.
In the scientific literature, there is a discussion about budget geocoding in [9]. This paper examines how the display of municipal budget data via web mapping technology allows citizens to visualize how the budget affects their lives and neighborhood. In this study, citizens access Cincinatti’s mu-nicipal capital budget data through a mapping tool for budgeting.
As in the case of Caring for My Neighbourhood tool, a marker or pin was shown on the map for each capital budget project listed in the database
11 http://iatistandard.org12 http://iatiregistry.org13 http://iatistandard.org/activities-standard/transaction14 http://iatistandard.org/activities-standard/location15 http://aiddata.org/maps16 http://wbi.worldbank.org/boost

35
and the markers were color-coded too. However, there is a difference in so far as the colors have another semantic which is more closely related to the spending category. Another important difference is that the infor-mation was not provided on a real- time basis as was the case with the CMN tool. Nevertheless, it can be concluded that displaying data in a map form is a means of removing the barriers that can prevent citizens from processing and understanding budgetary data. Another important point is that this is a valuable way of increasing the importance of budget data by showing citizens the effects that allocations of of the budget can have on their neighborhood.

36
6
Context – The communities
In thIs seCtIOn there will be a description of the groups of users for the ¨Caring for my Neighbourhood¨ tool already discussed in Section 2. Section 6.1 will describe the sample of the participants of the workshops that took place at the Citizenship School in the East Zone. This mainly covers the res-idents in the East region and the neighbouring towns in the metropolitan area. In Section 6.2 there will be a discussion of a group of participants of an event that took place in the central region of the city on the question of budgetary activism.
6.1
School of Citizenship of the East Zone – Pedro Yamaguchi Ferreira
fOr severAL yeArs, the people of the East region of the city of São Paulo have striven to find ways of overcoming problems and difficulties in every social sphere: housing, education, culture, employment, leisure etc. The Citizenship Schools arose as an idea (together with the organization of these groups and movements) and were designed to provide training and polit-ical information. This is because definitive solutions can only be achieved through a series of public policies in which the people fully participate.
In specific terms, the Citizenship School of the East Zone (Pedro Yamaguchi Ferreira) was founded in the second semester of 2011 through the initiative of a leader of this region, Antonio Luiz Marchioni, a Catholic priest, popularly known as “Padre Ticão”. Together with a team of volun-
37
teers, he was involved in bringing topics and lectures to an environment where they could lead to discussions and debates about citizenship, social participation, and public policies of a good standard and supply other infor-mation or data which is not widespread and very often difficult to acquire.
This was a pioneeering venture in the city of São Paulo and on the basis of this experience, other communities from other districts in the city were also encouraged to establish Citizenship Schools or are in the process of do-ing so. The idea is that they should form a web, the Network of Citizenship with different spaces and the chance to reach a wider public.
About 150-200 people take part in the meetings at the Citizenship School in the East Zone and they mainly come from the East Zone districts of the city of São Paulo and the neighboring municipalities of this zone with some involvement by the local community. This is why this group has been assigned the name “social leaders”. In reality, it is quite a heteroegenous group and includes people of different ages and levels of learning.
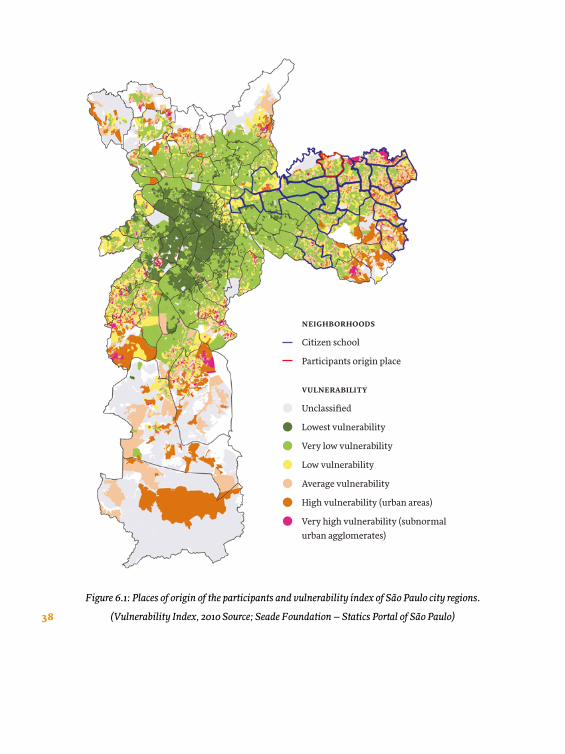
The places of origin of the participants are represented by the districts shown in Figure 6.1, as outlined in blue and red and where the great ma-jority live in districts in the eastern region of the city. The region bordered by the red line includes the church and is where the meetings are held and the regions within the blue contours are the residential areas of the partic-ipants. This information is displayed in Figure 6.2 with the main focus on the East region.
As well as showing the site, the diagram also reveals a social vulnera-bility index for all the regions of the city of São Paulo. The data are from 2010 and its calculations not only take into account levels of income but also a wide range of determining factors involved in the situation of social vulnerability (schooling, health, living arrangements, opportunities for entering the job market and access to public goods and services) [10].
As can be noted in Figure 6.1, the people who live in the most peripheral areas of the city (mainly to the East and South) are those where the indices
38
Citizen school
neighborhoods
vulnerability
Participants origin place
Unclassified
Lowest vulnerability
Very low vulnerability
Low vulnerability
Average vulnerability
High vulnerability (urban areas)
Very high vulnerability (subnormalurban agglomerates)
Figure 6.1: Places of origin of the participants and vulnerability índex of São Paulo city regions.
(Vulnerability Index, 2010 Source; Seade Foundation – Statics Portal of São Paulo)

39
are highest. In our sample, which is highlighted in Figure 6.2, it can be observed that there is a certain heterogeneity because it brings together people who live in regions ranging from very low to very high vulnerability.
vulnerability
Unclassified
Lowest vulnerability
Very low vulnerability
Low vulnerability
Average vulnerability
High vulnerability (urban areas)
Very high vulnerability (subnormal urban agglomerates)
Citizen school
neighborhoods
Participants origin place
Figure 6.2: A detailed representation of the previous map of the East region of the city of São
Paulo relating the places of origin of the participants to the corresponding levels of vulnerability.
40
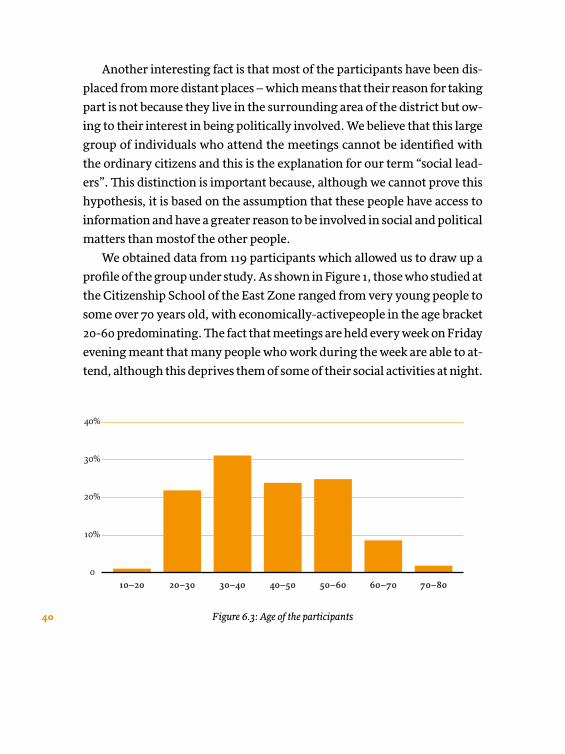
Another interesting fact is that most of the participants have been dis-placed from more distant places – which means that their reason for taking part is not because they live in the surrounding area of the district but ow-ing to their interest in being politically involved. We believe that this large group of individuals who attend the meetings cannot be identified with the ordinary citizens and this is the explanation for our term “social lead-ers”. This distinction is important because, although we cannot prove this hypothesis, it is based on the assumption that these people have access to information and have a greater reason to be involved in social and political matters than mostof the other people.
We obtained data from 119 participants which allowed us to draw up a profile of the group under study. As shown in Figure 1, those who studied at the Citizenship School of the East Zone ranged from very young people to some over 70 years old, with economically-activepeople in the age bracket 20-60 predominating. The fact that meetings are held every week on Friday evening meant that many people who work during the week are able to at-tend, although this deprives them of some of their social activities at night.
10–20 20–30 30–40 40–50 50–60 60–70 70–80
40%
30%
20%
10%
0
Figure 6.3: Age of the participants

41
It is clear from Figure 6.3, that there is a wide variation of ages, with the 20–60 bracket being most predominant; Figure 6.4 shows the pre-dominance of females who comprise more than three-quarters of the total number of participants.
76% Female
23% Male
1181% Other
Figure 6.4: Gender of the participants
There were no illiterate subjects in our sample which means that everybody had some degree of schooling. In Figure 6.5, it can be seen that most of the participants reached the end of High School but did not have a higher education diploma. About a quarter had a complete high-er education and a fifth only had basic education. Although everyone stated that they had some level of education, in the observation visits and interviews, it was clear that some of them had difficulty in writing and reading texts which could denote a degree of functional illiteracy. However, in a general way, the group we came across was quite homo-geneous in this respect.

42
119 59% High School
24% University degree
17% First
Figure 6.5: Level of schooling
Figure 6.6: Access to the Internet
Another serious hurdle is the level of access to the Internet. Although most of them have this, as is shown in Figure 6.6, approximately a third of the sample are not able to use the tools on the web.
118 30% No70% Yes
43
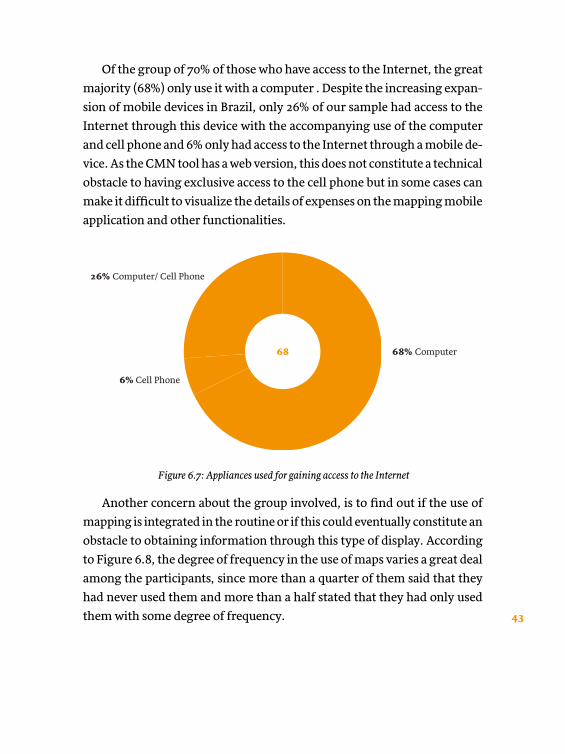
Of the group of 70% of those who have access to the Internet, the great majority (68%) only use it with a computer . Despite the increasing expan-sion of mobile devices in Brazil, only 26% of our sample had access to the Internet through this device with the accompanying use of the computer and cell phone and 6% only had access to the Internet through a mobile de-vice. As the CMN tool has a web version, this does not constitute a technical obstacle to having exclusive access to the cell phone but in some cases can make it difficult to visualize the details of expenses on the mapping mobile application and other functionalities.
68 68% Computer
26% Computer/ Cell Phone
6% Cell Phone
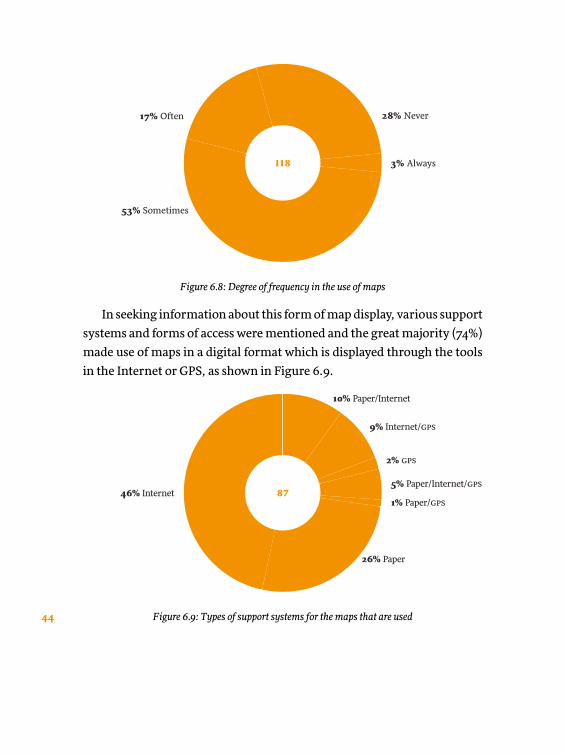
Another concern about the group involved, is to find out if the use of mapping is integrated in the routine or if this could eventually constitute an obstacle to obtaining information through this type of display. According to Figure 6.8, the degree of frequency in the use of maps varies a great deal among the participants, since more than a quarter of them said that they had never used them and more than a half stated that they had only used them with some degree of frequency.
Figure 6.7: Appliances used for gaining access to the Internet
44
118 3% Always
28% Never17% O�en
53% Sometimes
Figure 6.8: Degree of frequency in the use of maps
In seeking information about this form of map display, various support systems and forms of access were mentioned and the great majority (74%) made use of maps in a digital format which is displayed through the tools in the Internet or GPS, as shown in Figure 6.9.
1% Paper/gps
26% Paper
5% Paper/Internet/gps
2% gps
9% Internet/gps
10% Paper/Internet
46% Internet 87
Figure 6.9: Types of support systems for the maps that are used

45
As well as seeking to understand why there are obstacles impeding access to the information shown by the CMN tool, as already discussed (access to the Internet, literacy and the use of maps), an attempt was also made to determine if the group was encouraged to obtain more informa-tion about this issue. The entire sample insisted that they were very keen to obtain information about the public budget and the visualization of ex-penses through the CNM tool. However, the large majority described their previous knowledge of this matter as nil (20%) or a little (76%), as shown in Figure 6.10.
1% Nothing
4% A lot
76% Few 119
Figure 6.10: Knowledge of the public budget .
There was also a group with a considerable degree of political engage-ment with 57% stating that they were active participants in some kind of social movement. In Figure 6.11, we learn that of the main issues which drive this community to take part in social movements, the one most cited is the provision of affordable housing.

46
Figure 6.11: Types of social movements.
3% National Movementof Recyclable Material Workers
12% Others
10% Council
15% Citizenship School
59% Housing 59
The organizers and participants of the Citizenship School gave a warm welcome to the team involved in the meetings to discuss concepts of the pub-lic budgets and the display of the functionalities of the CMN tool. The meet-ings always took place in the evening and lasted for approximately an hour and a half. Owing to time constraints, limited physical space and a complete lack of appliances or a connecting link to provide access to the application, it was not possible to carry out the practical activities with the participants. It was decided to give presentations of the concepts and application screens and later deliver the digital payroll describing the activities that should be carried out at a later time so that they could be prepared for the next meeting.
After the contact with the CMN tool, all the participants showed an in-terest in (and recognized the importance of) using the tool to interpret the data and make it easier to understand and monitor the expenditure of the government. Despite this, the level of calculated returns of the worksheets was low and did not reach 10%. During the interviews, some leaders stated that they had had difficulties owing to a lack of access to the Internet and
47
computers, either because they did not possess them or because they had to depend on public sites to gain access, which meant that it was difficult to monitor the budget.
The workshop and interviews with the leaders proved to be an excellent way to strengthen the mechanisms of participation and social control on the part of civil society but the difficulty in obtaining access or making a connec-tion with the Internet, represented a further obstacle to the use of this tool among the poorest social classes.
Another setback is the fact that the tool does not map the expenses in their entirety. Even when they were warned that the project currently creates a proof of concept with the data made available by the public power and result-ing limitations, some of the participants expected that the CMN team would make requests for information to supplement the map. Another expectation emerged during the informal conversations at the meetings about the role of the team: this could provide information not about expenditure in itself but its quality. Some people even expressed a desire not to understand the public budget in itself but why public services (e.g. the standard of the school or hospital in the district) were in their present condition and what should be done to change this.
This point illustrated the complexity of the problem which goes beyond access to information and the use of technology to increase it, (as the authors relate) and the need to take action to achieve results. In this study, the team working on the tool can be classified as a mediator of information and the par-ticipants as consumers and perhaps through an active (mediator) – passive (participant) relationship and this could explain in a simple way why it is that some people expect the team to look for other data, information and public power positions on their behalf. Nonetheless, before results can be achieved that go well beyond making information available in a more legible or acces-sible form to the general public, a relationship between the actors is required that will very often allow the roles of informers and consumers to be switched.

48
This might also explain the demands expressed by several participants involved in the workshops: the offer of a version of the tool that allowed a channel of exchange and a social platform for discussion of expenditure based on the CNM tool. The current version does not allow interaction or the construction of a community exchange system and many users have shown an interest in the availability of a tool of this kind where theoretically each person can be a prosumer and have articulated social networks.
Another key point is the need to have a better understanding of the dif-ferent groups within a community. In the case of the Citizenship School, although the participants are concentrated in a particular age range of the economically-active section of the public, at different times our attention is drawn to the groups at the different points: teenage students in high school and retired people who are poorly represented in the sample but cited by the participants. One of them, a high school teacher from a school in the district, suggested that workshops should be carried out that are concerned with the teenage public. Since they are a group of digital natives, and some of them often play the role of ̈ facilitators¨ by incorporating new forms of information and communication technology in the family environment, they could have a multiplier effect within the community.
In addition, there is the presence of a group of involved people who have one of the most scarce resources – time. This often enables them to take part in activities organized by the public authorities or civil society during work-ing hours. It is also a group that has experience of life, knows how the district or city has evolved and can add a different perspective to collective activities. Both groups embody features, opportunities and challenges that need to be better understood.
In a general way, we believe the welcome given to the concept and imple-mentation of the tool is a very positive sign but, at the same time, experience has taught us that there is much to learm from the way groups are formed and the dynamics between them which can result in action and change.

49
6.2
Participants of the workshop on budgetary activism
the PArLIAment sChOOL of the Chamber of Councillors, São Paulo, ac-companied by organizations of civil society that act on behalf of transparen-cy, organized a much publicized event which depended on the participation of people concerned with having a better knowledge of the public budget. As well as debates and presentations, the event relied on hands-on activities to explore government sites, tools for handling budgetary data and civic applications. One of these was the CMN tool.
Among those enrolled, 20 participants were selected who, as well as be-ing given the concepts of the budgetary cycle, had contact with the tool and its functionalities by being set exercises at different levels of complexity. In this experiment, apart from completing a questionnaire about their profile, this group made it possible for observation to occur when they carried out the activities with the support of the tool – something that was not possible when working with the group from the Citizenship School of the East Zone.
Figure 6.12: Ages of the participants.
10–20 20–30 30–40 40–50 50–60 60–70 70–80
5
4
3
2
1
0
nú
me
ro
de
pe
ss
oa
s
f a i x a s e t á r i a s

50
At first, the profile of the participants was traced and by means of the data obtained, it was possible to build up a portrait of the information that was picked up. All of the participants had been undergraduates at university and the majority were male (78%). The age range of the participants was concentrated bewteen 20-50, but included 2 people over the age of 60, as shown in Figure 6.12
Everybody in this group had access to the Internet which for the majority of the participants (77%) was through multiple devices such as computers, the telephone, cell phones and Tablets, as shown in Figure 6.13.
Figure 6.13: Devices used to obtain access to the Internet.
11% Cell phone / Computer / Tablet
6% Cell phone / Computer / Notebook
33% Computer
50% Cell phone / Computer
18
On being questioned about the frequency of their use of maps, 39% re-plied that they always use them and 33% that they often use them. In other words, for more than two thirds the use of maps was fully integrated into their daily routine (Figure 6.14). Everyone made use of the digital mapping available on the Internet either in an exclusive way (56%) or else combined with other support systems and/or devices (Figure 6.15)

51
Of the participants, 78% declared that they were directly linked to some movement to improve the standard of living of the people; among these are the LGBT movements, the participative council, the parties and local action.
33% O�en
33% Always
28% Sometimes
18
Figure 6.14: Degree of frequency in the use of maps.
Figure 6.15: Types of maps.
17% Paper / Internet / GPS
11% Paper / Internet
17% Internet / GPS
56% Internet 18

52
However, although these people were connected to social movements, 89% of those who filled in the questionnaire stated that they had little or no fa-miliarity with budgetary data (Figure 6.16).
83% Few
6% Nothing
11% A lot18
This group had an expectation that they would be able to obtain a wide range of information from public bodies but gave priority to the execution of the budget (both expenses and receipts), government actions and the de-tails of public policies. They gave a very warm welcome to the tool and made requests and asked questions during its use which helped in its subsequent improvement. The first activities involved finding a reference-point for a particular expense on the map and sought to obtain further relevant details. They all achieved success and were regarded as easy to carry out. The ques-tions were geared towards obtaining data about upgrading public informa-tion and in the case of a particular task, finding out what was the origin of the request and the stipulated deadline for its execution. This was information that could be obtained in the contracts but the CMN tool is still unable to make this integration with the dataset.
Figure 6.16: Knowledge of the public budget

53
Another activity that was requested was to use the tool to make a down-load of the spreadsheet of expenses filtered by the agency responsible and to carry out some kind of simple analysis (such as calculating an average) above this dataset. Although regarded by some people as not being very complex, others assess the average because they need some kind of support in the ex-ecution. The reason for this is that at first, they do not understand that they must choose some kind of separator (in this case it was the comma) for the data stored in the file of the CSV format. It can be seen that the choice for making an open format available can sometimes conflict with the fact that someone is unfamiliar with the interface of some electronic spreadsheet pro-grams and perhaps this explains why the public information is often made available in multiple formats (open and proprietary) in the government sites.
The whole group had a very good impression of the presentation of the public budget on the map as the CMN tool stimulated them to continue and make improvements. Some of the participants revealed a desire that there should be suitable tools that can explore the budget with specific public pol-icies such as health, transport and education.
Several suggestions for its use by this group involved making the tool lighter in its load and faster and also to have a search tool for specific address-es with more explanations in a colloquial language when using the terms which were implemented and made available when using the online version.
Other very sophisticated suggestions included making an integration with other public datasets such as the following: contracts and planning goals. Thus, as in the group studied previously, there also appeared to be an expectation that the public budget would be increasingly “concrete”, and allow values and cyphers to be employed for assessing the quality of the public policies which could provide better services to the public in a more cost-effective way. In this sense, the geolocation of public expenditure was considered to be very useful in allowing a better monitoring system for a much wider audience.
54
7
Project Outputs – Actions and Impacts
dUrInG the PerIOd when thIs wOrk was carried out, we sought to un-derstand the features involved in both the opening up of government and its appropriation and resignification. In the attempt to establish certain patterns based on the experiments conducted or simply to visualize the stages, this study employed elements of a theory of change. A theory of change approach can sharpen the planning and implementation of an ini-tiative [11] and this work will consider inputs, activities, outputs, outcomes and impacts as definitions from Outcome Mapping [12].
Adapting a metaphor taken from the “fish soup preparation” story [13] there is a relationship summarized in Figure 7.1. In this model, in the first stage some resources (the ingredients) are needed so that through certain activities (procedures of changing the ingredients) it can be possible to achieve some desired outputs (e.g. the meal). The practice is transmitted and perpetuated in a community (the outcome) and it is from this that its effects on the standard of living of those involved is derived. It should be stressed that the essential role of the actors, based on their own re-sources, activities and interaction, has an influence on the existence of the outcomes.

55
Data, information, legal framework etc
Transformations (data, information, knowledge)
Ex: improved budget transparency,more datasets avaiable etc
Ex: be�er accountability, more/be�er midia coverage etc.
output
outcome
IMPACT
activities
resources
inte
rm
edia
rie
s a
nd
c
on
sum
ers
inte
rac
tio
n
Figure 7.1: Steps to open data impacts.
We believe that the didactic simplicity of this model assists the commu-nication of the features which are not always so well defined, particularly in a scenario where the reactions are not attached as if in a chain and are also of great complexity both in the number of actors and their relationships with each other.
This section also seeks to show the main reflections and learning out-comes obtained throughout the appropriation of the data, the building of other artifacts based on them (software, news stories and public planning policies) through the way they perform - either in isolation or combina-tion - with other stakeholders (Figure 7.2). Despite “Data” is in the center of diagram, it does not mean that the central feature of the processes, in fact we have learned from our experience that main element is the relation-ship and actions represented by the arrows. The transformations among Knowledge, Information and Data can only be produced in the interaction with the stakeholders.

56
Figure 7.2: Relation of the activities with the given transformation, Information and knowledge.
Actions and ImpactsSupply of Open Data
IntermediariesConsumers
knowledge
informationdata
Having said this, we will report some of the main outputs of our project, beginning with one or two baselines which are as follows: the relationship of the team, basically comprising open data advocates, with civil society organizations and social movements operating on both a national and lo-cal level. They included meetings, special events, workshops, debates and various opportunities for exchange where we could talk about open data and decoding budget lingo. In particular we could learn about a) its ways of behaving, b) its nuances and c) the characteristics of the different groups in a movement, as well as its driving-force and interests.
Among these organizations and movements, we would like to draw at-tention to the social movements of the East Zone of the city of São Paulo and the Our São Paulo Network (Rede Nossa São Paulo). This features prominently in the local region, together with the Institute for Socio-Economic Studies (Inesc), which for the last twenty years has worked with transparency on the public budget and related it to human rights. It has also worked in partnership with Inesc on the study “Measuring the impact of open data on Brazilian national and sub-national budget transparency

57
websites and its effects on people’s rights” in the context of the Open Data network in Developing Countries. Figure 7.3 represents one of the periods of the joint work undertaken by the team and Inesc during the workshop of the Citizenship School of the East Zone.
Figure 7.3: Work with the Inesc team on the workshop concerned
with the public budget and human rights.
We believe that it is only through an “ecosystem” of organizations and individuals operating in the network with distinct and complementary skills, that they can confront the challenge of making budgetary informa-tion more accessible to a wider public and combining it with measures to combat corruption, improve public services and make administration more efficient. One of the key actors for making information accessible and ob-tainable is the media. During the period, we were included in national and

58
Figure 7.4: one of the topics carried out with the support of the “Caring for My Neighbourhood”
tool with the title “Who has seen the color of money”
local media outlets, on radio programs, TV, newspapers and blogs not just to speak about the tool in itself but also to support the building of mate-rials, as illustrated in Figure 7.4. In two pages from the newspaper, Jornal Diário de São Paulo, a journalist made use of the CMN tool to contrast the situation of two districts of the city: one which was granted more resources and another which received less.
DIÁRIO DE S. PAULO - DOMINGO / 7 DE DEZEMBRO DE 20142 DIÁRIO DE S. PAULO - DOMINGO / 7 DE DEZEMBRO DE 2014 3
dia a diaORÇAMENTOMUNICIPAL
dia a dia
gOQUEÉ ISSO?
OCuidandodoMeuBairro(cuidando.org.br) éumaferramentaparaopúblicoexercerocontroleefiscalizaçãodosgastosrealizadosemequipamentospúblicosdacidadeemcadaregião, apartir daanálisedoOrçamentomunicipal
BOMINVESTIMENTO
“Este foi umdinheiromuito bem empregado.Dependo do hospitalparameu tratamentode radioterapia”_Nilo Pereira, aposentado
HOSPITALAPROVADO
“As instalações estãoboas. O investimento emsaúde é omelhor queexiste. Cumprimentoa Prefeitura”_Heronides Silva, aposentado
Fernando [email protected]
Estudo feito pelo portalCuidandodoMeuBair-romostra que aPrefei-tura de SãoPaulohon-rou investimentospre-
vistosnoOrçamentode2014noCentro, enquanto ignorouobrasorçadasnaZonaLeste.OCuidando doMeuBairro é
umaferramentacriadaporpro-fessores daUSP (Universidadede SãoPaulo) para incentivar apopulação a fiscalizar a execu-ção doOrçamentomunicipal
nobairroemquemora.Segundoosorganiza-doresdoportal,oes-
tudo mapeou
apenas 12,2% das despesasmunicipais, porque em87,8%delas nãohaveria transparên-cia da Prefeitura para saberexatamente onde e se o di-nheiro foi efetivamentegasto.Segundooestudo, nos 12,2%
mapeados foi possível verificarque a gestãomunicipal orçoueliquidouR$ 1,065milhão paraobrasno InstitutodoCâncerDr.ArnaldoVieiradeCarvalho,queficanoCentro,paraaquisiçãode30novosleitosereformadetodaaunidadehospitalar.“Foi umdinheiromuito bem
empregado pela Prefeitura”,disse o aposentadoNilo Perei-ra, de 65 anos, que faz radiote-rapia nesse hospital para tratarumcâncer de próstata.Mesmaopinião temoutroaposentado,Heronides da Silva, que tam-bém se trata gratuitamente deumcâncernomesmohospital.“O melhor investimento é
aquele feitoemsaúde.”Já no bairro de Er-
melinoMatarazzo,naZonaLes-te, foramorçadasobrasnovalordeR$860milenenhumcenta-vo foi de fato liquidado, ou seja,pago pela Prefeitura. Umadasobras previstas era a reforma ecolocaçãode equipamentosdeginásticanapraça localizadanaRuaBarradeSantaRosa, esqui-nacomaRuaCaiçaradoRiodoVento.“Aquinãotemlazerena-daparafazer,por issoquemuitagente vai para o caminho dasdrogas”, disse o estudanteCai-queGonçalves,de20anos.Mesma opinião tem a estu-
dante Karina Gonçalves, queparticipoudeumabaixo-assi-nadopedindoparaa subprefei-tura do bairro equipar a praçacom aparelhos de ginástica.“Eles prometeramque iam fa-zer,masnãofizeramnada.”DeacordocomoObservatório
Cidadão, da Rede Nossa SãoPaulo, ErmelinoMatarazzonãotemnenhumaunidadepúblicadeesportee lazer.
Site Cuidando doMeu Bairroanalisa investimentos da
Prefeitura orçados em 2014 eencontra lugares bematendidos e outros que
foram totalmenteesquecidos
RESPOSTA DAPREFEITURAA Prefeitura informou que o valor orçado para ser gasto em 2014 era deR$ 50,5 bilhões e o liquidado, ou seja, efetivamente gasto, foi de R$ 35bilhões. “O orçamento de 2014 previa uma maior arrecadação de IPTU,que não se efetivou dada a decisão da Justiça de suspender os efeitosda Lei de Reajuste da PGV (Planta Genérica de Valores )”, informou aassessoria da Secretaria Municipal de Planejamento. “Mas a efetivarealização de despesas neste ano ficou comprometida não só pelaredução da receita com o tributo, mas principalmente com aimpossibilidade de alavancar recursos federais.” A secretaria informouque os repasses federais forammenores do que o esperado porque aPrefeitura perdeu a sua capacidade de contrapartida exigida noscontratos. Isso também aconteceu pela perda de receita com o IPTU, apartir da decisão judicial, explicou a secretaria.
AnáliseÁlvaro Guedes, professor deadministração pública da Unesp
‘Essa gestãoprioriza o Centro’n O Orçamento não é uma cami-sa de força. Ele deve orientar osinvestimentos futuros do agentepúblico. Agora, ele sem dúvida vairefletir o que o gestor realiza. Vaimostrar aquilo que é e não é prio-ritário. Como há restrição de ver-bas, o gestor escolhe prioridadese a execução do Orçamento é umespelho disso. Em São Paulo, aPrefeitura tem dado prioridade aintervenções no Centro, como re-flexo de ações dos movimentossociais, e o estudo mostra isso.
Fotosde
LéoBarrilari/Diário
SP
PRAÇA
“Assinamos umabaixo-assinado pedindo para aPrefeituramelhorar apraça. ColocaramnoOrçamento,mas nãofizeramnada”
_Karina Gonçalves, estudante
SEMLAZER
“Não tem lazer aquineste bairro. E quandoprometem fazer algumacoisa não sai do papel.Por isso tem tanto jovemnas drogas”
_Caique Gonçalves, estudante
Especialista em ciência dacomputação, Gisele Craveiro éuma das autoras do portal Cui-dando do Meu Bairro.
DIÁRIO_ Como surgiu a ideiade montar essa ferramenta?GISELE CRAVEIRO_ A ideia éoferecer ferramentas para que asociedade possa conhecer me-lhor a temática do orçamentopúblico, exercer o controle efiscalização dos gastos realiza-dos em equipamentos públicosda cidade e promover açõesconcretas no seu bairro. Por es-semotivo, o projeto foi batizadode Cuidando do Meu Bairro.Por que vocês conseguiram
mapear apenas 12%das despe-sas da Prefeitura?Porque falta transparência. Namaioria das despesas não épossível saber exatamente oque foi feito, pago e realizado.
ENTREVISTAGisele Craveiro_professora da USP
‘Falta maistransparência’
n O Orçamento da Prefeitura pa-ra 2015 prevê cerca de R$ 51,3bilhões em arrecadação outransferência de recursos para opróximo ano. Dentro da propostade Orçamento para 2015, cercade R$ 7,8 bilhões estão previstospara projetos ou novas obras.Os gastos em áreas como a
educação preveem um aumentode 7% em relação ao projetadopara ser utilizado até o fim de2014; na saúde, 17%; e mobilidadeurbana, 37%. Moradia subiu 47%e drenagem urbana, 48%.Os investimentos em 2014 de-
vem chegar a R$ 4,4 bilhões, dosR$ 10,7 bilhões inicialmente pre-vistos na proposta orçamentária.A revisão se deu em razão dasuspensão da atualização da
Planta Genérica de Valores , queincide sobre o cálculo do IPTU(Imposto Predial e Territorial Ur-bano). “Mesmo assim, o investi-mento projetado para até o fimde 2014 será maior que o do anoanterior, de R$ 3,6 bilhões”, in-formou a Prefeitura.A proposta orçamentária de
2015 prevê R$ 4,4 bilhões detransferências de recursos fede-rais para projetos. Segundo o se-cretário de Finanças, MarcosCruz, a busca por parcerias econvênios tem aumentado o vo-lume de repasses da União parao município. “ Enquanto em 2012,cerca de R$ 1,9 bilhão do orça-mento vieram de repasses fede-rais, em 2014, foram cerca deR$ 3 bilhões”, disse o secretário.
Orçamento2015deveserdeR$51bi
The relationship with organizations by means of transparency, the open data movement and the visibility that the tool has begun to acquire, has led to the municipal public administration inviting the team to replicate the tool within the transparency portal of the city of São Paulo. In Figure 7.5, we can see representatives of the main departments involved: the Municipal Office of

59
the Comptroller General, the municipal departments of Planning and Finance and the Municipal ICT department. Three meetings were held with the main government bodies directly responsible for supplying better quality data for budgetary execution.
It was a great opportunity to explain the demand for better data; it began with the format and the chance for automatic extraction as well as to obtain a more detailed account of public expenditure and information that could enable this to be visualized in the territory. By expressing this demand and putting the ¨Caring for My Neighborhood¨ application as a proof of concept, the policy-makers were convinced of both the importance of improving the legibility of budgetary information for an uninitiated public and admitting that not even the management had a detailed and systematic knowledge of the expenditure.
Although they reached the conclusion that it was not possible to replicate the tool at the time of these meetings, they unleashed a series of measures that affected the whole public administration of the municipality. The Secretary for Planning and Budgeting introduced a new area in the accounts records called “detailed accounting”. It is expected that in the near future, (2015), the budg-etary data will allow a better analysis to be conducted of the distribution of funds throughout the city, both for the municipal public administration itself and for the whole of citizenship.
Figure 7.5 Meeting between the team and the repre-sentatives of the main government bodies directly responsible for supplying better quali-ty open budget data.

60
The meetings mentioned were also a valuable source of knowledge on the supply side. We were able to have an idea of some of the challenges involved in both supplying more public data in an open format and also to supply new data. This is certainly not a trivial matter because it concerns the evolution of a data-set which today is essentially designed for those who have a minimal domain of public finance and others who are beginning to meet the demands for better communication and the “tangible features” of public expenditure (geocoding, the relationship between goals and planning, quality indicators etc.).
In the case in question, it can be seen that for a new field to be able to exist within a table, huge human and material resources will have to be mobilized and new processes must be created or altered, which leads to a questioning of the prevailing culture. We represent this situation by employing the metaphor of the iceberg shown in Figure 7.6.. The amount of visible information is what is made available in a proactive or reactive form by the public power. It should be underlined that only a small portion of the tip of the iceberg can be considered to be open data. Below the surface of visibility, there is a complex cast of actors, interests and resources that must be fully exploited for a better management of the information and data.
ResourcesProcesses
Cultural ChangesPower Relations
supply ofopen data
context
specificgovernancesetting
technicalplatforms &standards
information disclousure(re-active and pro-active)
public administration
Figure 7.6: The metaphor of the iceberg – inner challenges to public administration.

61
At the same time, the members of the team supported the creation of the first chapter of the Open Knowledge Foundation outside of Europe, (Open Knowledge Brasil) in 2014. Like this, the ¨Caring for My Neighborhood¨ application, which also had its open code, obtained institutional support, the hosting of an .org domain (before this, it had been essentially linked to the research group at the University of São Paulo) and also a community of developers. Several contacts were made with individuals and organizations in other cities in Brazil who were interested in replicating the tool for their local setting.
Open Knowledge Brasil was also devoted to projects for visualizing public expenditure on the basis of the Open Spending tool. Together with ¨Caring for My Neighborhood¨, it had a portfolio of open data and budget projects, when it showed the plans for the Gastos Abertos (Open Expenditure) Project in the Google Impact Challenge which was designed for a visualization platform of receipts and expenses of the federal, State and municipal budgets of São Paulo. 750 other projects carried out by civil society organizations throughout Brazil competed with the Gastos Abertos and it was a great achievement to be among the 10 finalists and receive fur-ther recognition, support from consultants and the prize of 500 thousand Brazilian reais.
FiguresOn the right - the team The opening of the award ceremony for the Google Impact Challenge. On the left – the “Caring for my Neighborhood” team and the Director of Open Knowledge Brasil.

62
8
Final Considerations
thIs stUdy hAs sOUGht to introduce some ideas based on the experience of examining the expenses involved in the open data of the public budget. It also addresses the question of how a tool is made available for geocoding a part of this data and displaying it in a mapping presentation supplied by an application called ̈ Caring for my Neighbourhood¨. An assessment has also been made to determine to what extent the concept has been accepted and for the implementation of this tool through activities carried out together with social movements, civil society organizations and policymakers in the city of São Paulo.
In this way, the study aimed at examining key elements to determine whether some of the alleged benefits of open data (such as greater trans-parency, accountability, and the self-empowerment of citizens) could be attained through this initiative. An analysis was conducted of some of the activities carried out with groups that had distinct profiles and characteris-tics in the following areas: variations in the degree of access to the Internet, educational levels, and the availability of time and skills.
Although we noted some obstacles that impeded a consistent use of the tool by a significant proportion of our sample, there was unanimity in the positive feedback about the geocoding of the public budget and the tool which displayed information on the map of the city. The ¨demand side¨
63
not only encouraged further initiatives of the same kind but also required that more information be made available in an integrated way, particularly with regard to the quality of the expenditure and public services supplied.
Moreover, on the side of data supply, the challenges were just as great. Although the data provided by São Paulo municipal administration has no latitude and longitude coordinates, the tool searches for textual elements that can give some details on how to locate the expenditure . One of the best datasets, (2011 São Paulo budget execution), shows that although many budget activities have features that need to be detected, the allocated budget is spent on activities described in an aggregated/generic way. Owing to this limitation, this tool could not be regarded as a means of tracking and monitoring the public budget.
We found that the insufficient quality of the data had an adverse effect on people´s interest and motivation when using use the tool. However, very positive feedback was received including the following: many invitations to give workshops and to replicate the project in other cities, a MoU with São Paulo public administration and the nationwide recognition given by Brazilian media and Google Global Impact Challenge-Brazil prize. On the basis of these results, it can be concluded that budget geolocation is a good strategy to make and/or abstract budget concepts less difficult, and data and information more accessible to a wider audience. Moreover, the “Caring for My Neighborhood” tool allows the public to have a better un-derstanding of the use of the municipal public budget.
Another important finding was some of the expected issues that had not been previously addressed, including data limitations or the question of whether the tool is geared towards the evolving initiative. With regard to the dataset, new information is needed to improve our understanding of how funds are allocated in the territory and as discussed earlier, this in-volves new means of controlling and recording the information within the municipal public administration. Regarding the tool, the main requirement
64
in its development is the provision of a social platform which can allow interaction between the users and enable a wide range of matters about geolocalized expenditure to be expressed (questions, complaints, criticisms and comments).
As well as this, the project outputs and the interviews introduced some interesting features that open up new avenues of inquiry. First of all, the civil society ecosystem and the quality of its components and connections may offset the poor quality of the data. Some results showed the impor-tance of having a better understanding of the role of intermediaries and consumers and their social context. In addition to the heterogeneous na-ture of each category, their role can vary depending on the situation, and disrupt the static chartacter of the active-passive relationship. For a better knowledge of how actions and effects are achieved, it is also important to understand the different stages of transformation of the data, information and knowledge that are carried out in the interaction between these con-sumers and intermediaries.
Another key finding that was obtained, was the supply side of the pub-lic sector information, which is represented metaphorically as an iceberg. What is published in the Open Data disguises deeper underlying resource / process / cultural issues and constraints which might make the open data initiatives unsustainable. On the other hand, one of the experiences in real terms, is that often these underlying resource / process / cultural issues and constraints act as visible barriers and pretexts for a failure to release Open Data.
The “Caring for My Neighborhood” project has achieved a good deal in its first cycle and lessons have been learned both on the demand side and supply side and we hope to continue tracking the improvements made in both areas. However, we are conscious that this study has some serious gaps which we hope will be covered in the future; this also includes the fact that our own role in the scenario requires an independent external observer


66
References
[1] Suplementary Law nº 101, Brazil (2000), http://www.planalto.gov.br/ccivil_03/Leis/LCP/Lcp131.htm Accessed on: 01/01/2015.
[2] Suplementary Law nº 131, Brasil (2009), http://www.planalto.gov.br/ccivil_03/Leis/LCP/Lcp131.htm Accessed on: 01/01/2015.
[3] Berners-Lee, T. “Is your Linked Open Data 5 Star?” (2010). In: http://www.w3.org/DesignIssues/LinkedData.html. Accessed on: 01/01/2015.
[4] Open Government Data Principles (2007), http://www.opengovdata.org/home/8principles Accessed on: 01/01/2015.
[5] Craveiro, G.S., Santana, M.T., Albuquerque, J.P.: Assessing Open Government Budgetary Data in Brazil. In: ICDS 2013, The Seventh International Conference on Digital Society, pp. 20–27 (2013)
[6] Craveiro, G.S.: Where does the money go? The challenge of trans-parency in state spending. Global Information Society Watch 2012 - The Internet and Corruption (2012).
[7] Davies, T., Perini, F., Alonso, J. :Researching the emerging impacts of open data - ODDC Conceptual Framework. ODDC Working Papers #1, (2013). Available at: http://www.opendataresearch.org/sites/default/files/posts/Researching%20the%20emerging%20impacts%20of%20open%20data.pdf
[8] Beghin, N., Zigoni, C. (orgs.): Measuring open data’s impact of

67
Brazilian national and sub-national budget transparency websites and its impacts on people’s rights. Brasília (2014). Available at: http://www.inesc.org.br/headlines/biblioteca/publicacoes/outras-publicacoes/publicacoes-em-ingles/open-data
[9] Walker, S.T.: Budget mapping: Increasing citizen understanding of government via interactive design. In: 2014 47th Hawaii International Conference on System Sciences, pp. 1–9 (2010)
[10] SEADE Foundation. São Paulo Vulnerability Index (2010). Available at: http://www.iprsipvs.seade.gov.br/ Accessed on: 01/01/2015.
[11] Smutylo, T. (2001). Crouching impact, hidden attribution: over-coming threats to learning in development programs. Evaluation Unit, Corporate Services Branch, International Development Research Centre.
[12] Connell, J. P., & Kubisch, A. C. (1998). Applying a theory of change approach to the evaluation of comprehensive community initiatives: pro-gress, prospects, and problems. New approaches to evaluating community initiatives ,2(15-44).
[13] Wilson-Grau, R.: La historia del desarrollo de una sopa de pescado (2011). Available at: http://www.outcomemapping.ca/download/wilson-grau_es_Historia%20del%20Desarrollo%20de%20una%20Sopa%20de%20Pescado%20OMLC%20%5BCompatibility%20Mode%5D.pdf.

COmPOsed By mOOA estUdIO In sIrBA At mAy 2015