Embed Size (px)
DESCRIPTION
Information
Citation preview

ORIGINAL ARTICLE
Exploring the impact of trust information visualization on mobileapplication usage
Zheng Yan • Conghui Liu • Valtteri Niemi •
Guoliang Yu
Received: 23 August 2011 / Accepted: 17 December 2012 / Published online: 23 January 2013
� Springer-Verlag London 2013
Abstract Trust allows people to live in a risky and
uncertain situation by providing the means to decrease
complexity. It is the key to decision making and engaging
in usage. Visualizing trust information could thus leverage
usage behavior and decisions. This article explores the
impact of trust information visualization on mobile appli-
cation usage with a three-stage experiment conducted in
both Finland and China (1) by studying users’ opinions on
the importance of mobile applications, (2) by evaluating
the impact of a trust indicator on mobile application usage,
and (3) by evaluating the impact of a trust/reputation
indicator on mobile application usage. Although the results
achieved in this study for Finland and China showed small
differences on usage willingness and remarkable difference
on trust information check willingness, both countries
indicated that visualizing the reputation value of an
application and/or the individual trust value of a user can
assist in mobile application usage with different impor-
tance rates. In addition, the article discusses possible rea-
sons for the difference in impact in Finland and China,
other impact factors related to mobile application usage,
and implications of our experiments with regard to a trust
management system for mobile applications.
Keywords Trust � Reputation � Trust/reputation
visualization � Human–computer trust interaction �Mobile application
1 Introduction
Mobile devices have evolved into an open platform to
execute various applications. A mobile application is a
software package that can be installed and executed in
mobile devices. An example of such an application is a
mobile web browser to access the Internet. Generally,
mobile applications developed by various vendors can be
downloaded for installation. This situation means that there
are a number of mobile applications with similar functions
available for users. The future market could thus be com-
petitive. For this reason, the trustworthiness of the mobile
application is a central issue impacting not only user
selection and usage but also the ultimate success of the
application.
Trust is a multidimensional, multidisciplinary, and
multifaceted concept, for which there are various defini-
tions, many of which can be found in the literature.
Common to these definitions are the notions of confidence,
Z. Yan (&)
The State Key Laboratory of Integrated Services Networks,
Xidian University, No. 2 South Taibai Road,
Xi’an 710071, China
e-mail: [email protected]; [email protected];
Z. Yan
Department of Communications and Networking,
School of Electrical Engineering, Aalto University, Otakaari 5,
02150 Espoo, Finland
C. Liu � G. Yu
Renmin University of China, No. 59, Zhongguancun Street,
Haidian District, Beijing 100872, China
e-mail: [email protected]
G. Yu
e-mail: [email protected]
V. Niemi
Department of Mathematics and Statistics,
University of Turku, 20014 Turku, Finland
e-mail: [email protected]
123
Pers Ubiquit Comput (2013) 17:1295–1313
DOI 10.1007/s00779-013-0636-4

belief, and expectation on the reliability, integrity, ability,
and other such characteristics of an entity [63]. Definitions
of trustworthiness in mobile applications relate to their
dependability, security, and usability [4], as well as
popularity [65]. In this paper, our working definition of
user trust in a mobile application is the user’s belief in
the application being able to fulfill the expected task.
From the public trust perspective, the reputation of the
mobile application is derived from direct and indirect
knowledge or experiences. In our study, public trust (i.e.,
reputation) is defined as the public belief in a mobile
application that could fulfill a task according to the
expectations of many users. However, user trust in a
mobile application is highly subjective. It is built up over
time and changes with application use due to the influ-
ence of many factors.
Through practical usage, users make decisions about the
trustworthiness of mobile applications. A user decision is
generally required during practical consumption of a
mobile application. For example, a user decides whether it
is safe to conduct an important task with the mobile
application or whether it is worth the risk of trying. Mobile
users are not given any cue that can help their usage
decision. Trust obviously plays an important role in
application consumption and usage, as it helps users
overcome perceptions of uncertainty and risk. Trust also
helps them engage in trust behaviors (i.e., the actions of a
trusting subject to depend on or make her/him vulnerable to
a trusting object) [36]. Numerous researchers have found a
positive correlation between trust and use [30, 39, 40, 55].
Some researchers have conceptualized trust as a behavior
[1, 15, 21]. Previous research has also confirmed a strong
correlation between behavioral intentions and actual
behavior, especially for human–software system interac-
tion [54, 60]. However, few existing studies explore the
impact of visualizing trust information in the context of
mobile application usage [28, 33, 38, 45].
This article studies the impact of visualizing trust
information on mobile applications. We hypothesize that
visualizing trust information could leverage usage decision.
We validate that displaying the reputation value of a
mobile application and/or the individual trust value of a
user could enhance the user’s ability to perform appropriate
actions in various usage contexts. Detailed trust informa-
tion about how trust/reputation values are generated can be
accessed in an additionally specific way during application
execution for usability. Our validation is based on a three-
stage experiment conducted in both Finland and China.
In this article, we first briefly review human–computer
trust interaction. We then introduce our research question
and method followed by experimental details and results.
Thereafter, we conclude our findings and further discuss
possible reasons for different effects in two countries, other
impact factors related to mobile application usage, and the
implications of our experiments with regard to a trust
management system for mobile applications.
2 Human–computer trust interaction
This section briefly reviews issues related to human–
computer trust interaction, which include UI design tech-
niques for trust, interrelationships between trust and use,
trust information notification and visualization, trust and
reputation mechanisms, and other related work.
2.1 Notion of trust
Trust is a complicated notion that has been studied by
many researchers in various domains. It is firstly a social
phenomenon. The concept of trust has been studied in
disciplines ranging from economics to psychology, soci-
ology to medicine, and information science to computer
engineering. Researchers have defined trust in many dif-
ferent ways, which often reflect the paradigms of particular
academic disciplines. For example, Grandison and Sloman
[22] held the opinion that trust is a qualified belief by a
trustor with respect to the competence, honesty, security,
and dependability of a trustee within a special context.
Alternatively, Corritore et al. [11] stated that online trust is
an attitude of confident expectation in an online situation of
risk that one’s vulnerabilities will not be exploited. In a
multi-agent system, trust is a subjective expectation that
one agent has about the future behavior of another agent
[37]. From a software engineering perspective, trust is
accepted dependability [4]. In an ad hoc network, trust is
the reliability, timeliness, and integrity of message delivery
to a node’s intended next-hop [31]. The current paradigm
for trusted computing systems holds that trust is a property
of a system. Trust can be formally modeled, specified,
calculated, and verified. Trust itself is an assessment made
by users based on how well the observed behavior of the
system meets their own standards or expectation [13, 66].
In this article, we derived our understanding of trust in
mobile applications, which entails crossing multiple dis-
ciplines, as defined in the introduction.
2.2 UI design for trust
Trust is an integral component in many types of human
interaction, allowing people to act under uncertainty and
with the risk of negative consequences [3]. Researchers in
human–computer interaction (HCI) and human factors
have recently studied trust in an online context, but few
researchers have explored the role of trust in the mobile
application domain. The realization that design can affect
1296 Pers Ubiquit Comput (2013) 17:1295–1313
123

the trust of a user has had implications for user interface
(UI) design, web sites, and interactivity in general [41].
Trust can be affected by a wide range of cues. These
cues range from design and interface elements to perceived
website credibility and also include the extent to which the
technology is perceived and responded to as a social actor
[11]. For example, Wang and Emurian [61] identified types
of trust cues, including interface design features, structure
design (e.g., the look and feel of the site), content design
(e.g., the inclusion of security and privacy policies seals of
approval or third-party certificates), and social cue design
(e.g., photographs and other social presence indicators). In
addition, trust is influenced by perceived integrity and
expertise, predictability or familiarity of content, and rep-
utation [8, 10, 35].
Recent research focused on the cues that convey trust-
worthiness to users. Several studies illustrated how inter-
face design can give a cue of trust or signal trustworthiness
[11, 49]. Other studies identified the following cues that
have been found to have a positive impact on trustwor-
thiness perceptions: ease of navigation or ease of access
[42], good use of visual design elements [26], the presence
or absence of visual anchors, interpersonal cues or promi-
nent features, such as a photograph, video/audio, avatar, or
trust seal [20, 43, 48, 56], which strongly depend on con-
text variables, individual differences, and personality [46,
47, 58], freedom from small grammatical and typographi-
cal errors [19, 42], an overall attractiveness and profes-
sional look [27, 56], ease of searching [42], professional
images of products [42], and ease of carrying out transac-
tions [11, 32, 42]. Studies have been inconclusive on the
value of third-party trust logos and seals of approval
[11, 52]. Users appeared to not notice or care about these
logos and seals [42, 52].
Social cues are particularly important in the design of
trustworthy websites or user interface. One social cue
includes appropriate graphics and photographs that can
add to a sense of social presence and inclusion, while
inappropriate mission statements or alienating language
can have the opposite effect [56, 61]. Research on using
images of website personnel reveals contradictory results:
Some studies found such images were a positive cue [18,
42, 58], while others found them to be neutral or negative
[47]. Another social cue is dialogue. An implementation
in an embodied conversation agent was demonstrated to
have a positive effect on trust for users with a disposition
to be extroverts [9]. A study on real-time interactivity,
excluding voice, also showed increased judgments of
friendliness and the trustworthiness of an online sales-
person [7]. However, other researches revealed that online
word-of-mouth systems could affect user trust in e-com-
merce, where users can rate the products offered for sale
[5].
Other researchers have found that the quality and
quantity of computerized information influence user trust
and satisfaction [28]. Corritore et al. [11] reported that trust
is also affected by the information content. Providing
content that is appropriate and useful to the target audience
has thus been identified as a strong trustworthiness cue
[53]. Positive cues include conveying expertise, providing
comprehensive information, and projecting honesty, lack
of bias, and sharing values between the website and user
[19, 29, 42]. In e-commerce, cues that affect user trust
include company information, range of merchandize,
branding, promotions, security, fulfillment, and customer
service [11, 19, 32, 42, 47]. In addition, Herlocker et al.
[23] studied the influence of explanations on user accep-
tance of automated collaborative filtering (ACF) systems.
Cramer et al. [12] showed that explaining to the user why a
recommendation was made increased acceptance of the
recommendations. Recent research on an automated rec-
ommender suggests that trust can be increased by a con-
versational interface and disclosure of what the
recommender system knows about its users [11, 70].
However, previous studies have not considered how to
confer computational trust values to the users and how this
information could impact trust.
2.3 Trust and use
Previous research has shown that trust and use have a tight
relationship. The Theory of Reasoned Action posits that
beliefs lead to attitudes, which lead to behavioral inten-
tions, which subsequently lead to the behavior itself [17].
Numerous researchers have conceptualized trust as a
behavior, which has been validated in work collaboration
and social communications [1, 15, 21]. Prior research has
also confirmed a strong correlation between behavioral
intentions and actual behavior, especially for software
system usage [54, 60]. Muir found a positive correlation
between trust and use [39, 40]. The relationship between
trust and interaction behavior is obvious, as usage through
human–computer interaction implies trust. Lee and Moray
found that trust in a system partially explained system use,
but other factors (such as the user’s own ability to provide
manual control) also influenced system use [30]. Although
use implies trust, current literature still lacks study on the
impact of visualizing trust information on use, especially in
the context of mobile applications.
2.4 Trust information notification and visualization
Trust information notification and visualization is highly
related to the work presented in this paper. Notification
systems attempt to deliver current, important information
to users efficiently and effectively without causing
Pers Ubiquit Comput (2013) 17:1295–1313 1297
123
unwanted distraction to ongoing tasks [34]. However, some
issues remain unexplored in this area. McCrickard et al.
commented that the effects of incoming notifications on
ongoing computing tasks have been relatively unexplored
[34]. Notification without usage interruption still lacks
investigation, especially for mobile and ubiquitous devices
that include a small display element. Antifakos et al. [2]
conducted experiments to show that displaying confidence
information increases user trust in a system in various
contexts classified by criticalness. Rukzio et al. [51],
however, proved that the user needs slightly more time and
produces slightly more errors when the system confidence
is visualized. The contradictory results implied that the
visualization of system confidence seems questionable or
works differently in different situations.
2.5 Other related work
The literature has not comprehensively studied trust and
reputation information visualization, though trust and
reputation mechanisms have been proposed in various
fields, including ad hoc networks, peer-to-peer systems,
grid and pervasive computing, web services, and e-com-
merce [64]. It is commonly accepted that trust can be
modeled in a mathematic measure and its value can be
calculated [66]. In many existing web services (e.g.,
eBay.com and Amazon.com), reputation values (mostly
on a Likert scale) are displayed based on rating to assist
user decision. However, few previous works studied the
mutual effects of visualizing both individual and public
trust (i.e., reputation) values to the mobile application
users during its execution.
Other factors may also influence trust in HCI. Cultural
factors are also important variables affecting trust and its
development in HCI [6]. It was found that Japanese people
have a generally low level of trust compared to Americans
[62]. Karvonen found that Finnish consumers are the most
cautious and Icelandic consumers are the most trusting in
Nordic countries in e-commerce [25]. Human nature is
another influential factor of the trust in HCI. Deutsch [14]
found a significant correlation between trust and personal
predisposition. Emotion and mood could also influence
trust judgment [16].
Regarding the methodology applied in past research,
many current e-commerce trust design guidelines are based
on surveys and interviews for capturing the interface ele-
ments or cues that they currently interpret as trustworthi-
ness signifiers [49]. This approach provides important
practical guidance to user interface designers about inter-
face elements that increase perceived trustworthiness, for
example, in a recommender system [45]. In the work pre-
sented in this article, we use both a self-developed toolkit
and interviews to investigate the benefit of using visual
elements of trust information and pursue design guidelines
of a trust management system for mobile applications.
In summary, much research has been conducted
regarding user interface design for human–computer trust
establishment and improvement, mainly for web sites and
in e-commerce. This prior work left room for further
studies on the impact of trust information visualization on
usage behaviors and, in particular, on how to provide trust
information for mobile users. In our work, we use a trust
indicator to indicate an individual trust value and a trust/
reputation indicator to indicate both the individual trust and
reputation values. The indicators are interface design ele-
ments that provide trust information cues in a mobile
application trust management system [67, 69]. The indi-
vidual trust value could become the valuable credibility for
the contribution of a user (e.g., his/her rating) to the rep-
utation of a mobile application. In addition, the individual
trust and reputation values could serve as credibility for
each other. No previous research has investigated the
mutual impact of these two pieces of information on users,
which is one of our research targets. The above impact
could also be affected by region and culture (e.g., western
and eastern cultures) or context (e.g., the importance of the
mobile application), which is explored in our study.
3 Method
3.1 Research questions
User trust in a mobile application is built up over time and
changes with application use due to the influence of many
factors. We developed a system to estimate individual trust
based on the usage behaviors of a user (e.g., usage behavior
about normal usage statistics, reflection behavior related to
application performance and user experience, and correla-
tion behavior regarding similarly functioned applications)
[65, 67, 69]. We achieved an individual trust model by
mathematically formalizing trust behavior measures that
were investigated in a large-scale user study [68]. The
individual trust is calculated by the mobile device of the
user based on trust behavior observations.
The reputation value of an application is generated by
aggregating the individual trust and ratings. It is issued by a
reputation service provider, designed by Yan et al. [69].
We use a number to indicate the individual trust and rep-
utation values, respectively. Their values range from 0 to 1,
representing the range of full distrust to full trust. We use a
rectangle bar to indicate the individual trust value and a
trapezoid bar to indicate the reputation value in our
experiments. The individual trust value is presented by the
trust indicator. The trust/reputation indicator presents both
values.
1298 Pers Ubiquit Comput (2013) 17:1295–1313
123

We also assumed that detailed trust information is
available through an additional access point, either from a
device menu or by touching the indicator or via a shortcut
key/icon, because providing comprehensive information
and necessary explanations could increase user trust [42].
However, directly displaying the detailed trust information
(e.g., how these values are generated and who provides this
information) could influence usage experience due to the
limited screen size of mobile devices.
Though application reputation helps users select a
proper application for purchase and installation, we still
faced an important system design issue:
Is it helpful for the users if we display the real-time trust
information (i.e., trust and/or reputation values) during
the application usage or consumption?
The work presented in this article aims to evaluate the
impact of visualizing trust information on mobile appli-
cation usage. We try to explore the following research
questions:
1. How important do people consider various mobile
applications?
2. How does individual trust information affect mobile
application usage?
3. How do the individual trust and public reputation
affect mobile application usage?
3.2 Experiment overview
We developed an experiment toolkit and conducted a three-
stage user study to investigate the above research questions
in both China (CN) and Finland (FI). We adopted 48
mobile applications and recorded their usage videos. The
48 mobile applications were selected from real products or
prototypes, which provide a diverse sample of various
mobile application scenarios and usage contexts. Examples
include mobile enterprise solutions (e.g., corporate email
checking), mobile personal business solutions (e.g., mobile
payment, wallet, and safe box), mobile entertainment
solutions (e.g., mobile TV, mobile video/audio/radio/
music, gaming, and camera), mobile life and social net-
working solutions (e.g., mobile search, location-based
services, maps, instant messaging, VoIP applications, tra-
vel aids, and mobile diary), mobile education solutions
(e.g., e-book reader and multi-language translator), and
integrated applications that provide an easy access to var-
ious mobile Internet services (e.g., Nokia WidSets and
Yahoo!Go).
In the first experiment, we assessed the importance of
mobile application scenarios. Using this result, we selected
a set of 9 applications based on their importance rates (low,
medium, and high) and showed them in the later two
experiments. In the second and third experiments with
different participants, either the trust or trust/reputation
indicator was displayed in one experiment block, while no
information about trust was given in the other block. For
each application usage scenario (shown as a video), we
asked participants to rate their willingness to continue
consumption and check trust information. The effects of
three variables were thus studied, including the availability
of trust information, trust information itself (either a trust
indicator or a trust/reputation indicator), and the specific
mobile application scenario (with different importance
rates). The results achieved in both countries were also
compared. Table 1 shows the design of Experiments 2 (E2)
and 3 (E3).
4 Experiments and results
4.1 Experiment 1: Application’s importance
The goal of this experiment is to introduce an importance
rate (IR) into each candidate mobile application and select
a set of applications for the second and third experiments.
We define importance as how important a specific task that
a mobile application can fulfill is to the participant con-
cerning its usefulness and personal interest. To determine
the IR, Experiment 1 assesses the preferred scale of each
participant for each candidate application.
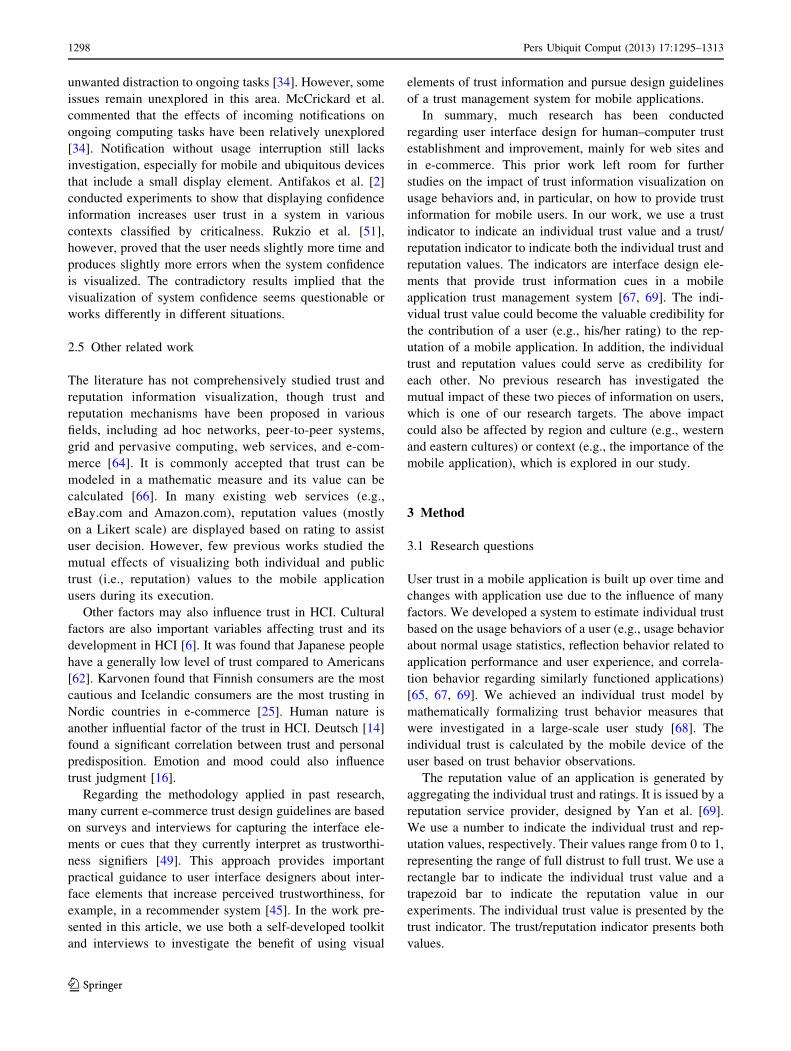
4.1.1 Experimental toolkit
The experimental toolkit contains a number of testing
slides. Each testing slide is divided into four parts under the
application name. As shown in Fig. 1, Part 1 is a brief
introduction of the mobile application. Part 2 is the
Table 1 The design of Experiments 2 and 3
Experiment variables Block 1 Block 2
E2
Indicated trust value Low, medium, high Low, medium, high
Indicator availability No Yes
Application importance Low, medium, high Low, medium, high
Region (test sites) Finland and China Finland and China
E3
Indicated (trust
value) 9 (reputation
value)
(low, medium,
high) 9 (low,
medium, high)
(low, medium,
high) 9 (low,
medium, high)
Indicator availability No Yes
Application importance Low, medium, high Low, medium, high
Region (test sites) Finland and China Finland and China
Pers Ubiquit Comput (2013) 17:1295–1313 1299
123

explanation of assumed application scenario and an
underlying task. Part 3 is a video recording of the appli-
cation usage. The videos last from 48 s to 3 min and 17 s.
We used a PhoneScreen [44] application developed by the
Nokia Research Center (installed at the mobile phone and
PC) to show the mobile phone screen on a PC screen
through a Bluetooth connection. We used the screen cap-
ture tool SnagIt v8.2 [57] (installed on the PC) to record the
whole application usage scenario procedure. Part 4 is a
feedback area where the participant can use the scroll bars
to provide his/her feedback.
The experiment data were automatically recorded during
the experiment. These data include the personal information
of participants (e.g., name, contact, gender, nationality, pro-
fession, and experiences in using mobile applications), the
answers, and feedback from questions and interviews.
4.1.2 Participants
In Finland, 26 participants from European countries,
mainly from universities, participated in this study. We
selected 23 valid samples (39.1 % female) for data pro-
cessing. This group ranged in age mostly from 19 to
29 years, and 87.0 % majored in science and technology,
while others majored in arts (8.7 %) and business (4.3 %).
In China, we selected 26 valid samples (61.5 % female)
from a total of 31 participants for data processing. The
sample was composed of 13 graduates and 13 undergrad-
uates. This group ranged in age from 19 to 29 years, and
7.7 % majored in science and technology, while 57.7 %
majored in arts and 34.6 % in business. Table 2 provides
information about the participants’ experience in mobile
application usage.
4.1.3 Procedure
At the beginning of each test, we first introduced the basic
concepts (e.g., mobile application and IR) with examples.
We then briefly described the experiment purpose and
procedure, as well as the testing toolkit design. Before the
real test, each participant practiced on three example
‘‘testing slides’’ to become familiar with the experiment
toolkit.
In this experiment, each participant completed a series
of application scenarios to assess his/her opinion on
application importance. For each scenario, shown as a text
Fig. 1 Example testing slide
for Experiment 1
Table 2 The experience of participants in mobile application usage
(Experiment 1)
Experience on mobile
applications
Number of
participants
Percent (%)
Finland China Finland China
Time of phone usage
Below 0.5 h/day 8 1 34.8 3.8
0.5–1 h/day 9 4 39.2 15.4
1–5 h/day 5 11 21.7 42.3
More than 5 h/day 1 10 4.3 38.5
Total 23 26 100 100
Mobile application usage experience
Internet accessed applications 18 13 78.3 50
Mobile network accessed
applications
22 26 95.7 100
Non-network accessed
applications
23 26 100 100
1300 Pers Ubiquit Comput (2013) 17:1295–1313
123

description and video, the participant was asked to answer
the question:
• How important is this application scenario to you?
A scroll bar was provided for the participants to indicate
IR from ‘‘not at all’’ to ‘‘very much.’’ The corresponding
values attached to them are 0 and 1, respectively. After
answering this question, the participant pressed the ‘‘Con-
firm’’ button. The test automatically proceeded to the next
scenario. After each user test, the display order of the
application scenarios was shifted by two. Meanwhile, all
scroll bar values were reset to 0. For each participant who
fulfilled the entire test, we provided him/her a small gift.
At the end of the test, the participant was further inter-
viewed to choose from ‘‘Yes’’, ‘‘No’’, or ‘‘Neutral’’ for the
following two questions:
Q1: Do you think it is helpful to get other people’s usage
information when you decide whether to do some task
via a mobile application?
Q2: Do you think your own past usage information could
help your consuming decisions regarding a mobile
application?
4.1.4 Results
The IRs of the 48 application scenarios varied between
.224 and .777 in Finland, with an average of .487
(stdev = .293), and between .314 and .887 in China, with
an average of .553 (stdev = .299). This finding showed
that the applications adopted in the experiment covered the
continuum of importance well. Notably, the participants’
view of the mobile applications’ importance obviously
varied.
We grouped and selected the applications based on the
IR. Table 3 shows that the results in Finland and China
were different, implying that the opinions on the impor-
tance of mobile applications varied in different regions.
Surprisingly, one of the high important applications (i.e.,
mobile web browser) in Finland was treated as unimportant
in China, though its usage experience rate was not low
(73.9 % in Finland and 49.2 % in China). Three selected
applications (i.e., LifeBlog, Yahoo!Go, and Mobile Real-
player) fell into the same IR groups in two countries.
We further conducted paired sample t tests to evaluate
our grouping. The t and p values of the high and medium
importance groups were 25.666 and \.005 in Finland,
respectively, and 9.517 and \.001 in China, respectively.
The t and p values of the medium and low importance
groups were 4.775 and \.05 in Finland, respectively, and
9.678 and\.001 in China, respectively. The t and p values
of the high and low importance groups were 14.405 and
\.005 in Finland, respectively, and 11.16 and \.001 in
China, respectively. The results showed that our groupings
in both countries were valid.
4.1.4.1 Top 10 used mobile applications The average
usage experience percentage of the applied 48 mobile
applications was 27.8 % in Finland and 38.0 % in China.
This explains that most participants had not used the tested
applications in both countries. Table 4 shows that the top
used applications were mostly default applications freely
Table 3 Selected mobile applications (FI and CN)
Application groups IR low IR medium IR high
FI CN FI CN FI CN
Application names LifeBlog
Video download
Shozu
LifeBlog
TextTV
Web browser
Gizmo
Yahoo!Go
M-realplayer
MobiReader
Yahoo!Go
M-realplayer
Nokia Maps
Gmail
Web browser
Camera
Fring
Music player
IR average .292 .341 .478 .539 .719 .773
IR stdev .010 .038 .059 .008 .042 .014
Table 4 Top 10 used mobile applications
Order Finland China
Mobile
applications
Usage
experience
percentage
(%)
Mobile
applications
Usage
experience
percentage
(%)
1 Camera 100 Camera 87.7
2 Game 87.0 Music player 78.5
3 Notes 82.6 Show caller ID 66.9
4 Music player 78.3 Mobile realplayer 62.3
5 Internet
search
78.3 Game 60.0
6 Web browser 73.9 Palringo 59.2
7 Gallery 69.6 Radio 55.4
8 Radio 69.6 Foreca 54.6
9 Gmail 65.2 Voice recorder 53.1
10 Mobile
realplayer
60.9 Trippo weather
broadcast
51.5
Pers Ubiquit Comput (2013) 17:1295–1313 1301
123

installed by the mobile phone manufacturers (e.g., Camera,
Music Player, Notes, mobile Real Player, Radio, Voice
Recorder, and Photo Gallery). Mobile internet services (e.g.,
mobile internet search, web browsing, and mobile email) were
becoming popular in Finland. Mobile multimedia applications
were widely consumed in both countries. However, the high
importance of a mobile application generally links to a high
usage experience percentage, but we found an exception in
China in web browsers (with medium usage experience but a
low IR) and Fring (with low usage experience but a high IR).
This result implies that the Chinese participants (especially
Chinese university students) considered cheap or free internet
telephone (VoIP) applications more important than did
European participants. This finding could be caused by the
economic status of participants in different regions when the
experiment was conducted.
4.1.4.2 Usage information’s assistance The feedback of
Q1 and Q2 showed that most participants in Finland
(87.0 %) and China (88.5 %) thought it helpful to obtain
usage information from other users when they decide
whether to do some task via a mobile application. The
participants also thought their own historical usage infor-
mation could help their consuming decisions during mobile
application usage in Finland (78.3 %) and China (100 %).
This result proved the usefulness of the system that pro-
vides trust information to users based on usage statistics,
described in Sect. 3.1.
4.2 Experiment 2: Impact of a trust indicator on mobile
application usage
The goal of this experiment is to study the impact of a trust
indicator (TI) on mobile application usage. We try to
investigate if visualizing the individual trust value could
assist in mobile application usage.
4.2.1 Design
We applied a design with three independent variables:
application scenario (with an IR), TI, and indication
availability, that is, whether the indicator is displayed. We
also tried to investigate regional influence in our study.
This part of experiment was conducted in two blocks. In
Block 1, no information about trust was given, while the TI
was displayed in Block 2. The independent variable
application scenario was randomized in both blocks. We
used the 9 applications previously chosen in Experiment 1.
The scenarios in Blocks 1 and 2 were different regarding
the same application. Inside Block 2, however, we applied
the same scenarios for each application with different trust
values indicated. The selected 9 scenario sequences were
thus repeated at 3 different individual trust values (Low—
0.15, Medium—0.5, and High—0.9). This design resulted
in 9 9 3 trials in Block 2. The application scenario order
was counterbalanced across participants.
4.2.2 Experimental toolkit
Each testing slide in Experiment 2 contains the test for one
mobile application scenario and its structure is the same as in
Experiment 1. The application usage videos last from 34 s to
2 min and 1 s. Figure 2 provides an example testing slide.
4.2.3 Participants
In Finland, most participants were university students. We
selected 15 samples of native Europeans (26.7 % female)
Fig. 2 Example testing slide
for Experiment 2
1302 Pers Ubiquit Comput (2013) 17:1295–1313
123

from a total of 31 participants for data processing. This
group ranged in age from 18 to 30 years and mainly came
from science and technology departments (73.3 %). In
China, all participants were Chinese undergraduates or
graduates, and 30 participants took part in this study. We
randomly selected 15 (40 % female) valid samples for data
processing. This group ranged in age from 19 to 29 years,
and majored in arts (60 %), science and technology
(20 %), and business (20 %). Table 5 provides information
about the participants’ mobile application usage
experience.
4.2.4 Procedure
In Experiment 2, each participant completed a series of
scenarios without the trust indicator in Block 1 and with the
trust indicator in Block 2. We assessed his/her willingness
for continuous consumption and the willingness to see the
trust value of the application (Block 1) or the detailed trust
information (Block 2). For each scenario, the participant
was asked to answer the following questions:
• Would you like to continue consuming or using this
application? (In Blocks 1 and 2)
• Would you like to see the trust value of this applica-
tion? (In Block 1)
• Would you like to see the details behind the trust
indicator? (In Block 2)
After each user test, the test order of the application
scenarios in Blocks 1 and 2 was shifted by 1 and 3,
respectively, in a counterclockwise direction. Meanwhile,
all scroll bar values were reset to 0. Each participant in
both countries was rewarded a gift after the testing.
At the end of the test, each participant was further
interviewed to answer several questions:
Q3: Would you like to share your personal usage
information: e.g., usage times, usage time, and
frequency?
Q4: Do you think your usage information is private?
Q5: What details would you like to see behind the trust
indication?
Q6: How do you prefer to access the details?
4.2.5 Results
4.2.5.1 Usage willingness with and without a trust indi-
cator An analysis of variance (ANOVA) was performed
to test the impact of the trust indicator on mobile appli-
cation usage, with the IR (high, medium, and low) and TI
value (high, medium, and low) as within-subject factors,
reported in Table 6. We found significant main effects of
the IR and the trust value (TV), indicating that the will-
ingness of continuously using a mobile application
increased with the IR from low to high and the TV from
low to high, shown in Fig. 3 with standard errors. The
interaction between IR and TV was not significant in both
countries. This interaction indicated that the effect of TV
did not differ over application scenarios with different IRs.
We conducted paired sample t tests to examine the
impact of the trust indicator on mobile application usage.
Table 7 compares the results in two countries. We found
that usage willingness was higher in Finland, but somehow
a bit lower in China (for the IR high and medium appli-
cations), with the trust value indicated as high (TV_H) than
that without any trust indicator (NO_TI). This usage will-
ingness difference reached a marginal significance level in
Finland. Usage willingness was lower with medium and
low trust value indicators (TV_M and TV_L) than that
without any trust indicator. The results showed that the
trust indicator had a significant impact on usage willing-
ness. The willingness also varied according to the dis-
played trust value. The results implied that the existence of
a TI might have a positive impact in Finland (in case of a
Table 5 The participants’ mobile application usage experience
(Experiment 2)
The experience on mobile
applications
Number of
participants
Percent (%)
Finland China Finland China
Time of phone usage
Below 0.5 h/day 5 1 33.3 6.7
0.5–1 h/day 6 8 40 53.3
1–5 h/day 4 1 26.7 6.7
More than 5 h/day 0 5 0 33.3
Total 15 15 100 100
Mobile application usage experience
Internet accessed applications 13 4 86.7 26.7
Mobile network accessed
applications
15 15 100 100
Non-network accessed
applications
15 14 100 93.3
Table 6 Experiment 2 ANOVA results on usage willingness
Factors Effects in Finland
(FI)
Effects in China (CN)
IR F (2, 28) = 11.419,
p \ .000, g = .67
F (2, 28) = 3.274, p = .069,
g = .436 (marginally
significant)
TV F (2, 28) = 17.569,
p \ .000, g = .75
F (2, 28) = 13.466, p \ .005,
g = .7
IR 9 TV F (4, 56) = 1.943,
p = .158, g = .35
F (4, 56) = .521, p = .655,
g = .19
Pers Ubiquit Comput (2013) 17:1295–1313 1303
123

high indicated trust value) but a negative impact on usage
willingness in China, even though a high trust value was
indicated.
4.2.5.2 Willingness to check trust information with and
without a trust indicator We conducted a two-way
(IR 9 TV) repeated measure ANOVA to test the impact of
the TI on a user’s willingness to check detailed information
behind trust indication. We found a very significant impact of
TI [F (2, 28) = 8.016, p \ .01, g = .60] only in Finland. This
indicated that the willingness to check the detailed trust
information behind trust indicator did not vary over the IR and
indicated TV in China, but over the indicated TV in Finland,
shown in Fig. 4 (with standard errors).
The paired samples t tests also showed that the TI
affected check willingness according to its displayed val-
ues. The effects were different in two countries. As shown
in Table 8, the check willingness in both countries was
lower with a high trust value indicator than that without TI.
The check willingness is similar in Finland but lower in
China with a medium trust value indicator to/than that
without TI. The check willingness is higher in Finland but
lower in China with a low trust value indicator than that
without TI.
4.2.6 Discussion
We found similar results in both countries regarding usage
willingness, but we obtained different results about the
Willingness of Continuous Usage (Finland)
00.10.20.30.40.50.60.70.80.9
No indicator TI low TI medium TI high
Trust Indication (TI)
Will
ing
Sca
le
IR lowIR mediumIR high
Willingness of Continuous Usage (China)
0
0.1
0.2
0.3
0.4
0.5
0.6
0.7
0.8
0.9
1
No indicator TI low TI medium TI high
Trust Indication (TI)
Will
ing
Sca
le
IR low
IR medium
IR high
Fig. 3 Usage willingness with and without a trust indicator (Finland
and China)
Table 7 Paired samples t test on usage willingness with and without
a trust indicator
Pairs Finland China
t p t p
NO_TI–TV_L 7.416 \.000 3.374 =.005
NO_TI–TV_M 3.703 \.006 3.510 \.005
NO_TI–TV_H -1.673 =.133 -.511 =.617
Willingness to Check Trust Information (Finland)
0
0.1
0.2
0.3
0.4
0.5
0.6
0.7
0.8
0.9
No indicator TI low TI medium TI high
Trust Indication (TI)
Will
ing
Sca
le
IR low
IR medium
IR high
Willingness to Check Trust Information (China)
0
0.1
0.2
0.3
0.4
0.5
0.6
0.7
No indicator TI low TI medium TI high
Trust Indication (TI)
Will
ing
Sca
le
IR low
IR medium
IR high
Fig. 4 Willingness to check trust information with and without a
trust indicator (Finland and China)
Table 8 Paired samples t test on trust information check willingness
with and without a trust indicator
Pairs Finland China
t p t p
NO_TI–TV_L -4.976 \.001 3.525 \.005
NO_TI–TV_M .136 .895 3.263 \.01
NO_TI–TV_H 3.363 \.01 2.353 \.05
1304 Pers Ubiquit Comput (2013) 17:1295–1313
123

willingness to check trust information. The check will-
ingness was lower when there was a TI than that without TI
in China. In Finland, however, the check willingness was
higher when there was low trust indication than that
without TI. This implies that the Chinese participants relied
on (or believed in) the TI more than the European partic-
ipants. The European participants were more curious about
the trust information details if a low trust value was shown.
The trust value significantly influenced their check will-
ingness. For most tested mobile applications, the average
willingness to know the trust value was approximately 0.5
in both countries, implying that it is significant to provide a
feature to show trust information during mobile application
usage.
According to the data collected in Experiment 2
(Table 5), European participants (86.7 %) had more
experience in using internet-access applications (e.g.,
Email service and web browser) than Chinese participants
(26.7 %). The mobile phone usage time of the Chinese
participants was much longer than European ones. The
results indicated that mobile internet applications were still
not popular in China, but the mobile phone played an
important role in the life of Chinese university students.
Table 9 tabulates the interview results from Experiment
2. It implies that most participants would like to share
usage information in both countries, but the percentage was
higher in Finland than in China. In China, more partici-
pants did not want to share personal usage information. In
both countries, most participants thought that usage infor-
mation was private; indeed, a higher percentage was
reached in China than Finland, where more participants
held neutral opinion. In both countries, about half of the
participants thought a menu was their preferred way to
obtain trust information details. In Finland, over half of the
participants liked using a touch screen, but no participants
preferred it in China. In China, some participants preferred
shortcut key access.
4.3 Experiment 3: Impact of a trust/reputation indicator
on mobile application usage
Based on the interview results from Experiment 1, public
trust and usage information from other people could be
helpful for mobile application consumption. Experiment 2
only investigated the impact of visualizing individual trust
information on mobile application usage. Experiment 3
further explored the impact of visualizing both individual
trust and public trust (reputation) on mobile application
usage. We investigated the mutual influence of visualizing
these two pieces of information and studied whether the
trust/reputation indicator (TRI) could assist mobile appli-
cation usage.
4.3.1 Design
This experimental design is similar to Experiment 2. Three
independent variables were applied, including the appli-
cation scenario (with an IR), the TRI, and indication
availability. As in Experiment 2, this experiment was
conducted in two blocks. In Block 1, no information about
trust/reputation was given, while the TRI was displayed in
Block 2. The selected 9 application scenario sequences
were repeated at 9 different trust/reputation values (Low—
0.15, Medium—0.5, and High—0.9 9 Low—0.15, Med-
ium—0.5, and High—0.9). This design resulted in 9 9 9
trials in Block 2.
4.3.2 Experimental toolkit, participants, and procedure
The same toolkit was used. In the test, the letters T and R
were marked beside the rectangular and trapezoidal bars to
help the participants easily identify the trust and reputation
values. Figure 5 shows an example testing slide.
In Finland, most participants were university students.
We selected 15 (26.7 % female) valid samples provided by
native Europeans from 26 participants for data processing.
This group ranged in age from 19 to 29 years and majored
in science and technology (53.3 %), business and law
(26.7 %), and arts (20 %). In China, all participants were
Chinese university students, and 31 participants took part
in this study. We randomly selected 15 (66.7 % female)
valid samples for data processing and comparison with the
data obtained in Finland. This group ranged in age from 19
Table 9 Participants’ feedback about usage information and trust
indication (E2)
Questions Answer Number of
participants
Percentage (%)
Finland China Finland China
Would you like to
share your
personal usage
information?
Yes 12 10 80 66.7
No 1 4 6.7 26.6
Neutral 2 1 13.3 6.7
Total 15 15 100 100
Do you think your
usage information
is private?
Yes 11 14 73.3 93.3
No 0 0 0 0
Neutral 4 1 26.7 6.7
Total 15 15 1 100
How do you prefer
to obtain the
details of trust
information?
(multi-choice)
Menu 7 9 46.7 60
Shortcut
keys
0 4 0 26.7
Touch
screen
9 0 60 0
Others 2 2 13.3 13.3
Total 18 15 120 100
Pers Ubiquit Comput (2013) 17:1295–1313 1305
123

to 29 years and majored in arts (60 %), science and tech-
nology (13.3 %), and business (26.7 %). Table 10 provides
information about the participants’ mobile application
usage experience.
The procedure of this experiment was the same as that
of Experiment 2. For each scenario, the participant was
asked to answer similar questions to E2 as below.
• Would you like to continue consuming or using this
application? (Blocks 1 and 2)
• Would you like to see the trust/reputation values of this
application? (Block 1)
• Would you like to see the details behind the trust/
reputation indicator? (Block 2)
After each user test, the test order of the application
scenarios was shifted by 1 and 9 in Blocks 1 and 2 in a
counterclockwise direction, respectively. Meanwhile, all
scroll bar values were reset to 0. Each participant in both
countries was given a gift after the testing.
4.3.3 Results
4.3.3.1 Usage willingness with and without a trust/repu-
tation indicator The usage willingness scale was sub-
jected to ANOVA with three within-subject factors: IR
(high, medium, and low), indicated trust value (TV) (high,
medium, and low), and indicated reputation value (RV)
(high, medium, and low), reported in Table 11. We found
significant main effects of IR, TV, and RV, indicating that
the willingness of continuous usage increased with the IR
from low to high, the indicated trust value from low to
high, and the indicated reputation value from low to high in
Fig. 5 Example testing slide
for Experiment 3
Table 10 The participants’ mobile application usage experience
(Experiment 3)
The experience on mobile
applications
Number of
participants
Percent (%)
Finland China Finland China
Time of phone usage
Below 0.5 h/day 2 1 13.3 6.7
0.5–1 h/day 7 3 46.7 20
1–5 h/day 6 9 40 60
More than 5 h/day 0 2 0 13.3
Total 15 15 100 100
Mobile application usage experience
Internet accessed applications 13 8 86.7 53.3
Mobile network accessed
applications
15 15 100 100
Non-network accessed
applications
15 12 100 80
Table 11 Experiment 3 ANOVA results on usage willingness
Factors Effects in Finland (FI) Effects in China (CN)
IR F (2, 28) = 14.899,
p \ .001, g = .72
F (2, 28) = 1.043,
p = .354, g = .26
TV F (2, 28) = 36.439,
p \ .001, g = .85
F (2, 28) = 35.926,
p \ .001, g = .85
RV F (2, 28) = 27.789,
p \ .001, g = .81
F (2, 28) = 15.807,
p \ .001, g = .73
IR 9 TV F (4, 56) = .939,
p = .422, g = .25
F (4, 56) = 2.777,
p \ .05, g = .41
TV 9 RV F (4, 56) = 6.409,
p \ .005, g = .56
F (4, 56) = 8.780,
p = .001, g = .60
IR 9 TV 9 RV F (8, 112) = .436,
p = .771, g = .17
F (8, 112) = 2.039,
p \ .05, g = .36
1306 Pers Ubiquit Comput (2013) 17:1295–1313
123

both countries, shown in Fig. 6 with standard errors. There
was significant interaction between IR and TV in China but
not in Finland. However, there was significant interaction
between TV and RV in both countries. The interaction
effect among IR, TV, and RV was significant in China but
not in Finland. This interaction indicated that the effect of
trust and/or reputation values did not differ over applica-
tion scenarios with different IRs in Finland, but this situ-
ation was different in China. The effect of TV differed
from RV significantly in both countries, and vice versa. No
other interactions reached significant levels in either
country.
The paired samples t test also indicated that the TRI had
a significant impact on usage willingness according to its
displayed values, shown in Table 12. We found that the
willingness of usage was higher with high trust/high rep-
utation indicator (TRI_HH) than that without any indicator
(UW_NOTRI). Usage willingness is similar with high
trust/medium reputation (TRI_HM) or medium trust/high
reputation (TRI_MH) indicators to that without TRI in
Finland [t (14) = .105, p = .919; t (14) = .542, p = .603].
This similarity only occurs in TRI_HM [t (14) = 1.372,
p = .192] in China. Usage willingness is significantly
lower than other values shown by TRI than that without the
TRI (Table 12).
4.3.3.2 Willingness to check trust information with and
without a trust/reputation indicator We conducted a
three-way (IR 9 TV 9 RV) repeated measure ANOVA to
test the impact of TRI on user willingness to check detailed
trust information behind the indicator. Figure 7 (with
standard errors displayed) shows that a significant main
effect of TV [F (2, 28) = 7.466, p \ .05, g = .59] and RV
[F (2, 28) = 5.766, p \ .05, g = .54] was found in China;
TV and RV influenced the check willingness indepen-
dently. No other main effects and interactions reached
statistical significance in China, but there was a significant
interaction between TV and RV in Finland [F (4, 56) =
5.062, p \ .05, g = .51], implying that the effect of trust
value on check willingness is further influenced by the
reputation value in Finland and vice versa.
Table 13 shows that the paired samples t test implied
that as the difference between the trust and reputation
values becomes sharper, the willingness to check the
detailed trust/reputation information in Finland increases.
However, check willingness is generally lower with the
TRI than without any indicator in China. The result indi-
cated that the TRI had a positive impact on check will-
ingness according to its displayed values.
4.3.4 Discussion
We found similar results in both countries regarding usage
willingness, which increased with the application IR, TV,
and RV. The result also implied that there were reciprocal
effects between the trust value and the reputation value on
mobile application usage willingness.
We obtained different results about the willingness to
check trust information in the two countries. The check
Willingness of Continuous Usage (Finland)
0
0.1
0.2
0.3
0.4
0.5
0.6
0.7
0.8
0.9
1
No ind
icato
r
TRI_LL
TRI_LM
TRI_LH
TRI_M
L
TRI_M
M
TRI_M
H
TRI_HL
TRI_HM
TRI_HH
Trust/Reputation Indication (TRI)
Will
ing
Sca
le
IR low
IR medium
IR high
Willingness of Continuous Usage (China)
00.10.20.30.40.50.60.70.80.9
1
No ind
icato
r
TRI_LL
TRI_LM
TRI_LH
TRI_M
L
TRI_M
M
TRI_M
H
TRI_HL
TRI_HM
TRI_HH
Trust/Reputation Indication (TRI)
Will
ing
Sca
le
IR low
IR medium
IR high
Fig. 6 Usage willingness with and without a trust/reputation indica-
tor (Finland and China)
Table 12 Paired samples t test on usage willingness with and without
a trust/reputation indicator
Pairs Finland China
t p t p
NO_TRI–TRI_LL 8.506 .000 5.903 .000
NO_TRI–TRI_LM 7.018 .000 10.118 .000
NO_TRI–TRI_LH 5.196 .001 7.106 .000
NO_TRI–TRI_ML 6.053 .000 4.850 .000
NO_TRI–TRI_MM 3.461 .009 4.027 .001
NO_TRI–TRI_MH .542 .603 1.906 .077
NO_TRI–TRI_HL 3.708 .006 2.854 .013
NO_TRI–TRI_HM .105 .919 1.372 .192
NO_TRI–TRI_HH -3.782 .005 -1.639 .123
Pers Ubiquit Comput (2013) 17:1295–1313 1307
123

willingness was lower when there was a TRI than that
without any indicator in China, but the check willingness
was higher in Finland than that without any trust/reputation
indication when the indicated trust and reputation values
were different. This result implied that the Chinese par-
ticipants relied on (or believed in) the TRI more than the
European participants. The European participants were
more curious about the trust information details if the
displayed trust value sharply differed from the reputation
value. The trust and reputation values interactions with
each other significantly influenced the check willingness.
In addition, the average willingness to know the trust/
reputation value was above 0.5 for most tested mobile
applications in both countries, implying that it is significant
to provide a feature to show trust information during
mobile application usage.
Table 10 shows that we obtained results similar to those
from Experiment 2. The phone usage time in China was
generally much longer than that in Finland. However,
fewer Chinese participants experienced internet-access
mobile applications than European participants.
Table 14 tabulates the interview results of Experiment
3. In both countries, over half of the participants would like
to share usage information, but the percentage was slightly
higher in Finland than in China. In China, more partici-
pants did not want to share personal usage information. In
both countries, most people thought the usage information
was private, but the percentage was higher in China than in
Finland. In both countries, about half of the participants
preferred getting the trust information details via a menu.
More participants liked using touch screen in Finland than
in China. In both countries, some participants preferred
shortcut key access.
0
0.1
0.2
0.3
0.4
0.5
0.6
0.7
0.8
No ind
icato
r
TRI_LL
TRI_LM
TRI_LH
TRI_M
L
TRI_M
M
TRI_M
H
TRI_HL
TRI_HM
TRI_HH
Trust/Reputation Indication (TRI)
Will
ing
Sca
le
IR low
IR medium
IR high
Willingness to Check Trust/Reputation Information (China)
Willingness to Check Trust/Reputation Information (Finland)
0
0.1
0.2
0.3
0.4
0.5
0.6
0.7
0.8
0.9
No ind
icato
r
TRI_LL
TRI_LM
TRI_LH
TRI_M
L
TRI_M
M
TRI_M
H
TRI_HL
TRI_HM
TRI_HH
Trust/Reputation Indication (TRI)
Will
ing
Sca
le
IR lowIR mediumIR high
Fig. 7 Willingness to check trust information with and without a
trust/reputation indicator (Finland and China)
Table 13 Paired samples t test on check willingness with and with-
out a trust/reputation indicator
Pairs Finland China
t p t p
CW_NOTRI–TRI_LL 2.943 .019 4.447 .001
CW_NOTRI–TRI_LM 3.840 .005 4.999 .000
CW_NOTRI–TRI_LH -.710 .498 1.957 .071
CW_NOTRI–TRI_ML 1.784 .112 3.758 .002
CW_NOTRI–TRI_MM 7.428 .000 3.525 .003
CW_NOTRI–TRI_MH 3.908 .004 2.225 .043
CW_NOTRI–TRI_HL -1.728 .122 2.130 .051
CW_NOTRI–TRI_HM 5.654 .000 2.827 .031
CW_NOTRI–TRI_HH 4.983 .001 1.390 .186
Table 14 Participants’ feedback about usage information and trust
indication (Experiment 3)
Questions Answer Number of
participants
Percent (%)
Finland China Finland China
Would you like to
share your
personal usage
information?
Yes 9 8 60 53.3
No 5 6 33.3 40
Neutral 1 1 6.7 6.7
Total 15 15 100 100
Do you think your
usage information
is private?
Yes 11 13 73.3 86.6
No 3 1 20 6.7
Neutral 1 1 6.7 6.7
Total 15 15 100 100
How do you prefer
to obtain the
details of trust
information?
(multi-choice)
Menu 8 9 53.3 60
Shortcut
keys
3 4 20 26.6
Touch
screen
3 1 20 6.7
Others 2 1 13.3 6.7
Total 16 15 106.6 100
1308 Pers Ubiquit Comput (2013) 17:1295–1313
123

5 General discussion and conclusion
5.1 Impact of trust information indication
Trust can greatly overcome uncertainty and thus influences
usage confidence. In this article, we proposed displaying
trust/reputation information to assist mobile application
usage. The effectiveness of the visualization was shown
from a three-stage user study conducted in both Finland
and China.
We contribute a user study design to investigate opin-
ions on mobile application usage. Using this design, we
first identified the importance of various mobile applica-
tions in two countries with different cultures and technol-
ogy backgrounds. This, as we know, has not been studied
in the literature. We then selected a number of candidate
applications with different IRs to examine how users react
to the display of their own individual trust values and that
of both individual and public trust (reputation). We found
that visualizing the trust and trust/reputation values makes
a significant difference, as users tend to change their usage
behaviors and decisions. The experimental results indicated
that both the trust and trust/reputation indicators have
significant impacts on usage willingness according to their
displayed values. These two indicators also have valuable
impacts on the willingness to check detailed trust infor-
mation, though the results in two countries differed. We
found different usage willingness and trust information
check patterns in two countries. Our results suggest the
importance of visualizing trust information on mobile
application usage and its potential to improve mobile
application usability. Our experiments investigated the
interaction effects among application importance, trust
value, and/or reputation value on application usage and
trust information check.
5.2 Other impact factors
Except for providing useful trust information, many other
factors can influence mobile application usage. We found
that the participants’ opinions were sharply different, even
in the same situations. Personality was an important factor
that might affect usage decision and behavior. Different
personalities attributed different importance levels to each
accepted trust cue (including branding, third-party security
seals, clearly stated policies, vendor information, and
professional user interface design). Extroversion and
openness to experience led to a higher disposition to trust,
but neuroticism and conscientiousness lead to a lower
disposition to trust [33, 59].
We also noticed that the results were different in Finland
and China, especially on the willingness to check trust
information. Because the ages and occupations of selected
participants were similar in both countries, potential rea-
sons for these differences include culture deviation, past
usage experiences, the technical background of the par-
ticipants, and regional technology development status.
Cultural difference influenced trust in an on-line envi-
ronment [25]. The same influence could also apply to
mobile application scenarios. More generally, social trust
levels varied substantially among countries [24]. The cul-
ture-dependent nature of trust suggests that trust in HCI
may need to be verified when it is extrapolated from one
culture to another. Zuboff [71] found that the culture
associated with people who had been exposed to computers
led to trust and acceptance of automation. There was sig-
nificant deviation between Chinese and European partici-
pants, reflecting the difference of eastern and western
cultures. Our experimental results showed little difference
in usage willingness and obvious difference in check
willingness. One explanation could be that the Chinese
participants more easily trusted the information provided
by a system and did not want to figure out the real reasons
behind it, though they could become caustic if some
information was provided. Conversely, the European par-
ticipants were more curious about the reasons behind the
difference between individual trust and reputation. The
European participants wanted to explore why the trust
value was low and why there was a sharp difference
between these two pieces of information. These partici-
pants generally reacted more positively to the indicated
trust information compared to the Chinese participants. The
importance of mobile applications influenced their behav-
iors more than those of the Chinese participants.
Deviation of past usage experience could be another
reason behind the different results. Riley [50] found that
pilots who were accustomed to using automation trusted
and relied on automation more than students who were not
familiar with it. These results showed that past experiences
influenced trust in a digital system. Though mobile phone
usage time was generally longer in China than that in
Finland, the applications experienced by and familiar to the
Chinese participants were different than those in Finland.
For unfamiliar applications, participants could hesitate to
make a usage decision, even if additional trust information
was provided. The participants could, however, be curious
about consuming useful and important applications, even
having no previous experience. This is more obvious in
China than Finland, shown by a higher average willingness
to use applications in the situation without any indicator in
China than in Finland.
Apart from the above, the technical background of
participants could be another factor that may impact
application usage. In Finland, most participants had a
background in information and computer science, while
most participants majored in arts and business in China.
Pers Ubiquit Comput (2013) 17:1295–1313 1309
123

The knowledge background could influence usage behav-
iors even in the same situation. Conversely, the technology
development situations were obviously different in the two
countries. The above factors could cause different past
usage experiences for the participants and their familiarity
with related technologies. However, these two factors are
important factors influencing trust and use. The technical
background and regional technology development status
could thus be other potential reasons that might cause
different experimental results in two countries.
5.3 Implications
We found that usage willingness without any trust infor-
mation indication was a bit lower than that with high trust
or high trust/high reputation indication. This result implied
that the blind or initial trust of the participants was gen-
erally high. This finding is the same as in previous research
[38, 39]. We suggest that the initial individual trust value,
indicated by the trust management system, should be set
correspondingly high when a user has no experience with
an application, especially when trying to encourage usage.
This value can later be evolved (increased or decreased)
according to accumulated usage experience and behaviors
[68, 69]. The results also implied that the TRI was more
instructive for mobile application usage than the TI, though
the TI could also independently impact usage behavior and
decisions; the Chinese participants somehow showed sus-
picion about the TI.
Except for the experimental tests, we also interviewed
all participants in both China and Finland. All Experiment
1 participants (100 %) in China thought their past usage
history information could help their consuming decisions
on mobile applications, while 78.3 % of the participants in
Finland held the same opinion, though 8.7 % had a dif-
ferent opinion and 13 % were neutral. In Finland, 87 % of
the participants thought other usage information is helpful
when making a usage decision, 4.3 % did not agree on it,
and 8.7 % were neutral. In China, 88.5 % of the partici-
pants provided a positive answer; no participants gave a
negative answer, and 11.5 % were neutral. The above data
additionally indicated the assistance of personal and public
usage information on mobile application consumption.
This result also indicates the foundation of trust and rep-
utation generation based on trust behavior statistics [68,
69]. The result further implied that it was useful to provide
usage statistics when the user would like to check the
detailed trust information. This information explains the
credibility of trust and reputation, thus enhancing user
confidence on the trust management system of mobile
applications.
From interviews with 60 Chinese and European partic-
ipants in Experiments 2 and 3, we found that most
participants would like to share usage information. The
percentage was higher in Finland (70 %) than China
(60 %). In China, more people did not want to share per-
sonal usage information (33.3 % in China and 20 % in
Finland). In both countries, most people thought that usage
information was private. The percentage was much higher
in China (90 %) than Finland (73.3 %), where some par-
ticipants thought that usage information was not private
(10 %) and held a neutral opinion (16.7 %). This result
actually explained the main reason that we conducted the
second experiment about the trust indicator, should the
reputation not be easily achieved or credible due to privacy
concerns in practice. In both countries, about half of the
participants preferred using the menu to obtain trust
information details (50 % in Finland and 60 % in China).
In Finland, many more participants (40 %) preferred touch
screen access (touching the indicator icon) than in China
(3.3 %). In both countries, some participants preferred
shortcut key access; the percentage for this preference was
slightly higher in China (26.7 %) than in Finland (10 %).
The participants held positive opinions on the trust and
trust/reputation indicators. Many participants commented
that the indicator did not bother them at all but that it was
helpful and useful and provided good information. These
participants sometimes preferred to see the indicator. Rie-
gelsberger et al. [49] found that signaling trust-warranting
intrinsic and contextual properties is particularly important
when no previous experience with a trustee is available,
especially in first- or one-time interactions. We received
similar comments from the participants in our experiments.
Most participants thought the indicators shown in the test
were well designed. Some participants preferred person-
alized displays to control when and how to visualize the
indicator. Some participants suggested displaying a trans-
parent indicator to improve usability. Based on the above
findings, we suggest providing a mechanism in each mobile
application that can customize the trust information visu-
alization in the indicator schemes, indicated times, non-
indication period, screen position of the indicator, and
visualization duration. We believe that this mechanism can
flexibly satisfy various users with different personalities
and culture backgrounds.
The experimental results also provided a number of
guidelines for designing and developing a trust manage-
ment system for mobile applications with a trust/reputation
visualization mechanism.
• Friendly UI design of the trust and trust/reputation
indicators is recommended. The participants provided
many valuable suggestions on detailed trust informa-
tion access and display and commented on what they
expected to see (i.e., information providers’ certificates,
reputation credibility, the reason that caused the
1310 Pers Ubiquit Comput (2013) 17:1295–1313
123

difference between the trust and reputation values, how
these two values were generated, the most popular
features of the application, the option to comment and
rate, trust history, the safety index of trust information
sharing, application IR, and application error statistics).
This feedback provided guidelines for designing the
data structure of the detailed trust information. Based
on the results and findings, we suggest using three-
layer trust information indication. The first layer is the
trust or trust/reputation indicator, which is displayed
when the user is using the application. The second layer
provides detailed trust information behind the indicator,
which can be accessed through the option menu of
the application or by touching the indicator on the
screen. More detailed information can be further
accessed through hyperlinks that provide additional
explanations.
• People welcome a system that provides the trust/
reputation information of mobile applications retrieved
from personal and public usage information. The
system design should pay special attention to the
concerns of normal users and their privacy and support
the flexibility to control usage information sharing.
Because many participants only accepted anonymous
usage information sharing, anonymity support is a
necessity. In our experiments, we found a number of
expected technologies that should be adopted in such a
trust management system, including privacy enhance-
ment technology, such as an anonymous identity for
usage information sharing, secure storage to ensure the
confidentiality and integrity of the local usage statistical
data for individual trust generation, a secure channel to
send the usage information or individual trust value to a
reputation service provider. Most importantly, it is
crucial that users understand the privacy protection
solution provided by the system. The trust and trust/
reputation indicators are subject to mimicry [49]. We
should certify the trustworthiness of the trust and trust/
reputation indicators in practice.
• A suitable business model should be adopted to
encourage usage information sharing. Based on the
interviews, we found that a trustworthy brand greatly
benefited a reputable company issuing such a service by
providing trust information to mobile application users.
Meanwhile, profit campaigns could encourage individ-
ual trust information sharing by offering benefits based
on sharing credits accumulated by the users.
Acknowledgments This work is supported by the Fundamental
Research Funds for the Central Universities under Grant
K5051201032. The authors would like to thank Prof. Rong Yan’s
coordination and help on the work described in this article.
References
1. Anderson JC, Narus JA (1990) A model of distributor firm and
manufacturer firm working partnerships. Marketing 54(1):42–58
2. Antifakos S, Kern N, Schiele B, Schwaninger A (2005) Towards
improving trust in context-aware systems by displaying system
confidence. In: Proceedings of the 7th international conference on
human computer interaction with mobile devices and services.
ACM Press, New York, NY, pp 9–14
3. Artz D, Gil Y (2007) A survey of trust in computer science and
the semantic web. Web Semantics: Science, Services and Agents
on the World Wide Web 5(2)
4. Avizienis A, Laprie JC, Randell B, Landwehr C (2004) Basic
concepts and taxonomy of dependable and secure computing.
IEEE Trans Dependable Secure Comput 1(1):11–33
5. Awad N, Ragowsky A (2008) Establishing trust in Electronic
commerce through online word of mouth: an examination across
genders. J Manage Inf Syst 24(4):101–121
6. Baba ML, Falkenburg DR, Hill DH (1996) Technology man-
agement and American culture: implications for business process
redesign. Res Technol Manage 39(6):44–54
7. Basso A, Goldberg D, Greenspan S, Weimer D (2001) Emotional
and cognitive factors underlying judgments of trust e-commerce.
In: Proceedings 3rd ACM conference on electronic commerce.
ACM Press, New York, pp 137–143
8. Bhattacherjee A (2002) Individual trust in online firms: scale
development and initial test. J Manage Inf Syst 19(1):211–241
9. Bickmore T, Cassell J (2001) Relational agents: a model and
implementation of building user trust. Proc CHI 2001:396–403
10. Briggs P, Burford B, De Angeli A, Lynch P (2002) Trust in
online advice. Social Sci Comput Rev 20(3):321–332
11. Corritore CL, Kracher B, Wiedenbeck S (2003) On-line trust:
concepts, evolving themes, a model. Int J Human Comput Stud
Trust Technol 58(6):737–758
12. Cramer H, Evers V, Ramlal S, Someren M, Rutledge L, Stash N,
Aroyo L, Wielinga B (2008) The effects of transparency on trust
in and acceptance of a content-based art recommender. User
Model User Adap Inter 18(5):455–496
13. Denning DE (1993) A new paradigm for trusted systems. In:
Proceedings of the 1992–1993 workshop on new security
paradigms
14. Deutsch M (1960) Trust, trustworthiness, and the F Scale. J Ab-
norm Soc Psychol 61(1):138–140
15. Deutsch M (1973) The resolution of conflict: constructive and
destructive processes. Yale University Press, New Haven
16. Dunn JR, Schweitzer ME (2005) Feeling and believing: the
influence of emotion on trust. J Pers Soc Psychol 88(5):736–748
17. Fishbein M, Ajzen I (1975) Beliefs, attitude, intention and
behavior: an introduction to theory and research. Addison-Wes-
ley, Reading, MA
18. Fogg BJ, Marshall J, Kameda T, Solomon J, Rangnekar A, Boyd
J, Brown B (2001) Web credibility research: a method for online
experiments and early study results. In: Proceedings of CHI2001,
extended abstracts. ACM Press, New York, pp 295–296
19. Fogg BJ, Marshall J, Laraki O, Osipovich A, Varma C, Fang N,
Paul J, Rangnekar A, Shon J, Swani P, Treinen M (2001) What
makes web sites credible? A report on a large quantitative study.
In: Proceedings of CHI2001. ACM Press, New York, pp 61–68
20. Fogg BJ (2002) Persuasive technology: using computers to
change what we think and do. Morgan Kaufman, San Francisco
21. Fox A (1974) Beyond contract: work, power, and trust relations.
Faber, London, UK
22. Grandison T, Sloman M (2000) A survey of trust in internet
applications. IEEE Commun Surv 4th Quart 3(4):2–16
Pers Ubiquit Comput (2013) 17:1295–1313 1311
123

23. Herlocker JL, Konstan JA, Riedl J (2000) Explaining collabora-
tive filtering recommendations. In: Proceedings of the 2000 ACM
conference on computer supported cooperative work. ACM
Press, New York, pp 241–250
24. Huang H, Keser C, Leland J, Shachat J (2003) Trust, the Internet
and the digital divide. IBM Syst J 42(3):507–518
25. Karvonen K (2001) Designing trust for a universal audience: a
multicultural study on the formation of trust in the internet in the
Nordic countries. In: Stephanidis C (ed) First international con-
ference on universal access in human-computer interaction, vol 3.
Erlbaum, Mahwah, NJ, pp 1078–1082
26. Kim J, Moon JY (1997) Designing towards emotional usability in
customer interfaces-trustworthiness of cyber-banking system
interfaces. Interact Comput 10:1–29
27. Kim J, Moon J (1998) Designing towards emotional usability in
customer interfaces: trustworthiness of cyber-banking system
interfaces. Interact Comput 10:1–29
28. Lee KC, Chung N (2009) Understanding factors affecting trust in
and satisfaction with mobile banking in Korea: a modified De-
Lone and McLean’s model perspective. Interact Comput
21(5–6):385–392
29. Lee J, Kim J, Moon JY (2000) What makes internet users visit
cyber stores again? Key design factors for customer loyalty. In:
Proceedings of CHI2000. ACM press, New York, pp 305–312
30. Lee J, Moray N (1992) Trust, control strategies and allocation of
function in human-machine systems. Ergonomics 35(10):1243–
1270
31. Liu Z, Joy AW, Thompson RA (2004) A dynamic trust model for
mobile ad hoc networks. In: Proceedings of the 10th IEEE
international workshop on future trends of distributed computing
systems (FTDCS 2004), pp 80–85
32. Lohse GL, Spiller P (1998) Electronic shopping. Commun ACM
41(7):81–87
33. Lumsden J, MacKay L (2006) How does personality affect trust
in B2C e-commerce? In: Proceedings 8th international confer-
ence on electronic commerce: the new e-commerce: innovations
for conquering current barriers, obstacles and limitations to
conducting successful business on the internet. ACM Press, New
York, NY, pp 471–481
34. McCrickard DS, Czerwinski M, Bartram L (2003) Introduction:
design and evaluation of notification user interfaces. Int J Hum
Comput Stud 58(5):509–514
35. McKnight DH, Chervany NL (2001) Trust and distrust defini-
tions: one bite at a time. In: Falcone R, Singh M, Tan Y-H (eds)
Trust in cyber-societies. Springer, Berlin
36. McKnight DH, Choudhury V, Kacmar C (2002) Developing and
validating trust measures for e-commerce: an integrative typol-
ogy. Inf Syst Res 13(3):334–359
37. Mui L (2003) Computational models of trust and reputation:
agents, evolutionary games, and social networks. Doctoral dis-
sertation, Massachusetts Institute of Technology, 2003
38. Muir BM (1987) Trust between humans and machines, and the
design of decision aids. Int J Man Mach Syst 27:527–539
39. Muir BM (1994) Trust in automation part I: theoretical issues in
the study of trust and human intervention in automated systems.
Ergonomics 37(11):1905–1922
40. Muir BM, Moray N (1996) Trust in automation part II: experi-
mental studies of trust and human intervention in a process
control simulation. Ergonomics 39(3):429–469
41. Nielsen J (1999) Trust or bust: communicating trustworthiness in
Web design. http://www.useit.com/alertbox/990307.html
42. Nielsen J, Molich R, Snyder S, Farrell C (2000) E-commerce user
experience: trust. Nielsen Norman Group
43. Olson JS, Zheng J, Bos N, Olson GM, Veinott E (2002) Trust
without touch: jumpstarting long-distance trust with initial social
activities. In: Proceedings of CHI2002, pp 141–146
44. PhoneScreen: http://wikis.in.nokia.com/AlphaLabs/PhoneScreen
45. Pu P, Chen L (2007) Trust-inspiring explanation interfaces for
recommender systems. Knowl Based Syst 20(6):542–556
46. Riegelsberger J (2003) Interpersonal cues and consumer trust in
e-commerce. In: Proceedings of CHI2003, extended abstracts,
ACM press, New York, pp 718–719
47. Riegelsberger J, Sasse MA (2001) Trust builders and trustbusters:
the role of trust cues in interfaces to E-commerce applications. In:
Towards the E-society: proceedings of the first IFIP conference
on E-commerce, E-society, and E-Government, pp 17–30
48. Riegelsberger J, Angela Sasse M, McCarthy JD (2005) Do people
trust their eyes more than ears? Media bias in detecting cues of
expertise. In: Proceedings of CHI2005. ACM Press, New York,
pp 1745–1748
49. Riegelsberger J, Sasse AM, McCarthy JD (2005) The mechanics
of trust: a framework for research and design. Int J Hum Comput
Stud 62(3):381–422
50. Riley V (1996) Operator reliance on automation: theory and data.
In: Parasuraman R, Mouloua M (eds) Automation and human
performance: theory and applications. Lawrence Erlbaum Asso-
ciates, Mahwah, New Jersey, pp 19–36
51. Rukzio E, Hamard J, Noda C, Luca AD (2006) Visualization of
uncertainty in context aware mobile applications. In: Proceedings
of mobile HCI. ACM Press, New York, NY, pp 247–250
52. Schechter SE, Dhamija R, Ozment A, Fischer I (2007) The
emperor’s new security indicators. In: Proceedings of 2007 IEEE
symposium on security and privacy, pp 51–65
53. Shelat B, Egger FN (2002) What makes people trust online
gambling sites? In: Proceedings of CHI2002, extended abstracts.
ACM Press, New York, pp 852–853
54. Sheppard BH, Hartwick J, Warshaw PR (1988) The theory of
reasoned action: a meta analysis of past research with recom-
mendations for modifications in future research. Consumer Res
15(3):325–343
55. Sheridan T (1980) Computer control and human alienation.
Technol Rev 83:61–73
56. Sillence E, Briggs P, Harris P, Fishwick L (2006) A framework
for understanding trust factors in web-based health advice. Int J
Hum Comput Stud 64(8):697–713
57. SnagIt: http://www.techsmith.com/screen-capture.asp
58. Steinbruck U, Schaumburg H, Duda S, Kruger T (2002) A picture
says more than a thousand words—photographs as trust builders
in e-commerce websites. In: Proceedings of CHI2002, extended
abstracts. ACM Press, New York, pp 748–749
59. Tan FB, Sutherland P (2004) Online consumer trust: a multi-dimensional model. J Electron Commer Org (JECO) 2(3):40–58
60. Venkatesh V, Davis FD (2000) A theoretical extension of the
technology acceptance model: four longitudinal field studies.
Manage Sci 46(2):186–204
61. Wang YD, Emurian HH (2005) An overview of online trust:
concepts, elements and implications. Comput Hum Behav
21:105–125
62. Yamagishi T, Yamagishi M (1994) Trust and commitment in the
United States and Japan. Motiv Emot 18:129–166
63. Yan Z (2007) Trust management for mobile computing plat-
forms. Dissertation, Helsinki University of Technology
64. Yan Z (2010) Trust modeling and management in digital envi-
ronments: from social concept to system development. IGI Glo-
bal. doi:10.4018/978-1-61520-682-7
65. Yan Z, Dong Y, Niemi V, Yu GL (2009) Exploring trust of
mobile applications based on user behaviors. InTrust 2009. LNCS
6163:212–226
66. Yan Z, Holtmanns S (2008) Trust modeling and management:
from social trust to digital trust. In: Subramanian R (ed) Com-
puter security, privacy and politics: current issues, challenges and
solutions. IGI Global
1312 Pers Ubiquit Comput (2013) 17:1295–1313
123

67. Yan Z, Niemi V (2009) A methodology towards usable trust
management. Proc Auton Trust Comput ATC09, LNCS 5586:
179–193
68. Yan Z, Yan R (2009) Formalizing trust based on usage behav-
iours for mobile applications. Proc ATC09 LNCS 5586:194–208
69. Yan Z, Zhang P, Deng RH (2012) TruBeRepec: a trust-behavior-
based reputation and recommender system for mobile
applications. Pers Ubiquit Comput 16(5):485–506. doi:10.1007/
s00779-011-0420-2
70. Zimmerman J, Kurapati K (2002) Exposing profiles to build trust
in a recommender. In: Proceedings of CHI2001, extended
abstracts. ACM Press, New York, pp 608–609
71. Zuboff S (1988) In the age of the smart machine. Basic Books,
New York
Pers Ubiquit Comput (2013) 17:1295–1313 1313
123

Reproduced with permission of the copyright owner. Further reproduction prohibited withoutpermission.