Embed Size (px)
Citation preview

Exploring the Evidence:Reporting Research on First-Year Seminars
Volume IV
National Resource Center for The First-Year Experience®
& Students in TransitionUniversity of South Carolina, 2008
Angela M. Gri� n and Jonathan RommEditors

Cite as:
Griffin, A. M., & Romm, J. (Eds.). (2008). Exploring the evidence, vol. IV: Reporting research on first-year seminars. Columbia, SC: University of South Carolina, National Resource Center for The First-Year Experience and Students in Transition. Retrieved [date] from, http://www.sc.edu/fye/resources/fyr/index.html
Sample chapter citation:
Friedman, D., & Marsh. B. (2008). Appalachian State University. In A. M. Griffin & J. Romm (Eds.), Exploring the evidence, vol. IV: Reporting research on first-year seminars (pp. 7-10). Columbia, SC: University of South Carolina, National Resource Center for The First-Year Experience and Students in Transition. Retrieved [date] from, http://www.sc.edu/fye/resources/fyr/index.html
Copyright © 2008 University of South Carolina. All rights reserved. No part of this work may be reproduced or copied in any form, by any means, without written permission of the University of South Carolina.
The First-Year Experience® is a service mark of the University of South Carolina. A license may be granted upon written request to use the term “The First-Year Experience.” This license is not transferable without written approval of the University of South Carolina.
Volume Credits:Copyediting and proofing Tracy L. Skipper, Editorial Projects Coordinator Toni Vakos, Editor Emily Mullins, Graduate Assistant Dottie Weigel, Graduate Assistant
Layout and design Erin M. Morris

iii
Foreword . . . . . . . . . . . . . . . . . . . . . . . . . . . . . . . . . . . . . . . . . . . . . . vBarbara F. Tobolowsky
Antioch College . . . . . . . . . . . . . . . . . . . . . . . . . . . . . . . . . . . . . . . . . . 1Janice Rye Kinghorn, Christine Smith, and Eli Nettles
Appalachian State University . . . . . . . . . . . . . . . . . . . . . . . . . . . . . . . . . 7Dan Friedman and Beth Marsh
Babson College . . . . . . . . . . . . . . . . . . . . . . . . . . . . . . . . . . . . . . . . . 11Rob Major and Michele Brown
Brigham Young University Hawaii . . . . . . . . . . . . . . . . . . . . . . . . . . . . . 15Maureen Snow Andrade
Indiana University Southeast . . . . . . . . . . . . . . . . . . . . . . . . . . . . . . . . 21Donna Dahlgren
Indiana University-Purdue University Indianapolis. . . . . . . . . . . . . . . . . . 27Michele Hansen, Gayle Williams, and Lauren Chism
Lourdes College . . . . . . . . . . . . . . . . . . . . . . . . . . . . . . . . . . . . . . . . . 41Deborah Schwartz and Kimberly Grieve
Metropolitan State University . . . . . . . . . . . . . . . . . . . . . . . . . . . . . . . . 45Mary Kirk and Megumi Yamasaki
Miami Dade College . . . . . . . . . . . . . . . . . . . . . . . . . . . . . . . . . . . . . . 49Valerie De Angelis and Joanne Bashford
Contents
iv Contents
Northern Illinois University . . . . . . . . . . . . . . . . . . . . . . . . . . . . . . . . . . . . . . .53J. Daniel House, Denise Rode, and Beiling Xiao
Northern Kentucky University . . . . . . . . . . . . . . . . . . . . . . . . . . . . . . . . . . . . .57Peg Adams, James H. Thomas, and Cyndi R. McDaniel
Portland State University . . . . . . . . . . . . . . . . . . . . . . . . . . . . . . . . . . . . . . . . .61Christopher Carey and Kerensa Loucks
Sam Houston State University. . . . . . . . . . . . . . . . . . . . . . . . . . . . . . . . . . . . . .65Keri L. Rogers, Richard F. Eglsaer, Mitchell J. Muehsam, Beth Caillouet, and Lisa Kan
University of California, Los Angeles . . . . . . . . . . . . . . . . . . . . . . . . . . . . . . . . .69Marc Levis-Fitzgerald and Nida Denson
University of Minnesota. . . . . . . . . . . . . . . . . . . . . . . . . . . . . . . . . . . . . . . . . .73Kathleen Peterson and Robin Stubblefield
University of Texas at El Paso . . . . . . . . . . . . . . . . . . . . . . . . . . . . . . . . . . . . . .79Maggy Smith, Dorothy Ward, Ann Darnell, and Francisco Martinez
University of Washington Bothell . . . . . . . . . . . . . . . . . . . . . . . . . . . . . . . . . . .83Gray Kochhar-Lindgren, J. Droege, S. Leadley, R. M. Price, B. R. Rosenberg, and B. Tippens
University of Wisconsin - Green Bay. . . . . . . . . . . . . . . . . . . . . . . . . . . . . . . . . 89Denise Bartell, Deborah Furlong, Scott Furlong, Regan A. R. Gurong, Andrew Kersten, and Georjeanna Wilson-Doenges
University of Wisconsin - Whitewater . . . . . . . . . . . . . . . . . . . . . . . . . . . . . . . 97Chunju Chen, Jeff C. Janz, and John W. Miller
University of Wisconsin - Whitewater . . . . . . . . . . . . . . . . . . . . . . . . . . . . . . . 101Edward J. Furlong and Linda Long
Wells College. . . . . . . . . . . . . . . . . . . . . . . . . . . . . . . . . . . . . . . . . . . . . . . . 105Cindy J. Speaker
West Texas A&M University . . . . . . . . . . . . . . . . . . . . . . . . . . . . . . . . . . . . . . 111Mo Cuevas, Amy Andersen, Jessica Mallard, and Russell Lowery-Hart
v
In 1993, the National Resource Center for The First-Year Experience and Students in Transition published its first volume of Exploring the Evidence: Reporting Outcomes of
First-Year Seminars. It was critical at that time to provide evidence of the value of the course and support its continued development. Fifteen years later, we are presenting the fourth volume of the series, and the needs have not changed. Although the course is in-stitutionalized at many higher education institutions, evidence from our seminar survey and anecdotally from phone call and e-mail requests suggests that the seminar’s existence continues to be threatened on many of our campuses.
The seminar has changed a great deal from the early 1990s. Today, the seminar tends to be part of an overall approach to the first year rather than an isolated effort to help students through their transition. This change is reflected in the great range of courses now offered. Seminars may be academic, extended orientations, basic study skills, or a bit of all the above. The courses may be required or elective, one or three credits, and embedded in learning communities or stand-alone courses. This diversity is apparent in the 22 case studies included here.
What is also evident in these examples is that the objectives of the assessments are equally varied. While some institutions focus on increased persistence and GPAs, others explore questions of engagement, self-confidence, service-learning, intellectual develop-ment, peer support, campus supportiveness, career exploration and decision-making, and faculty-student interactions in and out of the classroom. These questions require qualitative and quantitative approaches, and you will find both methodologies in these pages. Some institutions have created instruments while others use established ones. Some employ individual interviews, focus groups, or writing prompts to better understand the student experience. Assessment is key to program development and improvement, and many of the institutions discuss how the assessment led to course changes. It is important to note that all institutional types are included in this collection as well, representing the fact that the seminar is an important element of the first year at liberal arts colleges, community colleges, and research institutions.
Foreword

vi Foreword
Our primary hope is that the variety of the case studies makes this collection a unique and valuable resource as you develop new, reinvigorate old, and/or institutionalize the first-year seminar on your campuses.
Barbara F. TobolowskySeptember 16, 2008

1
The InstitutionAntioch College, located in Yellow Springs, Ohio, is a small, private, residential liberal
arts college enrolling 459 undergraduates. The majority of our students (53%) describe themselves as Caucasian, 8.3% identified themselves as African American, Asian, His-panic, or Native American, and 58% are female. Students over 25 years of age comprise 5% of our student population. Data from the Cooperative Institutional Research Program Freshman Survey indicate that around 20% of our student body have parents who did not complete a college degree. Antioch has a strong cooperative education program. Every student alternates terms spent working and taking classes, completing three to four co-op work experiences prior to graduation.
The SeminarAntioch’s first-year students enter the college through our Core Program, which
was piloted in the 2005-2006 academic year as a way to improve retention and increase student preparation for the upper-level curriculum, particularly with respect to integrated learning. The Core Program consists of a 15-credit learning community. Students learn in a fully integrated, common cohort of approximately 30 students with three classroom faculty members and one co-op faculty member. Although the students’ credits represent/are divided into four distinct areas (four credits in three disciplines reflecting the faculty’s area of expertise plus three credits for “core”), the experiences are truly integrated with all faculty present for the majority of the class time. Students may take an additional three credits of electives, but the Core Program makes up the bulk of their academic credit for their first term on campus.
Each Core Program revolves around a common theme or problem. One learning community focused on Citizenship and was led by a professor of art, a historian, and a political scientist. Another, called Cool, was led by professors of music, physics, and psychology who described the course in the following way:
Antioch College

2 Antioch College
That’s Cool! It’s a word we use all the time, with many different meanings. Cool can mean a temperature, an emotional state, a particular psychological and behavioral stance towards the world, the quality of various colors, various styles of music, an exclamation of approval, an expression of amazement, a judgment of suitability to be included in a specialized social group, and more. This Core Community will explore the many meanings and associations of the word, including the topics of absolute temperature, the theory of relativity, electronics and digital computers, electricity and magnetism, the physics of sound and recording, jazz from the 1940s and 50s, various genres of popular music from a variety of historical periods, avant garde music, new computerized methods of composition, the Beat generation, various Afri-can and European cultural equivalents to American Cool, issues of socialization, alienation, targeted advertising, group dynamics, racial socialization, peer pressure, and ways of dealing with stress and discrimination. Be cool, learn about cool, understand cool!
Each Core program is designed to support students in acquisition and improvement of basic skills such as writing, quantitative methods, and critical thinking. The Core supports acquisition of college-level skills of inquiry and civic engagement. The Core program prepares students for experiential learning in their first co-op placement, which occurs at the beginning of their second year.
Research Design First-year students are expected to enroll in a minimum of 15 credits (one Core Community)
and may take up to three additional credits for a maximum load of 18 credits each of their first two terms. In order to stay on track to graduate, students must earn an average of 16 credits per study term. To avoid warning or probationary status and stay above the minimum standards of progress, students must earn 75% of their registered credits each term.
Surveys were administered to first-year students during the eighth week of their first term on campus with a response rate of 90% (N = 97). The survey consisted of 60 statements that addressed satisfaction with campus culture, attitudes toward administration, peer relationships, and attitudes toward curriculum. Participants rated their agreement on a five-point Likert scale ranging from 1 = strongly disagree to 5 = strongly agree.
The goal of this study was to address several questions related to retention and student success. We address two main questions here:
Is participation in Core Program associated with student success as measured by the number 1. of credits earned each term? Is participation in the Core Program associated with student satisfaction as measured by 2. responses to the first-year survey?
FindingsBased on credit reports from the Registrar’s Office, the average number of credits earned by
first-year students increased from 12 in 2004-2005 to 14 in 2005-2006. Retention rates, however, did not improve. Based on focus groups, retention issues were shown to be linked to the difficul-ties of the transition process between programs. Tension resulted from offering two curriculums simultaneously—upper-class students still on the old curriculum expressed concerns about the new

Antioch College 3
program; first-year students questioned the validity of a program the upper-class students did not have to participate in; and faculty felt pressed to meet the needs of both curriculums.
Two survey statements—“I am satisfied with my decision to attend Antioch.” and “I am think-ing about leaving Antioch.”—were of particular interest in regards to retention. These items were significantly correlated with each other (r = -.78, p < .01). A series of correlations were performed to examine which other survey statements correlated with student satisfaction and intention to leave. The tables contains the items most strongly correlated, defined as a correlation of +/- .35 or stronger (see Tables 1 and 2).
Table 1Significant Correlates With Satisfaction
Satisfaction
Positive about learning in an integrated Core .40
Comfortable expressing non-normative opinions .51
Happy with social opportunities on campus .48
Antioch is too radical. .42
There are opportunities to make a difference. .46
Educational needs can be met here. .80
Experiences have been positive. .64
Dorm is a good place to study. .35
Most upper-level students are open-minded. .36
Table 2Significant Correlates With Intention to Leave
Leave
Positive about learning in an integrated Core -.38
Comfortable expressing non-normative opinions -.41
Happy with social opportunities on campus -.38
There are opportunities to make a difference. -.39
Educational needs can be met here. -.78
Experiences have been positive. -.63

4 Antioch College
Note that all six strong correlates with intent to leave are also strongly correlated with satisfac-tion. However, satisfaction with decision to attend Antioch also included statements addressing level of radicalism, dorm experiences, and relationships with upper-level students. These items were not significantly related with intention to leave.
Next, a linear regression analysis was performed to examine predictors of satisfaction. Each of the nine items from Table 1 was regressed on satisfaction. The regression was significant (R2 = .69, p < .01). Three variables had significant betas, “educational needs can be met here” (β = .52, p < .01), “experiences have been positive” (β = .21, p < .05) and “Antioch is too radical” (β = -.16, p = .05).
Because regressing nine variables on satisfaction may compromise power, a third regression was performed examining the same six variables that were regressed on satisfaction. The regression was significant (R2 = .69, p < .01). Two variables were significant predictors: “educational needs can be met here” (β = -.56, p < .01) and “experiences have been positive” (β = -.25, p < .05).
A linear regression analysis was performed to examine predictors of intent to leave. Each of the six items from Table 2 was regressed on satisfaction. The regression was significant (R2 = .66, p < .01). Two variables were significant predictors, “educational needs can be met here” (β = -.78, p < .01) and “experiences have been positive” (β = -.45, p < .01).
Thus, the most significant predictors of satisfaction and intention to stay were whether stu-dents believed that they could have their educational needs met at Antioch College and having positive experiences at the college.
Student perception that they can get educational needs met here may have a different meaning to students than to faculty. Faculty interpreted this as presence of course offerings/programs in a student’s area of interest as well as appropriate support/challenge of the academic program. To examine how students might have interpreted this, we examined survey items that significantly correlated with the belief that educational needs can be met at Antioch. Table 3 contains the items most strongly correlated with educational needs met, defined as a correlation of +/-.35 or stronger.
Table 3Correlates With Believing Educational Needs Could Be Met at Antioch
Educational Needs Met
Positive about learning in an integrated Core .46
My courses are challenging. .40
Staff members are helpful. .35
Comfortable expressing non-normative opinions .49
Experiences have been positive. .60
Happy with social opportunities on campus .39
Upper-level students are positive role models. .39
There are opportunities to make a difference. .45
First-year students are satisfied with campus climate. .37

Antioch College 5
Note that only two significant statements are related to classroom experiences. Thus, students seem to include getting their educational needs met as including interactions with other students and involvement with the campus community.
Regarding relationships with faculty and course content, first-year students reported over-whelmingly that they felt respected by faculty (90% agreed or strongly agreed). Those who felt their Core learning community was challenging were also more satisfied (r = .24, p < .05) and intended to stay (-.27, p < .01).
A t-test was performed for each of the survey items to examine gender differences. Relatively few differences emerged. Women were significantly more likely to report feeling that they had opportunities to make a difference and were more satisfied with learning in an integrated Core community while male participants wanted more recreational opportunities.
Findings about first-year students’ feelings of alienation and disconnect from the larger cur-riculum have led us to broaden the focus and delivery of our first-year program. Faculty teaching in the learning communities are now more deliberate about encouraging and facilitating student involvement with the larger campus community. Antioch’s Orientation Committee has reconceived their charge to one that extends beyond the first weekend of the fall to throughout the first year. Additional plans include a common reading for all students that can be integrated into the cur-riculum, speakers, and a film series to tie in with the academic content of the learning communities. Scholarly activities that connect the learning communities to the larger Antioch community and provide opportunities for students at all levels to engage are planned to increase rapport.
ContributorsJanice Rye Kinghorn (primary contact)Associate Professor of EconomicsAntioch College795 Livermore St.Yellow Springs, OH Phone: (937) 769-1330E-mail: [email protected]
Christine SmithAssociate Professor of Psychology
Eli NettlesAssociate Professor of Mathematics

7
The InstitutionAppalachian State University (ASU), located in Boone, North Carolina, is a four-
year, public, comprehensive university that enrolls approximately 15,000 students. Ninety percent of ASU students are full-time undergraduates with 50% of students living on campus or nearby. Eighty percent of Appalachian students are under the age of 22. Ap-proximately 48% of students are male. Nearly 94% of the students are White with 6.5% representing minorities, including 3.5% African American, 1.2% Asian American, 1.2% Hispanic, 0.4% Native American, and 0.2% nonresident alien. Appalachian is a member institution of the University of North Carolina system.
The SeminarFreshman Seminar (US 1150) was first offered at Appalachian in 1987. This three-
credit, graded extended orientation course is an elective, which enrolls approximately 60% of the first-year class throughout the academic year. Of the 2,522 incoming first-year students in the fall 2005 cohort, 1,314 were enrolled in Freshman Seminar during the fall semester (52%). The maximum enrollment is 24 students per class. Freshman Seminar is taught by faculty members (full-time and adjunct), student development professionals, and administrative personnel.
This course aims to acquaint students with the opportunities and demands of higher education; support them in their transition to the university; help foster cognitive and psychosocial development; and assist in developing relationships with faculty, staff, and peers. Course components include study strategies, time management, personality type theory, wellness, academic research, personal safety, academic integrity, diversity, the his-tory of Appalachian State University, career planning, and cultural appreciation.
Freshman Seminar serves as the anchor course for our Freshman Learning Com-munities, meaning that each seminar class is linked to another core curriculum or major-specific course (e.g., anthropology, English, geography, mathematics, or psychology). These learning communities bring faculty and students together to discuss, explore, and learn
Appalachian State University

8 Appalachian State University
about a shared academic interest or common topic. Instructors of these communities meet often to discuss student successes and concerns, course assignments, and possible connecting points between the classes. Appalachian State offers a number of learning communities reflecting the various interests of its students.
Research DesignA great deal of research has explored the impact of first-year seminars on retention and aca-
demic performance; however, less attention has been given to exploring these results by students’ incoming abilities. In other words, do lower-ability students benefit more or less from participation in Freshman Seminar than their high-ability counterparts?
In order to answer this question, we designed a study to analyze the impact of Freshman Seminar on academic achievement and one-semester retention rates for the 2005 first-year class based on students’ expected ability levels. Expected ability level is based upon predicted grade point averages (PGPA), a formula considering class rank, SAT scores, and high school grade point averages. The five ability levels, and the breakdown by participation in Freshman Seminar, can be found in Table 1.
We used independent t-tests to analyze differences in grade point averages. We conducted a chi-square analysis to compare retention rates.
FindingsStudents who enrolled in Freshman Seminar had significantly lower PGPAs (M = 2.78)
than students who did not enroll in Freshman Seminar (M = 2.90), p = .002. This difference also translated into a significantly lower mean ability level for Freshman Seminar students (M = 4.14) than for non-Freshman Seminar students (M = 3.66), p < .001. The breakdown of enrollment by ability level can be found in Table 1.
Table 1Enrollment in Freshman Seminar by Ability Level
Percent by ability level
PGPA range Freshman seminar Non-FS
n % n %
Level 1 3.6 - 4.0 11 0.8 49 4.0
Level 2 3.25 - 3.59 95 7.2 229 18.7
Level 3 3.0 - 3.24 219 16.6 234 19.1
Level 4 2.75 - 2.99 363 27.5 262 21.4
Level 5 2.74 and below 626 47.6 434 35.9
Appalachian State University 9
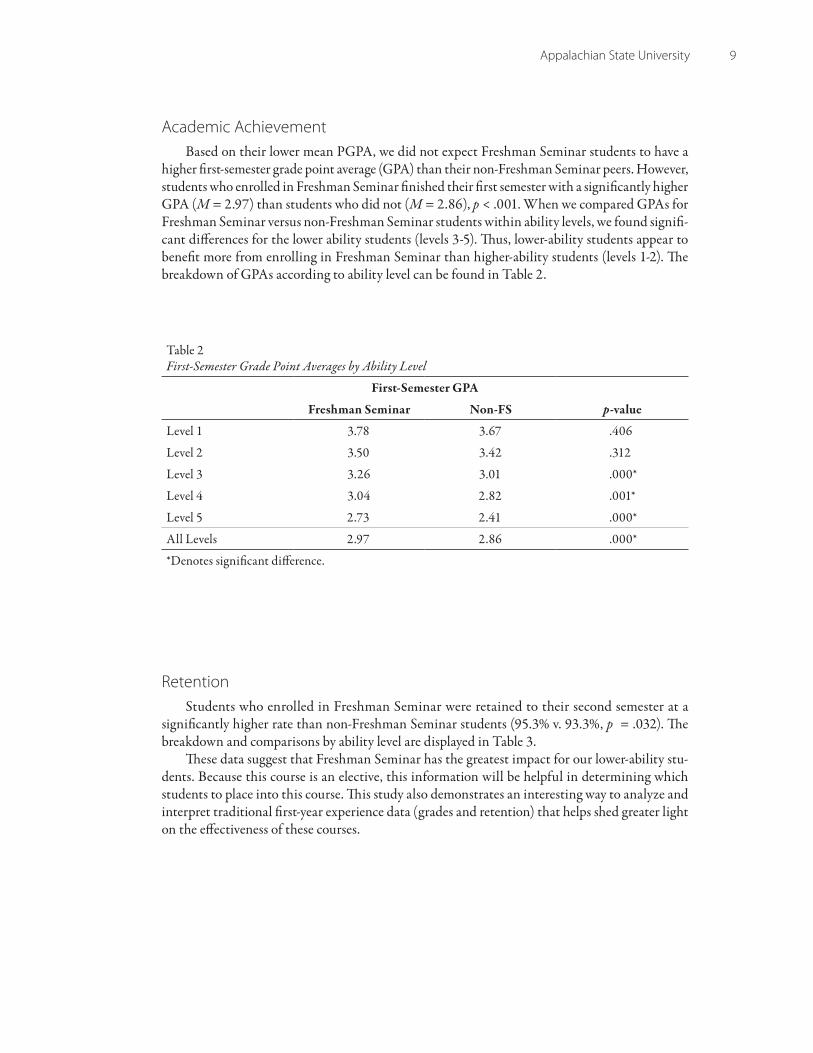
Academic AchievementBased on their lower mean PGPA, we did not expect Freshman Seminar students to have a
higher first-semester grade point average (GPA) than their non-Freshman Seminar peers. However, students who enrolled in Freshman Seminar finished their first semester with a significantly higher GPA (M = 2.97) than students who did not (M = 2.86), p < .001. When we compared GPAs for Freshman Seminar versus non-Freshman Seminar students within ability levels, we found signifi-cant differences for the lower ability students (levels 3-5). Thus, lower-ability students appear to benefit more from enrolling in Freshman Seminar than higher-ability students (levels 1-2). The breakdown of GPAs according to ability level can be found in Table 2.
Table 2First-Semester Grade Point Averages by Ability Level
First-Semester GPA
Freshman Seminar Non-FS p-value
Level 1 3.78 3.67 .406
Level 2 3.50 3.42 .312
Level 3 3.26 3.01 .000*
Level 4 3.04 2.82 .001*
Level 5 2.73 2.41 .000*
All Levels 2.97 2.86 .000*
*Denotes significant difference.
Retention Students who enrolled in Freshman Seminar were retained to their second semester at a
significantly higher rate than non-Freshman Seminar students (95.3% v. 93.3%, p = .032). The breakdown and comparisons by ability level are displayed in Table 3.
These data suggest that Freshman Seminar has the greatest impact for our lower-ability stu-dents. Because this course is an elective, this information will be helpful in determining which students to place into this course. This study also demonstrates an interesting way to analyze and interpret traditional first-year experience data (grades and retention) that helps shed greater light on the effectiveness of these courses.

10 Appalachian State University
Table 3One-Semester Retention Rates by Ability Level
Retention Rate
Freshman Seminar Non-FS p-value
Level 1 100% 100% -
Level 2 97.9% 96.5% .398
Level 3 95.9% 91.9% .056
Level 4 94.5% 91.6% .105
Level 5 95.0% 92.9% .087
All Levels 95.3% 93.3% .032*
*Denotes significant difference.
ContributorsDan FriedmanDirector, University 101University of South Carolina
Beth Marsh (primary contact)Assistant Director, Freshman SeminarAppalachian State University1114 Old BelkBoone, NC 28608Phone: (828) 262-2028Email: [email protected]

11
The InstitutionBabson College, a private, four-year business school, is predominately known for
its emphasis on integrated teaching and learning instructional methods, as well as its reputation for teaching entrepreneurship. Located 14 miles west of Boston in Wellesley, Massachusetts, Babson hosts approximately 1,700 co-educational and traditionally aged (18-24) residential undergraduates.
Of the 443 first-year students enrolled in the fall of 2006, 60% were male. Addition-ally, according to the data generated from the 2006 Cooperative Institutional Research Program (CIRP) Freshman Survey, the demographic distribution of Babson first-year students (class of 2010) was as follows: 66.8% Caucasian/White, 19% Asian American/Asian, 10.7% Latino, 2.6% African American/Black, 1.3% American Indian/Alaska Na-tive, 0.4% Native Hawaiian/Pacific Islander, and 8.2% self-identified as “other.”
The SeminarBabson College’s approach to the first-year seminar has evolved considerably over the
past 10 years. In the mid-1990s, the first iterations of the seminar stemmed from breakout sessions of a required first-year course that occurred periodically throughout the fall semes-ter. These sessions eventually evolved into a free-standing, non-credit bearing course until 2005. In the fall of 2006, Babson’s seminar advanced to a graded, one-credit course.
The course, titled First Year Seminar (FYS 1300), is required of all Babson students. The course is a part of the core liberal arts requirements, and students receive a letter grade and earn academic credit for their mandatory participation in the program. Students must retake the course if they earn an F or withdraw before the semester ends. Each section is capped at approximately 20 students.
The primary instructor for the course is typically either a student affairs or academic affairs administrator; however, there is also a faculty advisor and peer mentor assigned to each section to form a team approach to conducting the seminar. This triad model helps to provide students with a variety of campus perspectives, as well as the ability to form
Babson College

12 Babson College
lasting relationships with key community constituents. Likewise, the FYS sections also serve as the new student orientation groups during the fall orientation program.
The content of the course is organized around three main themes:
Becoming part of the academic community (What is college all about?)1. Developing an understanding of yourself (How do I fit in?)2. Living in a global community (How do my actions impact others?)3.
Specific learning outcomes were also developed from each of these themes. As a result of taking the course, students are expected to better understand
The merits of scholarship and the expectations of joining an academic community ëThe resources at Babson that provide personal and academic support ëHealth and wellness issues facing today’s college generation ëTheir learning styles and how they fit the college environment ëThe impact of individual actions on the college and global community ëThe importance of ethics and social responsibility ë
Research DesignThe assessment of the FYS program is multi-faceted and designed to determine whether
students achieve the desired learning outcomes. Internally developed, web-based surveys include a combination of Likert-scaled (Strongly Agree, Agree, Neutral, Disagree, Strongly Disagree) and open-ended questions.
All participants (students, instructors, faculty advisors, and peer mentors) complete these surveys at the conclusion of the program. Students also complete the standard student opinion surveys that are issued at the end of the semester for all Babson courses. Furthermore, focus groups are conducted in the spring semester to provide additional insight on whether the learning out-comes are achieved.
First-year students also complete the Your First College Year (YFCY) assessment at the con-clusion of the spring semester. Babson has been a participant since the inception of this survey and believes the YFCY provides a comprehensive understanding of the first year for students at Babson.
FindingsThe results of the college assessment efforts regarding the First Year Seminar are encourag-
ing. The following is a sample of the results from the internally developed, student web-based survey. Of the 263 student respondents, 76.2% indicated that they agreed or strongly agreed that FYS helped them to develop the skills necessary to become a participatory member of the college community (Table 1).

Babson College 13
Table 1Student Outcomes of the First Year Seminar (N = 263)
Percentage of students responding
SA A N D SD
The FYS course developed my understanding of a scholarly community.
33.7 51.0 9.2 2.3 3.8
The FYS course developed my understanding of how I fit in to the Babson community.
27.3 47.3 15.0 7.3 3.1
The FYS course developed my understanding of how my actions can impact others.
28.4 44.4 16.9 6.5 3.8
Overall, the FYS course helped me develop the skills necessary to become a participatory member of the Babson community.
24.5 48.3 16.1 6.1 5.0
Students also provided feedback on the effectiveness of the members of their FYS facilitation team. See Table 2 for a summary of student ratings of their FYS team members.
Table 2Student Ratings of the Effectiveness of FYS Team (N = 263)
Percentage of students responding
SA A N D SD
My instructor was instrumental in helping students in the class achieve the goals of the program.
52.8 39.9 4.8 2.0 0.4
My instructor was available outside of scheduled class times.
48.8 35.9 14.1 1.2 0.0
My peer mentor was instrumental in helping students in the class achieve the goals of the program.
55.1 32.8 6.9 4.5 0.8
My peer mentor was available outside of scheduled class times.
52.0 29.0 17.5 1.2 0.4
My faculty advisor was instrumental in helping students in the class achieve the goals of the program.
40.2 42.1 13.8 2.8 1.2
My faculty advisor was available outside of class times.
44.4 28.4 23.7 2.3 1.2

14 Babson College
FYS instructors are required to attend two full-day training sessions (late May and mid-August), peer mentors participate in a four-day comprehensive training program prior to the start of new student orientation, and faculty advisors participate in a half-day training program. Each of these training programs is tailored to the specific roles of the participants. These data suggest that Babson’s investment in training and developing all members of the FYS team is a valuable, although extensive, process.
Lastly, the FYS team has a pre-arranged strategy session to plan their semester. This com-prehensive delivery model is an effort to provide a multidimensional approach to the FYS course content and personal and academic support structure. The student focus groups conducted provided significant support for the team approach to facilitating FYS.
Babson’s efforts to design and deliver an exemplary first-year experience continue to evolve. The challenge of maintaining consistency across FYS sections, determining the appropriate workload for a one-credit course, and designing reasonable and assessable learning outcomes are issues the college will continue to address as the program matures.
Contributors Rob Major Associate Dean, Academic ServicesBabson CollegeHollister Hall Babson Park, MA 02457-0310Phone: (781) 239-5246E-mail: [email protected]
Michele BrownFoundation Program Administrator
15
The InstitutionBrigham Young University (BYU) Hawaii, located in Laie, Hawaii, is a private,
religiously affiliated, residential, four-year undergraduate university. Enrollment consists of 2,500 students of whom 50% are international, primarily from Asia and the Pacific Islands. Student enrollment comprises U.S. Mainland 33%, Asia 29%, Hawaii 18%, Pacific Islands 15%, and other international 5%. Race/ethnicity consists of Asian/Oriental 33.9%, Caucasian/Non-Hispanic 30.7%, Pacific Islander 20.2%, Hawaiian/Part Hawaiian 7.8%, Hispanic 3.4%, Black/Non-Hispanic 1.0%, other 2.1%, and American Indian/Alaskan Native 0.8%. Approximately 31% of students are over 25, 42.3% are male, 92.3% are full-time, and 30.7% are first-generation (neither father nor mother attended any college).
The Seminar The first-year seminar at BYU-Hawaii, entitled “The International Student in the
University,” has been offered since 1994 as the result of an ESL program self-study. A finding of the self-study was that although individual ESL instructors introduced students to campus learning centers, cultural information, educational system expectations, and university policies, this information was not systematically addressed or included in the curriculum of a particular course. University-sponsored orientation did not directly focus on international students’ needs or consider their English proficiency levels. A required two-credit hour, one-semester seminar for all international students who test into ESL courses was developed and implemented in response. Approximately 86% of first-year international students and 67% of all first-year students enroll in the course each semester. Students receive letter grades, and credit counts toward graduation electives. Each section averages 15 students. Instructors in the ESL program teach the seminar.
Course objectives focus on improving students’ knowledge and understanding of (a) policies and procedures of the ESL program; (b) policies and procedures of the univer-sity; (c) campus resources, time management, computer, and study skills; (d) American university classroom culture; (e) American culture and appreciation of diversity; and (f)
Brigham Young University Hawaii

16 Brigham Young University Hawaii
Hawaiian history and culture. Course activities promote active learning (which may be unfamiliar to some) and include pair and group work, presentations, guest speakers, support service orienta-tions, computer use, and interview assignments. Students are also asked to complete a weekly learner journal in which they summarize the content of each class, share what they have learned, and identify and define new vocabulary. The development of English skills is not a specific objec-tive of the course, although students’ English is expected to improve as they engage with course materials and obtain practice with the language. Adjustment rather than persistence is the goal of the course.
Research DesignThe ESL program has regularly assessed the seminar through course evaluations, mid-semester,
small-group student discussions led by an outside facilitator, student/faculty open-ended surveys, and more recently, with an online survey containing Likert-scaled and open-ended questions. Course evaluations allow a consistent means of determining student views toward seminar objec-tives, organization, content, texts and materials, assignments and exams, grading, and level of new knowledge or skills. The small-group discussions permit full disclosure of students’ ideas regard-ing strengths and weaknesses of the course and suggestions for improvements. This format also has the advantage of determining representative views rather than only individual responses. The open-ended student surveys encourage the sharing of personal experiences and opinions about the value of the course without directing responses through a forced choice design. The faculty survey produces insights into pedagogical and philosophical approaches. Finally, the online survey measures long-term effects of the seminar.
FindingsCourse evaluations indicate that students are largely satisfied with the seminar. Results for
the past five years show that students “agree” to “strongly agree” that the seminar is well organized with clear objectives, has produced new knowledge and skills, and contains relevant and useful content. The facilitated student group discussions initially showed that students felt the course was too easy. This resulted in the introduction of the learner journal assignment, which helped students focus on English language development through vocabulary study, writing about what they learned, and reflecting on its value. This assignment also reinforced attendance and allowed teachers to identify topics needing review. Initially, seminar instructors rotated among course sections, addressing two objectives each over six class periods. The discussion groups revealed that students enjoyed the variety of teachers; however, scheduling was difficult, and teacher responses indicated that time was too short with each group to enable them to determine student mastery of material. As a result, we ended this practice.
Surveys revealed that students enjoyed the involvement and participation aspects of the seminar and wanted more activities that emphasized interaction and group work. They particularly appre-ciated topics related to university life and culture and found these topics, along with information on the ESL program, the most valuable. They expected the former two topics to be especially useful in the future. Instructors reported that they responded to the needs and interests of students but placed the greatest emphasis on information related to university life and the ESL program. They also identified successful teaching practices, such as using the first five minutes of each class as a student question period. The program director compiled and shared these pedagogical ideas with

Brigham Young University Hawaii 17
the teachers and encouraged them to include more interactive pedagogical practices and develop the cultural component of the course more fully in accordance with the student survey findings. Instructors noted that students expressed satisfaction with the seminar through their learner journals. Both students and instructors observed that English development was not directly emphasized. Instructors suggested the materials needed updating, particularly those related to registration procedures, graduation/general education requirements, and services on campus, as information related to these areas had changed over time. One instructor completed this on a voluntary basis after obtaining input from the larger group as to what changes were needed. The teacher updated the readings, handouts, exercises, and assignments to reflect current information.
The student/faculty survey created the desire to know if the seminar had long-lasting effects. In response, an online survey was administered to students a year after seminar completion. Students rated their familiarity and comfort with seminar topics and outcomes when they first arrived on campus, directly after completion of their first semester (and the seminar), and during the semester in which they took the survey (i.e., in their second year on campus). For example, on a six-point scale with 1 representing strongly disagree and 6 representing strongly agree, students indicated their level of knowledge with each of the seminar topics (e.g., university policies, the general education program, professors’ expectations) and their level of comfort with the active-learning behaviors targeted in the seminar (e.g., being an active learner, interacting with other cultures, finding help on campus). Tables 1 and 2 provide a complete listing of the seminar topics and outcomes.
We used paired samples t-tests to compare the mean ratings for each item across the three time periods. Results showed that students’ levels of familiarity and comfort increased over time for most of the topics. The largest gains occurred during the first semester. The majority of increases were statistically significant with a few exceptions. Knowledge of university policies did not show a significant increase after the first semester, perhaps because students had acquired much of this information in the first semester. Similarly, behaviors related to active learning, interacting with other cultures, and effective time use did not increase significantly after the first semester. Students may have made an initial adjustment in these areas after which they were not motivated to make further changes or did not see the need to do so.
The various assessment measures serve to triangulate the findings and are generally positive. They have also resulted in seminar modifications. Still to consider is a stronger focus on English skill development. This could be easily accomplished by a greater focus on vocabulary development using the course materials, by teacher response to student weaknesses in speaking and writing as evident in course assignments, and by providing mini-lessons focusing on areas of need. Providing students with more information prior to their arrival at the university might also be useful so that the learning curve in the first semester is not so great.

18 Brigham Young University Hawaii
Table 1Familiarity With Seminar Topics
General topicSpecific topic
areasFirst semester
(n = 40)
After first semester(n = 40)
Current(n = 40)
Level of knowledge
ESL program 3.20* 4.60* 4.95*
University policies 3.58* 4.60 4.80
U.S. university system
3.50* 4.55* 5.03*
General education 3.55* 4.53* 4.93*
U.S. classroom culture
3.70* 4.60* 4.95*
Professors’ expectations
3.60* 4.73* 5.03*
Hawaii/community
3.00* 4.25* 4.50*
Note. Responses regarding impact of seminar on above topics ranged from 4.25 to 4.75.
*p < .05.
Table 2Involvement and Comfort Levels With Active Learning
General topicSpecific topic
areasFirst semester
(n = 40)
After first semester(n = 40)
Current(n = 40)
Level of comfort Interacting with professors
3.70* 4.48* 4.75*
Being an active learner
4.25* 4.63 4.78
Participating in class
4.03* 4.55 5.68
Participating social life
3.93* 4.50* 4.83*
Interacting with other cultures
4.33* 4.70 4.90
Finding way around
4.20* 4.85* 5.13*
Knowing where/how to get help
4.03* 4.75* 5.00*
Using time effectively
4.15* 4.63 4.80
Note. Responses regarding impact of seminar on above topics ranged from 4.58 to 4.80.
*p < .05.

Brigham Young University Hawaii 19
Contributor Maureen Snow AndradeChair, Department of English Language Teaching and LearningBrigham Young University Hawaii55-220 Kulanui Street #1940Laie, HI 96762Phone: (808) 293-3606 E-mail: [email protected]


21
The InstitutionIndiana University (IU) Southeast is a regional, commuter campus located in New
Albany in the southern area of Indiana. IU Southeast is a four-year public university offering a few master’s programs. The campus serves 5,300 undergraduate students and 864 graduate students taught by 189 full-time faculty. The majority of the students are female (63%) and from Indiana (87%). Each year, there are 700-900 first-year students. Typically, half (52%) of the first-year class are students whose parents did not graduate from college. In addition, 87% of these students work 20 hours or more a week while attending IU Southeast full-time. Approximately 80% of the first-year students are aged 17-21 with the majority of the students (96%) being Caucasian, 2% African American, and 2% other.
The SeminarThe First Year Seminar (FYS) is a one-credit hour course attached to various three-
credit hour introductory-level courses. The FYS course has been in place for the past six years at IU Southeast. Based on the success of previous FYS students, first-year students are now required to take the FYS course during their first two semesters at college. Each FYS course has a maximum of 20 students and is taught by either a full-time faculty member or a recommended adjunct or professional staff member who has worked at IU Southeast for at least five years. Approximately 70% of first-year students choose to take the FYS during their first semester of college. Primary objectives of the FYS course are to increase student awareness of the services and resources that are available at IU South-east; to help students develop supportive relationships with a faculty member and with a cohort of other students, to improve students’ skills in reading, test-taking, research, and critical thinking; to engage the students in college by increasing their involvement in IU Southeast; and to develop students’ ability to use several computer resources that are available.
Indiana University Southeast
22 Indiana University Southeast
The course design strives to achieve enhanced academic and campus integration using the following strategies. To begin, all FYS instructors adapt a common core text personalized for our campus. In addition, all FYS instructors use Oncourse, a software application that allows students computer access to faculty-placed materials (e.g., PowerPoints, readings). To ensure students be-come familiar with the campus, a passport assignment, which requires students to collect stamps from primary offices all over campus, is used. The entire campus is involved in the passport, and each office is encouraged to provide friendly information to first-year students. In addition, the class visits the library for a guided tour and workshop (1 hour, 40 minutes), the writing help center (30 minutes), and career services (20 minutes) at some point during the semester. Workshops are conducted with faculty emphasizing active-learning strategies and different teaching methods that can be used to integrate FYS topics into the context of the attached course. For example, if the attached course is Introductory Psychology, the instructor emphasizes how to use the study skills to prepare for a psychology exam. Finally, each FYS student is required to attend and write a short paper about three extracurricular activities (cultural, social, and intellectual) that are on campus during the semester. To enhance social integration, the class size is 20 students. This ensures that students will become familiar with one another. In addition, the instructors are encouraged to use active-learning techniques and small-group activities as much as possible during the course of the semester. Finally, a planned class social with a faculty member occurs at least once during the course of the semester.
Research Design A longitudinal pre/post quasi-experimental assessment program is in place to assess the impact
of FYS on first-year students. At the beginning and end of each semester, each FYS student completes the FYS Survey. The survey is a 10-page questionnaire that asks about a variety of demographic information, study preferences, time management behaviors, their past education experiences, how they spend their time, their motivations for college, and their knowledge about IU Southeast. The ending survey also requires the students to evaluate their FYS experience. The questions tap identified constructs of interest in the development of first-year college students. The university ID numbers of each student are also collected to track their persistence in college.
Findings
Aspirations and ExpectationsAt the end of the fall 2005 semester, the results indicate that 91% of the first-year students
want to get a bachelor’s degree, and most (81%) plan to attend IU Southeast full-time in fall 2006; 7.2% expect to attend part-time. Table 1 illustrates their college attachment at the end of their first semester.

Indiana University Southeast 23
Table 1 College Attachment Measure of FYS Students at the End of Fall 2005
I am happy about my decision to attend Indiana University Southeast. Percentage of Men Percentage of Women
Not true of me 7.4 4.8
Neutral 33.0 28.6
True of me 59.5 66.7
Retention Table 2 describes the comparison between those students who were in a FYS course and those
who were not in a FYS course. As can be seen, students in a FYS course were more likely to stay enrolled and to return during the spring and fall semester. The beginning students enrolled in a FYS course were more likely to be retained than beginning students who did not take the FYS class during the semester (χ² (1, N = 788) = 49.89, p < 0.001). The beginning students enrolled in a FYS course were also more likely to return the following semester than beginning students who did not take a FYS class (χ² (1, N = 788) = 24.41, p < 0.001). In addition, beginning students enrolled in a FYS course were also more likely to return the following fall semester than begin-ning students who did not take a FYS class (χ² (1, N = 788) = 25.00, p < 0.001). These data clearly indicate the positive impact that taking the FYS class at IU Southeast has on the persistence of beginning students.
Table 2Analysis of Retention, Fall 2005 Cohort
FYS No FYS AnalysisNumber 556 280
Men 211 114Women 345 166
Age 19.57 22.46 t (830) = -7.537, p <.001Age in 17-20 range 86.9% 68%End status in fall 2005
Stayed 93.3% 78.1%Withdrew 2.9% 10.4%FN 2.5% 11.8% χ2 = 49.89, p < .001
Returned spring 2006 84.3% 69.3% χ2 = 24.41, p < .001Men 78.7% 67.5%Women 87.6% 70.5%
Returned fall 2006 63.4% 45.0% χ2= 25.00, p < .001Men 58.2% 34.2%Women 66.1% 32.6%
Note. FN means the students failed by not attending during the semester.

24 Indiana University Southeast
Grade Point AverageAn analysis was performed to ensure that the samples of students were similar prior to tak-
ing a FYS course. Results indicated no significant differences between students who took a FYS course versus and who did not. At the end of the semester, the fall 2005 GPAs of the students were compared. A two factor ANOVA with gender (men, women) and course (FYS versus No FYS) indicated a significant main effect of FYS and gender as well as an interaction between gender and FYS status. That is, women who took the course had a significantly higher GPA than women not enrolled in a FYS course. However, men did not show the same pattern, thus the significant interaction between gender and FYS status (see Table 3).
Additional analyses were conducted examining student knowledge about the university, which suggested that students knew more about IU Southeast at the end of the semester. Yet, as can be seen in Table 4, not all components of the course were highly valued by the students.
Table 3GPA Data, Fall 2005 Cohort
FYS No FYS Analysis
Fall 2005 GPA 2.76 2.50 FFYS (1, 675) = 7.58, p < .01
Men 2.49 2.45
Women 2.90 2.53 FGender (1, 675) = 10.43, p < .001
FFYSxGender (1, 675) = 4.51, p = .03
Table 4Student Perceptions of FYS Course Components, Fall 2005 (N = 389)
Strongly disagree or disagree Neutral
Strongly agree or agree
The FYS portion of the class offered helpful information.
22.9% 22.4% 51.2%
I learned a lot about time management in this course.
28.3% 30.8% 37.0%
I learned about a variety of different study skills in this course.
23.1% 28.3% 44.5%
I got to know my FYS professor well. 10.0% 19.3% 66.1%
I got to know my FYS classmates well. 9.0% 23.1% 64.8%
A variety of discussion and interactive techniques were used in my FYS class.
16.0% 22.9% 57.1%
I found the library session to be helpful. 19.7% 22.9% 55.6%
I found the session in the writing center to be helpful.
17.0% 26.5% 53.5%
I found the session in career services to be helpful.
13.9% 23.4% 59.4%

Indiana University Southeast 25
ConclusionIn sum, the data lead us to believe that the current FYS course design has helped retention
at our university. Additionally, academic integration, as defined by increased GPA, did occur for some students. Specifically, women in FYS courses obtained higher GPAs than men. This pattern of data has led us to examine why men’s GPA shows no improvement with a FYS class.
One limitation of the current study is a concern that the average age of the students not taking the FYS courses was significantly higher than the students enrolled in the FYS course. This may mean that nontraditional students are choosing not to take the FYS course because they believe that they do not need it. This behavior may actually put them at higher risk since the class provides information that can help them succeed in college. In addition, given the quasi-experimental nature of the study design, it is possible that self-selection played a role in both GPA improvement and retention measures assessed in the study.
All students’ knowledge of the university campus was improved, and the majority of students felt they got to know their professor and fellow students well. The current data also highlight spe-cific areas for improvement. That is, we are exploring ways to enhance the value of the information provided in our sessions on time management and study strategies and in our visits to the library, writing center, and career services.
ContributorDonna DahlgrenDirector of the First Year Experience ProgramAssociate Professor of PsychologyIndiana University Southeast4201 Grant Line RoadNew Albany, Indiana 47150Phone: (812) 941-2682E-mail: [email protected]

27
The InstitutionIndiana University Purdue-University Indianapolis (IUPUI) is a four-year, public
institution with an enrollment of approximately 30,000, of whom about 22,000 are undergraduates. IUPUI was formed in the capital city from a consolidation of Indiana University and Purdue University programs in 1969 and is the third largest university in Indiana. The institution offers more than 185 academic programs from associate degrees to doctoral and professional degrees. Approximately 2,400 first-time, first-year students enroll each year. Most first-time, first-year students commute to the campus (74%), and the majority of entering students are first generation (58%). The average age of first-time, first-year students is 19.68, 60% are female, 10% are African American, 90% are full-time students, and 33% are admitted conditionally (based on SAT scores, high school grades, and years between high school and college).
The SeminarFirst-year seminars, guided by a campus template that defines common learning out-
comes and pedagogies, have been offered at IUPUI since 1995. They are required by most undergraduate degree-granting units, which have developed their own one- to three-credit versions of an extended orientation format. U110 is the first-year seminar offered by Uni-versity College for exploratory students. Each section is taught by an instructional team composed of a faculty member, academic advisor, librarian, and student mentor. Many seminars are linked to another first-year course such as elementary composition, college algebra, or introductory courses in the humanities and social sciences. Approximately 100 sections with a maximum enrollment of 25 students are offered each fall semester. Common learning outcomes for all IUPUI seminars include:
Developing a comprehensive perspective on higher education, including a respect ëfor diversity among individuals, communities, and disciplinesEstablishing a network of staff, faculty, and other students ë
Indiana University-Purdue University Indianapolis

28 Indiana University-Purdue University Indianapolis
Understanding and practicing basic communication skills appropriate to the academic ësettingBeginning the process of understanding critical thinking ëUnderstanding and applying information technology in support of academic work ëDeveloping knowledge of one’s abilities, skills, and life demands in order to more effectively ëpursue academic goalsUnderstanding and making full use of IUPUI resources and services that support learning ëand campus connections
Since fall 2002, we have been developing themed learning communities (TLCs) that include a minimum of three first-year courses. All TLCs also include a first-year seminar course, which functions as an anchor to integrate learning around a common theme explored in the linked courses. Of the 2,144 beginning first-year students who were enrolled in first-year seminars, 18% percent were also part of a TLC. This paper provides an overview of the impact of first-year seminars in standard learning communities and in TLCs.
Research DesignWe used quantitative and qualitative approaches to comprehensively assess the impacts of first-
year seminar courses. Specifically, we conducted logistic regression analyses and analyses of covari-ance to investigate program-related effects on one-year retention rates and academic performance (first-semester grade point averages). We also compared seminar participants to nonparticipants while controlling for student background and academic preparation variables.
As we have improved our capacity to measure a wide array of student outcomes, it has become increasingly important that we develop ways to assess why there is a positive relationship between participating in a seminar and academic success. Thus, we have implemented qualitative evalu-ations and end-of-course questionnaires to assess students’ self-reported learning gains and to provide information that allows instructional teams to better understand when and how certain interventions are effective.
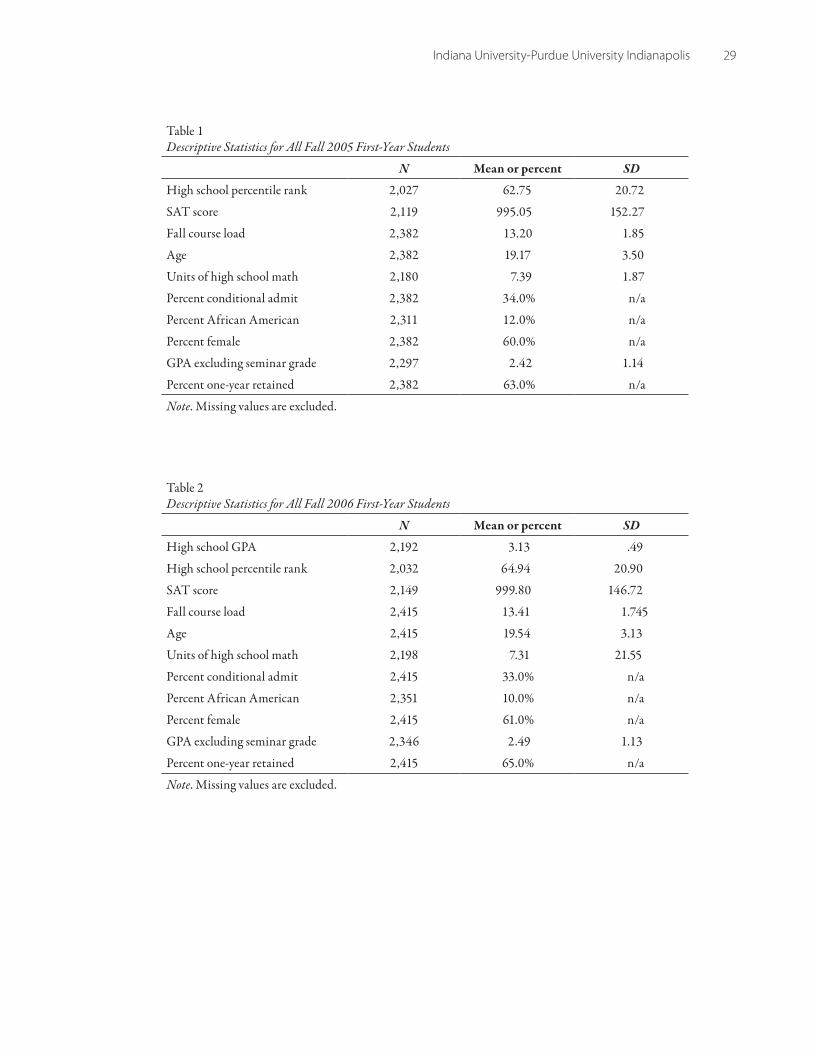
FindingsTables 1-6 display the means (or percentages for dichotomous variables) and standard devia-
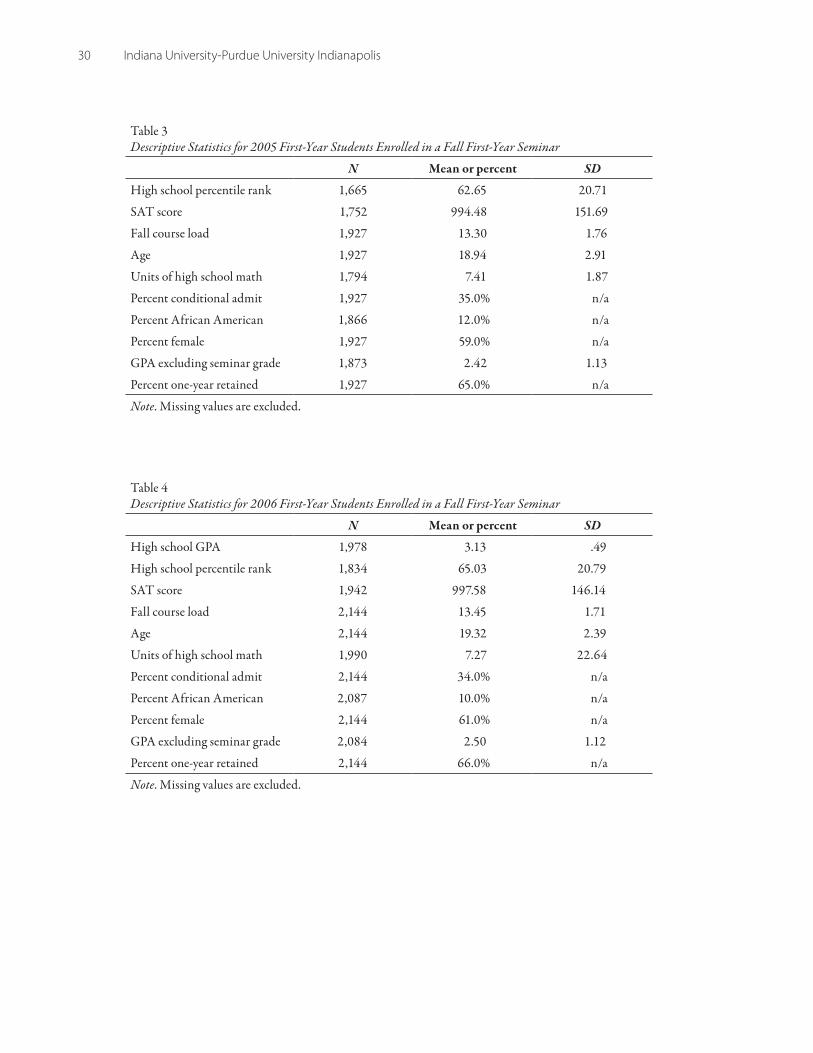
tions for each variable included in all analyses conducted to determine seminar effect on academic performance and one-year retention for the fall 2005 and 2006 cohorts. Tables 1 and 2 display the descriptive statistics for all 2005 and 2006 first-year students enrolling in at least seven fall credit hours. Students who are enrolled in at least seven credit hours are required to participate in a first-year seminar; thus, we omitted students enrolling in fewer than seven credit hours for all analyses. Tables 3 and 4 provide descriptive statistics for all enrolled in a 2005 or 2006 first-year seminar at census. Tables 5 and 6 provide descriptive statistics for first-year students enrolled in a 2005 or 2006 TLC at census.
Indiana University-Purdue University Indianapolis 29
Table 1Descriptive Statistics for All Fall 2005 First-Year Students
N Mean or percent SD
High school percentile rank 2,027 62.75 20.72
SAT score 2,119 995.05 152.27
Fall course load 2,382 13.20 1.85
Age 2,382 19.17 3.50
Units of high school math 2,180 7.39 1.87
Percent conditional admit 2,382 34.0% n/a
Percent African American 2,311 12.0% n/a
Percent female 2,382 60.0% n/a
GPA excluding seminar grade 2,297 2.42 1.14
Percent one-year retained 2,382 63.0% n/a
Note. Missing values are excluded.
Table 2Descriptive Statistics for All Fall 2006 First-Year Students
N Mean or percent SD
High school GPA 2,192 3.13 .49
High school percentile rank 2,032 64.94 20.90
SAT score 2,149 999.80 146.72
Fall course load 2,415 13.41 1.745
Age 2,415 19.54 3.13
Units of high school math 2,198 7.31 21.55
Percent conditional admit 2,415 33.0% n/a
Percent African American 2,351 10.0% n/a
Percent female 2,415 61.0% n/a
GPA excluding seminar grade 2,346 2.49 1.13
Percent one-year retained 2,415 65.0% n/a
Note. Missing values are excluded.
30 Indiana University-Purdue University Indianapolis
Table 3Descriptive Statistics for 2005 First-Year Students Enrolled in a Fall First-Year Seminar
N Mean or percent SD
High school percentile rank 1,665 62.65 20.71
SAT score 1,752 994.48 151.69
Fall course load 1,927 13.30 1.76
Age 1,927 18.94 2.91
Units of high school math 1,794 7.41 1.87
Percent conditional admit 1,927 35.0% n/a
Percent African American 1,866 12.0% n/a
Percent female 1,927 59.0% n/a
GPA excluding seminar grade 1,873 2.42 1.13
Percent one-year retained 1,927 65.0% n/a
Note. Missing values are excluded.
Table 4Descriptive Statistics for 2006 First-Year Students Enrolled in a Fall First-Year Seminar
N Mean or percent SD
High school GPA 1,978 3.13 .49
High school percentile rank 1,834 65.03 20.79
SAT score 1,942 997.58 146.14
Fall course load 2,144 13.45 1.71
Age 2,144 19.32 2.39
Units of high school math 1,990 7.27 22.64
Percent conditional admit 2,144 34.0% n/a
Percent African American 2,087 10.0% n/a
Percent female 2,144 61.0% n/a
GPA excluding seminar grade 2,084 2.50 1.12
Percent one-year retained 2,144 66.0% n/a
Note. Missing values are excluded.

Indiana University-Purdue University Indianapolis 31
Table 5Descriptive Statistics for 2005 First-Year Students Enrolled in a Themed Learning Community Seminar
N Mean or percent SD
High school percentile rank 354 62.31 19.30
SAT score 373 965.52 127.11
Fall course load 391 13.69 1.41
Age 391 18.63 2.54
Units of high school math 378 7.38 1.57
Percent conditional admit 391 35.0% n/a
Percent African American 383 12.0% n/a
Percent female 391 74.0% n/a
GPA excluding seminar grade 378 2.56 .99
Percent one-year retained 391 70.0% n/a
Note. Missing values are excluded.
Table 6Descriptive Statistics for 2006 First-Year Students Enrolled in a Themed Learning Community Seminar
N Mean or percent SD
High school GPA 358 3.18 .43
High school percentile rank 340 66.65 18.81
SAT score 363 990.41 123.99
Fall course load 377 13.75 1.37
Age 377 18.96 1.14
Units of high school math 365 7.69 1.28
Percent conditional admit 377 26.0% n/a
Percent African American 368 8.0% n/a
Percent female 377 74.0% n/a
GPA excluding seminar grade 368 2.63 1.01
Percent one-year retained 377 69.0% n/a
Note. Missing values are excluded.
Investigations of Seminar Effects on Academic Performance and RetentionWe conducted hierarchical logistic regression analyses to investigate the degree to which
seminar participation predicted one-year retention. High school percentile rank (or high school grade point average for 2006, due to percentile ranks missing values in 2006), SAT score, course

32 Indiana University-Purdue University Indianapolis
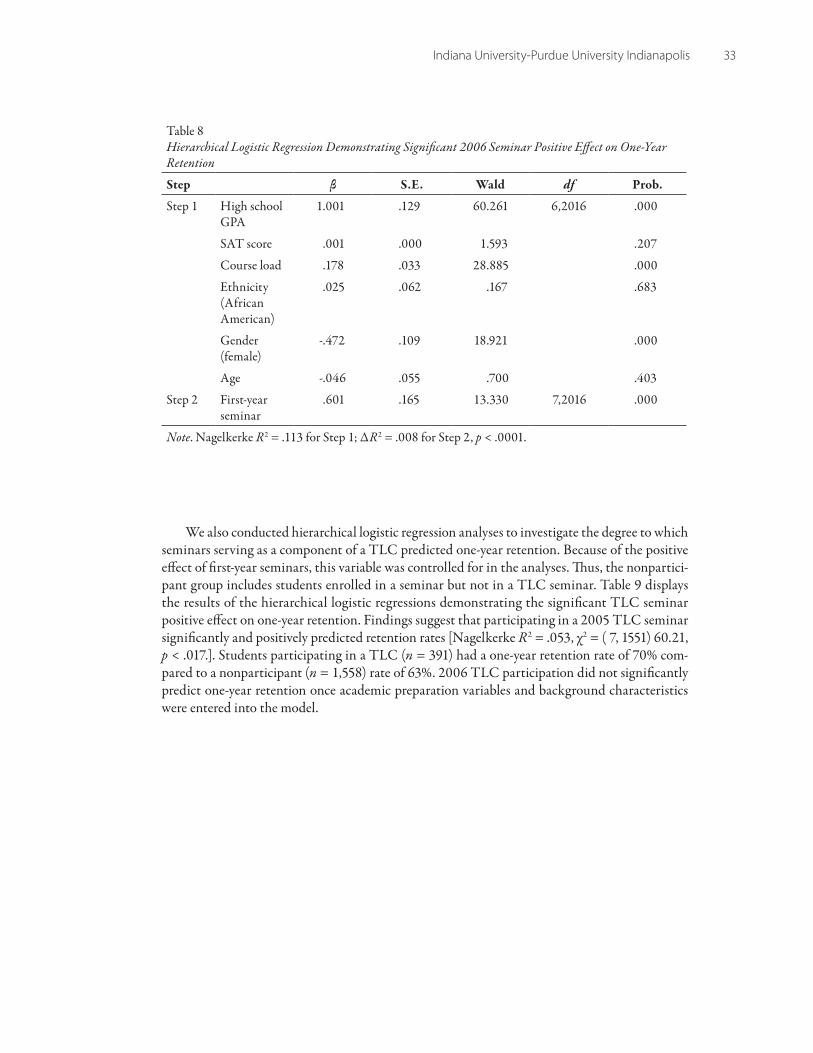
load, age, ethnicity, and gender were entered into the logistic regression in step 1. The seminar participation variable was entered into the logistic regression in step 2. Tables 7 and 8 display the results of the hierarchical logistic regressions and demonstrate a significant positive effect on one-year retention for first-year seminar participation. Findings suggest that participating in a 2005 seminar significantly and positively predicted retention rates (Nagelkerke R2 = .060, χ2 = (7, 1870) 82.91, p < .001).
Additionally, results indicate that participating in a 2006 seminar significantly and posi-tively predicted retention rates [Nagelkerke R2 = .121, χ2 = (7, 2016) 184.79, p < .0001]. Students participating in a 2005 seminar (n = 1,927) had a one-year retention rate of 65% compared to a nonparticipant (n = 455) rate of 56%. Students participating in a 2006 seminar (n = 2,144) had a one-year retention rate of 66% compared to a nonparticipant (n = 2,171) rate of 55%. Taken together, these findings suggest that seminars had a rather dramatic effect on one-year retention rates for fall 2005 and fall 2006.
Table 7Hierarchical Logistic Regression Demonstrating Significant 2005 Seminar Positive Effect on One-Year Retention
Step β S.E. Wald df Prob.
Step 1 High school percentile rank
.010 .003 15.042 6,1870 .000
SAT score .001 .000 8.392 .004
Course load .112 .032 12.686 .000
Ethnicity (African American)
-.260 .155 2.820 .093
Gender (female)
.073 .106 .480 .489
Age .035 .051 .469 .494
Step 2 First-year seminar
.433 .127 11.614 7,1870 .001
Note. Nagelkerke R2 = .051 for Step 1; ∆R2 = .009 for Step 2, p < .001.
Indiana University-Purdue University Indianapolis 33
Table 8Hierarchical Logistic Regression Demonstrating Significant 2006 Seminar Positive Effect on One-Year Retention
Step β S.E. Wald df Prob.
Step 1 High school GPA
1.001 .129 60.261 6,2016 .000
SAT score .001 .000 1.593 .207
Course load .178 .033 28.885 .000
Ethnicity (African American)
.025 .062 .167 .683
Gender (female)
-.472 .109 18.921 .000
Age -.046 .055 .700 .403
Step 2 First-year seminar
.601 .165 13.330 7,2016 .000
Note. Nagelkerke R2 = .113 for Step 1; ∆R2 = .008 for Step 2, p < .0001.
We also conducted hierarchical logistic regression analyses to investigate the degree to which seminars serving as a component of a TLC predicted one-year retention. Because of the positive effect of first-year seminars, this variable was controlled for in the analyses. Thus, the nonpartici-pant group includes students enrolled in a seminar but not in a TLC seminar. Table 9 displays the results of the hierarchical logistic regressions demonstrating the significant TLC seminar positive effect on one-year retention. Findings suggest that participating in a 2005 TLC seminar significantly and positively predicted retention rates [Nagelkerke R2 = .053, χ2 = ( 7, 1551) 60.21, p < .017.]. Students participating in a TLC (n = 391) had a one-year retention rate of 70% com-pared to a nonparticipant (n = 1,558) rate of 63%. 2006 TLC participation did not significantly predict one-year retention once academic preparation variables and background characteristics were entered into the model.

34 Indiana University-Purdue University Indianapolis
Table 9Hierarchical Logistic Regression Demonstrating Significant 2005 Themed Learning Community Positive Effect on One-Year Retention
Step β S.E. Wald df Prob.
Step 1 High school percentile rank
.009 .003 9.084 6, 1551 .003
SAT score .001 .000 9.422 .002
Course load .090 .035 6.560 .010
Ethnicity (African American)
-.231 .171 1.827 .176
Gender (female)
-.006 .119 .002 .961
Age -.011 .058 .036 .849
Step 2 TLC .327 .138 5.577 7, 1551 .018
Note. Nagelkerke R2 = .048 for Step 1; ∆R2 = .005 for Step 2, p < .018.
First-Year SeminarsWe conducted a series of analyses of covariance (ANCOVAs) tests to determine the effect
of seminars on first-semester grade point averages (GPA). Corrected models were employed due to the unequal sample sizes. The ANCOVAs allowed us to compare the grade point averages of participants to that of nonparticipants since differences among participants on other variables might have obscured the effect of seminars. ANCOVA results indicated that the mean GPA excluding seminar grade (adjusted M = 2.42, SD = 1.13, N = 1,873) for 2005 participants com-pared to nonparticipants (adjusted M = 2.39, SD = 1.19, N = 424) was not significantly different. Once the high school percentile rank or high school grade point average, SAT score, course load, ethnicity, age, and gender were controlled for, ANCOVA revealed a marginally significant dif-ference between the GPAs of conditionally admitted students participating in first-year seminars compared to nonparticipants [F = 2.75 (1, 605), p <. 09]. The descriptive statistics and adjusted means for 2005 conditionally admitted students are shown in Table 10.
Thus, there appears to be differential seminar effect on academic performance based on students’ levels of incoming academic preparation. Findings suggest that conditionally admitted students benefited more from participation in the program than regular admits. There was no significant difference in academic performance for regularly admitted participants compared to nonpartici-pants based on separate univariate analysis of covariance results. ANCOVA results suggested that conditionally admitted students who participated in 2006 seminars also had significantly higher fall semester GPAs compared to nonparticipating conditionally admitted students [F = 5.67 (1, 560), p < .018]. The descriptive statistics and adjusted means for 2006 conditionally admitted students are shown are shown in Table 11.

Indiana University-Purdue University Indianapolis 35
Table 10Means and Standard Deviations for 2005 Conditionally Admitted Students Participating in First-Year Seminars
n Mean fall GPA SDAdjusted mean
fall GPA
Seminar participants
522 2.01 1.04 2.01
Nonparticipants 91 1.78 1.20 1.81
Table 11Means and Standard Deviations for 2006 Conditionally Admitted Students Participating in First-Year Seminars
n Mean fall GPA SDAdjusted mean
fall GPA
Seminar participants
522 2.01 1.08 2.01
Nonparticipants 46 1.65 1.07 1.61
Themed Learning Communities (TLCs)Students participating in a 2005 TLC (N = 331) had a fall grade point average of 2.70 (SD
= .932) compared to nonparticipants (M = 2.44, N = 1186, SD = 1.10). Students participating in a 2006 TLC (N = 320) had a fall GPA of 2.78 (SD = .927) compared to nonparticipants (M = 2.54, N = 1414, SD = 1.10). Once the high school percentile rank or high school GPA, SAT score, course load, ethnicity, age, and gender were controlled for, separate ANCOVA results for fall 2005 and 2006 revealed a significant difference between the GPAs of students participating in TLCs compared to nonparticipants [F = 18.39 (1, 1509), p <. 0001 and F = 10.99 (1, 1726), p <. 001, respectively].
Students’ Perceptions: End-of-Course Results In an effort to enhance understanding of course-related seminar outcomes, we designed an
end-of-course questionnaire. The questionnaire contained 57 items designed to assess students’ perceptions of course benefits, learning gains, satisfaction, and course structure and content. Table 12 displays the Likert-type items rank-ordered by mean ratings of the degree to which the course benefited the students in various areas over a two-year period. The questionnaire also contained open-ended items that were content analyzed to determine what major themes emerged. Table 13 and 14 show the findings based on the students’ responses to the open-ended questions. Based on a content analysis, student comments were coded, summed by category, and five major themes emerged for 2005 and four for 2006.

36 Indiana University-Purdue University Indianapolis
The most valued aspects of seminars were opportunities to engage in meeting new people, learning more about IUPUI and the campus, major and career exploration, and learning and es-tablishing connections with academic advisors. The library tour emerged as a valued aspect of the seminar in 2005. Based on the Likert-type items and the open-ended comments, the most valu-able aspects of the seminar experiences were (a) opportunities for interaction with other students, (b) regular contacts with advisors and faculty members, (c) learning to meet the demands of col-lege (e.g., major requirements, policies and procedures, and expectations of higher education), (d) opportunities to explore major and career options, and (e) gaining an understanding of avail-able campus resources (e.g., Math Assistance Center, Writing Center).
Table 12 Most Valued Aspects of Course Rank-Ordered by Mean Ratings for Fall 2005 and 2006 Combined
n Mean SD
Positive interactions with other students
1,075 3.31 .89
Positive interactions with a student peer mentor
1,079 3.13 1.02
Met new people 1,078 3.12 .99
Positive interactions with a faculty member
1,072 3.11 1.01
Advisors provided information about registration procedures
1,068 3.10 .95
Advisor was knowledgeable about university policies
1,068 3.09 .95
Positive interactions with an academic advisor
1,074 3.09 1.07
Advisor was knowledgeable about major requirements
1,074 3.08 .99
Registration procedures 1,100 3.07 1.00
Advisor was available when I needed assistance
1,059 3.05 1.02
Advisor encouraged me to obtain my educational goals
1,071 3.04 .97
Campus resources available to help me (e.g., Writing Center, Math Assistance Center, Learning Center, Career Center)
1,065 3.02 1.04
Note. The response scale was 0 to 4, 0 = not at all valued and 4 = a great deal.

Indiana University-Purdue University Indianapolis 37
Table 13 Most Valued Aspects of Seminar Course Fall 2005 (N = 437)
Most valuable aspect N %Examples of actual student
responses
Meeting new people 78 18% “I met new people I now consider friends.”“The most valuable thing I received from this class was meeting new friends.”“Meeting new people”“Create relationships with fellow class mates”
Learning more about IUPUI and the campus
56 13% “Learning campus information”“Getting to know IUPUI better”“Learning about the resources that are available at IUPUI”“Getting to learn about things on campus”
Major and career exploration
36 8% “It exposed all of the majors and careers that relate to my values and interests.”“Learning about different careers”“Researching about the major I am interested in”“Exploring different careers.”
Academic advisor 28 7% “Helpful mentor, advisor, instructor”“The advisor and mentor”“I found most valuable having an advisor to talk to as a freshman; some scheduling can be confusing.”
Library tour 24 5% “Learning information [about] the library and resources that could help me in the future”“The thing I found most valuable is when we went to the library and learned about it.”“Learned library resources”
Note. Percentages rounded to the nearest whole. The remaining responses were so varied that no major categories emerged.

38 Indiana University-Purdue University Indianapolis
Table 14 Most Valued Aspects of Seminar Course Fall 2006 (N = 488)
Most valuable aspect N %Examples of actual student
responses
Meeting new people 101 21% “I found that getting to know the people in this class was valuable.”“Meeting new people from the beginning of class”“Meeting new people”“Meeting other students with similar interests as well as similar intellect”
Learning more about IUPUI and the campus
93 19% “Learning more about campus”“This class helped me get to know the IUPUI campus.”“It helped me find my way around campus”“Getting to learn about things on campus”
Major and career Exploration
48 10% “Helpful information about certain majors and their requirements”“Helping me choose a major”“Finding what I wanted to study as a career”“Searching for a career”
Library tour 20 4% “The library tour helped me.”“Finding out about the library and resources”“Helped me learn to use the library”
Note. Percentages rounded to the nearest whole. The remaining responses were so varied that no major categories emerged.
ConclusionPositive assessment results have demonstrated that first-year seminar and TLC students report
greater engagement with college, have higher GPAs, and are retained to the second year at higher rates than nonparticipating students. Thus, findings suggest positive impacts on academic success and retention. Taken together, results suggest that seminars seem to provide opportunities for student connections: Students establish friendships by participating. Seminars also allow students to engage in career and major exploration. In addition, TLC seminar students are able to integrate learning between courses and disciplines, and seminars seem to especially benefit conditionally admitted students, the most at-risk student group at IUPUI.
Indiana University-Purdue University Indianapolis 39
These results have fueled expansion of the TLC program from seven TLCs in fall 2003 to 26 in fall 2007. Currently, almost 90% of first-year students participant in a first-year seminar. These outcomes have also encouraged participation from faculty from representing many disciplines. New TLCs offered in fall 2007 include African American Perspectives, Crime in America, and Health and Wellness, as well as TLCs for prospective engineering and business majors. Thus, quantitative and qualitative results have served to prove as well as improve seminars. Survey results have been distributed to faculty team members to guide future planning. TLC faculty members have leveraged results to make improvements such as creating more common writing assignments to enhance theme integration across disciplines, implementing more cocurricular activities to improve students’ levels of interaction with faculty members and other students, and expanding the TLC program to reach more students.
It is important to note that students were not randomly assigned to seminars or themed learning communities and, thus, a self-selection bias may exist. Additionally, true causal inferences cannot be derived from data collected in the absence of an experimental design. We suggest that when possible, campus leaders employ rigorous experimental designs in an effort to determine casual effects of first-year seminars. Additional research is also needed to determine the exact effects of discrete components of seminars. In other words, future investigations should examine the intervening variables that impact seminar success (e.g., cocurricular activities, service learn-ing, integration of learning, writing across the curriculum, establishing connections with other students, civic engagement).
Contributors Michele Hansen (primary contact)Director of AssessmentIndiana University-Purdue University IndianapolisUniversity College620 Union Drive, UN G003Indianapolis, IN 46202Phone: (317) 278-2618E-mail: [email protected]
Gayle WilliamsAssistant Dean of University College
Lauren Chism Associate Director, Center on Integrating LearningCoordinator of Themed Learning Communities


41
The InstitutionFounded 50 years ago as a junior college for the Sylvania Franciscan Sisters, Lourdes
College, a four-year private institution in Sylvania, Ohio, now attracts more than 2,000 commuter students to its 38 degree programs. The undergraduate population (approximately 1,800) is largely female (83%), 78% White, 14% African American, 3% Hispanic, and 5% other. Fifty-five percent of the undergraduates are over the age of 25, and, according to Financial Aid Office estimates, 60% are first-generation college students. Until 2002, fewer than 50 first-year students began each year. Last year, however, the College enrolled 108 new first-year students and offered a first-year seminar for the first time.
The SeminarThe Lourdes College Literacy Learning Community, developed for students who
are underprepared for college-level reading and writing, features a redesigned study skills course as its central, linking seminar experience. The traditional course, focused on col-lege success skills, such as goal setting, time management, critical reading, note-taking, and oral and written communication, was restructured to promote personal awareness and self-confidence, team-building, more intentional college literacy development, and student success. The redesigned course is a one-semester, three-credit hour course serving approximately 20% of the College’s direct-from-high-school population.
Highlights of the restructured first-semester course are an outdoor team-building and leadership development experience and a group service-learning experience. The Challenging Outdoor Personal Experience (C.O.P.E.) program at a local Boy Scout camp provides opportunities for the students to solve problems through communica-tion, trust, and collaboration. The outdoor activities, including walking on logs, using 4 x 4 beams to create paths, and helping each other climb a wood wall, challenge students to listen to each others’ ideas, strategize, plan, and work together to achieve success. The service-learning experience at a local social service agency brings additional dimensions
Lourdes College

42 Lourdes College
of personal and team development, fostering civic responsibility and deepening personal awareness through reflection on the experience.
Students’ literacy development is enhanced by collaboration among learning community faculty and a tutor, who attends learning community classes and helps students during individual tutoring sessions. The tutor meets with faculty to help plan and review class activities. She usually attends class and meets individually or in small groups with students out of class to review assignments and make sure they are progressing in reading and writing skill development. The tutor and seminar instructor also take the lead in working with other learning community faculty to promote student success. That is, they check up on students who miss a class, help students resolve problems affect-ing their ability to be successful (e.g., test anxiety, ineffective study skills, poor computer skills), communicate with other faculty about students’ progress, and reinforce literacy learning.
Research DesignSince the restructured course and learning community environment were the College’s first
attempt at providing a first-year experience, determining the effectiveness of the program was especially important. Therefore, we carefully constructed evaluation methods to reflect program goals. First, we developed the following research questions based on the program goals:
How effective is the program in increasing self-confidence? 1. How effective is the program in promoting peer support? 2. How effective is the program in increasing students’ literacy skills? 3. How effective is the program in promoting student success?4.
Second, to address the four research questions, we used a mixed-methods research design, collecting data from the 18 student participants and four faculty members. To determine program efficacy in increasing self-confidence, we compared results of a questionnaire on confidence in areas related to college success given at the beginning of the first semester with results of the same questionnaire given at the end of the semester. To supplement findings from this comparison, we asked students to respond to open-ended questions about their development at the end of their first semester and during focus group interviews after two semesters. To find out if the program promoted peer support, we conducted focus group interviews with the students and with faculty. To measure literacy skills development, we compared scores on reading and writing placement tests taken before the students’ first semester in college with scores on the same tests taken at the end of their first semester. Finally, to examine program efficacy in promoting student success, we operationalized student success as first-semester GPA and persistence to second semester and compared GPAs and first-to-second semester retention rates of the students in the Literacy Learning Community program with those of other students admitted to the College in the same admissions category (low high school GPA and/or low ACT scores) who placed into and took the same first-semester study skills and English courses.
FindingsThe first-year seminar course, in conjunction with other linked first-year courses, had definite
positive effects on students’ development and confidence levels. In personal narratives, at least half of the students reported that the course helped them “set and achieve goals” and “be more confident.”

Lourdes College 43
43
During focus group interviews, several added that their self-confidence had increased specifically because they had “made it” through a year of college, and the seminar had helped them do so.
These findings are corroborated by results of the questionnaire administered at the beginning and end of the seminar course asking students to rate their confidence level using a five-point scale (1 = not confident at all; 5 = highly confident). Students’ confidence in their abilities stayed the same or increased in all areas examined, and according to results of paired samples t-tests shown in Table 1, their confidence increased significantly in areas important to persistence in college.
Table 1Change in Mean Scores on Selected Confidence Items
Beginning of semester
End of semester t df
Ability to succeed in college 3.24 4.41 -7.628** 16
Making friends 3.53 4.59 -6.628** 16
Getting help from faculty and staff 3.53 4.47 -2.791* 16
Communicating with others 3.53 4.47 -2.885* 16
* p < .05. **p < .01.
The seminar course and learning community environment also had positive effects on build-ing peer support, as suggested by the increase in confidence in making friends with other students noted above. In focus group interviews conducted during the first semester (n = 16) and after the first year (n = 10), participants agreed that the seminar course helped them develop friendships and that those friendships supported them during their first year in college. Individual participants discussed specific instances when a peer had helped them with a difficult situation or when having group support helped them figure out how to deal with a difficult instructor. Additionally, faculty reported that students’ attendance and work in their classes was better than expected, probably due to the fact that the students worked well together as a group, helped each other with homework assignments, and put pressure on each other to go to class and complete assignments.
The seminar course and learning community environment were also very effective in improving students’ literacy skills and promoting student success. Reading and writing test scores increased significantly, and first semester GPAs and the between semester retention rate also compared fa-vorably to those for students admitted to the College in the same admissions category and placed into the same study skills and English courses, as shown in Table 2.

44 Lourdes College
Table 2First Semester GPA and Between Semester Retention
GPA Retention
First-year seminar/learning community group (n = 18)
3.0384 88.89%
Comparable first-year group (n = 31)
2.6049 74.19%
Students’ overall GPAs decreased during their second semester as they enrolled in rigorous, college-level courses. However, according to results of focus group interviews, the students are approaching their second year in college with self-confidence, clear academic goals, a strong peer support network, and knowledge of how to navigate the college environment. Sixteen of the 18 seminar/learning community students returned for their second year, as Lourdes College began its second year offering a first-year seminar/learning community for a new group of 20 students.
Given the benefits of our pilot first-year seminar, we expect to see the program grow and de-velop. Ongoing assessment and evaluation, including interviews with members of both cohorts, may well reveal opportunities for improvement in the seminar course and learning community structure, but for now, we have planned the same type of supportive, collaborative learning envi-ronment for the new cohort, with the addition of a second-semester experience of linked courses, success workshops, and tutor support.
ContributorsDeborah Schwartz (primary contact)Associate Dean of Assessment and RetentionLourdes College6832 Convent Blvd.Sylvania, OH 43560Phone: (419) 824-3760E-mail: [email protected]
Kimberly GrieveAssistant Vice President for Student ServicesDirector, TRiO Student Support Services

45
The InstitutionMetropolitan State University is a comprehensive four-year, public university, with an
emphasis on underserved groups (including adults and communities of color). The university serves more than 8,900 students in the Twin Cities metropolitan area in Minnesota who are nontraditional in a variety of ways: 65% attend school part-time, 67% work full-time, 60% are female, 30% are first-generation college students, 73.1% are White, 12.9% are African American, 9.7% are Asian American, 2.6% are Hispanic, 1.7% are American Indian, and their average age is 32. First College is the academic unit responsible for teaching courses to entering first-year and re-entering transfer students.
The SeminarWe offer two courses for new first-year students and re-entering transfer students.
METR 101 Your Academic Journey is a required three-credit course for students with 0-16 credits that typically serves traditional-aged first-year students. PRSP 301 Perspectives: Educational Philosophy and Planning is a required four-credit course for students entering our Individualized BA program but open to any student with 30 or more credits; it typi-cally serves nontraditional aged (average age 38) transfer (average 75 credits) students.
Students in both courses must demonstrate the following competencies: (a) assume primary responsibility for and authority over their educations; (b) be self-directed learn-ers who can self-assess strengths/weaknesses, articulate learning needs, and use resources wisely; (c) have a love of learning and awareness of the need for lifelong learning; and (d) be reflective/self-transcending learners who appreciate varied perspectives and feel responsible to use their talents to contribute to the larger human community. Both courses use multiple disciplinary perspectives to help students identify their unique answers to the question “What do you think it means to be an educated person?” in relation to their perceived strengths, values, and life goals. In METR 101, we use the “educated person” question as a multidisciplinary lens through which to teach critical thinking, reading, writing, time management, and other strategies for college success. In PRSP 301, we use the question
Metropolitan State University

46 Metropolitan State University
to explore how knowledge is created, the contexts in which it is created, and who has the authority to define “what is worth knowing,” as well as to lay the foundation for an interdisciplinary plan for completing the Individualized BA.
Resident and community faculty have been teaching PRSP 301 for more than 25 years and METR 101 for more than 15 years to a maximum class size of 25. However, a pilot section of METR 101 was recently redesigned to incorporate the “educated person” question.
Research DesignWe used a combination of measures to assess student learning in relation to our core course
competencies as well as to evaluate retention and graduation rates. Our 2004 Program Review asked 728 enrolled and 157 graduated students to self-assess themselves as learners on a four-point Likert scale. Respondents included 321 enrolled and 60 graduated students. Some students had taken METR 101, but all had taken PRSP 301.
In spring 2005, our Institutional Research (IR) Office generated two data sets for a cohort that was tracked for four years and compared retention rates of students who passed METR 101 with students who did not take the course. The IR office also compared graduation and retention rates for 255 students in the Individualized BA program (who had completed PRSP 301) with 4,155 students in all other programs aggregated. In spring 2006, 118 students from eight sections of our courses answered a five-point Likert-scale survey and open-ended questionnaire.
FindingsOne primary learning outcome in our courses is for students to better understand the purpose
of their education by determining unique answers to the question, “What does it mean to be an educated person?” Our research suggests that helping students answer this question supports their achievement in relation to other core learning outcomes while increasing retention and gradua-tion rates.
Table 1 shows data from our 2004 Program Review where students self-assessed as better self-directed learners (average rank of 3.37 for enrolled and 3.5 for graduated students) and critical thinkers (average rank of 3.43 for enrolled and 3.4 for graduated students).
In spring 2005, the first data set generated by Institutional Research showed that students who successfully completed METR 101 were retained at an average of 11% more than students who did not take the course. The average retention rate of students who passed METR 101 was 64.6% while the average retention rate of students who did not take the course was only 53.6%. A second data set showed that students who completed PRSP 301 were 12% more likely to graduate and be retained than students who did not take the course. The average graduation and retention rate for students who have completed PRSP 301 was 71% while the average rate for students in all other programs was only 59%.
Table 2 shows data from our spring 2006 survey that corroborates earlier results; students view our curriculum as playing a significant role in helping them develop self-directed learning (with 80.5% agreeing or strongly agreeing) and critical thinking skills (with 78.3% agreeing or strongly agreeing).

Metropolitan State University 47
Table 1Self-Directed Learning and Critical Thinking Assessment, 2004 Program Review
Positive Average rank4 3 2 1
I feel my self-directed learning abilities are improving as a result of my experience in First College.
Enrolled 155 120 31 5 3.37
Graduated 32 25 3 -- 3.5
I feel my critical thinking abilities are improving as a result of my First College experience.
Enrolled 162 125 22 3 3.43
Graduated 30 27 2 1 3.4
Table 2Self-Directed Learning and Critical Thinking Assessment, 2006 Survey
Strongly agree
1 2 3 4
Strongly disagree
5
I feel my self-directed learning abilities are improving as a result of my experience in First College.
39.8% 40.7% 13.2% 35.3% 1.7%
I feel my critical thinking abilities are improving as a result of my First College experience.
36.0% 42.3% 11.7% 4.5% 4.5%
Based on these findings, we are standardizing the curriculum from our pilot section of METR 101 (where the question, “What does it mean to be an educated person?” was incorporated for the first time) for all METR 101 courses, making the learning outcomes more consistent with our philosophy of granting students primary responsibility for and authority over their educations. METR 101 instructors will facilitate student learning by helping them to self-assess learning needs and academic interests; develop a learning contract for the class; explore career interests; develop college-level writing, reading, and research skills; and enhance critical-thinking skills.

48 Metropolitan State University
ContributorsMary Kirk (primary contact)Associate Professor of Individualized, Interdisciplinary & Lifelong LearningMetropolitan State University700 East 7th StreetSt. Paul, MN 55119Phone: (651) 793-1781E-mail: [email protected]
Megumi YamasakiAssistant Professor of Individualized, Interdisciplinary & Lifelong Learning

49
The InstitutionMiami Dade College (MDC) is the nation’s largest institution of higher learning with
eight campuses located throughout Miami-Dade County, Florida. MDC is a public, open-access college that confers two- and four-year degrees and short-term professional certificates. With 50,447 FTEs in 2005-2006, MDC students reflect the diverse characteristics of Miami’s population: 66% Hispanic, 21% African American, 10% White non-Hispanic, and 3% of other origin. Fifty-one percent are first-generation students whose parents have had no college education, and 81% begin Miami Dade College needing remediation in reading, writing, mathematics, or English-as-a-second-language (ESL). MDC students commute daily, often from their jobs. Eighty-one percent work, 66% attend part-time, 61% are female, and 35% are over age 25.
The SeminarStudents enrolled in remedial coursework are required to take one of two first-year
Student Life Skills (SLS) seminars. MDC’s courses include the three-credit SLS1510 (Preparing for Student Success) for students who score into two or more remedial areas on the College Placement Test, and the one-credit SLS1505 (College Survival Skills) for students who score into one remedial area.
SLS was first offered in 1985 when increasing numbers of first-generation and remedial students were enrolling at MDC. It became evident that a first-year student seminar would offer these students the needed support in acquiring the information, skills, and attitudes that would lead to college success, and the SLS courses provided this. SLS courses align with the Florida Department of Education requirements for college student development, and course competencies reflect a holistic approach to first-year student success. The course addresses elements of cognitive, behavioral, emotional, personal, and social development. Primary course goals aim at supporting the student in transition, shaping success strate-gies and attitudes, forming lifelong learning skills, and developing personal awareness and emotional intelligence. SLS also provides career knowledge and professional skills
Miami Dade College
50 Miami Dade College
and information literacy and technology skills. In addition to teaching, faculty serve as mentors and advisors, providing a critical connection between the students and the College. Full-time SLS faculty meet regularly to review student trends and needs and identify and develop innovations in SLS courses. Innovations incorporate topics and tools that promote student success, including civic and personal responsibility through service-learning, global citizenship and interdependence, prescriptive online assessments, environmental awareness, and learning communities that link SLS with other disciplines.
Sixty-three percent of first-year students enroll in SLS courses, and class size averages ap-proximately 27 students. Courses are taught by full- and part-time SLS faculty, as well as student services personnel known as Intervention Specialists. All faculty hold advanced degrees in special-ized disciplines such as counseling or psychology.
Research DesignInstitutional Research conducted a study in the late 1990s before the courses were required
and found that SLS enhanced student success. Remedial students who enrolled in one of the SLS courses had higher pass and retention rates than their peers who did not take SLS. As a result, we made SLS enrollment mandatory if students tested into remedial courses. These results were sup-ported and augmented by a recent state-level longitudinal study (Windham, 2006). The Division of Community Colleges and Workforce Development in the Florida Department of Education studied five-year outcomes for a fall 1999 cohort of first-time-in-college students. Students were subdivided into groups based on the type and number of remedial courses needed and enrollment status in SLS courses. Students who took SLS had a higher academic success rate (i.e., graduated, still enrolled with satisfactory GPA, or transferred to state university) than students who did not take the SLS course. Fifty-eight percent of the SLS group were academically successful as compared to 41% of the non-SLS group.
In 2005, it became apparent that many Miami Dade College students were bypassing the SLS requirement due to an unintended consequence of the new student registration system. This provided us with a control group of students who did not take SLS, and thus an opportunity to revalidate the findings.
In this 2005 study, we wanted to determine if SLS improves success in remedial courses and subsequent re-enrollment. This was not a true experimental design since students self-selected the SLS option. Institutional Research compared student demographics for the two groups to identify any potential bias in results due to self-selection. For example, if a higher proportion of students with a native language of English elected to take SLS, they might be expected to do better in remedial courses simply because of a language advantage.
FindingsThe population for this study was all first-time-in-college (FTIC) students who tested into
remediation in one or more basic skill subject areas in fall 2005 or fall 2006. These students should have enrolled concurrently in a Student Life Skills (SLS) course.
The study groups analyzed were students who took and passed SLS and those who did not take SLS. Students who took and failed SLS (about 10% of the population) were omitted from the study. While their results were similar to students who did not take SLS, they had received a
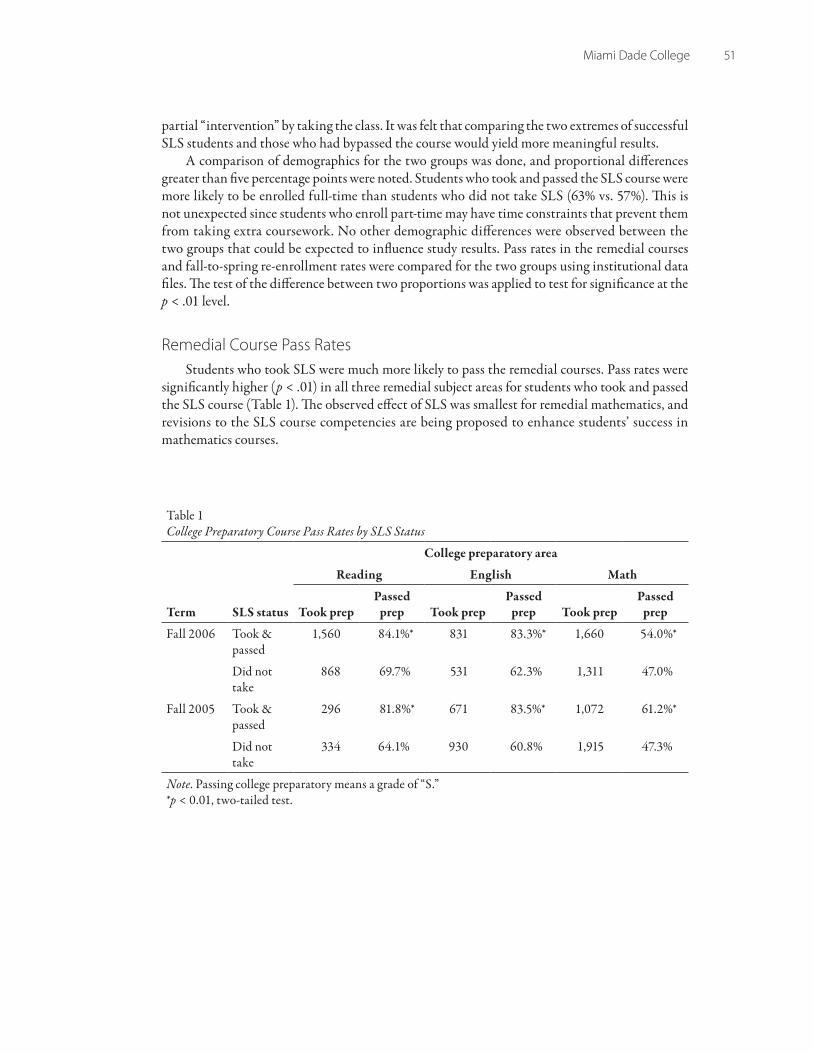
Miami Dade College 51
partial “intervention” by taking the class. It was felt that comparing the two extremes of successful SLS students and those who had bypassed the course would yield more meaningful results.
A comparison of demographics for the two groups was done, and proportional differences greater than five percentage points were noted. Students who took and passed the SLS course were more likely to be enrolled full-time than students who did not take SLS (63% vs. 57%). This is not unexpected since students who enroll part-time may have time constraints that prevent them from taking extra coursework. No other demographic differences were observed between the two groups that could be expected to influence study results. Pass rates in the remedial courses and fall-to-spring re-enrollment rates were compared for the two groups using institutional data files. The test of the difference between two proportions was applied to test for significance at the p < .01 level.
Remedial Course Pass RatesStudents who took SLS were much more likely to pass the remedial courses. Pass rates were
significantly higher (p < .01) in all three remedial subject areas for students who took and passed the SLS course (Table 1). The observed effect of SLS was smallest for remedial mathematics, and revisions to the SLS course competencies are being proposed to enhance students’ success in mathematics courses.
Table 1College Preparatory Course Pass Rates by SLS Status
College preparatory area
Reading English Math
Term SLS status Took prepPassed
prep Took prepPassed
prep Took prepPassed
prep
Fall 2006 Took & passed
1,560 84.1%* 831 83.3%* 1,660 54.0%*
Did not take
868 69.7% 531 62.3% 1,311 47.0%
Fall 2005 Took & passed
296 81.8%* 671 83.5%* 1,072 61.2%*
Did not take
334 64.1% 930 60.8% 1,915 47.3%
Note. Passing college preparatory means a grade of “S.”*p < 0.01, two-tailed test.
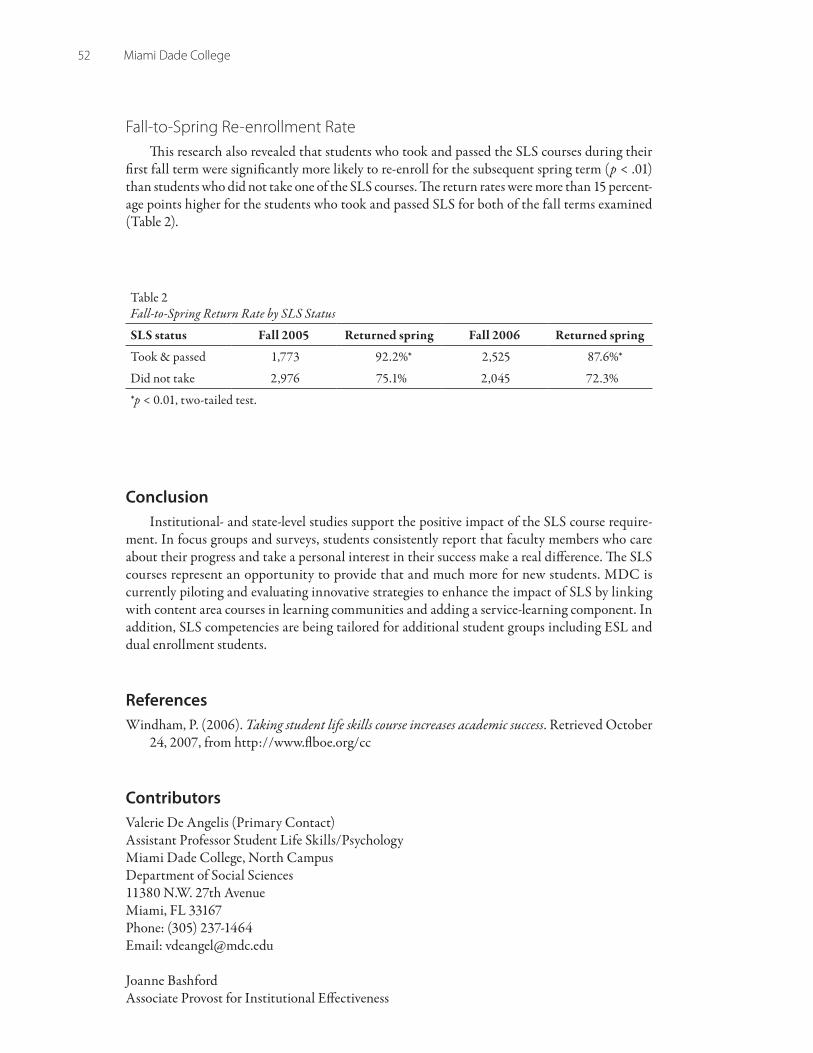
52 Miami Dade College
Fall-to-Spring Re-enrollment RateThis research also revealed that students who took and passed the SLS courses during their
first fall term were significantly more likely to re-enroll for the subsequent spring term (p < .01) than students who did not take one of the SLS courses. The return rates were more than 15 percent-age points higher for the students who took and passed SLS for both of the fall terms examined (Table 2).
Table 2Fall-to-Spring Return Rate by SLS Status
SLS status Fall 2005 Returned spring Fall 2006 Returned spring
Took & passed 1,773 92.2%* 2,525 87.6%*
Did not take 2,976 75.1% 2,045 72.3%
*p < 0.01, two-tailed test.
ConclusionInstitutional- and state-level studies support the positive impact of the SLS course require-
ment. In focus groups and surveys, students consistently report that faculty members who care about their progress and take a personal interest in their success make a real difference. The SLS courses represent an opportunity to provide that and much more for new students. MDC is currently piloting and evaluating innovative strategies to enhance the impact of SLS by linking with content area courses in learning communities and adding a service-learning component. In addition, SLS competencies are being tailored for additional student groups including ESL and dual enrollment students.
ReferencesWindham, P. (2006). Taking student life skills course increases academic success. Retrieved October
24, 2007, from http://www.flboe.org/cc
ContributorsValerie De Angelis (Primary Contact)Assistant Professor Student Life Skills/PsychologyMiami Dade College, North CampusDepartment of Social Sciences11380 N.W. 27th AvenueMiami, FL 33167Phone: (305) 237-1464Email: [email protected]
Joanne BashfordAssociate Provost for Institutional Effectiveness
53
The InstitutionNorthern Illinois University (NIU) is a public, four-year institution located in DeKalb,
Illinois. It has an undergraduate enrollment of approximately 18,800 and a total enrollment of approximately 25,300 students. Slightly more than half (52%) of undergraduates are female students, and it is primarily a residential campus. The undergraduate enrollment is comprised of 25.9% minority students and most (77.4%) are traditional-aged (18-22 years of age) students. Approximately one half of the students in each entering class are first-generation students. In this instance, first-generation students are defined as those students whose parents have not attended college. Further, about 98.8% of new first-year students at NIU are in-state students.
The SeminarUNIV 101: University Experience is an elective course taught during the first 12
weeks of the fall semester. This course is a basic skills seminar focusing on the development of study skills and time management and improvement of students’ academic and social adjustment to college. The course was expanded to be available to all first-year students after being originally designed for students in health sciences. UNIV 101 carries one hour of academic credit and enrolls a maximum of 20 students in each section. There is extensive coordination to ensure generally uniform content across sections. Approximately 45% of new first-year students are enrolled in UNIV 101, and student demand is consistently higher than the number of sections available.
The UNIV 101 course has three primary goals: (a) facilitate students’ learning about the university and about their interests, abilities, and expectations in relation to their chosen field of study; (b) promote the establishment of relationships between peers and between students and the instructor; and (c) provide enriching out-of-class activities and assignments. To meet these goals, course content is designed to facilitate student under-standing of the challenges and expectations of college, develop strategies for academic success, develop relationships, adjust to the university community and become involved,
Northern Illinois University

54 Northern Illinois University
communicate with faculty, manage time and money, learn to use NIU’s resources and technology, live in a diverse community, and prepare for a career.
Extensive training is provided for UNIV 101 instructors. A two-day workshop is conducted in May, and department meetings in August are provided for instructors prior to teaching the UNIV 101 course. Faculty and support staff with a master’s degree and prior teaching experience are eligible to teach the course. Instructors are given an overview of the course and the role of the instructor, a description of the first-year class, guidelines for developing a syllabus, required and suggested course content, grading and feedback procedures, advice from experienced instructors, and a review of the textbook and instructor manual. During the fall semester, UNIV 101 instruc-tors are provided weekly electronic newsletters containing announcements, course reminders, and information about campus resources that are important for students in the course.
Research DesignLongitudinal research is conducted annually to assess the grade performance and persistence of
students who enrolled in UNIV 101 and first-year students who did not take the course. Analyses were conducted to track student persistence for each semester for their first two years at NIU.
Further, student GPA at the end of each semester was examined. Statistical procedures (analysis of covariance) were used to control for any differences between groups of students on high school class percentile rank and ACT Composite score to compare the performance of students who took the course and those who did not. In addition, chi-square analyses were conducted to compare the retention outcomes of students who took the course and first-year students who did not take the course. Retention status was examined at the beginning of each of the first four semesters of college. For this assessment, the persistence and GPA outcomes of 4,045 students who took the course between fall 2000 and fall 2004 were examined.
Findings
Retention*Assessment findings indicated that 81.2% of the students who took UNIV 101 subsequently
returned to NIU for the fall semester of their second year, while 77.0% of students who did not take the course returned for their second year. Consequently, the persistence rate for students who took the UNIV 100 course was significantly higher than for nonparticipants (χ2 = 28.29, df = 1, p < .001). Similarly, there was a significant difference noted for retention for four semesters; 75.2% of students who took the course completed four semesters, while 71.2% of students who did not take the course completed four semesters (χ2 = 22.08, df = 1, p < .001).
The effects of the UNIV 101 course on retention outcomes were particularly notable for students in specific academic disciplines. For instance, 76.5% of students majoring in business who took the course completed four semesters at NIU, while 70.3% of business students who did not take the course completed four semesters (χ2 = 12.96, df = 1, p < .001). Similarly, a significant difference was found for students in liberal arts and sciences; 74.9% of the students who took the course subsequently completed four semesters at NIU as compared to 68.3% of students who did not take the course (χ2 = 21.28, df = 1, p < .001).

Northern Illinois University 55
Grade Performance*Students who took the UNIV 101 course earned significantly higher mean first semester GPAs
(2.60) than students who did not take the course (2.48) [F(1, 11,550) = 67.86, p < .001], even after controlling for differences between the two groups on high school class percentile rank and ACT Composite score. In addition, assessment results indicated similar findings for grade performance after two semesters. After accounting for any high school class percentile rank and ACT score dif-ferences, it was found that students who took the UNIV 101 course had a higher mean first-year GPA (2.65) than students who did not take the course (2.60) [F(1, 10,612) = 21.86, p < .001].
Similar GPA findings were noted for students in several academic disciplines. For instance, students majoring in business who took the UNIV 101 course earned a significantly higher mean first-semester GPA (2.64) than students who did not take the course (2.49) [F(1, 2,676) = 24.30, p < .001]. Further, students enrolled in liberal arts and sciences who took UNIV 101 showed a significantly higher mean first-semester GPA (2.52) than students who did not take the course (2.39) [F(1, 4,800) = 23.86, p < .001].
The assessment findings for the UNIV 101 course indicate that students who took the course subsequently showed significantly higher grade performance and persistence rates. Further, the higher grades and persistence rates were evident over the first four semesters of college. In addition, these results were evident for students in several different academic major fields of study. These results provide evidence for the effectiveness of the course to positively influence student outcomes during the first two years of college.
*This summarizes findings from the following research report:House, J. D., Xiao, B., & Rode, D. (2007). Demographics and academic outcomes of UNIV 101 new
freshmen and other new freshmen ( fall 2003-fall 2004 combined freshmen cohort followed through spring 2007). DeKalb, IL: Northern Illinois University, Office of Institutional Research.
ContributorsJ. Daniel House (primary contact)Director of Institutional ResearchNorthern Illinois UniversityLowden Hall 103DeKalb, IL 60115Phone: (815) 753-6002E-mail: [email protected]
Denise RodeDirector of Orientation
Beiling XiaoResearch Associate

57
The InstitutionNorthern Kentucky University (NKU) in Highland Heights, Kentucky, is a four-
year, public, metropolitan institution serving approximately 15,000 students in Northern Kentucky/greater Cincinnati. Nearly 13,000 students are undergraduates. Though a com-muter campus, NKU’s residential population continues to grow; 64% of the residents are first-year students. The fall 2006 enrollment summary indicates the student population is 58% female, 87% White, 5% African American, 1.3% international, 1.1% Hispanic, 0.9% Asian, 0.2% American Indian, and 4.5% unknown. Approximately 50% of NKU undergraduates are first-generation college students, meaning neither their parents nor grandparents earned a baccalaureate degree, though they may have completed some work toward a degree.
The SeminarUNV 101 (Orientation to College and Beyond) is a graded, three-credit academic
elective, course designed for incoming first-year students. Since 1986, the program has grown from 10 to more than 54 sections, serving 60% of the incoming first-year students. The course is taught by faculty, administrators, and full-time professional staff at NKU. Instructors attend a mandatory New Instructors Workshop in addition to monthly faculty development workshops offered in the summer and fall.
The UNV 101 curriculum at NKU evolved from the University of South Carolina model developed by John Gardner and associates. As an extended orientation for new students, the course objectives and curriculum focus on helping students adjust to col-lege life and prepare to succeed. Small class size (no more than 24 enrolled per section) enables students to acclimate to campus resources, policies, and procedures and to identify as active learners, owning their education. Topics such as time/self management, campus resources, information literacy, college success skills, relationship building, and diversity are addressed in class. The curriculum is recalibrated as needed to meet the changing needs of NKU students and the NKU community.
Northern Kentucky University
58 Northern Kentucky University
One recent curricular innovation has been to focus more directly on career development. Some NKU first-year students have declared a major when they enter the university, while many others are unclear about major and career objectives. We have established special sections of UNV 101 for these different types of students. While all sections of UNV 101 address major and career exploration/decision making, sections designed for Declared students provide information specifi-cally related to the student’s major and related careers; whereas, the sections designed for Exploring students are carefully structured to facilitate self-discovery and the major exploration process.
Research DesignThe research described in this paper focused on two special types of UNV 101 classes during fall
2005. We assessed the impact of the Exploring and Declared sections on career development. Career development includes two basic processes: (a) exploring career options and (b) mak-
ing a career choice. To study these processes, we used the Career Exploration and Decidedness Inventory-Revised (CEDI-R; Thomas, McDaniel, Wagner, & Schuchmann, 2005). Another aspect of career development, individuals’ confidence that they can perform tasks necessary to make a career decision, was measured using the Career Decision-Making Self-Efficacy Scale (CDMSES; Betz, Klein, & Taylor, 1996).
Fifty-five students in Exploring sections (undecided on a major) and 75 students in Declared sections (majors in business or education) completed the CEDI-R and the CDMSES in their UNV 101 classes at the beginning and end of the term. Thus, pre and postcourse measures were available on three variables: (a) career exploration, (b) career decidedness, and (c) career decision-making self-efficacy.
FindingsAnalysis of variance was used to evaluate the effects of the between-groups factor (Declared
versus Exploring) and the repeated measure (Precourse vs. Postcourse). Results can be seen in Figures 1, 2, and 3. On the precourse measures, as expected, Declared students scored significantly higher than Exploring students (p < .01) on career exploration, career decidedness, and career decision-making self-efficacy.
Concerning precourse versus postcourse comparisons within sections, each measure showed a different pattern of results. Students’ career decision-making self-efficacy scores increased from the precourse to postcourse assessment in both groups (p < .01), and the postcourse scores of Declared students remained significantly higher than those of the exploring students (p < .01) (see Figure 1).
On career decidedness (Figure 2), Exploring students’ mean score increased (p < .01), while Declared students’ mean score did not change. However, the increase shown by Exploring students did not bring them to the level of the Declared students; postcourse means for Declared students remained higher than those of Exploring students (p < .01).
Finally, career exploration scores increased considerably for Exploring students (p < .01) but did not change in Declared students (p > .10). Thus, postcourse scores for the two groups were similar (Figure 3).
Our findings suggest that Exploring sections of UNV 101 were especially beneficial; students made progress in all three aspects of career development. Several facets of the special UNV 101 sections may have contributed to these effects. First, throughout the course, readings, activities,
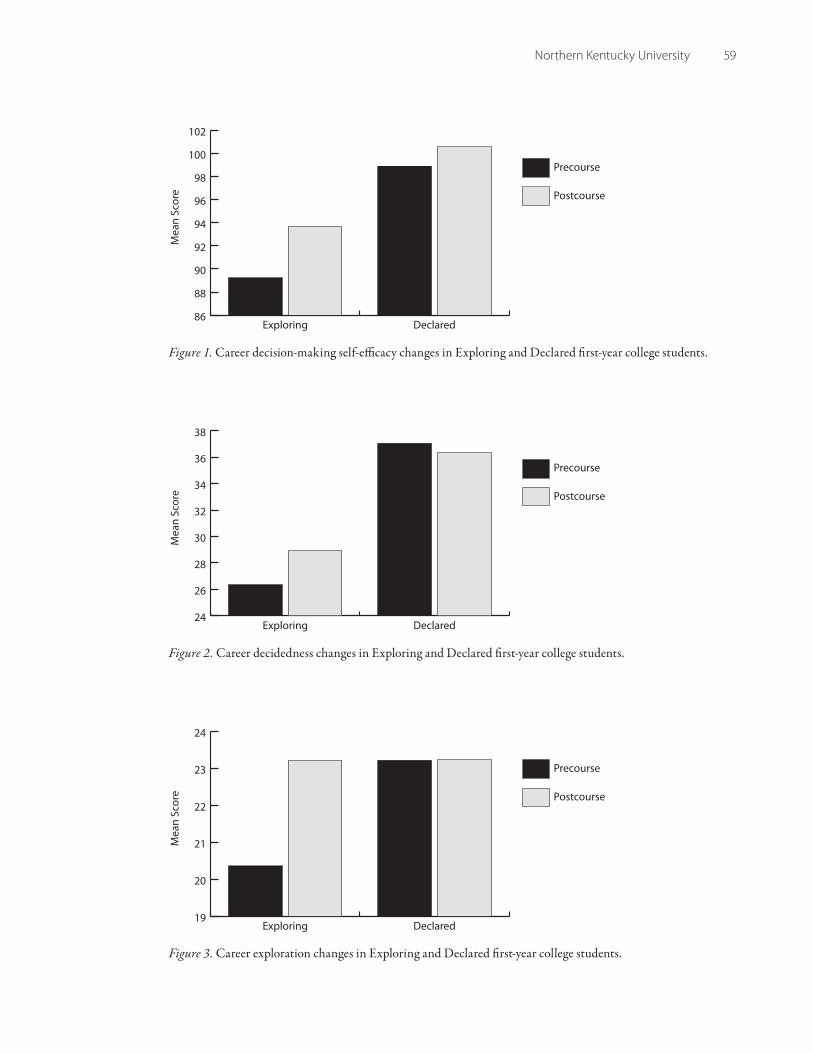
Northern Kentucky University 59
Figure 1. Career decision-making self-efficacy changes in Exploring and Declared first-year college students.
Figure 2. Career decidedness changes in Exploring and Declared first-year college students.
Figure 3. Career exploration changes in Exploring and Declared first-year college students.
86
88
90
92
94
96
98
100
102
Postcourse
Precourse
DeclaredExploring
Mea
n Sc
ore
24
26
28
30
32
34
36
38
DeclaredExploring
Mea
n Sc
ore Postcourse
Precourse
19
20
21
22
23
24
DeclaredExploring
Postcourse
Precourse
Mea
n Sc
ore

60 Northern Kentucky University
discussions, and presentations were orchestrated to help students identify their skills, values, inter-ests, and aptitudes and to consider how they fit with various major and career options. In addition, students in Exploring sections received academic advising during their first semester from their UNV 101 instructors. Because the instructors knew the students well, these advising sessions may have increased the students’ motivation to conscientiously explore a major/career.
While it is not surprising that, even at the end of the semester, the Exploring students were not as decided as the Declared students, it is clear that they made important strides in the area of career development. Their level of career exploration increased dramatically, and they completed the semester with considerably more confidence in their ability to negotiate the career decision-making process.
Most students in Declared sections began the semester having already explored various career options and decided on a major and potential career. The increases they showed in career decision-making self-efficacy were likely the result of the UNV 101 course’s emphasis on providing more specific information to these students about how to complete their chosen major and establish a career in that field.
In summary, the results of this study provide support for our decision to create these two types of special UNV 101 sections and suggest that students in both types of sections benefited from their first-year experience. We continue to develop sections that meet the career development needs of incoming first-year students, including stand-alone and learning community sections that focus on specific majors and areas of interest.
ReferencesBetz, N. E., Klein, K. L., & Taylor, K. M. (1996). Evaluation of a short form of the Career Decision-
Making Self-Efficacy Scale. Journal of Career Assessment, 4, 47-57.Thomas, J., McDaniel, C., Wagner, B., & Schuchmann, L. (2005, May). Measuring vocational identity
status using the Career Exploration and Decidedness Inventory-Revised. Poster presented at the 17th annual convention of the American Psychological Society, Los Angeles.
ContributorsPeg Adams (primary contact)Assistant Director/Interim DirectorNorthern Kentucky UniversityOffice of First-Year ProgramsNunn Drive, Founders Hall 231Highland Heights, KY 41099Phone: (859) 572-1493E-mail: [email protected]
James H. Thomas, ProfessorDepartment of Psychology
Cyndi R. McDaniel, ProfessorDepartment of Psychology

61
The Institution Portland State University (PSU) is Oregon’s largest and most diverse university.
Located in the South Park Blocks, it is an easy walk to the downtown area and Portland’s business and government district. It is a four-year institution with extensive graduate programs. Its motto is “Let knowledge serve the city,” and the university is committed to civic engagement at every level. Portland State University’s award winning undergraduate programs are a model for interdisciplinary education. The student body consists of 85% commuter and 15% residential students. PSU is 53.9% female. Ethnic origins of students are White, non-Hispanic, 65.7%; Asian/Pacific Islander, 9.1%; Black/non-Hispanic, 2.9%; Hispanic, 4.1%; Native American, 1.1%; and multiple ethnicities, 1%. Twenty-one percent of students are the first generation in their families to attend college (i.e., neither parent has graduated from college).
The Seminar In 1994, PSU adopted a general education program, University Studies, which pro-
vides students with a coherent and cohesive program of integrated learning experiences. The ultimate goal of University Studies is to facilitate the acquisition of the knowledge, abilities, and attitudes that will form a foundation for lifelong learning among its gradu-ates. This foundation includes the capacity to engage in inquiry and critical thinking; to use various forms of communication for learning and expression; to gain an awareness of the broader human experience and its environment; and appreciate the responsibilities of persons to themselves, to each other, and to community.
Freshman Inquiry (FRINQ) forms the foundation for the University Studies program at PSU. This required year-long sequence of courses introduces students to PSU’s general education goals and to the opportunities available in university life. FRINQ courses are interactive and theme-based, with each theme exploring topics and issues using an inter-disciplinary approach to show how they can be understood from different perspectives. The maximum enrollment size is 36 students. The students also meet in smaller mentor
Portland State University

62 Portland State University
sessions twice a week to review the class material and develop computer skills including Word, Excel, PowerPoint, and web site development.
Senior Capstone is the culmination of the University Studies program. Capstone courses are designed by PSU’s faculty to build cooperative learning communities by taking students out of the classroom and into the field. In Capstone courses, students bring together the knowledge, skills, and interests developed to this point through all aspects of their education to work on a community project. Students from a variety of majors and backgrounds work as a team, pooling resources, and collaborating with faculty and community leaders to understand and find solutions for issues that are important to them as literate and engaged citizens.
This paper highlights a collaborative interaction between a FRINQ, On Democracy: The History of an Idea and a Senior Capstone Course, Democracy, Ethics, and Civic Discourse in the Gene Age. A pilot study was designed to examine learning outcomes of first-year college students’ interaction with senior Capstone students through a civic engagement project. The FRINQ and Capstone students collaboratively chose the course materials, guided discussions, and interacted with the community partner. The project culminated in a public forum about gene research and the issues that it poses for privacy and democracy. In keeping with the collaborative nature of the project, the authors of this chapter include both the professor and a first-year student enrolled in the course.
Research DesignWhile much research has been done on the value of service-learning, we are just beginning to
understand how service-learning projects contribute to students’ understanding of the concept of civic engagement in the long term, and, more importantly, how and when to engage undergraduates in the service-learning experience. The research project reported here addresses these two issues by “sequencing” the service-learning experience at both the first-year and senior levels of undergraduate education. This study used a quasi-experimental design and employed a mixed-methods approach. This paper reports on the outcomes derived from student responses to a prompted writing exercise and a civic engagement survey.
We collected data from two FRINQ sections and one Senior Capstone course. One FRINQ section (the experimental group) engaged in a quarter-long civic engagement project with the Capstone course on issues surrounding public dialogue about science. Their culminating joint project was a public forum with government, industry, and citizen participation about upcoming Oregon legislation regarding genetic privacy. The other FRINQ section served as a control group and covered the same written material, but did not engage in the service experience with the Capstone course. Both FRINQ sections were taught by the same professor, and both completed pre and posttests that included a civic engagement survey, Explicating Factors that Foster Civic Engagement Among Students (Nishishiba, Nelson, & Shinne, 2003) and a prompted writing exercise. The prompted writing exercise was scored employing the Structure of the Observed Learning Outcomes (SOLO) rubric (Biggs & Collins, 1982). The SOLO taxonomy rubric is a well-known assessment tool and helps identify student levels of learning. Specifically, it is a rubric that examines relationality and complexity of student responses.

Portland State University 63
FindingsThe prompted writing exercise provided the most significant findings. These results were con-
sistent with our hypothesis that students in the experiental group would demonstrate a stronger understanding of democracy and the role of dialogue in a democracy than students in the control group. Table 1 reports on two prompted and open-ended questions. This first question asked the students to respond to, “What is your understanding of democracy?” The second question asked, “What is the role of dialogue in a democracy?” Pretests were given to establish baseline levels of understanding of democracy and dialogue for each class.
Table 1Analysis of Student Responses to Prompted Writing Questions
Group N Mean SD
Control group – Democracy question
18 2.33* .594
Experimental group – Democracy question
19 2.79* .787
Control group – Dialogue question
18 2.00* .485
Experimental group – Dialogue question
19 2.53* .513
*p < .05.
A review of the data reveals that the experimental group scored significantly higher on the prompted writing exercise than the control group. This finding is consistent with our hypothesis that students who engaged in the service-learning project would have developed a deeper un-derstanding of the course material. This also supports the extensive scholarship on the value of service-learning (Kesckes, Spring, & Leiberman, 2004).
Our brief qualitative analysis of the prompted responses supports the quantitative findings in that the students’ responses in the experimental section reflected a deeper understanding of the course contents. The qualitative analysis employed codes largely drawn from the material that were used to search for references to the various goals of the University Studies program (i.e., com-munication, inquiry, and critical thinking; the diversity of the human experience; ethics and social responsibility). The content analysis pointed to civic responsibility as the concept most central to the civic engagement exercise. More specifically, the themes in the responses concerned issues of democracy, dialogue, plurality, and political action.
The students also completed a survey as a self-report measure of civic engagement compe-tence via a modified survey instrument developed at Portland State University (Nishishiba et al., 2003). Results of the survey demonstrated no significant differences between the control and the experimental group. Additionally, some students in both groups reported a decrease in community engagement awareness. Testing with a larger sample size is required to explain this inconsistency

64 Portland State University
in the findings. Several factors including sample size, the inability to randomly assign the groups, and the lack of follow-up interviewing after the survey was administered hindered the ability to accurately understand the significance of these differences. For example, one class was taught at 8:00 a.m. and another at 2:00 p.m., raising the possibility of any preexisting differences in students who select an 8:00 a.m. course over a 2:00 p.m. course. Also, the traditional challenges with self-reporting surveys (Schroder, Carey, & Vanable, 2003) may serve to explain the inconsistencies. Significantly, power was an issue as the control and experimental group consisted of 18 and 19 subjects respectively.
Future studies will improve inter-coder reliability and examine other rubrics as potential scoring instruments. This pilot study provides support to the notions of scholarship and learning that Boyer outlines in his landmark work, Scholarship Reconsidered (Boyer, 1990). Specifically, it supports the notion that methods based on the scholarship of discovery, the same methods that a service-learning or civic engagement experience provides, can yield significant student learning and knowledge retention. It is important that the service-learning goals are closely aligned with the course goals in order to provide a clear pedagogical connection for the students. This pilot study affirms the value of the service-learning experience throughout the undergraduate curriculum.
ReferencesBiggs, J. B., & Collins, K. F. (1982). Evaluating the quality of learning: The SOLO taxonomy (struc-
ture of the observed learning outcome). New York: Academic Press.Boyer, E. (1990). Scholarship reconsidered: Priorities of the professoriate. Princeton, NJ: The Carnegie
Foundation for the Advancement of Teaching.Kesckes, K., Spring, A., & Leiberman, D. (2004). Developing service-learning expertise and other
community campus partnerships. To Improve the Academy, 22, 287-301. Nishishiba, M., Nelson, T., & Shinne, C. (2005). Explicating factors that foster civic engagement
among students. Journal of Public Affairs Education, 11(4), 269-285. Schroder, K., Carey, M., & Vanable, P. (2003). Methodological challenges in research on sexual risk
behavior: II. Accuracy of self-reports. The Annals of Behavioral Medicine, 26(2), 104-123.
Contributors Christopher Carey (primary contact)Assistant ProfessorUniversity Studies ProgramPortland State UniversityPO Box 751Portland, OR 97207Phone: (503) 725-9402 E-mail: [email protected]
Kerensa LoucksUniversity Studies Program
65
The InstitutionSam Houston State University (SHSU), the third oldest public university in Texas,
is located in Huntsville, Texas. With approximately 16,000 students, SHSU’s enrollment has increased for seven consecutive years. SHSU is organized into five colleges offering 79 undergraduate, 52 master’s, and five doctoral degree programs. SHSU is a selective, primarily residential campus with a beginning first-year population of approximately 2,200 students (Table 1). One-year retention rates have risen to 73% for full-time stu-dents. Mean ACT/SAT scores for entering first-year students exceed both the state and national average.
Table 1Demographic Data for First-Year Students Enrolled, Fall 2005 (N = 2,217)
n %
Gender
Male 909 59.0
Female 1,308 41.0
Ethnicity
Caucasian 1,537 69.3
Hispanic 255 11.5
African American 374 16.9
Asian/Pacific Islander 24 1.1
International 15 0.7
American Indian 12 0.5
Sam Houston State University

66 Sam Houston State University
The SeminarSHSU has developed a comprehensive, coordinated approach toward the first-year experience
that includes a first-year seminar, learning communities, orientations for parents and new students, personalized academic advising, academic support services, and a new student convocation. SHSU designed these services to enhance success for incoming first-year students.
SAM 136, a three-credit-hour first-year seminar, began in fall 2004 to ease the transition to college life by introducing students to academic and personal survival tools, available resources and services, and other students. Approximately 25% of first-year students enroll for the voluntary, writing-intensive course. With classes capped at 25, students read, write, and speak extensively on experiences and challenges common among first-year students. Although SHSU offers a majority of sections to all first-year students, a few thematic sections based on majors and interests allow students to interact with like-minded peers. For example, SHSU dedicates one section to students in the honors program.
The learning objectives of SAM 136 address academic, communication, and life skills, as well as personal growth topics. Academic skills focus on developing basic study, critical-thinking, and problem-solving skills. Communication skills stress effective oral and written communication, group dynamics, and leadership. Life skills emphasize health/stress, nutrition, relationships/sex, alcohol/drugs, and money management. Personal growth topics include exploration of fields of study and potential career opportunities, sensitivity to different cultures, and respect of diversity. The course component on civic engagement and service-learning synthesizes aspects of all four areas of learning objectives.
The director of the first-year experience program screens all faculty with special attention being given to academic preparation, communication skills, and the ability/desire to relate to first-year students. Instructors must participate in a one-day off-campus retreat and periodic faculty devel-opment meetings. As part of the continuous improvement cycle, the director evaluates faculty at the end of each semester to determine avenues of improvement and continued participation with the program.
Research DesignWith the exception of at-risk students required to take SAM 136, beginning first-year students
for fall 2005 (N = 2,217) self-selected their level of participation in the First-Year Experience (FYE) programs. The researchers grouped participants into two levels: first-year seminar only (FYE; n = 428) and nonparticipation in FYE (non-FYE; n = 1,738). An additional 51 students enrolled in SAM 136 and a nonresidential learning community. Given the small number of students in this group, researchers removed these students from the analyses. Subjects differed based on suc-cess profiles (i.e., ACT/SAT score and high school rank). Short-term success indicators included one-year retention rates and GPAs. Analyses of variance (ANOVAs) determined the relationship between level of participation and short-term student success outcome measures. Because the FYE program was initiated in 2004, long-term measures of success, such as graduation rates and alumni participation, will be considered at a later date.
FindingsA comparison of the indicators of preparation for success in college suggests that FYE students
were slightly less prepared than non-FYE students (see Table 2 for comparison of success indicators

Sam Houston State University 67
and short-term outcome measures). FYE students graduated with a lower high school percent rank and obtained lower average scores on standardized admission exams than non-FYE students. A major goal of the FYE program is to retain these less-prepared students.
SAM 136 appears to have had a major impact, particularly for beginning at-risk students. Specifically, at-risk students who were admitted under the condition that they enroll in SAM 136 (an initiative that began in fall 2005) had a one-year retention rate higher than at-risk stu-dents not involved in FYE (M = 74.2% and M = 67.4%, respectively). SAM 136 produced higher retention rates for all students (M = 74.1%), regardless of at-risk status, than non-FYE students (M = 71.1%).
Table 2Comparison of Success Indicators for College and Short-Term Outcome Measures
Group
Success indicators Short-term outcomes
HS % rank ACT SAT
% First-year
retainedF05
GPAS06
GPAF06 GPA
FYE (n = 428) 42.9* 19.1* 938* 74.1 2.44 2.45 2.40
At-risk (n = 241) 50.3 18.2 890 74.2 2.32 2.34 2.30
Not at-risk (n = 187) 33.1 20.5 1002 73.8 2.60 2.60 2.52
Non-FYE (n = 1,738) 29.1* 21.2* 1031* 71.1 2.67 2.73 2.72
At-risk (n = 98) 38.3 17.9 877 67.4 2.36 2.40 2.33
Not at-risk (n = 1,640) 28.6 21.5 1040 71.3 2.69 2.75 2.74
Note. HS % Rank = high school rank as percentage of graduating class; ACT = ACT Composite Score; SAT = SAT Total Score; % First-year retained = 1-year retention rate; F05 = semester GPA earned for fall 2005; S06 = semester GPA earned for spring 2006; F06 = semester GPA earned for fall 2006. *p < .01
In addition to one-year retention rates, semester GPAs were reviewed. While SAM 136 produced desired increases in retention rates, SAM 136 did not appear to impact GPAs. At-risk students, whether or not they were involved in FYE, earned similar GPAs (p > 0.5). Results from an ANOVA from the FYE students indicated no interaction (p > 0.75, see Table 3) between preparation for college and participation in a first-year seminar with respect to GPAs.
Although at-risk students do not show consistent improvement in terms of their grades, they are succeeding at college as witnessed by their retention rates. This early intervention is successful in providing these students with adequate academic skills that remain throughout their academic programs. To the extent that they are successful in maintaining their grades, they are also making consistent progress toward graduation. This is analogous to learning to ride a bike, where the sup-port of the training wheels provide a smooth ride and their removal create an initial unsteadiness before succeeding without help. The data suggest that SAM 136 may provide the initial support and

68 Sam Houston State University
confidence building to allow at-risk students to progress to their second year, where they struggle but still have the confidence and skills to move forward. Researchers identified procedures to track these students through their entire academic career at SHSU to provide data needed to evaluate the incremental value of continued assistance to this at-risk population.
Table 3Comparison of GPAs by FYE Participation and Preparation (N = 2,124)
Factor F p
FYE participation 0.45 .50
Preparation 25.02 < .01
Interaction 0.05 .80
Early results indicate the FYE program is having the desired impact on retention. However, the anticipated impact on GPAs did not develop. Analyses suggest that the FYE cohort was less prepared for college than the total first-year cohort, and the fact that they performed roughly at the same level suggests the program is succeeding. As a continuation of this success, SHSU is planning to expand the programs of the first year to support students throughout their academic career. Future research will focus on the unique demands of the undergraduate experience and identification of strategies to meet these needs.
ContributorsKeri L. Rogers (primary contact)Associate Dean, College of Arts and Sciences and Director, First-Year ExperienceSam Houston State UniversityBox 2209Huntsville, TX 77341-2209Phone: (936) 294-3422E-mail: [email protected]
Richard F. EglsaerAssociate Vice President, Academic Affairs
Mitchell J. MuehsamAssociate Vice President, Academic Affairs and Dean, Graduate Studies
Beth CaillouetGraduate Assistant, First-Year Experience
Lisa KanGraduate Assistant, First-Year Experience

69
The InstitutionThe University of California, Los Angeles (UCLA) is a four-year institution located
in Westwood Village in Los Angeles, about five miles from the Pacific Ocean. UCLA is a public research university that enrolled 25,432 undergraduate students in fall 2006. It is a residential campus that brings together highly motivated students from diverse backgrounds. Fifty-six percent of undergraduates are female, 34% are White, 38% are Asian, 15% are Hispanic, 3% are African American, <1% are Native American, 4% are international, and 5% are other/unknown. Almost 25% of all new students are first-generation college attendees.
The SeminarThe first-year seminar program at UCLA was initially created as an immediate
response to the terrible events of September 11, 2001. The university created a series of one-unit seminars designed to provide an intimate academic setting in which students and faculty could explore topics related to this crisis. Feedback from faculty and student participants in that initial group of 50 seminars resulted in the expansion of the program to include a wide range of topics that could be addressed through one-unit seminars. This expanded approach to small, interactive classes evolved into the Fiat Lux Freshman Semi-nar Program. Sample seminar topics include: Palestine/Israel: Roots of Conflict; Africa in a Global Context; The Hobbit: Tolkien’s View of Good and Evil in the Community; Crisis in Darfur: The Debate Over Genocide and International Intervention; Fast Food Nation; Gay Law; Nanotechnology – Small World, Big Future; and Good to the Last Drop? How Long Will Cheap Oil and Clean Water Last?
The Fiat Lux Freshman Seminar Program is designed with active-learning strategies in mind, to deepen student learning early in the undergraduate experience by offering small classes with a maximum of 20 students—that foster dialogue and participation in learning, increase student interaction with ladder faculty and peers, and expose students to new areas of scholarship in environments that allow them to feel comfortable exploring
University of California, Los Angeles

70 University of California, Los Angeles
varied areas of the curriculum. These one-unit courses are taken Pass/No Pass and do not require a final exam or paper. This paper documents the experiences of students and faculty who participated in the 2003-2006 seminar program at UCLA.
Research DesignThe evaluation relied on the voluntary participation of students in nearly 600 Fiat Lux semi-
nars offered during the 2003-2006 academic years. For 2003-2004, all students enrolled in the seminars received a notice via e-mail during week 8 inviting their participation in the evaluation and assuring them of response anonymity. In order to increase response rates, the decision was made to change the web-administered survey to a paper-and-pencil survey for the subsequent years. As a result, during the 2004-2006 academic years, students were asked to complete the pa-per surveys during the last scheduled class meeting of each quarter. The student survey contained a combination of both closed-ended and open-ended questions, which focused on the students’ level of interaction with faculty and fellow students, perceived outcomes of the seminar, and level of satisfaction with the seminar.
FindingsA total of 5,172 students participated in the almost 600 seminars offered during the 2003-
2006 academic years. Table 1 presents a summary of response rates by academic year. As a result of the in-class paper survey administration, the survey response rate increased substantially.
Table 1Summary of Response Rates by Academic Year
Academic year N Percentage
2003-2004 961 412004-2005 1,976 722005-2006 2,235 71
The main goal of this study was to examine whether UCLA’s Fiat Lux seminars facilitated dialogue and provided a setting that promoted intellectual development and curiosity. The study was also designed to look at satisfaction with the program. The findings are organized around these themes.
The seminars were designed to promote interactions and engage students as “listeners” and “speakers.” Students responded to a variety of items inquiring whether the Fiat Lux Freshman Seminar Program promoted interactions with faculty as well as their peers. When asked if the seminar format allowed them to get to know their instructors, the majority reported that the seminars provided ample opportunity to do so (Table 2). As many students noted, this was less common in large introductory-level courses. In addition to allowing students to get to know their

University of California, Los Angeles 71
instructors, the intimate setting also provided students with opportunities to engage in discussion with their peers. In fact, the majority of students reported feeling comfortable participating in the class discussions during the seminar, with many also reporting that the seminar helped them feel more comfortable participating in discussions in other classes as well (Table 2). Students valued professors who promoted discussion and noted “how their efforts to engage students encouraged a new sense of connection to each other and to the topic.” The students especially valued the op-portunity to interact and learn form each other.
Table 2Students’ Perceived Interaction in the Fiat Lux Seminars
Percent agreement
2003-2004 2004-2005 2005-2006
The seminar format allowed me to get to know my instructor.
80 86 86
I felt comfortable participating in class discussion during the seminar.
90 91 92
The seminar helped me feel more comfortable participating in discussion in other classes.
67 73 75
One main goal of the Fiat Lux Freshman Seminar Program was to provide an opportunity for first-year students to engage in small classroom discussions and support intellectual development. Table 3 presents two items that ask students about their perceived growth over the course of the seminar program. The data show that many of the students were exposed to new ideas from other students and that the course prompted them to think critically and analytically. Several students indicated that they “learned how to think critically about issues” and that “these skills could be used in other classes.”
Table 3Students’ Perceived Growth in the Fiat Lux Seminars
Percent agreement
2003-2004 2004-2005 2005-2006
I was exposed to new ideas from other students.
84 89 88
The course prompted me to think (critically and) analytically.*
90 95 95
*Starting in 2004-2005, this item was reworded as follows: “The course prompted me to think analytically.”

72 University of California, Los Angeles
Students were also asked about their satisfaction with both the seminar instructors as well as the seminars themselves. The Fiat Lux Freshman Seminar Program was well received by the undergraduate students. The majority of the students rated their satisfaction level with their in-structor as High or Very High, and approximately three quarters rated their seminar as High or Very High. The high ratings for both the instructors and the seminars reflect student satisfaction with the Fiat Lux program (Table 4). In fact, when asked if they would recommend the freshman seminar program to their peers, most students (90-92%) indicated that they would do so.
Table 4Student Satisfaction With Fiat Lux Instructors and Seminars
Percent agreement (High or Very High)
2003-2004 2004-2005 2005-2006
Your overall rating of instructor(s)
- 85 87
Your overall rating of the seminar
- 72 76
Note. Item not asked on 2003-04 survey.
UCLA’s Fiat Lux freshman seminar program is meeting its goal of providing students with opportunities for dialogue with faculty and peers on engaging topics. Students give high ratings to the instructors and their seminar experience. Our assessment demonstrates that these seminars engage students to think critically about new ideas and encourages them to be active participants in other classes.
ContributorsMarc Levis-Fitzgerald (primary contact)Director, Office of Undergraduate Evaluation and ResearchUCLA CollegeA265 Murphy HallLos Angeles, CA 90095-1571Phone: (310) 206-5409E-mail: [email protected]
Nida DensonResearch Analyst, Office of Undergraduate Evaluation and Research

73
The InstitutionThe University of Minnesota (UM), founded in 1851, is one of the most compre-
hensive public universities in the United States. It is both the state land-grant university and the state’s primary research university. The Twin Cities campus is located in a major metropolitan area, with facilities in both Minneapolis and St. Paul. UM-Twin Cities offers more than 370 degree programs to more than 50,000 enrolled students, 32,000 of whom are undergraduates. The undergraduate student population is currently 53% female, 47% male. Nearly one quarter (23%) of the undergraduates identify themselves as being non-White (4.6% Black, .9% American Indian, 9.5% Asian, and 2% Hispanic). Half of the students report that they live on campus or can walk to campus. Each year, 5,400 students begin as new first-year students. Although retention from the first to sophomore year is 86%, the six-year graduation rate (based on the 2000 cohort) is only 61%. The UM-Twin Cities awards 6,300 bachelor’s degrees each year.
The SeminarA First-Year Interest Group (FIG) is a learning community of 20 first-semester, first-
year students in the College of Liberal Arts (CLA) who enroll in three courses together that are centered on a theme or academic interest area. Typically CLA offers nine FIG options for incoming first-year students as just one of several kinds of first-year programs designed to help them make a successful transition to college. The Explorations FIG com-bines CLA 1001, ID 1201, and one liberal arts elective course. CLA 1001 (Introduction to CLA Student Life), a one-credit pass/fail course, is the common feature of each of the FIGS. ID 1201 (Major and Career Exploration) is a free-standing, two-credit course that students may take either A/F or pass/fail.
The Explorations FIG was designed for undecided students. The unique approach used in teaching the fall 2006 Explorations FIG was an experiment to combine two of the three component courses (CLA 1001 and ID 1201) into a three-hour course that was team-taught by a career counselor and an academic advisor. The courses remained
University of Minnesota

74 University of Minnesota
separate in that each had specific course assignments and grading that aligned with the original areas of focus for each course. However, additional topics and learning activities, including class visits to three local employers and an opportunity to engage in a community service project with classmates, were added to maximize the learning experience for students while creating a more efficient method to address the objectives of both courses. A single syllabus was used for the com-bined classes. Shared course objectives for CLA 1001 and ID 1201 include:
Connect students to the tools and resources that are essential in the development of goals 1. and strategies for student success and for the encouragement of both on- and off-campus involvementEnable students to learn about themselves through self-assessment of personality, values, 2. skills, and interests, and how those characteristics relate to appropriate selection of a major and careerPromote exploration of and active research into majors and careers3. Prepare students to move toward life management and self-authorship4.
Research DesignThe Explorations FIG was designed with very specific course goals and associated learning
outcomes articulated. Quantitative data were gathered to assess these outcomes through a survey that was given to students on a pre and posttest basis. The survey was developed by the two in-structors and administered on the first and last day of class. Qualitative data were gathered from students’ writing assignments as well as from written comments from a supplementary course evaluation that students completed on the final day of class.
FindingsStudent evaluations strongly supported continuation of the Explorations FIG. Nineteen stu-
dents indicated that they were either satisfied or very satisfied with their first semester experience as a student at the University of Minnesota (n = 19). Of those students responding (n = 18), 17 noted that participation in the Explorations FIG was either an important or very important factor contributing to their satisfaction. Sixteen students indicated that they were either satisfied or very satisfied with their academic performance in college thus far (n = 19). Of the students respond-ing (n = 15), 14 noted that participation in the Explorations FIG was either an important or very important factor contributing to their satisfaction.
Course Objective 1Five items on the survey assessed students’ performance relative to Course Objective 1. Table 1
presents the change in students’ responses to selected items over the course of the semester. Almost all students (95%) agreed or strongly agreed that the course increased their confidence in their ability to graduate within four years and that it increased their awareness of ways to become involved in activities on campus and in the community. Similarly, a large majority of students (89%) indicated that they were more likely to participate in such activities as a result of taking the course.

University of Minnesota 75
Table 1Pre/Posttest Responses Related to Course Objective 1
Connect students to essential resources Pretest mean Posttest mean Percent change
I understand the value of a liberal arts degree and could name at least three advantages of a liberal arts education.
1.45 2.45 65.52%
I believe I have the study skills and time management skills that I will need to succeed academically.
2.7 3.2 18.52%
Note. Responses on a four-point Likert scale with 1 = strongly disagree and 4 = strongly agree.
Student Excerpts
“I have become more confident of my performance in school. I feel like for the point I’m ëat now, I have a good understanding of how to use available resources.”“I feel a lot more comfortable on campus, and I am not so intimidated. The class helped ëa lot with this.”“I have matured, and I know my goals. This class taught me to pursue what I love.” ë
Course Objective 2Four items on the survey assessed students’ performance relative to Course Objective 2 (Table
2). Students reported the greatest change in understanding their strengths and skills and how these related to major and career choices. One student noted, the course “forced me to look deep within myself at the person that I want to become. I now make more strategic decisions and am a lot more independent….”
Six items assessed students’ performance relative to Course Objective 3. Table 3 reports the pre and posttest means for selected items. The course appears to be successful in helping students gather information about majors and careers and in understanding the process involved in select-ing a major. Specifically, we noted a
60% decrease in the number of students who reported they lacked enough knowledge ëabout specific majors to be able to make an informed decision58.44% decrease in the number of students who reported uncertainty about which major(s) ëfits best with their career plans54.55% decrease in the number of students who reported uncertainty of the process/steps ëinvolved in choosing a major
The course also helped students see the value of exploring majors and careers early during the college experience, as evidenced by a 60% decrease in the number of students who reported that thinking about majors seemed like something too far in the future to be concerned with right now.
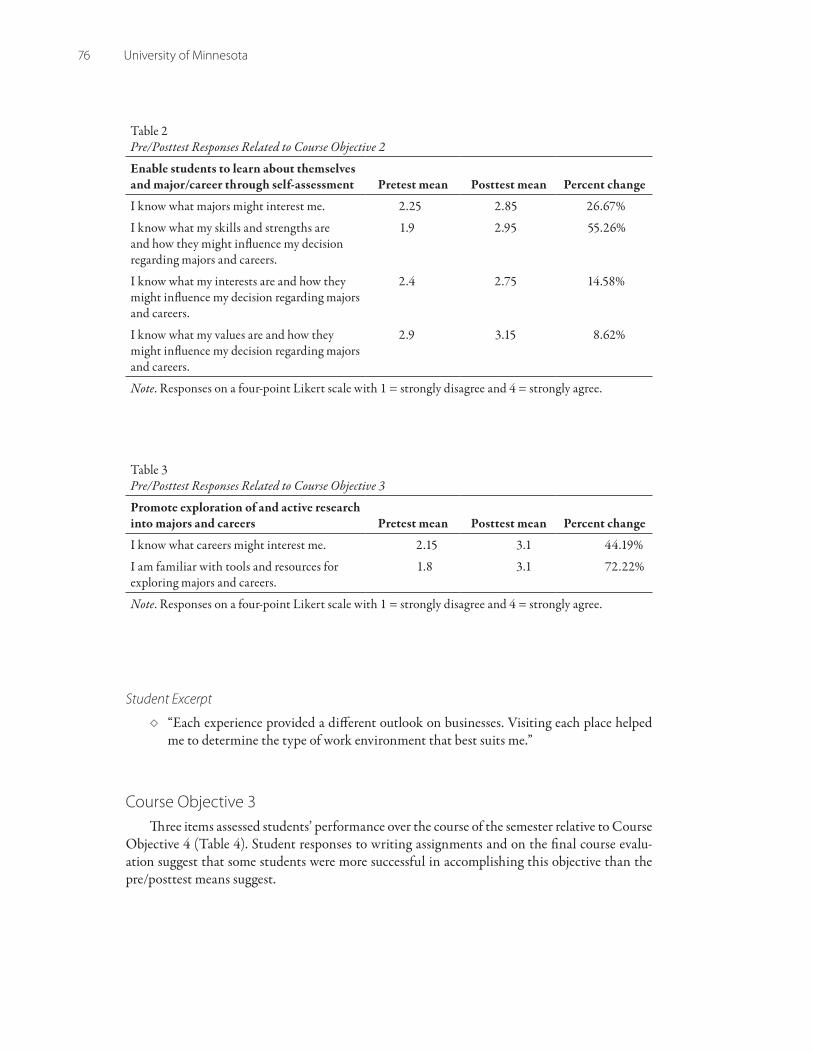
76 University of Minnesota
Table 2Pre/Posttest Responses Related to Course Objective 2
Enable students to learn about themselves and major/career through self-assessment Pretest mean Posttest mean Percent change
I know what majors might interest me. 2.25 2.85 26.67%
I know what my skills and strengths are and how they might influence my decision regarding majors and careers.
1.9 2.95 55.26%
I know what my interests are and how they might influence my decision regarding majors and careers.
2.4 2.75 14.58%
I know what my values are and how they might influence my decision regarding majors and careers.
2.9 3.15 8.62%
Note. Responses on a four-point Likert scale with 1 = strongly disagree and 4 = strongly agree.
Table 3Pre/Posttest Responses Related to Course Objective 3
Promote exploration of and active research into majors and careers Pretest mean Posttest mean Percent change
I know what careers might interest me. 2.15 3.1 44.19%
I am familiar with tools and resources for exploring majors and careers.
1.8 3.1 72.22%
Note. Responses on a four-point Likert scale with 1 = strongly disagree and 4 = strongly agree.
Student Excerpt
“Each experience provided a different outlook on businesses. Visiting each place helped ëme to determine the type of work environment that best suits me.”
Course Objective 3Three items assessed students’ performance over the course of the semester relative to Course
Objective 4 (Table 4). Student responses to writing assignments and on the final course evalu-ation suggest that some students were more successful in accomplishing this objective than the pre/posttest means suggest.
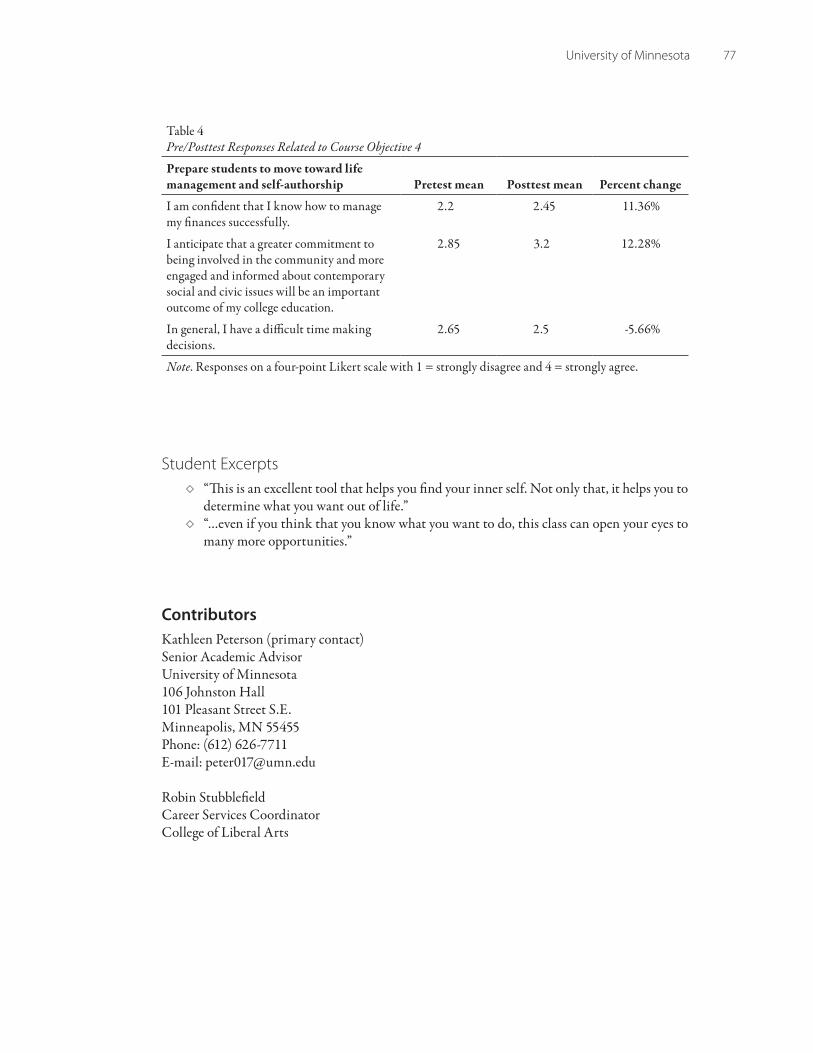
University of Minnesota 77
Table 4Pre/Posttest Responses Related to Course Objective 4
Prepare students to move toward life management and self-authorship Pretest mean Posttest mean Percent change
I am confident that I know how to manage my finances successfully.
2.2 2.45 11.36%
I anticipate that a greater commitment to being involved in the community and more engaged and informed about contemporary social and civic issues will be an important outcome of my college education.
2.85 3.2 12.28%
In general, I have a difficult time making decisions.
2.65 2.5 -5.66%
Note. Responses on a four-point Likert scale with 1 = strongly disagree and 4 = strongly agree.
Student Excerpts“This is an excellent tool that helps you find your inner self. Not only that, it helps you to ëdetermine what you want out of life.”“…even if you think that you know what you want to do, this class can open your eyes to ëmany more opportunities.”
ContributorsKathleen Peterson (primary contact)Senior Academic AdvisorUniversity of Minnesota106 Johnston Hall101 Pleasant Street S.E.Minneapolis, MN 55455Phone: (612) 626-7711E-mail: [email protected]
Robin StubblefieldCareer Services CoordinatorCollege of Liberal Arts


79
The Institution The University of Texas at El Paso (UTEP) is a doctoral, research-intensive, four-year
public institution located on the U.S.-Mexico border. A commuter campus, UTEP’s fall 2006 enrollment was 19,842 students: 11,237 full-time undergraduates and 2,544 first-time, first-year students. Undergraduates are 76.1% Hispanic. International students include 8.3% from Mexico and 1.3% from a country other than Mexico. Additional undergradu-ate populations include 9.1% White, 2.8% African American, 1.1% Asian American, and .2% Native American. Females represent 55.1% of undergraduates. The average age is 23; 27.6% of students are older than 25. Fifty-four percent are first-generation college students (neither parent has a college degree).
The Seminar UTEP has offered its first-year seminar, UNIV 1301 Seminar in Critical Inquiry,
since 1999. The seminar is a three-credit academic course with variable content related to each instructor’s area of expertise. Students may select from such diverse themes as Voices of Change: Social Protest in the Sixties, Latino Image in Theatre and Film, Food and You, and Environmental Issues in the El Paso Region. College transition and success skills are addressed through the theme. Currently 81% of all full-time, first-year students enroll in the seminar in their first semester. Sections are capped at 25 students.
Many seminar courses are offered in learning communities for the general popula-tion and for special populations such as the Circles of Learning for Entering Students (CircLES) program for prescience/pre-engineering majors. Seminars in learning com-munities are linked to one, two, or three other courses and often act as the linking course. For example, the seminar themed “American Dream” is teamed with “History of the U.S. Since 1865.” The seminar instructor selects literature that connects with key events discussed in the history course.
University of Texas at El Paso

80 University of Texas at El Paso
An instructional team consisting of an instructor, librarian, academic advisor, and peer leader teaches each seminar. Instructors may be full-time faculty or staff with a master’s or terminal degree. Though the theme for each section varies, all must address the same five goals:
Strengthen students’ academic performance and facilitate their transition to college1. Enhance students’ essential academic skills2. Increase student-student and student-faculty interaction both in and outside of the class-3. roomEncourage students’ self-assessment and goal clarification4. Increase students’ involvement with UTEP activities and resources5.
To teach the seminar, instructors must submit a proposal identifying the theme and describing how the section will address course goals. Proposals are accepted based on academic merit.
Research DesignThe seminar assessment strategy focuses on the development and longitudinal tracking of
student cohorts, using data from UTEP’s Student Information System. Additionally, prior to fall 2005, anonymous student surveys provided qualitative analyses to complement the quantitative results. In total, this evaluation effort addresses all seminar goals listed previously. Collectively, these efforts address the impact made on student retention, success (measured by GPA), enhanced student skills, and involvement in campus activities and services.
FindingsEntering student cohorts examined over the past seven years show that students who enroll
in the seminar demonstrate higher retention rates and GPA than their counterparts who do not complete the seminar. Three indicators of seminar success were selected as baseline measures in the longitudinal study of student persistence and program effectiveness: (a) first-time seminar enrollment, (b) retention rates, and (c) cumulative GPA.
Since the seminar’s inception, the number of full-time students enrolled in a fall-semester seminar has more than doubled, from 777 in fall 1999 to 1,859 in fall 2006. The percentage of first-time, full-time, first-year students enrolled in the course increased from 44.3% fall 1999 to 80.5% in fall 2006. During this same period, the retention rate of those enrolled in the seminar ranged between 68.3% and 74.1%. The one-year retention rates for those who never enrolled in the seminar are considerably lower, between 39.7% and 60.9% (Table 1).
The highest one-year retention rates occurred in 1999 and 2000, the first two years of the seminar. In subsequent years, as the percentage for the number of entering students enrolled in a fall semester seminar increased, the one-year retention rate declined. In addition to the impact on retention resulting from the increased number of students and sections, tuition increases re-sulting from a significant reduction in state funding may have also negatively impacted retention. The University increased tuition for enrollment in 12 credit hours by 14.6% in spring 2004 and another 12% in fall 2004.
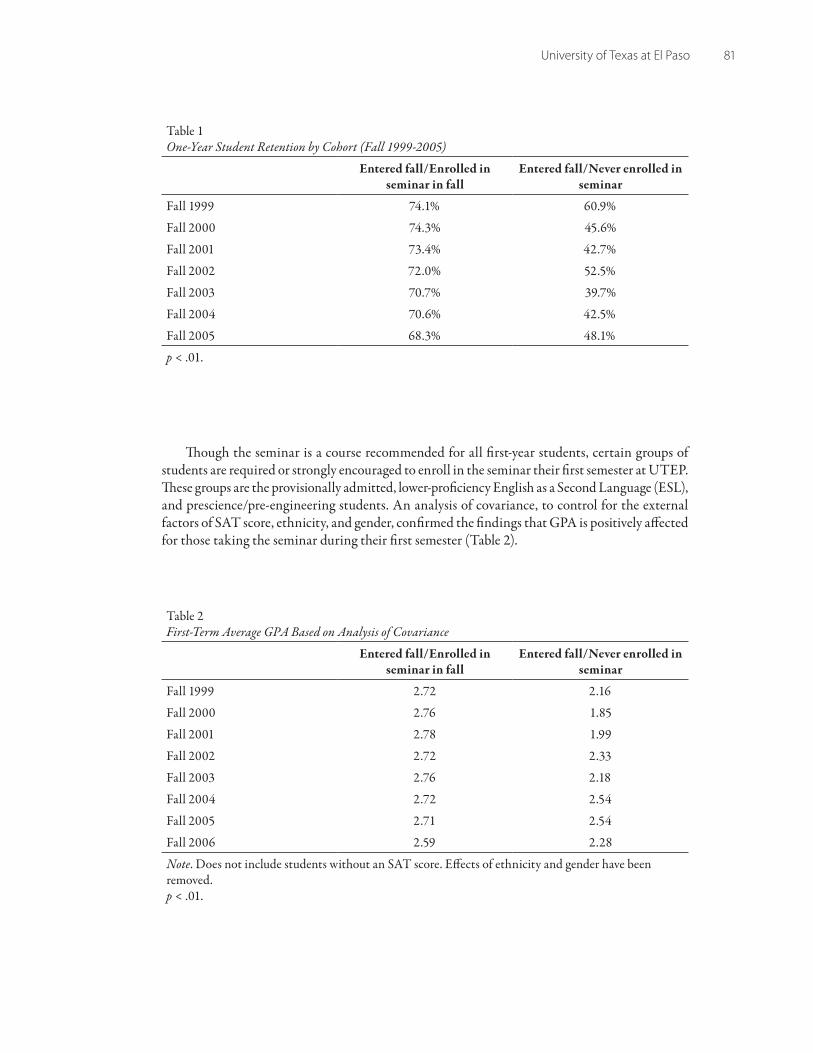
University of Texas at El Paso 81
Table 1One-Year Student Retention by Cohort (Fall 1999-2005)
Entered fall/Enrolled in seminar in fall
Entered fall/Never enrolled in seminar
Fall 1999 74.1% 60.9%
Fall 2000 74.3% 45.6%
Fall 2001 73.4% 42.7%
Fall 2002 72.0% 52.5%
Fall 2003 70.7% 39.7%
Fall 2004 70.6% 42.5%
Fall 2005 68.3% 48.1%
p < .01.
Though the seminar is a course recommended for all first-year students, certain groups of students are required or strongly encouraged to enroll in the seminar their first semester at UTEP. These groups are the provisionally admitted, lower-proficiency English as a Second Language (ESL), and prescience/pre-engineering students. An analysis of covariance, to control for the external factors of SAT score, ethnicity, and gender, confirmed the findings that GPA is positively affected for those taking the seminar during their first semester (Table 2).
Table 2First-Term Average GPA Based on Analysis of Covariance
Entered fall/Enrolled in seminar in fall
Entered fall/Never enrolled in seminar
Fall 1999 2.72 2.16
Fall 2000 2.76 1.85
Fall 2001 2.78 1.99
Fall 2002 2.72 2.33
Fall 2003 2.76 2.18
Fall 2004 2.72 2.54
Fall 2005 2.71 2.54
Fall 2006 2.59 2.28
Note. Does not include students without an SAT score. Effects of ethnicity and gender have been removed.p < .01.

82 University of Texas at El Paso
While the comparison of the one-year retention and GPA data for seminar and nonseminar students clearly demonstrates the positive impact the seminar has on first-year students, the decline in retention and GPA is a concern. Additional study is required to determine the causes of the decline. UTEP will conduct additional research, including contacting leavers, to identify factors that might be negatively impacting student retention. The findings of this research may help guide positive changes to the seminar.
Contributors Maggy SmithDean, University College
Dorothy Ward (primary contact)Director, Entering Student ProgramUniversity of Texas at El PasoAcademic Services Building, Room 218500 West University El Paso, TX 79968Phone: (915) 747-8439 E-mail: [email protected]
Ann DarnellResearch Associate
Francisco MartinezResearch Associate

83
The Institution The University of Washington (UW) Bothell is a public four-year, commuter campus
located 12 miles north of Seattle and serving the north Puget Sound and Eastside region. UW Bothell has 1,421 full-time students who study interdisciplinary arts and sciences, business, education, computing software systems, and nursing. Having previously served only upper-division and graduate students, in 2006, we admitted our inaugural class of first-year students. Of the 136 entering students, 49% were women. Students were diverse in terms of race/ethnicity: 5.1% African American, 5.9% Hispanic, 33.8% Asian American, 44.9% Caucasian, 0.7% Native American, and 0.7% Hawaiian or Pacific Islanders. Of the incoming first-year class, 35% were first-generation college students; none were over 25.
The SeminarAll of our first-year students take the three-quarter Discovery Sequence, beginning
with the Discovery Core seminar in the fall that consists of a team-taught interdisciplin-ary course worth 10 credits (15 credits is a normal course load). Small class sizes (25 to 48 students for two instructors) ensure that we meet the needs of individual students. We integrate multiple learning styles and pedagogies, including science labs, theater games, mapping, art-making, writing, and the production and interpretation of visual and quan-titative data. The seminar involves multiple sites on campus that include the classroom, library, the Quantitative Skills Center, the Writing Center, Computer Labs, the wetlands, and art sites. In addition to the course content, we introduce students to university ex-pectations and embed academic services and student life within the seminar. Our goal is to connect students with each other and with faculty in a learning community that values a diversity of people, thoughts, and approaches from which a more sophisticated intellectual exchange will emerge.
Students chose among four different versions of the Discovery Core: (a) Dreaming the Earth, (b) The Human Place in Nature, (c) Origins, and (d) Growing Things. These
University of Washington Bothell

84 University of Washington Bothell
courses were unified by a Common Book experience, similar access to academic and cocurricular services, and a set of learning outcomes, including:
Critical inquiry1. , which draws upon interdisciplinary perspectives to investigate and derive knowledgeQuantitative literacy2. , the ability to comprehend and analyze mathematical relationships, especially through interpreting and constructing charts and graphsCommunication3. , especially through oral and multimedia expression, but particularly through being able to write coherent and well-developed paragraphs Community engagement4. , including learning in collaboration with local, regional, na-tional, and global communities. At the least, we expected students to develop collaborative problem-solving skills
Research Design Because 2006 was the first time we offered the seminar, we wanted to test whether we formed
a learning community, successfully integrated the practice of interdisciplinarity, and developed similar academic skills in all four versions of the course. In order to assess these items, we developed several different instruments. We also analyzed syllabi to determine the interdisciplinary nature of the courses and the skills emphasized.
We recorded quantitative data, including the retention rate and the number of times students visited the Quantitative Skills Center and Writing Center during the quarter that Discovery Core was offered. We also assessed the students’ perspective qualitatively by administering a survey in winter quarter and the National Survey of Student Engagement (NSSE). Furthermore, we had extensive feedback from the faculty at the end of the term and through regular meetings at which we discussed outcomes, experiences, and challenges.
Findings We first offered the Discovery Core in 2006, but our preliminary results are encouraging. As
simply one example, the instructors for Growing Things noted:
Let us emphasize again what a pleasure it was to teach Discovery Core! We enjoyed the unique opportunity to work closely with the first freshman class, to know our students well, and to have a small class that allowed the students to work with each other and with us as a team.
The data suggest that we are successfully building learning communities. By the end of spring, we retained 121 of the 136 first-year students who had entered. During the fall, the same quarter Discovery Core was offered, our first-year students visited the Quantitative Skills Center 160 times and the Writing Center 93 times, indicating that they recognized the support networks on campus. Furthermore, 66% of our students feel involved with the university (Table 1). But only 46.9% of our students recognized the role the Discovery Core played in building the sense of community (Table 1). Next year, we will include more reflective writing assignments to elucidate the role of the seminar to the students. We also want the students to recognize more clearly how they, as individuals, meet the learning outcomes. Finally, we recognize that an ideal learning community is intellectually rich, and we find that our students overwhelmingly appreciate the intellectual
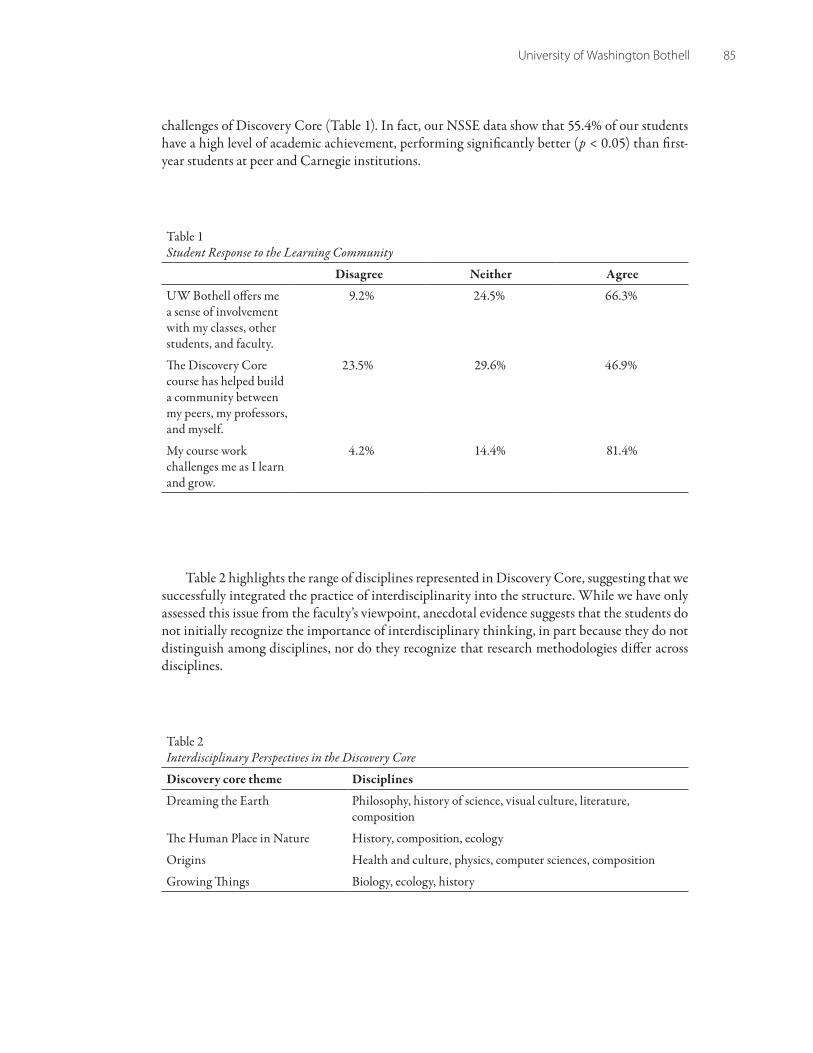
University of Washington Bothell 85
challenges of Discovery Core (Table 1). In fact, our NSSE data show that 55.4% of our students have a high level of academic achievement, performing significantly better (p < 0.05) than first-year students at peer and Carnegie institutions.
Table 1 Student Response to the Learning Community
Disagree Neither Agree
UW Bothell offers me a sense of involvement with my classes, other students, and faculty.
9.2% 24.5% 66.3%
The Discovery Core course has helped build a community between my peers, my professors, and myself.
23.5% 29.6% 46.9%
My course work challenges me as I learn and grow.
4.2% 14.4% 81.4%
Table 2 highlights the range of disciplines represented in Discovery Core, suggesting that we successfully integrated the practice of interdisciplinarity into the structure. While we have only assessed this issue from the faculty’s viewpoint, anecdotal evidence suggests that the students do not initially recognize the importance of interdisciplinary thinking, in part because they do not distinguish among disciplines, nor do they recognize that research methodologies differ across disciplines.
Table 2 Interdisciplinary Perspectives in the Discovery Core
Discovery core theme Disciplines
Dreaming the Earth Philosophy, history of science, visual culture, literature, composition
The Human Place in Nature History, composition, ecology
Origins Health and culture, physics, computer sciences, composition
Growing Things Biology, ecology, history

86 University of Washington Bothell
We also analyzed the course syllabi to identify discrete skills that faculty emphasized in Dis-covery Core (Table 3). Despite different content, faculty largely emphasized the same set of skills. The skills that the faculty emphasized (Table 3) overlap greatly with the skills that students feel they have mastered adequately for their current level of experience (Table 4). Still, we have plenty of room for improvement. The instructors are not satisfied with the students’ writing abilities, their use of evidence, or their ability to define and solve problems through critical reasoning. In the future, we need to assess the students’ actual ability in these skills, rather than their percep-tion of their ability.
We are extremely pleased with the outcomes of our initial Discovery Core and are constantly working—through conversations, retreats and workshops, and better assessment instruments—to make it an even more enriching experience. In order to achieve the next step, we will continue to work on faculty development during the academic year, host workshops in the summer, develop more articulate ongoing assessments, and ask students to give us more direct feedback about the Discovery Core experience itself.
Table 3 Skills That the Faculty Addressed in the Four Versions of the Discovery Core
Dreaming the Earth
The Human Place in Nature Origins Growing Things
Short and long writing assignments
X X X X
Library research X X X X
Critical reading and observation
X X X X
Statistical hypothesis testing
X X
Constructing arguments
X X X X
Applying and evaluating evidence
X X X X
Public speaking X X X
Working independently
X X X X
Working collaboratively
X X X X

University of Washington Bothell 87
Table 4 Students’ Satisfaction With Their Learning
% Less satisfied % Satisfied % More satisfied
Writing effectively 11.2 33.7 55.1
Locating information needed to help make decisions and solve problems
10.2 36.7 53.1
Critically analyzing written information
8.2 31.6 60.2
Defining and solving problems
10.2 34.7 55.1
Working and/or learning independently
6.2 30.9 62.9
Working cooperatively in a group
9.2 29.6 61.2
ContributorsGray Kochhar-Lindgren (primary contact)Director, Center for University Studies and ProgramsProfessor: Interdisciplinary Arts and SciencesUniversity of Washington BothellBox 358563 18115 Campus Way NEBothell, WA 98011-8246Phone: (425) 352-3670E-mail: [email protected]
J. Droege Student Life Advisor
S. Leadley Library Head, Reference and Instruction R. M. Price Assistant Professor, Interdisciplinary Arts and Sciences,
B. R. Rosenberg Director, Teaching and Learning Center
B. Tippens Associate Director, Information Services


89
The InstitutionAlmost 40 years ago the State of Wisconsin founded a four-year, public university on
the shores of Green Bay. Today, University of Wisconsin (UW)-Green Bay serves 5,800 undergraduates (5,000 FTE) each fall across an array of 35 programs. Eighty percent attend full-time, and one third live on campus. Two thirds of the students are women, and 7% are ethnic minorities (including 3% Asian, 2% Native American, and 1% each Hispanic/Latino and African American). Eighty-five percent of undergraduates, and almost all new first-year students, are under the age of 25. Only 37% of new first-year students have a parent who has completed a four-year degree.1
The SeminarIn fall 2006, UW-Green Bay piloted six sections of a three-credit first-year seminar
designed to promote engagement and an understanding of interdisciplinarity. UW-Green Bay first-year students score statistically lower than students at other similar colleges, both in the UW System and nationwide, on virtually all aspects of educational engagement measured by the National Survey of Student Engagement (NSSE). With a student-faculty ratio over 23-to-1, and introductory level general education courses averaging more than 90 students, the university has struggled to identify ways to connect first-year students with their faculty and university.
The first-year seminar classes were taught by full-time tenured and tenure-track faculty from the humanities and social sciences, and sections were capped at 25 students each and limited to entering fall first-year students. Enrollment in a seminar class was optional, and students were unaware that the seminar section they registered for was different from the larger general education version of the class (to provide a relatively random sample for the seminar classes). In all, 15% of the fall 2006 first-year cohort participated in the project. The seminars met for 75 minutes twice a week, and covered essentially the same content as the larger-section courses, in addition to first-year seminar elements. These elements included a film series with follow-up discussions led by seminar faculty, an information
University of Wisconsin- Green Bay
90 University of Wisconsin-Green Bay
literacy component led by a campus librarian, an extensive writing component, and a variety of programs and activities sponsored by the Office of Student Life. Common scheduling also enabled the faculty to implement a common lesson plan designed to enhance students’ understanding of interdisciplinarity, one of our University’s core values. Students spent two class periods working, with students from different seminars each representing the perspectives of their course, on a problem-focused learning exercise.2
Research DesignWe used a between-participants experimental design comparing first-year students in the
seminars with a control group of those who did not take the seminars on measures of engagement. The survey instrument contained items that mirror those found on the NSSEs College Student Report, with special emphasis on items that focus on the concepts of active and collaborative learn-ing, student-faculty interaction, the supportiveness of the campus environment, and self-reported intellectual development. Students in the seminars completed a two-page survey at the end of the semester (n = 130, representing 90% of the students enrolled in a seminar class). The control group included 158 first-year students who had not enrolled in a seminar and who received an e-mail invitation to complete the same survey online (total potential sample of 577, representing a 27% response rate).
FindingsThe results of our analyses indicated that seminar participants reported higher levels of various
types of engagement than did members of the control group. For example, as compared to the control group, seminar participants reported engaging significantly more in class behaviors such as asking questions, making presentations, and working with classmates (Table 1). However, there were no significant differences between the groups on variables assessing experiences outside class.
We were particularly interested in examining seminar students’ perceptions of their interac-tion with faculty, as UW-Green Bay first-year students have scored particularly low on the NSSE benchmark for Student-Faculty Interaction (SFI) as compared to students at similar campuses in Wisconsin. As Table 2 indicates, seminar participants reported significantly higher levels of inter-action with faculty than did nonparticipants. For example, seminar students were almost twice as likely to report discussing grades or assignments often with faculty and were more than twice as likely to report talking often with faculty about career plans. However, out-of-class experiences did not differ between the groups. Taken together with the findings from Table 1, this lack of dif-ference indicates a potentially useful direction for future curriculum development in the seminar program, namely encouraging more out-of-class interaction with faculty and other students.
The results of our study indicate that the seminar program may also act to significantly increase students’ perceptions of the supportiveness of the campus environment. For example, Figure 1 indicates that seminar students reported receiving significantly more support in their academic relationships with other students (t = 1.7, p < .06), faculty members (t = 4.7, p < .01), and university staff (t = 1.7, p < .05). Table 3 also indicates that seminar participants perceived a more supportive campus environment than did nonparticipants in terms of their social and nonacademic development.

University of Wisconsin-Green Bay 91
Table 1Percentage of First-Year Students who Reported Engaging in Learning Experiences “Often” or “Very Often”
Percentage response
ActivityControl group
(n = 158)Seminar group
(n = 130) χ2
Asked questions in class 26% 48% (3, N = 285) = 19.0***
Made a class presentation 2% 7% (3, N = 286) = 21.3***
Worked with other students during class
22% 38% (3, N = 281) = 23.4***
Worked with classmates outside of class
25% 23% (3, N = 283) = 3.6
Discussed class ideas with others outside of class
37% 45% (3, N = 282) = 4.5
Note. The four response options for each item were: Never, Sometimes, Often, and Very Often. The Often and Very Often options were collapsed for the chi-square tests because indicating that an activity is performed at least often in a class is the indicator of engagement we were most interested in for the purposes of this investigation.***p < .001.
Table 2Percentage of First-Year Students Reporting Interaction With Faculty
Percentage responding “Often” or “Very Often”
Percentage responding “Never”
Activity
Control group
(n = 158)
Seminar group
(n = 130)
Control group
(n = 158)
Seminar group
(n = 130) χ2
Discussed grades or assignments
15% 29% 28% 19% (3, N = 283) = 9.6*
Talked about career plans
4% 14% 57% 39% (3, N = 286) = 19.0***
Discussed class materials outside of class
7% 13% 68% 55% (3, N = 281) = 5.5
Received prompt feedback
31% 48% 22% 11% (3, N = 283) = 12.3**
Note: The Often and Very Often options were collapsed for this series of chi-square tests because indicating that an activity is performed at least often in a class is the indicator of engagement we were most interested in for the purposes of this study. In addition, we excluded the Sometimes category from this table because we were most interested in comparing the responses clearly indicating engagement or lack thereof for the purposes of this investigation.*p < .05. **p < .01. ***p < .001.

92 University of Wisconsin-Green Bay
Table 3 Student Perceptions of the Supportiveness of the Campus Environment
Percentage responding Very Little
Percentage responding Some
Percentage responding Quite a
Bit or Very Much
UWGB…
Control group
(n = 158)
Seminar group
(n = 130)
Control group
(n = 158)
Seminar group
(n = 130)
Control group
(n = 158)
Seminar group
(n = 130) χ2
…provides support students need to succeed academically
1% 0% 30% 25% 69% 75% (2, N = 282) = 2.5
… helps students cope with non-academic responsibilities
42% 21% 37% 51% 21% 28% (2, N = 287) = 14.1***
…provides support students need to thrive socially
26% 8% 40% 38% 34% 54% (2, N = 283) = 20.0***
Note: The Quite a Bit and Very Much options were collapsed for this series of analyses because perceiving the university helps at least quite a bit is the indicator of engagement we were most interested in for the purposes of this study.***p < .001.
Figure 1. First-year students reported quality of support in academic relationships.
1
2
3
4
5
6
7
Other students Faculty Administrators
Potential source of support
Participants
Nonparticipants
Deg
ree
of
sup
po
rt

University of Wisconsin-Green Bay 93
Finally, the seminar program appeared to have a positive influence on students’ perceptions of their intellectual development. For example, seminar students were significantly more likely to report engaging in higher-level cognitive activities in their class (Table 4) and, although relatively few first-year students reported writing any long papers, seminar students reported writing sig-nificantly more short papers than did nonparticipants (Figure 2). More than two-thirds (67%) of seminar participants wrote at least five short papers during their first term, compared to 42% of nonparticipants (χ2 [4, N = 284] = 32, p < .001). Seminar students also reported that their university experiences had a significantly greater influence on their intellectual and personal development (see Table 5), with means for 13 of these survey items differing by statistically significant margins.
Table 4Student Perceptions of the Mental Activities in the Course
Percentage responding Very
LittlePercentage
responding Some
Percentage responding Quite a
Bit or Very Much
Coursework emphasizes…
Control group
(n = 158)
Seminar group
(n = 130)
Control group
(n = 158)
Seminar group
(n = 130)
Control group
(n = 158)
Seminar group
(n = 130) χ2
…analysis 7% 0% 47% 32% 46% 68% (2, N = 282) = 19.9***
…synthesis 12% 2% 49% 36% 39% 62% (2, N = 284) = 17.8***
… making judgments
17% 8% 47% 38% 36% 54% (2, N = 285) = 11.9**
… applying theories and concepts to practical problems
13% 5% 52% 29% 35% 66% (2, N = 286) = 29.1***
Note: The Quite a Bit and Very Much options were collapsed for this series of analyses because perceiving the coursework emphasizes each at least quite a bit is the indicator of engagement we were most interested in for the purposes of this study.**p < .01. ***p < .001.
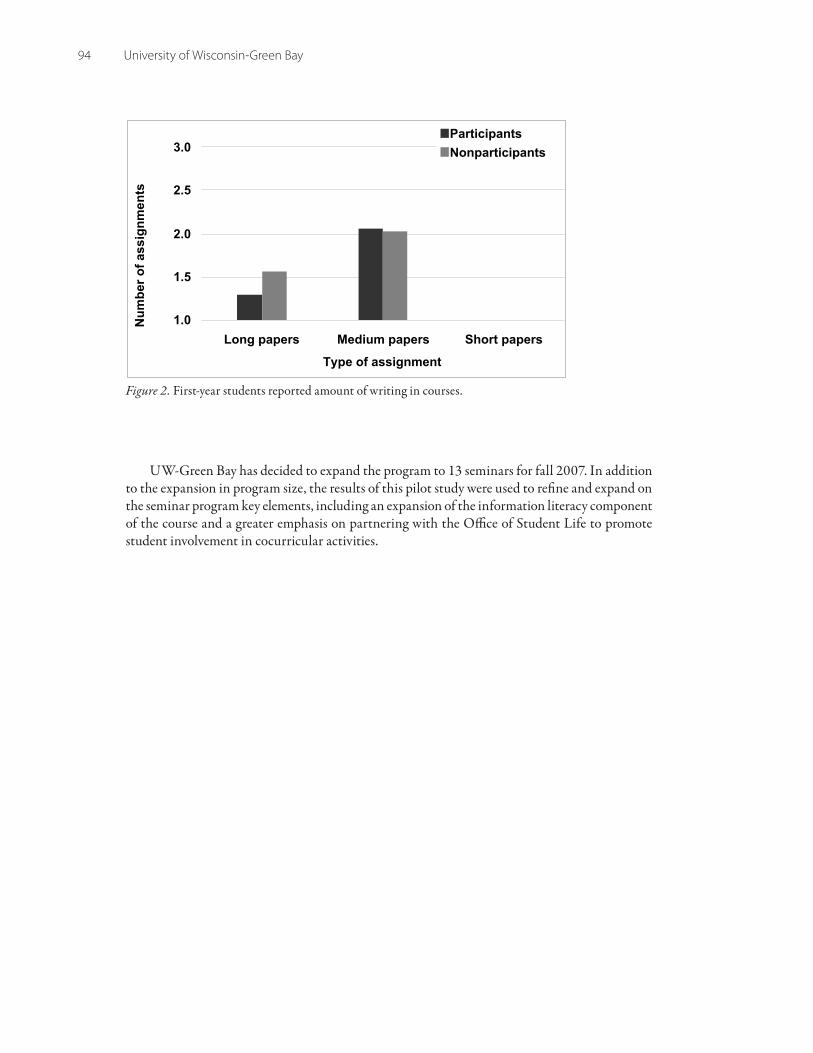
94 University of Wisconsin-Green Bay
1.0
1.5
2.0
2.5
3.0
Long papers Medium papers Short papers
Type of assignment
Nu
mb
er
of
assig
nm
en
ts
Participants
Nonparticipants
Figure 2. First-year students reported amount of writing in courses.
UW-Green Bay has decided to expand the program to 13 seminars for fall 2007. In addition to the expansion in program size, the results of this pilot study were used to refine and expand on the seminar program key elements, including an expansion of the information literacy component of the course and a greater emphasis on partnering with the Office of Student Life to promote student involvement in cocurricular activities.
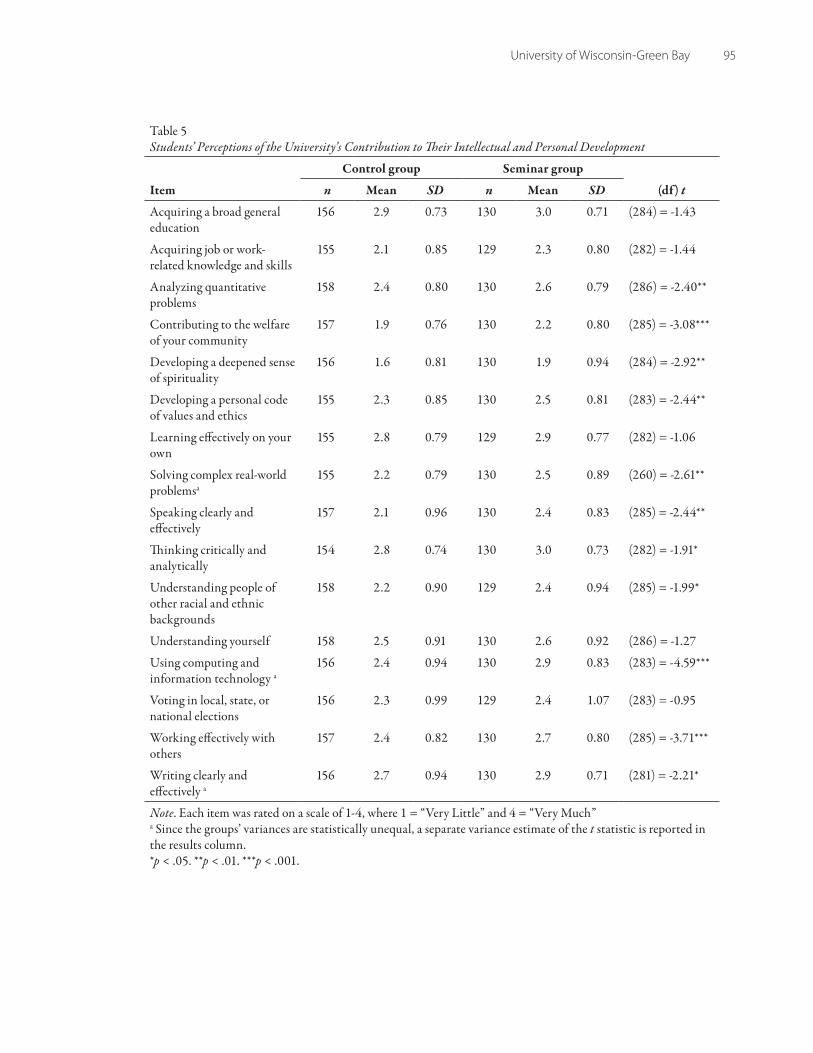
University of Wisconsin-Green Bay 95
Table 5Students’ Perceptions of the University’s Contribution to Their Intellectual and Personal Development
Control group Seminar group
Item n Mean SD n Mean SD (df) t
Acquiring a broad general education
156 2.9 0.73 130 3.0 0.71 (284) = -1.43
Acquiring job or work-related knowledge and skills
155 2.1 0.85 129 2.3 0.80 (282) = -1.44
Analyzing quantitative problems
158 2.4 0.80 130 2.6 0.79 (286) = -2.40**
Contributing to the welfare of your community
157 1.9 0.76 130 2.2 0.80 (285) = -3.08***
Developing a deepened sense of spirituality
156 1.6 0.81 130 1.9 0.94 (284) = -2.92**
Developing a personal code of values and ethics
155 2.3 0.85 130 2.5 0.81 (283) = -2.44**
Learning effectively on your own
155 2.8 0.79 129 2.9 0.77 (282) = -1.06
Solving complex real-world problemsa
155 2.2 0.79 130 2.5 0.89 (260) = -2.61**
Speaking clearly and effectively
157 2.1 0.96 130 2.4 0.83 (285) = -2.44**
Thinking critically and analytically
154 2.8 0.74 130 3.0 0.73 (282) = -1.91*
Understanding people of other racial and ethnic backgrounds
158 2.2 0.90 129 2.4 0.94 (285) = -1.99*
Understanding yourself 158 2.5 0.91 130 2.6 0.92 (286) = -1.27
Using computing and information technology a
156 2.4 0.94 130 2.9 0.83 (283) = -4.59***
Voting in local, state, or national elections
156 2.3 0.99 129 2.4 1.07 (283) = -0.95
Working effectively with others
157 2.4 0.82 130 2.7 0.80 (285) = -3.71***
Writing clearly and effectively a
156 2.7 0.94 130 2.9 0.71 (281) = -2.21*
Note. Each item was rated on a scale of 1-4, where 1 = “Very Little” and 4 = “Very Much”a Since the groups’ variances are statistically unequal, a separate variance estimate of the t statistic is reported in the results column.*p < .05. **p < .01. ***p < .001.

96 University of Wisconsin-Green Bay
Notes1Data on parents’ educational level were taken from the 2006 institutional administration of the National Survey of Student Engagement.2A complete description of this lesson plan was published in the March 2007 issue of Teaching Forum.
ContributorsDenise BartellAssistant Professor of Human Development and Psychology
Deborah Furlong (primary contact)Director of Institutional Research UW-Green Bay2420 Nicolet DriveGreen Bay, WI 54311-2001Phone: (920) 465-2374E-mail: [email protected]
Scott FurlongDean of Liberal Arts and Sciences and Professor of Public and Environmental Affairs
Regan A. R. GurungAssociate Professor of Human Development and Psychology and Chair of Human Development
Andrew KerstenProfessor of History and Chair of Social Change and Development
Georjeanna Wilson-DoengesAssociate Professor of Psychology and Chair of Psychology

97
The InstitutionThe University of Wisconsin (UW)-Whitewater is a comprehensive university with a
tradition of excellence in both academics and athletics. Founded in 1868, the University of Wisconsin-Whitewater is a premier public four-year regional university with an enroll-ment of 10,500 students in 46 undergraduate majors and 13 master’s degree programs (approximately 9,300 undergraduate and 1,200 graduate students). Fifty-two percent are female students, 94% are Wisconsin residents, and 93% of the first-year students reside on campus. Of all first-year students, 76.7% have returned for the second year (five year average).
UW-Whitewater is part of the 26-campus University of Wisconsin System. It is located in Whitewater, Wisconsin, a community of 13,000 residents in southeastern Wisconsin.
The SeminarA noncredit first-year seminar had been offered at UW-Whitewater for many years.
Historically, a low number of students enrolled each year in the few sections that were offered. This low enrollment was likely due, in part, to the fact that the course was not offered for credit. Even as a noncredit course, data demonstrated that seminar participants had higher retention rates compared to each overall first-year cohort retention rate. In spite of the evidence demonstrating the first-year seminar’s student retention value, it was not until relatively recently that changes in this intervention strategy took hold. In the fall of 2000, the institution’s chancellor, concerned about the apparent downward trend in student retention rates, convened a cross-disciplinary task force to address the issue. This eventually led to the first-year seminar course being offered for one credit. Enrollment in the seminar grew once the course was offered for credit. By the fall of 2002, more than 30% of the incoming first-year class enrolled in 36 course sections. This number has since grown to well over 50%. Section instructors are predominantly faculty members and student affairs academic staff members. Instructors are provided with specialized training
University of Wisconsin-Whitewater
98 University of Wisconsin-Whitewater
and given a recommended syllabus. While instructors have some level of latitude in developing the section format, certain topics are required, including career planning, time management, and academic advising. Most instructors make use of the suggested syllabus and use a variety of peda-gogical methods, including journal and other writing, visits to student service facilities on campus, guest speakers, skill development activities, and interpersonal interaction activities.
Research DesignTwo studies sought to determine if there was a significant effect on retention to the second
year of college for students who participated in a first-year seminar compared to those who did not, taking precollege academic preparation into account. The studies also examined possible interactive effects. The studies used full first-year cohort populations as opposed to random samples. The first study was conducted using virtually the entire 2002-2003 first-year cohort, and the second study was a replication using the 2003-2004 data. Since placement into participant or nonparticipant levels of the independent variable was voluntary, care was taken to validate the equivalency of the groups.
The students in these studies completed a one-credit first-year seminar during the fall semester. A chi-square analysis was performed because it was the most explicable statistical method in terms of the specific research questions.
FindingsFirst-year seminar participants returned to the second year at a significantly higher rate than
nonparticipants, as did students of higher precollege academic preparation. No significant interac-tion effects were noted. All students benefited equally from participation (Tables 1 and 2).
Collectively, these two studies set out to answer three research questions. The first question was posed to determine if there was a significant effect on retention level for students of high, middle, and low precollege academic preparation entry-level ability. The answer is yes. In both studies, a significant effect on retention level was noted for students of varying precollege academic prepara-tion, particularly between the distinctly different low and high academic preparation groups. The second question sought to determine if there was a significant effect on retention level for students who participate in a first-year seminar and those who do not. The answer was, again, yes. The third question sought to determine if there were interactive effects of first-year seminar participation and precollege academic preparation on retention. No interactions were noted in either of the studies, and as such, no relative differences in retention for participants and nonparticipants at differing precollege ability levels were found. Students of all three ability levels benefited roughly equally from participation in the seminar.
The real power of these findings does not reside with the fact that high, middle, and low ability students persist in their education at different levels. It has long been recognized that measures of precollege ability, such as standardized test scores and class rank, are associated with differences in the rates at which students return for their second year of college. The finding that the students participating in a first-year seminar return at a higher rate than those not participating is somewhat more interesting. This finding tends to confirm the results found in 15 of the 19 studies previously referenced, so it is not unexpected either.
What is of particular importance in these studies is the lack of any interactions between precollege ability and first-year seminar participation on retention rate. These results indicate that students of all entering ability levels benefit from participation in a first-year seminar and that students accrue benefits of the same magnitude regardless of entering ability level.

University of Wisconsin-Whitewater 99
Table 12002-2003 Cohort Retention Rate by Groups
Seminar participation
Precollege academic preparation Nonparticipant Participant Total cohort
Low 65% 70% 66%
Mid 74% 82% 77%
High 79% 82% 80%
Total 73% 78% 74%
Table 22003-2004 Cohort Retention Rate by Groups
Seminar participation
Precollege academic preparation Nonparticipant Participant Total cohort
Low 63% 76% 69%
Mid 68% 77% 72%
High 74% 88% 80%
Total 69% 80% 74%
ContributorsChunju ChenDirector of Institutional ResearchUniversity of Wisconsin–Whitewater
Jeff C. Janz (primary contact)Executive Director of Residence LifeUniversity of Wisconsin–Whitewater800 W. Main St.Goodhue Hall, Suite 200Whitewater, WI 53189Phone: (262) 472-1157E-mail: [email protected]
John W. MillerPresident Central Connecticut State University


101
The InstitutionLocated in southeastern Wisconsin about 40 miles east of Madison and 50 miles
west of Milwaukee, the University of Wisconsin (UW)-Whitewater is a public, four-year, residential institution. Total enrollment in fall 2006 was 10,502 students of whom 9,210 were undergraduates: some 45% of undergraduates are first-generation, and more than 95% are of traditional age. The 2006 undergraduate population is 52.2% female, 90.0% White, 4.0% Black, 2.4% Asian, 2.4% Hispanic, 0.5% Native American, and 0.7% nonresident alien. From July 1, 2005 through June 30, 2006, 1,657 bachelor’s and 424 master’s degrees were awarded.
The SeminarThe New Student Seminar (NSS) was offered at UW-Whitewater for almost 25
years, though it first became eligible for graduation credit in fall 2001. The seminar is designed as an extended, one-credit orientation course for first-year students. The class is elective and meets either twice each week for the first eight weeks of the semester, or once each week for the entire semester at the discretion of the instructor. The seminar is taught by a mix of faculty and administrative staff, many of whom serve as master advis-ers for their respective colleges. The past two years, sophomore through senior level peer mentors have also been assigned to work with a section of the course, and these student mentors are available to advise and assist seminar participants with myriad academic and non-academic issues throughout the first semester. Each peer mentor works with 20 to 25 students, and their work is integral to the success of the seminar.
There are several required topics for all sections of the NSS: campus involvement/career planning, responsible decision-making regarding alcohol and other drugs, appro-priate behavior in personal relationships, sexual assault, and appreciating diversity (not necessarily a stand-alone class, but an infusion of discussion throughout). Other common topics include (but are not limited to) goals of a university education, time management,
University of Wisconsin-Whitewater
102 University of Wisconsin-Whitewater
academic and personal integrity, learning styles, connecting with the faculty members on campus, and group projects.
Enrollment in the NSS has grown significantly over the past five years. In 2001, only 312 students enrolled. By fall 2006, seminar enrollment had soared to 1,221—representing a gain of some 391%. Despite this dramatic increase in enrollment, the one-year retention rates for students completing the course continue to be nearly 5% higher than observed for nonparticipants.
Research DesignThis research looks at the front and back ends of Whitewater’s NSS to estimate better the
seminar’s effectiveness while concurrently demonstrating (a) the association of seminar participa-tion with enhanced retention outcomes, (b) the precedence of seminar participation over its effects in time, and (c) the plausibility of the rival hypothesis of participant selection bias.
New first-year student records from fall 2001 through fall 2006 were pooled, and differences of means tests were conducted on variables summarizing their entering academic characteristics to explicate the potential impact of selection bias on seminar participation. Continuous variables such as transfer and test credits were recoded into dichotomies to minimize the effects of low incidences and both missing values and outliers. The 2001 - 2005 records were merged with reten-tion outcome data, and regression equations were estimated to examine the independent effects of entering characteristics and selected student collegiate experiences on the one-year retention outcome. Stepwise (forward and backward) logistic regression was used for initial estimation, and the resulting validated model was subsequently re-estimated using familiar ordinary least squares linear regression to enhance the interpretability of the coefficients for general audiences.
FindingsOne argument frequently advanced to explain the favorable retention outcomes associated with
the NSS is that participation in the elective seminar is driven by self-selection. In other words, the seminar has no independent effect because better students opt to participate. While the definition of what exactly constitutes a better student is arguable, Table 1 shows nonparticipants are admitted to the University with significantly more college transfer and advanced placement test credits than are NSS participants on average. Moreover, NSS participants also scored significantly lower on the ACT composite and all the subtests. Even though the differences of means seen across the groups would be practically trivial if we were comparing one student to another, the pattern of results is counterintuitive and inhospitable to the participatory selection bias hypothesis.
As Table 1 details, the only academic advantage enjoyed by NSS participants was their some-what higher high school percentile ranks. But, since the selection bias hypothesis argues better students sign up for the seminar, we are not free to ascribe statistical significance to the difference of means observed employing the one-tailed distribution of t.
Table 2 presents the results of the regression analysis. The constant shows the intercept for the base model, equating to a retention rate of 64.3%. The estimated independent effects of several variables, entering with a high school rank in the 65th percentile or higher, earning at least one hour of advanced placement test credit, and passing the NSS were all associated with a 6.2% reten-tion increment. An hour or more of transfer credit leveraged a somewhat smaller gain of 4.9%, and only the ACT math score among ACT’s standardized test scores showed any significant impact on outcomes. Given the difficulty so many first-year students have in their math courses, it should not

University of Wisconsin-Whitewater 103
be surprising that the raw math subtest score is a better predictor of retention than the composite. Two racial/ethnic classifications were associated with independent impacts in opposite directions. But the largest estimated impact was felt by the comparatively few students who enrolled in the NSS yet failed to pass or complete it. Failure in courses such as the NSS is likely to be a very strong predictor of subsequent attrition.
Table 1Average Entering Characteristics of New, First-Year Students by New Student Seminar Participation Status, 2001-2006
Entering CharacteristicEnrolled NSS
(n = 4,963)Not enrolled (n = 5,880) Significance
Transfer units .29 .38 .012
AP Test units .73 .94 .000
HS percentile rank 65.18 64.53 .075
ACT English 20.93 21.14 .000
ACT Math 21.76 22.26 .000
ACT Social Science 21.74 22.25 .000
ACT Natural Science 22.01 22.32 .000
ACT Composite 21.71 22.13 .000
Table 2Average Entering Characteristics of New, First-Year Students by New Student Seminar Participation Status, 2001-2006 (N = 8,897)
Entering characteristic Unstand. b Std. Error Significance
HS percentile rank > 65 .062 .009 .000
Any AP test credit .062 .015 .000
Any transfer credit .049 .019 .012
Black Race/Ethnicity -.051 .021 .014
Southeast Asian Race/Ethnicity
.082 .038 .031
ACT Math .003 .001 .008
NSS grade D or higher .062 .009 .000
NSS grade of F, W, or I -.279 .029 .000
Constant .643 .026 .000
R2 = .033.

104 University of Wisconsin-Whitewater
The variance in retention explained by the model in Table 2, only a bit over 3% (R2 = .033) using many of the “usual suspects,” is quite disturbing. Even though this model is clearly underspecified and does not incorporate the impacts of campus residency, other supportive programs, participation in student athletics and other activities, financial aid awards, or other factors, the inescapable policy conclusion is that factors other than admissions criteria, demographics, and NSS participation accounted for nearly 97% of the variance in one-year retention during the study period at UW-Whitewater. The headline could be: one-year retention rates are likely far more random and less amenable to control than many of us working very hard to enhance the first-year experience might care to admit. Also, when the equation from Table 2 was applied to the five cohorts separately, the high school percentile rank and one or both of the variables associated with NSS outcomes emerged as the only consistently significant predictors. These disaggregated results provide strong evidence of the consistent effectiveness of the NSS in improving one-year retention.
This last finding brings us full circle back to the self-selection bias hypothesis and points to the mainsprings of student success. What advantage do students with somewhat higher high school percentile ranks but significantly lower standardized test scores who enroll in courses they do not have to take, and pass them, have compared to their peers? Call it academic motivation. Call it making the effort. Call it trying harder. Call it pride. If only we could assign numbers to fields in our admissions databases to capture these personal traits correlated with academic success as easily as we now populate them with standardized test scores.
ContributorsEdward J. Furlong (primary contact)Associate Institutional PlannerUniversity of Wisconsin-Whitewater800 W Main St.Whitewater, WI 53190Phone: (262) 472-1705E-mail: [email protected]
Linda LongAssistant Dean-New Student Programs/FYE

105
The InstitutionWells College, on the shore of Cayuga Lake in Aurora, New York, was established
as a women’s college in 1868. The College, a nationally recognized private four-year residential liberal arts college, became coeducational in 2005. In fall 2006, enrollment was 481 undergraduates (475 FTE), 84% female and 16% male, which was an increase of 15% from the preceding year, including an increase in male students who comprised 24% of all new students. Eighty-four percent of the first-year class were first-time full-time students, 25% first generation. Overall, most students are White, non-Hispanic (65%), of traditional age (91%), and from New York state (65%).
The SeminarInterdisciplinary first-year seminars were originally implemented in 1993 as a required
two-course, full-year sequence. The sequence was modified in 1999 such that while the first course maintained a common syllabus interdisciplinary approach, the second used a variable topic approach. A 2004 evaluation indicated that the content of the common-syllabus course was narrowing such that it was more or less becoming a humanities course that students viewed as an “English” course. The Evaluation Subcommittee (2004) concluded that while it
acknowledged value in the interdisciplinary aims and shared syllabus…, we also recognized that the inter- or cross-disciplinary approach not only makes the course difficult to teach, but may also be inappropriate for most first-year students, who expect faculty to be experts in the texts and methods they teach. (p. 2)
An alternative approach was implemented in 2005 that included a revised WLLS 101 First-Year Writing Seminar and a new one-credit WLLS 111 Introduction to Wells course. WLLS 111, required of all first-year and transfer students, is designed to facilitate students’ transitions to the College. WLLS 101, required of all incoming first-time students, is
Wells College

106 Wells College
designed to teach writing, analysis, and interpretation in a small, topic-focused seminar. Seminar topics are chosen by individual faculty members and approved through normal curriculum chan-nels. Twelve faculty members taught the course in fall 2006. Eight were full-time permanent members of the faculty, four in visiting full-time lines; 58% were associate or full professors; and 33% represented humanities, 33% social sciences, 25% natural and mathematical sciences, and 8% the arts. Section enrollments were limited to 15 first-year students.
Research DesignThis past year, WLLS 101 was systematically assessed beyond standard course evaluations and
faculty narratives. Faculty administered two surveys to students, one during the first class week and one during the last. The former asked students to provide information regarding their experiences in high school with writing and class discussions as well as their motivations as college students. The latter asked students to provide information regarding their experiences with writing and class discussion in their seminar, what skills they felt they needed to further develop, what they believed faculty emphasized, and how well the course met the College’s institutional goals. Of the 175 students registered, 174 (M = 17.98 yrs, SD = 0.651) completed the first survey and 149 (M = 18.21 yrs, SD = 0.596) completed the second. Faculty also responded to an end-of-semester survey on their perceptions of these same issues and provided examples of student work.
FindingsIt is clear that WLLS 101 required different writing assignments than students experienced
previously (Table 1) though there were some activity similarities (Table 2). In high school, students used the formulaic five-paragraph essay approach the majority of the time typically completing assignments of three pages or less with sources drawn primarily from the Internet, class-assigned books, or topic-specific books.
At the semester’s start, 82% of students characterized their writing abilities as good, very good, or excellent and 86% reported that others saw their writing in that way. The majority of students, however, still reported that improving their writing (78%) and learning how to write college-level papers (82%) were very important motivations for them.
One third of students reported that the amount of writing in WLLS 101 was less than they expected; 53% indicated it was about what they expected. Students believed faculty stressed writ-ing, discussion, and the specific content of the course over other objectives such as library research, presentations, source evaluation, peer feedback, and the ability to examine questions that shape human understanding. Students indicated that the activities that contributed most to their im-provement were class discussions (including developing discussion questions), peer editing, writing lots of papers (M = 6-8), and submitting drafts to receive instructor feedback.
At the semester’s end, 78% of students characterized their writing abilities as good, very good, or excellent. While this percentage appears similar to that at the semester’s start, it does not rep-resent the same students. Only 40% of students rated their abilities at the same level at the two reporting times, 34% indicated a decrease in rating and 24% an increase.
Areas where most students felt the need for additional development included writing well, constructing well-informed and persuasive arguments, thinking analytically, making oral presen-tations, reading critically, conducting library research, and using discussion as a means of inquiry.

Wells College 107
Regarding class discussion, students participated when the topic was of interest to them, not because participation was required, which was consistent with their behavior in high school.
Students and faculty evaluated the course similarly. Differences tended to be between course sections rather than between students and faculty and extended to almost every course element including class format, workload, and types of assignments. This finding of inconsistency across sections is a common one across institutions (e.g., Dolinsky & Barnes, 2005). Regardless, students perceived WLLS 101 as meeting the institution’s goals (Table 3).
Wells is committed to providing a high-quality first-year seminar experience. To do so, we have implemented a new procedure for recruiting program faculty, are improving communication between faculty to facilitate consistency, and have started the discussions on revising the course objectives such that they focus on the common learning expectations across sections. In particular, we plan to articulate the specific measurable learning outcomes related to writing, class discussion, and essential skills for college success.
Table 1Types and Frequencies of Writing Assignments Completed by Students
High School WLLS 101
Frequently Rarely/Never Frequently Rarely/Never
Literary analysis 87% 6% 51% 38%
Essay in response to instructor-provided topic
86% 7% 74% 16%
Current event analysis 60% 30% 21% 75%
News report 37% 55% 15% 83%
News feature 31% 61% 13% 83%
Creative writing 74% 19% 17% 73%
Laboratory report 59% 37% 1% 95%
Book review 53% 40% 18% 75%
Research (term) paper 39% 36% 22% 70%
Annotated bibliography 48% 39% 20% 77%
Informal writing (e.g., reading notes/questions, in-class writes)
91% 4% 67% 27%
Note: The Frequently category includes survey responses of monthly, weekly, and daily while the Rarely/Never category includes responses of once or never.

108 Wells College
Table 2Assignment Activities and Frequencies Completed by Students
High school WLLS 101
FrequentlyNot
frequently Never FrequentlyNot
frequently Never
Describe 87% 11% 1% 78% 19% 2%
Report facts 78% 19% 1% 71% 25% 4%
Synthesize information from multiple sources
76% 20% 2% 72% 25% 2%
Analyze needs of audience
44% 46% 8% 46% 43% 11%
Critique written arguments
49% 41% 5% 40% 43% 16%
Offer and support your opinion
84% 13% 1% 78% 18% 2%
Make revisions 73% 22% 3% 72% 20% 7%
Engage in peer editing 47% 42% 9% 44% 38% 18%
Submit multiple drafts 50% 41% 6% 59% 29% 12%
Note: The Frequently category includes survey responses of very often and often while Not Frequently includes sometimes and occasionally.
Table 3Students’ Ratings of How Well WLLS 101 Met the Institutional Goals
Very Somewhat A bit Not at all
Provide an educational experience that supports students as unique individuals engaged in the study and practice of the liberal arts
48% 37% 9% 5%
Maintain an excellent faculty that is skilled in teaching, dedicated to rigorous intellectual development, and actively committed to pursuing new knowledge and learning strategies
58% 32% 5% 4%
Develop students’ intellectual curiosity, analytical and critical capabilities, and aesthetic awareness and creativity
50% 32% 11% 6%
Provide a rich community environment that fosters awareness and sensitivity to social diversity and encourages responsible action in an interdependent world
41% 33% 14% 11%
Develop self-confident individuals, who exercise sound judgment and have the knowledge and skills for thoughtful decision-making
36% 42% 13% 7%

Wells College 109
ReferencesDolinsky, B., & Barnes, K. (2005). Endicott College. In B. F. Tobolowsky, B. E. Cox, & M. T. Wag-
ner (Eds.), Exploring the evidence: Report research on first-year seminars, Vol. III (Monograph No 42, pp. 47-50). Columbia, SC: University of South Carolina, National Resource Center for The First-Year Experience and Students in Transition.
Wells 101-102 Evaluation Subcommittee. (2004, April). Report to APPC from the Wells 101-102 Evaluation Subcommittee, April 2004. Aurora, NY: Author.
ContributorCindy J. SpeakerAssociate Dean of the CollegeWells College170 Main St.Aurora, NY 13026Phone: (315) 364-3473 E-mail: [email protected]

111
The Institution West Texas A&M University (WTAMU) is a four-year residential public institu-
tion with 61 undergraduate degree programs, 43 masters programs, and one doctoral program. Of the 5,765 undergraduate students, 1,178 lived on campus during the 2006-2007 academic year. In fall 2006, 58% were female, 75% were White, 4% were interna-tional students, and 19% were of ethnic origin (African American: 4%, Hispanic: 15%, Other: 2%) and the average age was 26. Seventy percent of the University’s students are first-generation, defined as the first person in their family to attend a postsecondary educational institution.
The SeminarWTAMU’s college success course is called IDS 1071: Elementary Group Dynam-
ics. Though offered since 1997, it is only recently that the course has been successfully marketed to students beyond those with low test scores, who are required to take it. IDS is a three-hour academic course limited to 25 students per section. As the course has moved from a developmental requirement to a student success course, more faculty have been willing to teach it in addition to their departmental course load. Still, the majority of sections are taught by staff members with a graduate degree and at least 18 hours of interdisciplinary graduate hours. In fall 2006, 454 students were enrolled this course, 48% of all first-year students.
The course is an interdisciplinary course that helps students develop communication and college success skills. With this communication focus, students develop a set of skills and gain experiences to ensure their academic and professional success. This course lays a strong foundation for success by helping students to
Develop effective writing skills ëArticulate a career vision and understand the discipline-specific courses necessary ëto fulfill their career vision
West Texas A&M University
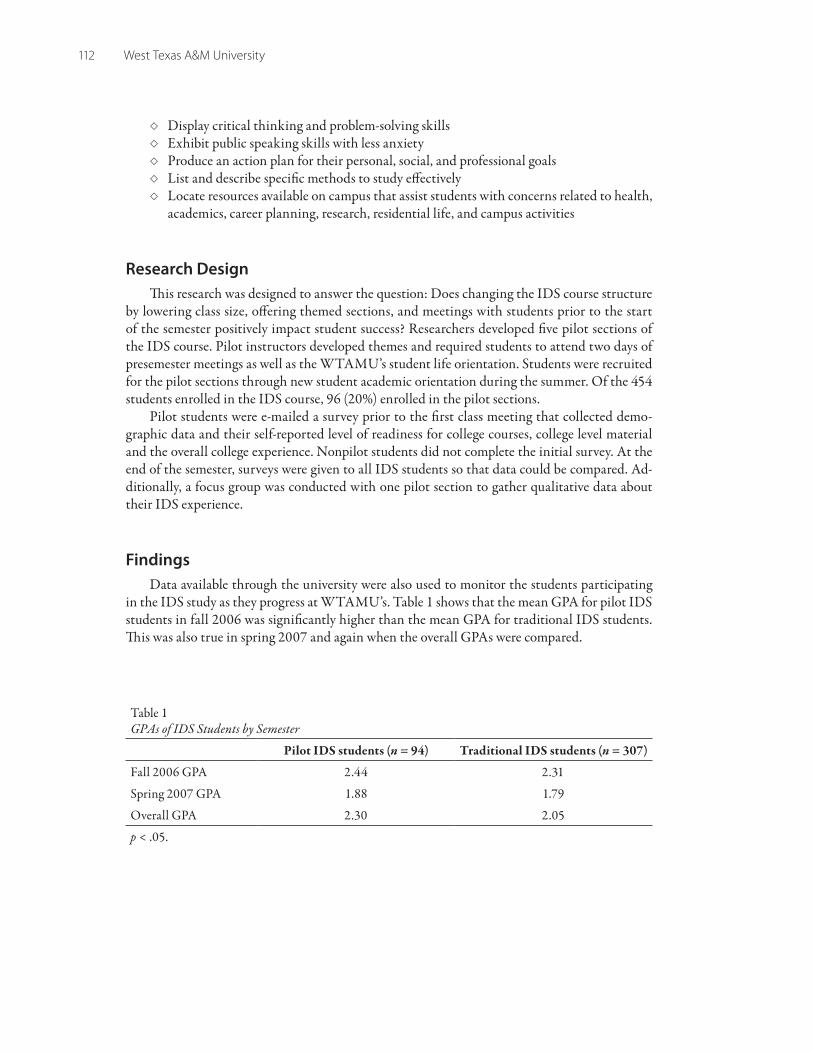
112 West Texas A&M University
Display critical thinking and problem-solving skills ëExhibit public speaking skills with less anxiety ëProduce an action plan for their personal, social, and professional goals ëList and describe specific methods to study effectively ëLocate resources available on campus that assist students with concerns related to health, ëacademics, career planning, research, residential life, and campus activities
Research DesignThis research was designed to answer the question: Does changing the IDS course structure
by lowering class size, offering themed sections, and meetings with students prior to the start of the semester positively impact student success? Researchers developed five pilot sections of the IDS course. Pilot instructors developed themes and required students to attend two days of presemester meetings as well as the WTAMU’s student life orientation. Students were recruited for the pilot sections through new student academic orientation during the summer. Of the 454 students enrolled in the IDS course, 96 (20%) enrolled in the pilot sections.
Pilot students were e-mailed a survey prior to the first class meeting that collected demo-graphic data and their self-reported level of readiness for college courses, college level material and the overall college experience. Nonpilot students did not complete the initial survey. At the end of the semester, surveys were given to all IDS students so that data could be compared. Ad-ditionally, a focus group was conducted with one pilot section to gather qualitative data about their IDS experience.
FindingsData available through the university were also used to monitor the students participating
in the IDS study as they progress at WTAMU’s. Table 1 shows that the mean GPA for pilot IDS students in fall 2006 was significantly higher than the mean GPA for traditional IDS students. This was also true in spring 2007 and again when the overall GPAs were compared.
Table 1GPAs of IDS Students by Semester
Pilot IDS students (n = 94) Traditional IDS students (n = 307)
Fall 2006 GPA 2.44 2.31
Spring 2007 GPA 1.88 1.79
Overall GPA 2.30 2.05
p < .05.

West Texas A&M University 113
While the students in the pilot sections earned significantly higher GPA, we cannot determine with certainty that changes in the course led to improved GPAs’. Nevertheless, there appears to be a positive impact related to the course, which should be explored more fully.
Qualitative data obtained from the focus group of one pilot IDS section suggested the stu-dents benefited from both the course content and the opportunity to continually ask questions as they applied the skills addressed throughout the semester. These focus group students also said the most important factor in their course was the relationships developed with one another and with the instructor before the semester began.
Marketing the college success course to all students, rather than simply requiring it as a remedial course was a significant change in philosophy for the university. As a result of this new philosophy, the IDS course grew from 19 sections in fall 2006 to 35 sections in fall 2007 with a total enrollment of 761 students, 80% of the first-year class.
IDS instructors were trained on such topics as relationship building skills, student engage-ment, and assessing and adapting to student strengths and abilities. Based on the success of the pilot sections of IDS for fall 2006, every IDS section for fall 2007 included a theme. Students sign up for sections including themes ranging from “Everything I Need to Know I Learned From Star Trek” to “The I-Pod Generation.”
More students chose to enroll in the IDS class as a result in the change in course philosophy. As additional strategies are developed and studied, IDS sections will be adjusted so that all first-year students may benefit from the most innovative and most effective teaching methods available.
ContributorsMo Cuevas (primary contact) Assistant Professor and Program Director, Social Work ProgramOM 432 West Texas A&M UniversityCanyon, Texas 79016 Phone: (806) 651-2592E-mail: [email protected]
Amy AndersenAssistant Professor, Education
Jessica MallardAssociate Professor of Communication
Russell Lowery-Hart Executive Director of Quality Enhancement & First Year Experience