Embed Size (px)
Citation preview
University of Vermont University of Vermont
ScholarWorks @ UVM ScholarWorks @ UVM
UVM Honors College Senior Theses Undergraduate Theses
2018
EXPLORING THE DECLINE IN THE MALE SHARE OF COLLEGE EXPLORING THE DECLINE IN THE MALE SHARE OF COLLEGE
ENROLLMENT: WHAT IT SAYS ABOUT MASCULINITY ENROLLMENT: WHAT IT SAYS ABOUT MASCULINITY
Julia Wood
Follow this and additional works at: https://scholarworks.uvm.edu/hcoltheses
Recommended Citation Recommended Citation Wood, Julia, "EXPLORING THE DECLINE IN THE MALE SHARE OF COLLEGE ENROLLMENT: WHAT IT SAYS ABOUT MASCULINITY" (2018). UVM Honors College Senior Theses. 262. https://scholarworks.uvm.edu/hcoltheses/262
This Honors College Thesis is brought to you for free and open access by the Undergraduate Theses at ScholarWorks @ UVM. It has been accepted for inclusion in UVM Honors College Senior Theses by an authorized administrator of ScholarWorks @ UVM. For more information, please contact [email protected].
EXPLORING THE DECLINE IN THE MALE SHARE OF COLLEGE ENROLLMENT:
WHAT IT SAYS ABOUT MASCULINITY
Julia Wood
College of Arts and Sciences
Department of Economics
University of Vermont
Thesis Advisor: Dr. Stephanie Seguino, Department of Economics
Thesis Committee: Dr. Emily Beam (Department of Economics), Dr. Eleanor Miller
(Department of Sociology), Dr. Stephanie Seguino (Department of Economics)

2
Table of Contents
I. Abstract
II. Introduction
III. Literature Review
IV. Methodology
V. Results
VI. Conclusion
VII. Appendices

3
I. Abstract
This paper explores the declining male share of enrollment in higher education and the
implications for the economy, society, and gender relations. The United States, like many other
developed nations, places high emphasis on producing college-educated individuals. The hope is
that an investment in a college education will increase a person’s human capital and in turn, yield
higher salary returns in the labor market. In the early 20th century, women were excluded from
college, and thus male college enrollment exceeded female enrollment. Since the 1980s, however,
the college gender gap has declined and is now reversed with men a minority of college enrollees
(DiPrete & Buchmann, 2013). The gender gap in higher education has occurred simultaneously
with rising labor market and education incentives, suggesting that men are not responding to
these increased returns, as seen by the recent slowdown in men’s enrollment (DiPrete &
Buchmann, 2013). This paper explores the factors that have contributed to this shift in
enrollments. To do so, I present an economic regression analysis using panel data from national
higher education institutions as well as macro-level data and sociological variables to explore the
determinants of the declining share of male enrollment. The results may be useful in addressing
the causes of this trend, and in identifying policies to remedy the problem.
4
II. Introduction
The declining male share of college enrollment is a truly puzzling phenomenon and one
that began in the 1980’s along with changes in labor markets, and gender and social dynamics.
Many researchers have written about the rising achievement and success of women, but what
about men? As women now comprise a majority of college enrollments, what other paths are
young men pursuing, if they are not one of the 41 percent of males that have a higher education
degree?
To better understand the gender trends in enrollment, this research will focus on the
determinants of male share of enrollment in higher education and answer the question “why are
males turning away from a college education relative to women?” This is a particularly acute
problem since access to work and earnings in the United States economy (as well as in other
industrialized economies) increasingly are linked to college degree. Today, a bachelor’s degree is
often a pre-requisite to entry-level jobs and thus the gateway to upward social mobility. A better
understanding of causes of the decline in male enrollments, in both absolute and relative terms,
within the current education system and society will be helpful as a precursor to developing
policies that will encourage all individuals to pursue higher education in order to adequately
prepare for the labor market.
The gender reversal in male-female share of college enrollments is especially compelling
as a focus of research since little attention has been paid to this phenomenon by researchers. As
gender equality within the household and the labor market has increased, women are becoming
more equal to men through their access to education. With this, they are now able to attend
college, enter a career path, marry later in life, and file for divorce, which all contribute to a
relative rise in family instability. As more women are becoming man’s equal within the
5
household and the labor market, previous cultural and societal norms are shifting. The rise of the
breadwinner wife is now associated with the destruction of marriage (Rosin, 2012). And now
that women are more educated, they are likely to have increased wage opportunities, marriage
with those of similar educational attainments, a higher standard of living, and an increased
protection against poverty (DiPrete & Buchmann, 2013).
Interestingly, the highly male-dominated (masculine) sector, manufacturing has been
central to the United States economy. Within the manufacturing sector, there are many jobs
ranging from low-skill to high skill, requiring an advanced degree. Since 2000, jobs in
manufacturing for those with graduate degrees have grown by 32 percent while manufacturing
jobs for those with less than a high school diploma have declined by 44 percent between 2000
and 2012 (Levinson, 2017). Men with a lower socioeconomic status tend to work in manual
labor jobs as a means to compensate for the lack of social capital they feel should be afforded to
them as men, which often leads to an educational divide between these low skill men and those
in power (Reed, 2011). Within a wealthy society like the US that shows off military strength,
backbreaking manual labor jobs are no longer needed. In today’s market where interpersonal
skills and intellectual abilities are in high demand, men are not prepared compared to women
(Salzman et al., 2005). Some manufacturing jobs, which do not require a college education are
decreasing and labor-intensive jobs that were once ubiquitous, are moving overseas or becoming
automated. On one hand, men may then be interested in attending college because the
opportunity cost is low but on the other hand, they might not be interested in entering rapidly
growing, female-dominated fields such as nursing. As the number of bachelor’s degrees
awarded to men decline, men without degrees are not setting themselves up to be highly
desirable in the labor market. Instead, they are setting their sights on a shrinking sector that
6
embodies masculinity, rather than growing sectors with enhanced job security. This male trend
can lead to an increased male unemployment rate due to structural unemployment. These
potential implications for labor and marriage markets should be noted for their future impacts on
the economy. The changing opportunity costs of pursuing higher education has provided women
with more freedom of choice than before. Additionally, women’s ability to more easily socially
integrate in college has contributed to this female advantage (Ewert, 2012).
Anticipating the results of my analysis, this study provides evidence that the male shares
of enrollment, applicants, and admissions are all influenced by the characteristics of institutions
of higher learning and that those characteristics are mediated by men’s attitudes toward their own
masculinity. However, the male share of enrollment, manufacturing as a percentage of
employment seems to highly influence male enrollment decision. Other demographic and labor
market variables, such as life expectancy, marriage rate, divorce rate, and earnings given
educational attainment, do not appear to be statistically significant, suggesting that more
attention from researchers is needed specifically on sociological variables to explore the
gendered difference. While the declining share of male enrollment in higher education is far
from being fully understood, this paper empirically explores the general phenomenon and
establishes a framework for the determinants of the gap.
The Gender Gap Background
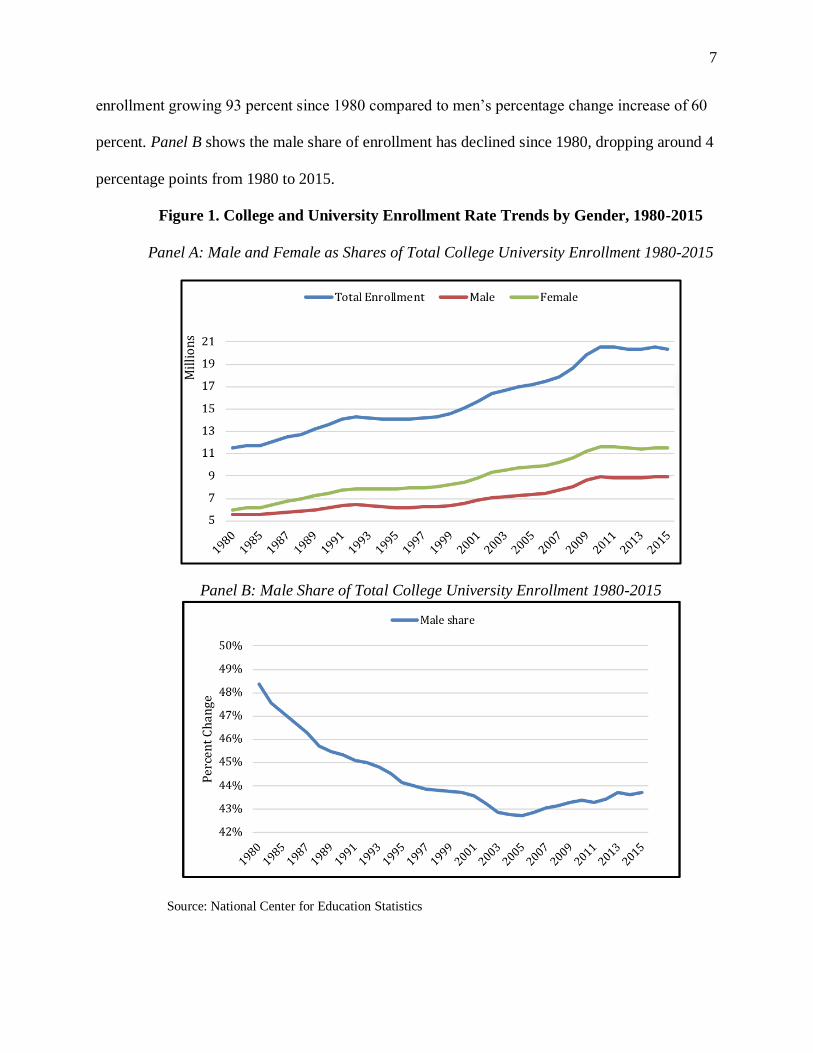
The following figures show how the enrollment numbers and shares of enrollment by
gender have changed from 1980 to 2015 using data from the National Center for Education
Statistics. Panel A in Figure 1 shows that total, male, and female enrollment have increased
overtime but the gap between male and female enrollment has widened, with women’s
7
enrollment growing 93 percent since 1980 compared to men’s percentage change increase of 60
percent. Panel B shows the male share of enrollment has declined since 1980, dropping around 4
percentage points from 1980 to 2015.
Figure 1. College and University Enrollment Rate Trends by Gender, 1980-2015
Panel A: Male and Female as Shares of Total College University Enrollment 1980-2015
Panel B: Male Share of Total College University Enrollment 1980-2015
Source: National Center for Education Statistics
8
In the early 1900s, patriarchal culture in the U.S. emphasized male education, making it
difficult for women to receive higher education and bear children (DiPrete & Buchmann, 2013).
In the 1800.s, schools such as Harvard, Columbia, and Brown allowed women to attend but they
were heavily supervised and classes were segregated (Madigan, 2009). At that time, women were
pushed into one of four main occupations: secretarial, nursing, teaching, or motherhood. Many
women at that time enrolled in single-gender institutions. It was not until 1972, with the passage
of Title IX, that made it illegal for public schools to discriminate based on sex, financial aid,
athletics, and admission practices (Madigan, 2009).
Over time, changing social roles shifted family structures, which altered marriage
expectations, fertility rates, and overall gender relations. In 1960 age at first marriage was 23 for
men and 20 for women and in 2008 the age had increased to 28 for men and 26 for women
(DiPrete & Buchmann, 2013). In 1970, women contributed 2 to 6 percent of family income and
now the American wife contributes 42 percent (Rosin, 2012). As female education increases, it is
associated with a delayed timing of marriage, an increase in age at first marriage, and an overall
higher marriage rate for college-educated women. In Gary Becker’s (1981) microeconomic
theory of family change, he states that the economic division of labor (male breadwinner and the
female caretaker) between a couple contributes to more stability, while the rise of gender
equality in the labor market breaks down this stability resulting in fewer marriages and more
divorces (qtd. in DiPrete & Buchmann, 2013). Given this, the traditional breadwinner husband
model has declined and today, only one in five American families conform to this model
(Boushey 2009, qtd. in DiPrete & Buchmann, 2013). In addition, changing pathways to college
such as the proliferation of two-year institutions, enabled high achieving women to more easily
continue their education. From 1970 to 2007, the number of two-year institutions increased from
9
654 to 1,668 and total enrollment at those schools increased from 2.3 million to 6.6 million
(Flashman, 2013).
By 1960, 65 percent of bachelor’s degrees were earned by men. Women continued to lag
behind male college graduation rates until 1982, and by 2010, women received 57 percent of
bachelor degrees and represented 57 percent of all college students (DiPrete & Buchmann, 2013).
Interestingly, this phenomenon is not unique to the United States. It has occurred internationally,
suggesting that there are structural and social changes occurring globally. These changes could
be related to changing norms of masculinity, structural economic changes in male-dominated
occupations (with lower demand), increased employment opportunities for women, and changes
in gender relations where more women are becoming economically independent. As a country,
the United States has been underperforming in terms of tertiary degrees awarded, compared to
other industrialized countries that have produced more college-educated individuals (DiPrete &
Buchmann, 2013).
The goal of this research is to investigate the determinants of male and female college
enrollment, and men’s declining share of enrollment. Specifically, the question to be explored is
what causes males and female enrollments to differ and what has led to the declining male share
of enrollments from 2000 to present. This question will be addressed by regression analysis that
accounts not only for demographic variables that reflect changing gender relations but also
macroeconomic factors that shape employment opportunities such that labor market effects can
be identified. Integrating multidisciplinary insights can help to paint a more complete portrait of
the factors that have led to declining male share of enrollment than previous studies, and further
contribute to economic and higher educational research.

10
III. Literature Review: Changing Social Norms
Many studies that have investigated declining share of male college enrollment, found
that changing social norms and expectations explained a lot of the gender gap in higher
education. Jennifer Flashman’s (2013) study on cohorts representing the high school graduating
classes of 1972, 1982, and 1992 used three surveys that captured the transition from high school
to postsecondary education, controlling for academic achievement, educational and occupational
expectations, and parental education. She first used a regression analysis to predict logged odds
that an individual attends college, then she added the independent variables in a stepwise fashion.
She found, primarily due to the increased educational opportunity for women coupled with the
dramatic shift in norms and returns to education, that women have changed their decisions in
post-secondary opportunities while men’s decisions have remained relatively constant (Flashman,
2013). Goldin et al. (2006), similarly used three National Longitudinal Survey (1957, 1972,1992)
to evaluate Wisconsin high school seniors’ odds of completing a bachelor’s degree, controlling
for high school rank, achievement, gender, courses, mother’s education, income, race, and
ethnicity. They concluded that due to changing social norms, work expectations, marriage
patterns, contraceptive patterns, and a general leveling of the playing field, women have taken
advantage of increasing returns to education relative to men. They also noted that this has
occurred simultaneously with a slower social development and large behavioral problems for
males. Likewise, Bowen’s et al. (2009) cohort study on public universities used regression
analysis to explore the factors that explained college selectivity at public flagship universities.
The authors controlled for family income, parental education, and academic achievement and
found that substantially more females than males graduated within four years in all racial groups.
They found that the students with low achievement were not due to them being underprepared.
11
The authors suggested that something else was occurring in the education system that their
model could not explain. While these studies controlled for important achievement-predictor
variables, they did not find gender-specific variables or greater labor market variables to inform
their model. Nevertheless, the studies aimed to find important variables that influence college
attendance and they found that women are overachieving compared to men.
However, Stephanie Ewert (2012) used data from the National Education Longitudinal
Study of 1988 on 8,500 students to find the determinants of completing a bachelor’s degree,
given enrollment. Her logistic regression controlled for race, ethnicity, socioeconomic status,
intact families, and high school performance to measure attendance patterns, college major, and
social integration. She found that more women than men who enroll in college, graduate,
primarily because of gendered attendance patterns, social integration, and academic performance
in college. Ewert’s findings showed differing male graduation rates based on gendered
differences in college experience and empirically explored the female advantage in college
graduation. She did not find that women are more likely than men to enroll, but the different
gendered experiences in college contributed to varying rates college completion. While Ewert’s
findings are important, they suggest that gendered variables must be considered in regression
analyses.
Linda Sax and Cassandra Harper (2007) used data from a national longitudinal study
conducted by UCLA on 17,500 students to examine differences between men and women on 19
outcomes of college to see if those differences were due to a pre-college gender gap or due to
different gender experiences in college. They use an ordinary least squares regression analysis to
test these different outcomes against pre-college characteristics, college environments, and
college behaviors. They found that controlling for gender differences could still not explain the
12
differential outcomes and that gender differences observed at the end of college are unrelated to
the college experience itself. Their study suggests that gendered variables are important and that
the gender gap in higher education originates before college in adolescent years.
The above studies and the majority of related studies find that gender differences in pre-
college, college, and social experiences ultimately influence the gender gap in higher education.
What these studies lack, is a comprehensive explanation for why males are not pursuing a
college education in the context of the labor market. While this previous research is important, it
does not truly capture social effects and labor market outcomes that could inform us about the
opportunity costs of male college enrollment. If men are not graduating or even enrolling from
higher education, are they choosing a more direct, lucrative path in the job market? Labor market
factors are important include because they help indicate the health of our economy. My
regression analysis includes institutional variables, labor market variables, and
demographic/social variables that will aim to better predict the declining share of male
enrollment.
Social differences between males and females
Many sociologists and researchers have hypothesized why women are higher performing
in academic settings compared to men. Differences in endocrine functioning are argued to cause
gender differences such as more male aggression, competition and violence while females
exhibit more tenderness and compassion by using different parts of the brain (qtd. in Kimmel &
Messner, 2007). Sociologist Susan Pinker (2008) stated that females are “biologically superior to
males” as an explanation of female rising educational achievement (qtd. in DiPrete & Buchmann,
2013, p. 11). However, biological arguments, once popular in earlier time periods, tend to lack
13
sufficient empirical evidence in current society. Today, sociologists favor the social
constructionist model which refers to the concept that the construction of masculinity is not
trans-historical or universal, but rather that the definitions of masculinity differ by region, time
period, class, and race (Kimmel & Messner, 2007).
Men are also found to be more competitive and involved in athletics, which plays an
influential role in shaping their masculine identities (Morrison and Eardley 1985 qtd. in Kimmel
& Messner, 2007). Blazina and Watkins (Kimmel & Messner, 2007) find that masculine gender
role conflict is related to college male consumption of alcohol. Additionally, higher female life
expectancy suggests a female biological advantage but demands a closer look into changing
trends in gendered social and cultural factors such as behavior and lifestyle (Kimmel & Messner,
2007). Other sociologists support the gender socialization model for explaining educational
attainment, which states that children form their aspirations through interactions with parents,
teachers, and peers. As female educational attainment has risen, the question has become more
about ‘what is wrong with boys’ where conservative commentators who once used biologically
backed theories are now shifting to sociocultural ones (DiPrete & Buchmann, 2013).
Significance to higher education research
Changes in trends such as the college gender gap may signal other changes in society,
politics, or institutions. Higher education is where many individuals develop academic passions
and professional skills. Looking into why college males tend to drop out or choose not to enroll
has many economic implications for the labor market including occupational segregation. Many
view declining male enrollment as a great achievement for women given their historical late start
in higher education. However, any unusual trend such as declining share of male enrollment in
14
college, necessitates an explanation as to why. The importance of higher education relates to the
future of the labor market and the health of the economy. This project explores the determinants
of the declining share of male enrollment, in hopes to gather a better understanding of the recent
trend. Many studies previously mentioned, discuss declining male participation in education
even before college which may suggest improvements to the K-12 system. Exploring current
economic trends alongside higher education data can provide information as to where the
education system (as a function of the economy) may be lacking.
The methodology I adopt to ascertain the determinants of male share of enrollment is an
ordinary least squares regression analysis. I integrate higher education, labor market, and
demographic data into a single panel dataset for the period 1984–2016. I use the male share of
total enrollment in both two and four-year institutions as my dependent variable, and three
categories of independent variables: institutional, labor market, and sociological variables. Using
two different disciplines –sociology and economics – to examine this topic is both powerful and
informative since it utilizes multiple perspectives in hopes to better understand this puzzling
phenomenon.
15
IV. Methodology
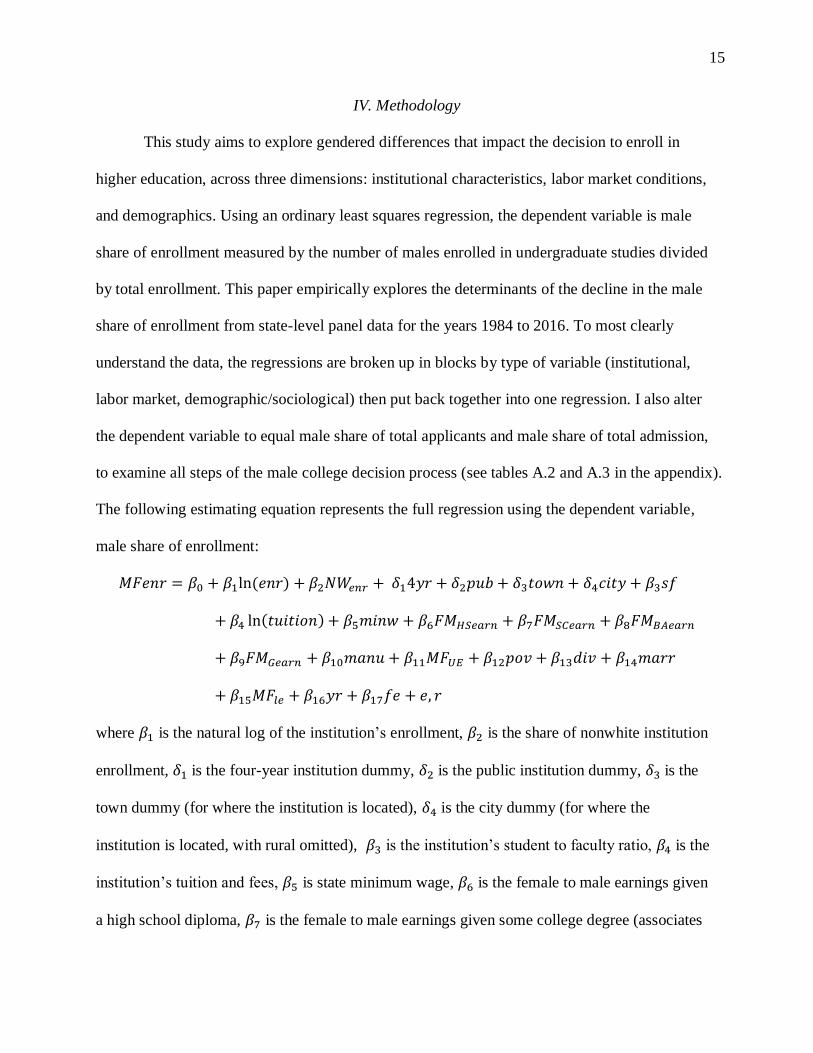
This study aims to explore gendered differences that impact the decision to enroll in
higher education, across three dimensions: institutional characteristics, labor market conditions,
and demographics. Using an ordinary least squares regression, the dependent variable is male
share of enrollment measured by the number of males enrolled in undergraduate studies divided
by total enrollment. This paper empirically explores the determinants of the decline in the male
share of enrollment from state-level panel data for the years 1984 to 2016. To most clearly
understand the data, the regressions are broken up in blocks by type of variable (institutional,
labor market, demographic/sociological) then put back together into one regression. I also alter
the dependent variable to equal male share of total applicants and male share of total admission,
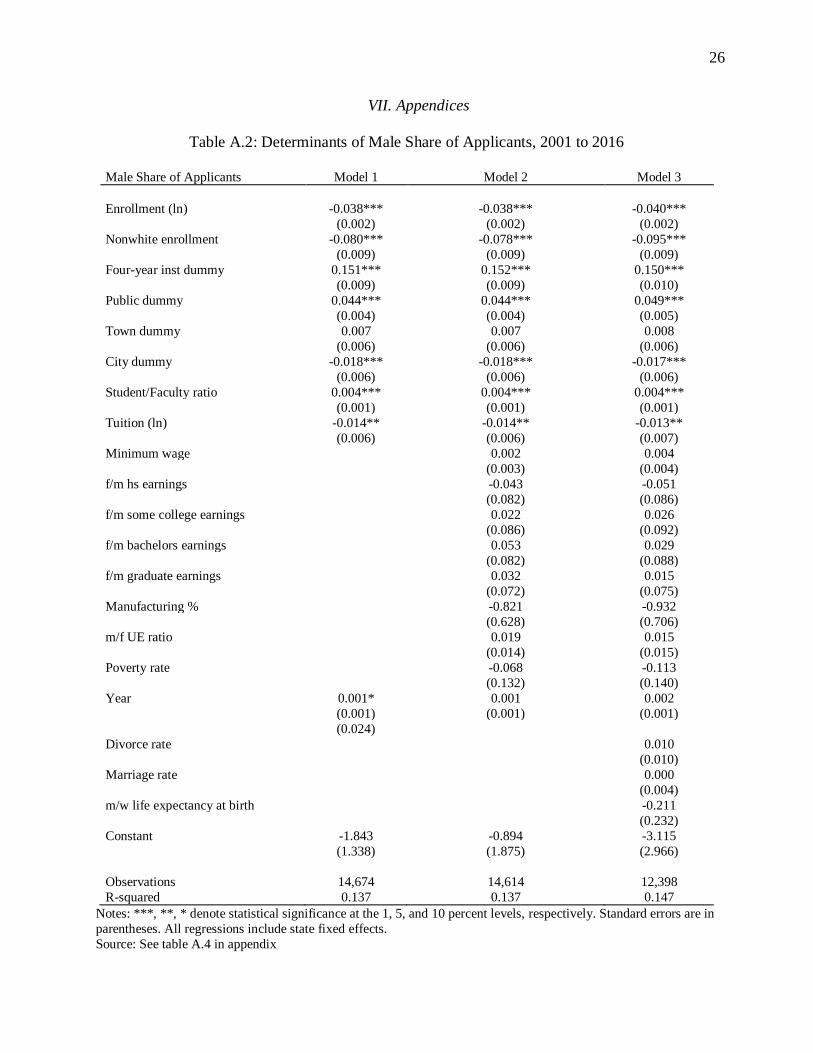
to examine all steps of the male college decision process (see tables A.2 and A.3 in the appendix).
The following estimating equation represents the full regression using the dependent variable,
male share of enrollment:
𝑀𝐹𝑒𝑛𝑟 = 𝛽0 + 𝛽1ln(𝑒𝑛𝑟) + 𝛽2𝑁𝑊𝑒𝑛𝑟 +𝛿14𝑦𝑟 + 𝛿2𝑝𝑢𝑏 + 𝛿3𝑡𝑜𝑤𝑛 + 𝛿4𝑐𝑖𝑡𝑦 + 𝛽3𝑠𝑓
+ 𝛽4 ln(𝑡𝑢𝑖𝑡𝑖𝑜𝑛) + 𝛽5𝑚𝑖𝑛𝑤 + 𝛽6𝐹𝑀𝐻𝑆𝑒𝑎𝑟𝑛 + 𝛽7𝐹𝑀𝑆𝐶𝑒𝑎𝑟𝑛 + 𝛽8𝐹𝑀𝐵𝐴𝑒𝑎𝑟𝑛
+ 𝛽9𝐹𝑀𝐺𝑒𝑎𝑟𝑛 + 𝛽10𝑚𝑎𝑛𝑢 + 𝛽11𝑀𝐹𝑈𝐸 + 𝛽12𝑝𝑜𝑣 + 𝛽13𝑑𝑖𝑣 + 𝛽14𝑚𝑎𝑟𝑟
+ 𝛽15𝑀𝐹𝑙𝑒 + 𝛽16𝑦𝑟 + 𝛽17𝑓𝑒 + 𝑒, 𝑟
where 𝛽1 is the natural log of the institution’s enrollment, 𝛽2 is the share of nonwhite institution
enrollment,𝛿1 is the four-year institution dummy, 𝛿2 is the public institution dummy,𝛿3 is the
town dummy (for where the institution is located), 𝛿4 is the city dummy (for where the
institution is located, with rural omitted), 𝛽3 is the institution’s student to faculty ratio, 𝛽4 is the
institution’s tuition and fees, 𝛽5 is state minimum wage, 𝛽6 is the female to male earnings given
a high school diploma, 𝛽7 is the female to male earnings given some college degree (associates
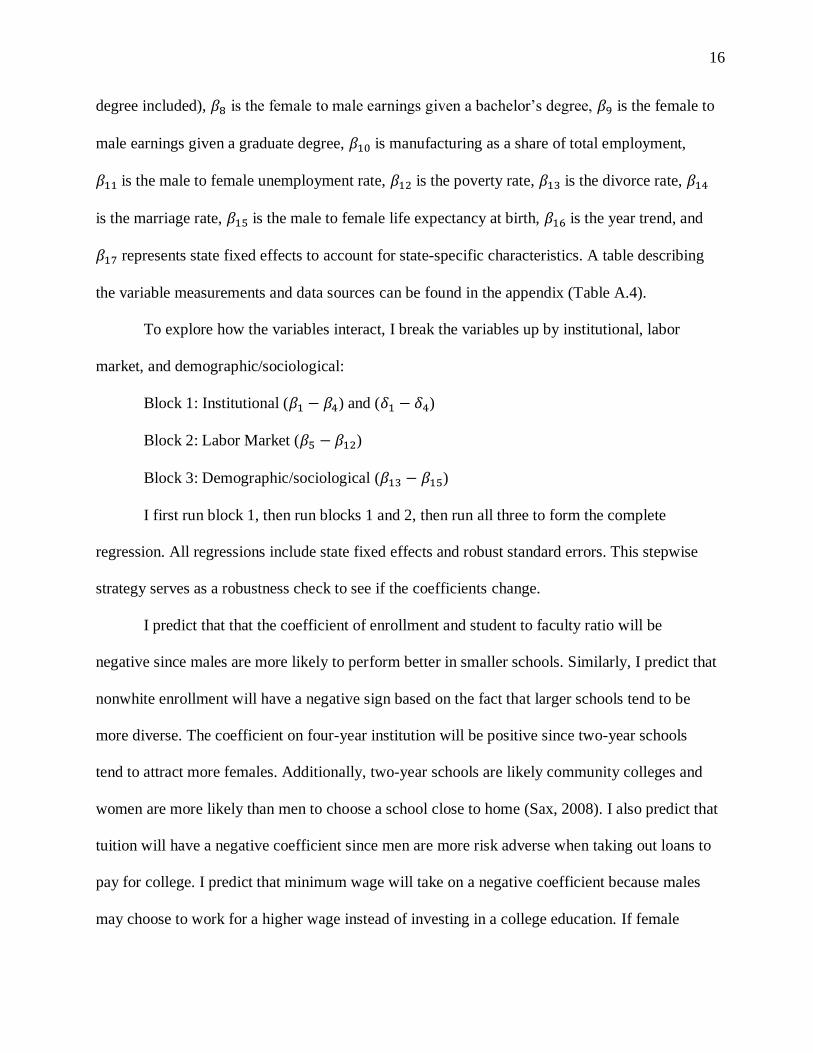
16
degree included), 𝛽8 is the female to male earnings given a bachelor’s degree, 𝛽9 is the female to
male earnings given a graduate degree, 𝛽10 is manufacturing as a share of total employment,
𝛽11is the male to female unemployment rate, 𝛽12 is the poverty rate, 𝛽13 is the divorce rate, 𝛽14
is the marriage rate, 𝛽15 is the male to female life expectancy at birth, 𝛽16 is the year trend, and
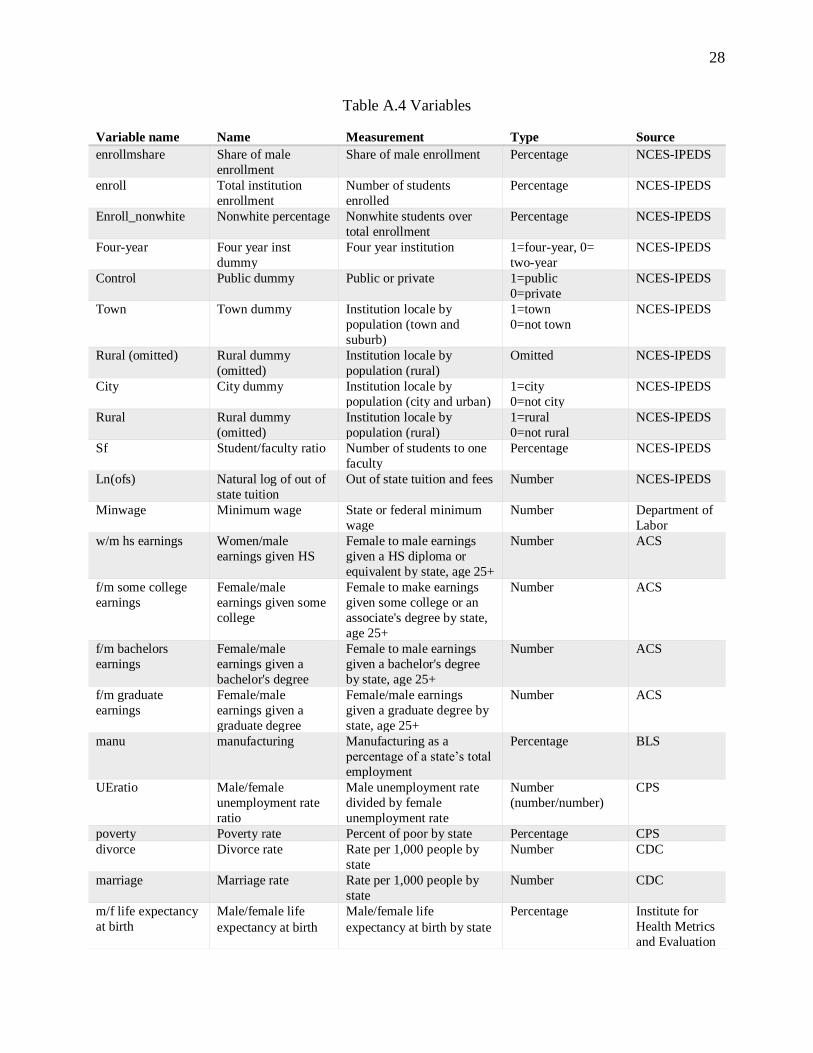
𝛽17 represents state fixed effects to account for state-specific characteristics. A table describing
the variable measurements and data sources can be found in the appendix (Table A.4).
To explore how the variables interact, I break the variables up by institutional, labor
market, and demographic/sociological:
Block 1: Institutional (𝛽1 − 𝛽4) and (𝛿1 − 𝛿4)
Block 2: Labor Market (𝛽5 − 𝛽12)
Block 3: Demographic/sociological (𝛽13 − 𝛽15)
I first run block 1, then run blocks 1 and 2, then run all three to form the complete
regression. All regressions include state fixed effects and robust standard errors. This stepwise
strategy serves as a robustness check to see if the coefficients change.
I predict that that the coefficient of enrollment and student to faculty ratio will be
negative since males are more likely to perform better in smaller schools. Similarly, I predict that
nonwhite enrollment will have a negative sign based on the fact that larger schools tend to be
more diverse. The coefficient on four-year institution will be positive since two-year schools
tend to attract more females. Additionally, two-year schools are likely community colleges and
women are more likely than men to choose a school close to home (Sax, 2008). I also predict that
tuition will have a negative coefficient since men are more risk adverse when taking out loans to
pay for college. I predict that minimum wage will take on a negative coefficient because males
may choose to work for a higher wage instead of investing in a college education. If female
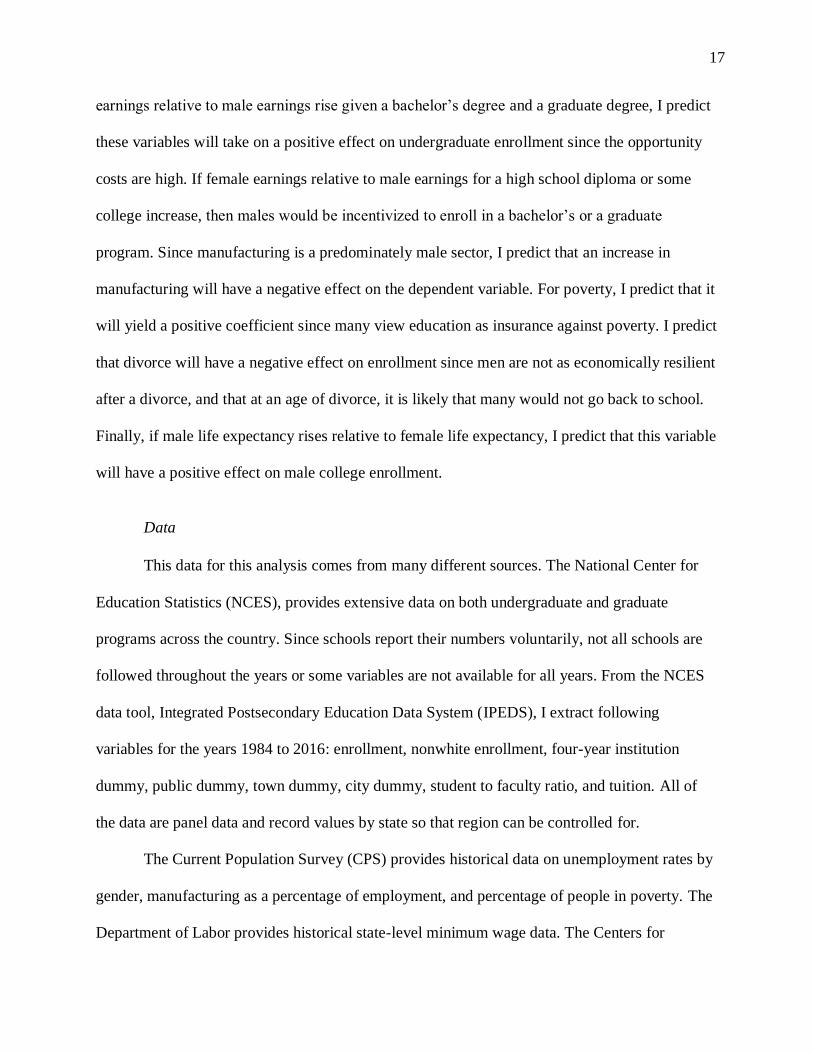
17
earnings relative to male earnings rise given a bachelor’s degree and a graduate degree, I predict
these variables will take on a positive effect on undergraduate enrollment since the opportunity
costs are high. If female earnings relative to male earnings for a high school diploma or some
college increase, then males would be incentivized to enroll in a bachelor’s or a graduate
program. Since manufacturing is a predominately male sector, I predict that an increase in
manufacturing will have a negative effect on the dependent variable. For poverty, I predict that it
will yield a positive coefficient since many view education as insurance against poverty. I predict
that divorce will have a negative effect on enrollment since men are not as economically resilient
after a divorce, and that at an age of divorce, it is likely that many would not go back to school.
Finally, if male life expectancy rises relative to female life expectancy, I predict that this variable
will have a positive effect on male college enrollment.
Data
This data for this analysis comes from many different sources. The National Center for
Education Statistics (NCES), provides extensive data on both undergraduate and graduate
programs across the country. Since schools report their numbers voluntarily, not all schools are
followed throughout the years or some variables are not available for all years. From the NCES
data tool, Integrated Postsecondary Education Data System (IPEDS), I extract following
variables for the years 1984 to 2016: enrollment, nonwhite enrollment, four-year institution
dummy, public dummy, town dummy, city dummy, student to faculty ratio, and tuition. All of
the data are panel data and record values by state so that region can be controlled for.
The Current Population Survey (CPS) provides historical data on unemployment rates by
gender, manufacturing as a percentage of employment, and percentage of people in poverty. The
Department of Labor provides historical state-level minimum wage data. The Centers for
18
Disease Control and Prevention (CDC), provides data on marriage and divorce rates by state per
1,000 people for the years 1990 to 2015. The Institute for Health Metrics and Evaluation
provides data on male and female life expectancy by state from 1985 to 2015. Finally, the
American Community Survey (ACS) provides median earnings by gender for those ages 25 and
over, classified by educational attainment– high school or equivalent, some college or associates
degree, a bachelor’s degree, and a graduate degree. In contrast with most previous studies, I
consider economic opportunity costs as seen by the labor market data as well as the
incorporation of sociological/demographic variables. Including these variables at a state level in
the regression, may suggest other occurring trends that may affect college enrollments.

19
V. Results
Table 1 shows the summary statistics of all the independent variables.
Table 1: Summary Statistics of Key Variables
Source: See table A.4 in appendix
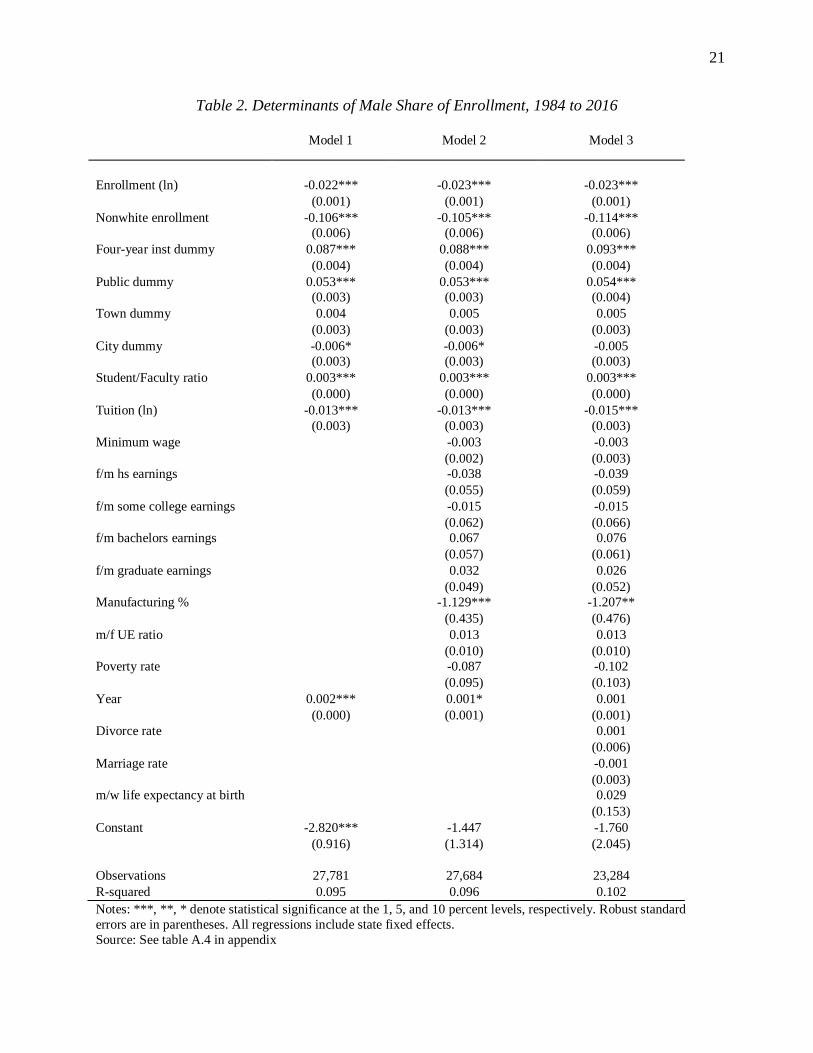
Table 2 presents the results from the linear regression model exploring male share of
college enrollment. The first column represents the regression model that uses the institutional
variables, the second column includes institutional and labor market variables, and the third

20
column represents the regression model with institutional, labor market, and demographic
variables. By including all three columns in the same figure, it serves as a robustness check.
Across all three regressions, the coefficients do not change by a large margin, indicating that
they are robust, or not easily changed by the addition of new variables.
21
Table 2. Determinants of Male Share of Enrollment, 1984 to 2016
Model 1 Model 2 Model 3
Enrollment (ln) -0.022*** -0.023*** -0.023***
(0.001) (0.001) (0.001)
Nonwhite enrollment -0.106*** -0.105*** -0.114***
(0.006) (0.006) (0.006)
Four-year inst dummy 0.087*** 0.088*** 0.093***
(0.004) (0.004) (0.004)
Public dummy 0.053*** 0.053*** 0.054***
(0.003) (0.003) (0.004)
Town dummy 0.004 0.005 0.005
(0.003) (0.003) (0.003)
City dummy -0.006* -0.006* -0.005
(0.003) (0.003) (0.003)
Student/Faculty ratio 0.003*** 0.003*** 0.003***
(0.000) (0.000) (0.000)
Tuition (ln) -0.013*** -0.013*** -0.015***
(0.003) (0.003) (0.003)
Minimum wage -0.003 -0.003
(0.002) (0.003)
f/m hs earnings -0.038 -0.039
(0.055) (0.059)
f/m some college earnings -0.015 -0.015
(0.062) (0.066)
f/m bachelors earnings 0.067 0.076
(0.057) (0.061)
f/m graduate earnings 0.032 0.026
(0.049) (0.052)
Manufacturing % -1.129*** -1.207**
(0.435) (0.476)
m/f UE ratio 0.013 0.013
(0.010) (0.010)
Poverty rate -0.087 -0.102
(0.095) (0.103)
Year 0.002*** 0.001* 0.001
(0.000) (0.001) (0.001)
Divorce rate 0.001
(0.006)
Marriage rate -0.001
(0.003)
m/w life expectancy at birth 0.029
(0.153)
Constant -2.820*** -1.447 -1.760
(0.916) (1.314) (2.045)
Observations 27,781 27,684 23,284
R-squared 0.095 0.096 0.102
Notes: ***, **, * denote statistical significance at the 1, 5, and 10 percent levels, respectively. Robust standard
errors are in parentheses. All regressions include state fixed effects.
Source: See table A.4 in appendix
22
Among the institutional variables, the size of the institution, the share of nonwhite
students, the institution being located in a city, and the cost of tuition and fees all negatively
affect male enrollment. While these variables are statistically significant at the 1 percent level
(except for the city dummy at the 10 percent level), their coefficients are not large enough to
classify them as economically meaningful. However, based on the nonwhite enrollment
coefficient, a one percentage point increase in nonwhite enrollment yields a 10.6 percentage
point decrease in male share of enrollment, which is a large difference for a small institution.
The results indicate that males are also likely to attend a four-year institution relative to a two-
year institution, they are likely to attend a public rather than a private institution, they are likely
to attend a school in a town rather than a rural locale, and they are likely to attend a school with a
larger student to faculty ratio. While only the four-year institution dummy, the public dummy,
and the student to faculty ratio variable are statistically significant at the 1 percent level, they
carry little economic significance.
Next, with the addition of the labor market variables, a rise in minimum wage, a relative
rise in women's earnings given a high school education, a relative rise in women's earnings
relative to some college, and a rise in the poverty rate result in a negative, statistically and
economically insignificant effect on male share of enrollment. Surprisingly, lower male bachelor
and graduate degree earnings as well as the increase in male unemployment do not heavily
influence the model. This could suggest that men are less likely to respond to rising earning
incentives through education. The most interesting, statistically and economically significant
variable is manufacturing as a percentage of total employment. The results indicate that for every
percentage point increase in manufacturing share of state employment, it corresponds with a 113-
percentage point decrease in male share of enrollment. This could suggest that men are
23
particularly attracted to an occupation that generally does not require a bachelor's degree.
However, this trend has more profound effects as more manufacturing-related jobs are
transitioning to overseas locations and are in demand for college-educated individuals.
Finally, with the inclusion of the three demographic variables– divorce rate, marriage rate,
and male to female life expectancy– the coefficients do not fluctuate. While marriage and
divorce rates do not have a statistically or economically significant effect on male enrollment, it
appears that marriage has a negative effect and divorce has a positive effect. However, these
coefficients are incredibly small and close to zero, thus, their true effect is uncertain.
Additionally, as male life expectancy increases relative to female life expectancy at birth, it has a
non-statistically significant effect on male enrollment. All three regressions show that the model
only explains 10 percent of the variation, leaving 90 percent unexplained by these variables.
24
VI. Conclusion
A lower relative share of male college enrollment has raised many concerns, from being
unprepared for the labor market to structural unemployment. Since 1980, the male share of
enrollment has declined which may suggest that with increasing gender equality within all
aspects of society, somehow male identity is being challenged.
This research shows that institutional variables are statistically significant and impact
male college enrollment decisions. For men, they prefer smaller four-year public institutions with
a larger percentage of white students and that are inexpensive. Assuming that larger universities
also have a more diverse student body, it makes sense that more women relative to men attend
since men are more challenged and conflicted by diversity than women (Sax, 2008). It also
seems that men are not heavily influenced by changing relative monetary incentives to higher
education, as seen by the small earnings coefficients given a high school diploma and some
college. I would expect that if men’s earnings relative to women’s earnings is lower given a high
school or some college degree, that men would want to enroll in higher education to increase
their human capital and thus future earnings. However, they are largely persuaded by jobs that
relate to their male identity, as seen by the large negative effect of manufacturing. If men are
accepting low skill jobs in manufacturing and foregoing college all together due to strictly
monetary incentives, it would be interesting to assess the impact of a free tuition policy.
Literature on college debt states that males drop out of college at lower levels of debt compared
to women, where males see education as an impediment rather than a long term investment
(Dwyer et al., 2013). Gendered differences in college enrollment decisions should be noted by all
institutions as most face the problem of the missing male. However, as an education system it
25
may be helpful to pay closer attention to males in K-12 by redefining the discipline system and
providing additional career support.
Given that 90 percent of the phenomenon is left unexplained by the regression analysis,
future studies might consider other gendered variables such as employment sectors, dropout rates,
discipline records, and general social opinions. A more comprehensive understanding of the
underlying causes surrounding this issue is warranted, specifically involving sociological
evidence and variables that reflect gendered behaviors. Due to the evolving and constantly
changing nature of this research, it would be informative to focus future studies over a long-time
span so that variables that are affected by changing norms can be evaluated. Another explanation
for the low R-squared is that the majority of the phenomenon is left empirically inconclusive
simply due to human freedom of choice and thus, remains difficult to quantify. Overall, this
research could benefit from the combination of both qualitative and quantitative data to find a
more accurate explanation of the declining share of male enrollment.
26
VII. Appendices
Table A.2: Determinants of Male Share of Applicants, 2001 to 2016
Male Share of Applicants Model 1 Model 2 Model 3
Enrollment (ln) -0.038*** -0.038*** -0.040***
(0.002) (0.002) (0.002)
Nonwhite enrollment -0.080*** -0.078*** -0.095***
(0.009) (0.009) (0.009)
Four-year inst dummy 0.151*** 0.152*** 0.150***
(0.009) (0.009) (0.010)
Public dummy 0.044*** 0.044*** 0.049***
(0.004) (0.004) (0.005)
Town dummy 0.007 0.007 0.008
(0.006) (0.006) (0.006)
City dummy -0.018*** -0.018*** -0.017***
(0.006) (0.006) (0.006)
Student/Faculty ratio 0.004*** 0.004*** 0.004***
(0.001) (0.001) (0.001)
Tuition (ln) -0.014** -0.014** -0.013**
(0.006) (0.006) (0.007)
Minimum wage 0.002 0.004
(0.003) (0.004)
f/m hs earnings -0.043 -0.051
(0.082) (0.086)
f/m some college earnings 0.022 0.026
(0.086) (0.092)
f/m bachelors earnings 0.053 0.029
(0.082) (0.088)
f/m graduate earnings 0.032 0.015
(0.072) (0.075)
Manufacturing % -0.821 -0.932
(0.628) (0.706)
m/f UE ratio 0.019 0.015
(0.014) (0.015)
Poverty rate -0.068 -0.113
(0.132) (0.140)
Year 0.001* 0.001 0.002
(0.001) (0.001) (0.001)
(0.024)
Divorce rate 0.010
(0.010)
Marriage rate 0.000
(0.004)
m/w life expectancy at birth -0.211
(0.232)
Constant -1.843 -0.894 -3.115
(1.338) (1.875) (2.966)
Observations 14,674 14,614 12,398
R-squared 0.137 0.137 0.147
Notes: ***, **, * denote statistical significance at the 1, 5, and 10 percent levels, respectively. Standard errors are in
parentheses. All regressions include state fixed effects.
Source: See table A.4 in appendix
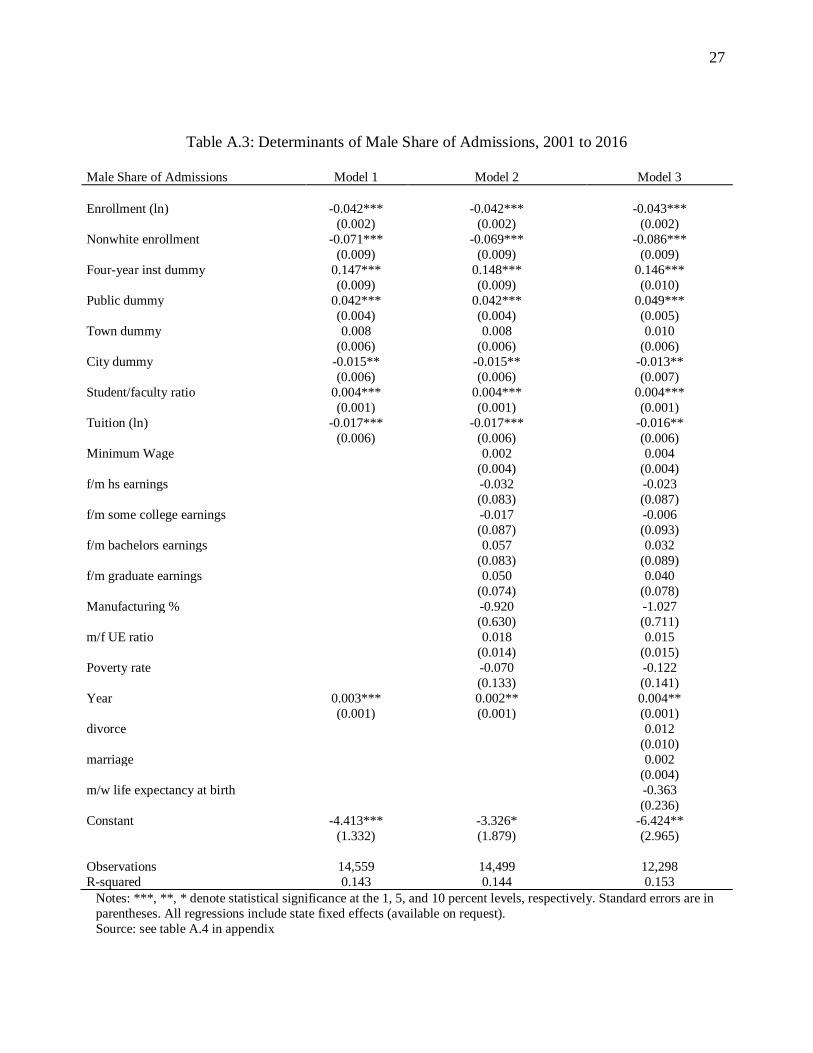
27
Table A.3: Determinants of Male Share of Admissions, 2001 to 2016
Male Share of Admissions Model 1 Model 2 Model 3
Enrollment (ln) -0.042*** -0.042*** -0.043***
(0.002) (0.002) (0.002)
Nonwhite enrollment -0.071*** -0.069*** -0.086***
(0.009) (0.009) (0.009)
Four-year inst dummy 0.147*** 0.148*** 0.146***
(0.009) (0.009) (0.010)
Public dummy 0.042*** 0.042*** 0.049***
(0.004) (0.004) (0.005)
Town dummy 0.008 0.008 0.010
(0.006) (0.006) (0.006)
City dummy -0.015** -0.015** -0.013**
(0.006) (0.006) (0.007)
Student/faculty ratio 0.004*** 0.004*** 0.004***
(0.001) (0.001) (0.001)
Tuition (ln) -0.017*** -0.017*** -0.016**
(0.006) (0.006) (0.006)
Minimum Wage 0.002 0.004
(0.004) (0.004)
f/m hs earnings -0.032 -0.023
(0.083) (0.087)
f/m some college earnings -0.017 -0.006
(0.087) (0.093)
f/m bachelors earnings 0.057 0.032
(0.083) (0.089)
f/m graduate earnings 0.050 0.040
(0.074) (0.078)
Manufacturing % -0.920 -1.027
(0.630) (0.711)
m/f UE ratio 0.018 0.015
(0.014) (0.015)
Poverty rate -0.070 -0.122
(0.133) (0.141)
Year 0.003*** 0.002** 0.004**
(0.001) (0.001) (0.001)
divorce 0.012
(0.010)
marriage 0.002
(0.004)
m/w life expectancy at birth -0.363
(0.236)
Constant -4.413*** -3.326* -6.424**
(1.332) (1.879) (2.965)
Observations 14,559 14,499 12,298
R-squared 0.143 0.144 0.153
Notes: ***, **, * denote statistical significance at the 1, 5, and 10 percent levels, respectively. Standard errors are in
parentheses. All regressions include state fixed effects (available on request).
Source: see table A.4 in appendix
28
Table A.4 Variables
Variable name Name Measurement Type Source
enrollmshare Share of male
enrollment
Share of male enrollment Percentage NCES-IPEDS
enroll Total institution
enrollment
Number of students
enrolled
Percentage NCES-IPEDS
Enroll_nonwhite Nonwhite percentage Nonwhite students over
total enrollment
Percentage NCES-IPEDS
Four-year Four year inst
dummy
Four year institution 1=four-year, 0=
two-year
NCES-IPEDS
Control Public dummy Public or private 1=public
0=private
NCES-IPEDS
Town Town dummy Institution locale by
population (town and
suburb)
1=town
0=not town
NCES-IPEDS
Rural (omitted) Rural dummy
(omitted)
Institution locale by
population (rural)
Omitted NCES-IPEDS
City City dummy Institution locale by
population (city and urban)
1=city
0=not city
NCES-IPEDS
Rural Rural dummy
(omitted)
Institution locale by
population (rural)
1=rural
0=not rural
NCES-IPEDS
Sf Student/faculty ratio Number of students to one
faculty
Percentage NCES-IPEDS
Ln(ofs) Natural log of out of
state tuition
Out of state tuition and fees Number NCES-IPEDS
Minwage Minimum wage State or federal minimum
wage
Number Department of
Labor
w/m hs earnings Women/male
earnings given HS
Female to male earnings
given a HS diploma or
equivalent by state, age 25+
Number ACS
f/m some college
earnings
Female/male
earnings given some
college
Female to make earnings
given some college or an
associate's degree by state,
age 25+
Number
ACS
f/m bachelors
earnings
Female/male
earnings given a
bachelor's degree
Female to male earnings
given a bachelor's degree
by state, age 25+
Number
ACS
f/m graduate
earnings
Female/male
earnings given a
graduate degree
Female/male earnings
given a graduate degree by
state, age 25+
Number
ACS
manu manufacturing Manufacturing as a
percentage of a state’s total
employment
Percentage BLS
UEratio Male/female
unemployment rate
ratio
Male unemployment rate
divided by female
unemployment rate
Number
(number/number)
CPS
poverty Poverty rate Percent of poor by state Percentage CPS
divorce Divorce rate Rate per 1,000 people by
state
Number CDC
marriage Marriage rate Rate per 1,000 people by
state
Number CDC
m/f life expectancy
at birth
Male/female life
expectancy at birth
Male/female life
expectancy at birth by state
Percentage Institute for
Health Metrics
and Evaluation
29
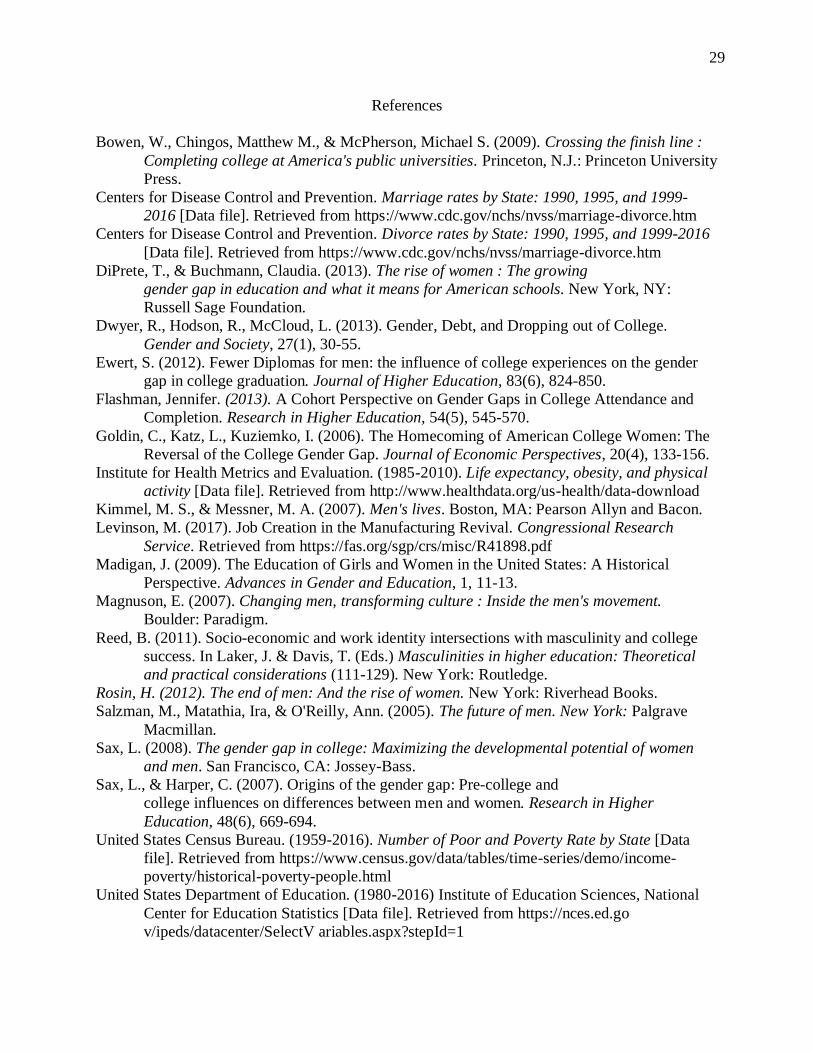
References
Bowen, W., Chingos, Matthew M., & McPherson, Michael S. (2009). Crossing the finish line :
Completing college at America's public universities. Princeton, N.J.: Princeton University
Press.
Centers for Disease Control and Prevention. Marriage rates by State: 1990, 1995, and 1999-
2016 [Data file]. Retrieved from https://www.cdc.gov/nchs/nvss/marriage-divorce.htm
Centers for Disease Control and Prevention. Divorce rates by State: 1990, 1995, and 1999-2016
[Data file]. Retrieved from https://www.cdc.gov/nchs/nvss/marriage-divorce.htm
DiPrete, T., & Buchmann, Claudia. (2013). The rise of women : The growing
gender gap in education and what it means for American schools. New York, NY:
Russell Sage Foundation.
Dwyer, R., Hodson, R., McCloud, L. (2013). Gender, Debt, and Dropping out of College.
Gender and Society, 27(1), 30-55.
Ewert, S. (2012). Fewer Diplomas for men: the influence of college experiences on the gender
gap in college graduation. Journal of Higher Education, 83(6), 824-850.
Flashman, Jennifer. (2013). A Cohort Perspective on Gender Gaps in College Attendance and
Completion. Research in Higher Education, 54(5), 545-570.
Goldin, C., Katz, L., Kuziemko, I. (2006). The Homecoming of American College Women: The
Reversal of the College Gender Gap. Journal of Economic Perspectives, 20(4), 133-156.
Institute for Health Metrics and Evaluation. (1985-2010). Life expectancy, obesity, and physical
activity [Data file]. Retrieved from http://www.healthdata.org/us-health/data-download
Kimmel, M. S., & Messner, M. A. (2007). Men's lives. Boston, MA: Pearson Allyn and Bacon.
Levinson, M. (2017). Job Creation in the Manufacturing Revival. Congressional Research
Service. Retrieved from https://fas.org/sgp/crs/misc/R41898.pdf
Madigan, J. (2009). The Education of Girls and Women in the United States: A Historical
Perspective. Advances in Gender and Education, 1, 11-13.
Magnuson, E. (2007). Changing men, transforming culture : Inside the men's movement.
Boulder: Paradigm.
Reed, B. (2011). Socio-economic and work identity intersections with masculinity and college
success. In Laker, J. & Davis, T. (Eds.) Masculinities in higher education: Theoretical
and practical considerations (111-129). New York: Routledge.
Rosin, H. (2012). The end of men: And the rise of women. New York: Riverhead Books.
Salzman, M., Matathia, Ira, & O'Reilly, Ann. (2005). The future of men. New York: Palgrave
Macmillan.
Sax, L. (2008). The gender gap in college: Maximizing the developmental potential of women
and men. San Francisco, CA: Jossey-Bass.
Sax, L., & Harper, C. (2007). Origins of the gender gap: Pre-college and
college influences on differences between men and women. Research in Higher
Education, 48(6), 669-694.
United States Census Bureau. (1959-2016). Number of Poor and Poverty Rate by State [Data
file]. Retrieved from https://www.census.gov/data/tables/time-series/demo/income-
poverty/historical-poverty-people.html
United States Department of Education. (1980-2016) Institute of Education Sciences, National
Center for Education Statistics [Data file]. Retrieved from https://nces.ed.go
v/ipeds/datacenter/SelectV ariables.aspx?stepId=1
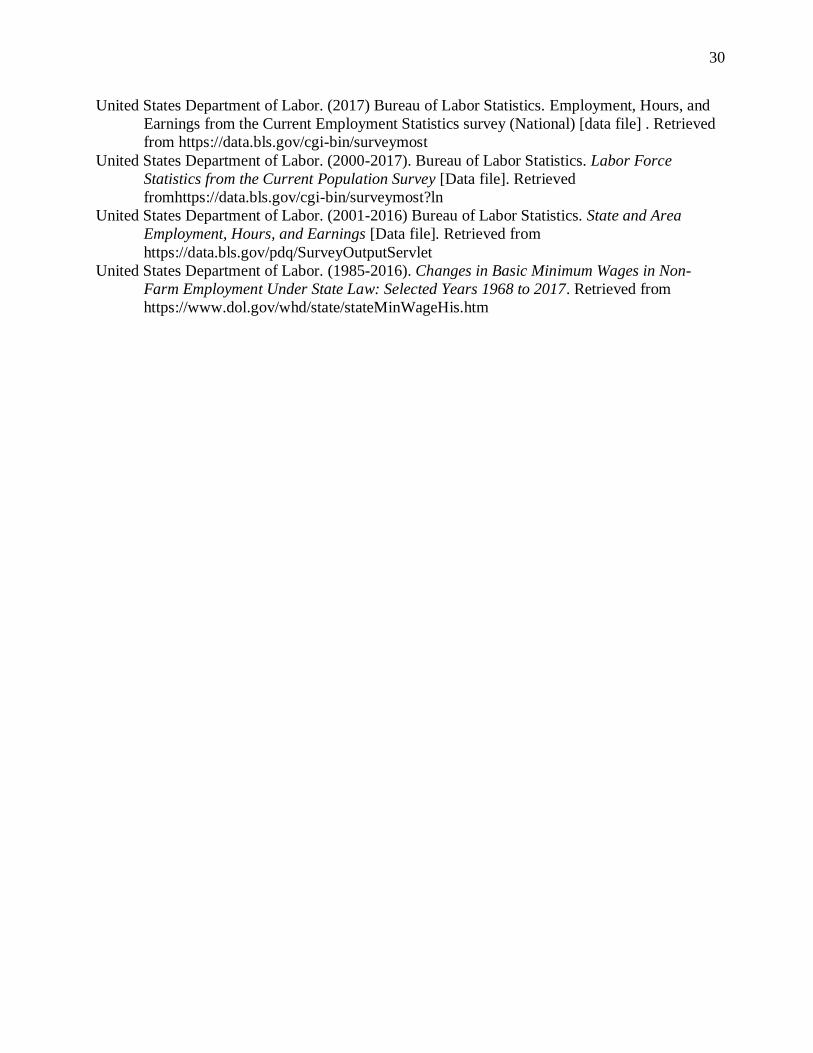
30
United States Department of Labor. (2017) Bureau of Labor Statistics. Employment, Hours, and
Earnings from the Current Employment Statistics survey (National) [data file] . Retrieved
from https://data.bls.gov/cgi-bin/surveymost
United States Department of Labor. (2000-2017). Bureau of Labor Statistics. Labor Force
Statistics from the Current Population Survey [Data file]. Retrieved
fromhttps://data.bls.gov/cgi-bin/surveymost?ln
United States Department of Labor. (2001-2016) Bureau of Labor Statistics. State and Area
Employment, Hours, and Earnings [Data file]. Retrieved from
https://data.bls.gov/pdq/SurveyOutputServlet
United States Department of Labor. (1985-2016). Changes in Basic Minimum Wages in Non-
Farm Employment Under State Law: Selected Years 1968 to 2017. Retrieved from
https://www.dol.gov/whd/state/stateMinWageHis.htm