Embed Size (px)
Citation preview
remote sensing
Article
Exploring the Consistency of Data Collected inArchaeological Geophysics: A Case Study from theIron Age Hillfort of Villasviejas del Tamuja(Extremadura, Spain)
Carmen Pro 1 , Bento Caldeira 2,* , Maria Teresa de Tena 1 , Cristina Charro 3,Rui Jorge Oliveira 2 , José Fernando Borges 2 and Victorino Mayoral 4
1 Centro Universitario de Mérida, Universidad de Extremadura, 06800 Mérida, Spain; [email protected] (C.P.);[email protected] (M.T.d.T.)
2 Departamento de Física da Escola de Ciências e Tecnologia, Instituto de Ciências da Terra (ICT),Universidade de Évora, 7002-554 Évora, Portugal; [email protected] (R.J.O.); [email protected] (J.F.B.)
3 GPEX-Junta de Extremadura, 06800 Mérida, Spain; [email protected] Instituto de Arqueología (CSIC-Junta de Extremadura), 06800 Mérida, Spain; [email protected]* Correspondence: [email protected]
Received: 9 May 2020; Accepted: 15 June 2020; Published: 20 June 2020
Abstract: Different geophysical methods applied at the settlement of Villasviejas del Tamuja (Botija,Spain) have identified robust anomalies located at the same position, but some anomalies arereflected by only one method. Furthermore, analysing the spatial correlation of these anomaliesis of fundamental importance for obtaining a correct archaeological interpretation. In this work,we analysed the main results of electrical resistivity tomography (ERT), ground-penetrating radar(GPR) and magnetic gradiometry methods in a particular area of the archaeological site. In this analysis,we performed graphical and numerical spatial correlation analyses of the anomalies and observedstrong agreement among the results provided by each method. Certain anomalies were reflectedonly in the magnetic and ERT studies. The results highlight the importance of applying severalgeophysical methods and performing spatial correlational analyses. Furthermore, the methodologythat we have applied to evaluate the spatial correlation offers interesting results.
Keywords: archaeological site; geophysical correlation; spatial correlation; electrical tomography;ground penetrating radar; magnetic method
1. Introduction
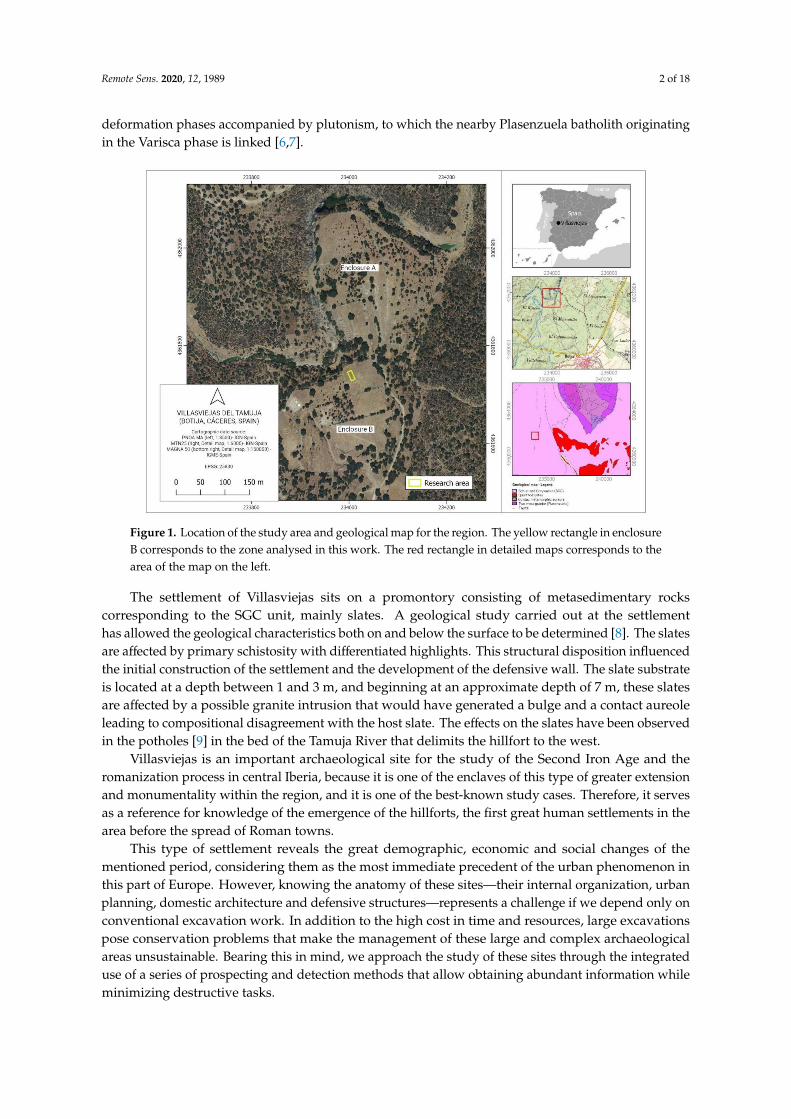
The archaeological site of Villasviejas del Tamuja is located in the municipality of Botija (Provinceof Cáceres, Spain); it is a fortified settlement that was founded at the beginning of the 4th centuryBC, and it remained active until the 1st century BC. Two walled enclosures (A and B in Figure 1)reinforced by artificial ditches and natural defences provided by the Tamuja River and the Verracostream encompass a total area of approximately 7 ha.
From a geological point of view, the study area is part of the domain of vertical folds of theCentral Iberian Zone of the Iberian Massif [1], where the upper Pre-Cambrian successions occupyextensive outcrops. These are metasedimentary series composed of schists and metasandstones,called the Schist–Greywacke Complex (SGC) [2] (Figure 1). The SGC has been divided into differentlithostratigraphic units corresponding to the area of study by the Domo Extremeño Group [3].The sediments are interpreted as having been laid down in submarine fans, slopes and channels [4,5].The series are characterised by low-grade regional metamorphisms and are affected by different
Remote Sens. 2020, 12, 1989; doi:10.3390/rs12121989 www.mdpi.com/journal/remotesensing
Remote Sens. 2020, 12, 1989 2 of 18
deformation phases accompanied by plutonism, to which the nearby Plasenzuela batholith originatingin the Varisca phase is linked [6,7].
Figure 1. Location of the study area and geological map for the region. The yellow rectangle in enclosureB corresponds to the zone analysed in this work. The red rectangle in detailed maps corresponds to thearea of the map on the left.
The settlement of Villasviejas sits on a promontory consisting of metasedimentary rockscorresponding to the SGC unit, mainly slates. A geological study carried out at the settlementhas allowed the geological characteristics both on and below the surface to be determined [8]. The slatesare affected by primary schistosity with differentiated highlights. This structural disposition influencedthe initial construction of the settlement and the development of the defensive wall. The slate substrateis located at a depth between 1 and 3 m, and beginning at an approximate depth of 7 m, these slatesare affected by a possible granite intrusion that would have generated a bulge and a contact aureoleleading to compositional disagreement with the host slate. The effects on the slates have been observedin the potholes [9] in the bed of the Tamuja River that delimits the hillfort to the west.
Villasviejas is an important archaeological site for the study of the Second Iron Age and theromanization process in central Iberia, because it is one of the enclaves of this type of greater extensionand monumentality within the region, and it is one of the best-known study cases. Therefore, it servesas a reference for knowledge of the emergence of the hillforts, the first great human settlements in thearea before the spread of Roman towns.
This type of settlement reveals the great demographic, economic and social changes of thementioned period, considering them as the most immediate precedent of the urban phenomenon inthis part of Europe. However, knowing the anatomy of these sites—their internal organization, urbanplanning, domestic architecture and defensive structures—represents a challenge if we depend only onconventional excavation work. In addition to the high cost in time and resources, large excavationspose conservation problems that make the management of these large and complex archaeologicalareas unsustainable. Bearing this in mind, we approach the study of these sites through the integrateduse of a series of prospecting and detection methods that allow obtaining abundant information whileminimizing destructive tasks.

Remote Sens. 2020, 12, 1989 3 of 18
To understand this spatial organization and diachronic evolution of the hillfort, we carriedout a detailed multidisciplinary study at the settlement that covered the application of geophysicalmethods, geological and archaeological characterization and digital cartographic representation [10].We elaborated LiDAR digital terrain model (DTM) hillshade and simple local relief model (SLRM)derived from the LiDAR DTM (Figure 2). SLRM [11,12] is a trend model useful to enhance the visibilityof small-scale features; Figure 2 shows blue surfaces with a relatively lower position than the onesin red, that show a relatively higher position. Unfortunately, this visualization technique does notdetect any of the structures identified with geophysics. We also used the information provided byprevious excavation efforts (Figure 2) that have been carried out since the mid-19th century by adifferent research team [13] for comparison of the results.
Figure 2. LiDAR digital terrain model (DTM) image of the study area. Photographs (A–C) showexcavated areas, and the red rectangle in enclosure B corresponds to the zone analysed in this work.Images on the right show the research area in an orthophotograph (1), LiDAR DTM hillshade (2) andsimple local relief model (SLRM) derived from the LiDAR DTM (3).
The aim of this paper is to present the results obtained from a detailed study in a particulararea of the archaeological site (Figure 2) by applying electrical resistivity tomography (ERT),ground-penetrating radar (GPR) and magnetic gradiometry methods. The archaeological excavation isstill pending. The study zone covers an area of 20 × 9 m and offers optimal conditions for geophysicalwork, since the topography is smooth, and the terrain is free of brush and obstacles such as trees or largestones. We detailed the geological knowledge of the substrate in this zone to support the interpretationof geophysical methods. Currently, it is very common in archaeological studies to apply severalgeophysical methods to investigate anomalies that correspond to the same structure, because differentmethods may reveal different aspects of the subsurface [14–17]. In this study, we analysed the mainanomalies revealed by each method and evaluated the graphical and numerical spatial correlation.
The application of geophysical methods for mapping cultural remains first emerged in the UnitedStates and United Kingdom between 1920 and 1930, with the use of electrical and magnetic methods [18].These methods have since been widely applied because they allow knowledge of the subsurface to beobtained more quickly than is possible through archaeological excavation, and thus are of great use for
Remote Sens. 2020, 12, 1989 4 of 18
defining the study location and planning all further actions to be performed [19]. Currently, there isa great diversity of geophysical methods that can be applied to an archaeological site, such as GPR,vertical magnetic gradiometry and ERT.
With the emergence of these techniques, it has become possible to gain in-depth knowledge of alocation; however, there has not always been an in-depth study of the acquired data, as these datafrequently show an apparent lack of information. In many cases, this occurs due to a low signal-to-noiseratio. Noise in large quantities masks useful information, resulting in low perceptibility of buriedstructures. Currently, in-depth study using advanced mathematical techniques is a research areathat is undergoing extensive development because of its high applicability in important contextssuch as medical and digital image processing. Even data of very low quality can be used as inputdata to produce images of better quality. Image fusion algorithms are one example of this type ofprocessing [20].
2. Methods
2.1. Magnetic Gradiometry
In magnetic methods, variations in the intensity of the Earth’s magnetic field are measured toprobe the different degrees of magnetization of the materials found in the subsoil. These differences inthe magnetic field depend on both induced and remnant magnetizations. These methods enable theexploration of large surfaces within a relatively short time; but in general, without knowledge of thegeometry, the depth of structures cannot be established with precision. Therefore, such a method issuitable to carry out a general exploration of a site to preliminarily identify the zones of greatest interest.
In this study, we used a Grad601-2 fluxgate gradiometer from Bartington [21,22] in grid modewith an interval of 50 cm between the data lines and 8 observations per meter. The data were initiallyprocessed using Terra Surveyor software to correct errors derived from acquisition, such as stripping(imbalanced between sensors) and staggering (mismatch in horizontal displacements), to performfiltering for the correction of noise problems and other operations such as field transform derivativesto enhance possible alignments. Once the data was exported to a geographic information system (GIS)environment and vector digitized into a polygon geometry, we explored the data distributions andmaximized the detection of traces of archaeological interest.
2.2. Electrical Resistivity Tomography (ERT)
The ERT method, which is based on variations in electrical resistivity, is widely used incharacterizing archaeological sites and geological structures [8,10,23–26].
With the aim of analysing the anomalies revealed by the magnetic method in detail, we carriedout a pseudo three-dimensional (3D) study based on a grid composed of 19 parallel profiles of 20 m inlength and spaced at 0.5 m, with an interval between electrodes of 0.5 m, which yielded results witha satisfactory resolution. The whole area studied was 20 × 9 m, and the greatest depth reached inthe study was 4 m. We used an ABEM Terrameter LS resistivity meter with 42 electrodes and multigradient array. With this configuration, different sets of measurements were performed with the currentand potential electrodes at different locations, enabling very stable field data acquisition with a goodsignal-to-noise ratio [27]. The starting point for each profile was located in the south and the locationsof the sampling points were established by using a differential Global Positioning System (GPS) receiver(Trimble R8) with Real Time Kinematic (RTK) corrections received from the Extremadura PositioningNetwork. The data were georeferenced and processed using the RES2DINV and RES3DINV inversionprograms from GeoTomo Software based on the least-squares method involving the finite-element andfinite-difference methods.
Remote Sens. 2020, 12, 1989 5 of 18
2.3. Ground-Penetrating Radar (GPR)
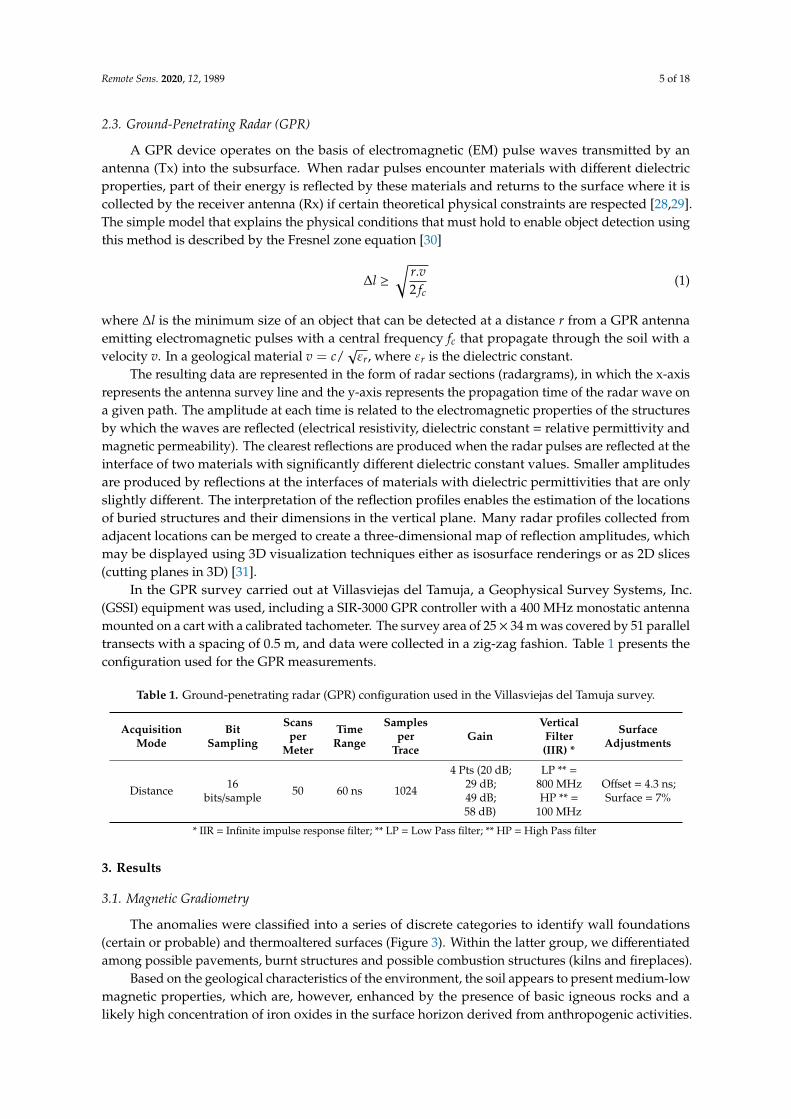
A GPR device operates on the basis of electromagnetic (EM) pulse waves transmitted by anantenna (Tx) into the subsurface. When radar pulses encounter materials with different dielectricproperties, part of their energy is reflected by these materials and returns to the surface where it iscollected by the receiver antenna (Rx) if certain theoretical physical constraints are respected [28,29].The simple model that explains the physical conditions that must hold to enable object detection usingthis method is described by the Fresnel zone equation [30]
∆l ≥√
r.v2 fc
(1)
where ∆l is the minimum size of an object that can be detected at a distance r from a GPR antennaemitting electromagnetic pulses with a central frequency fc that propagate through the soil with avelocity v. In a geological material v = c/
√εr, where εr is the dielectric constant.
The resulting data are represented in the form of radar sections (radargrams), in which the x-axisrepresents the antenna survey line and the y-axis represents the propagation time of the radar wave ona given path. The amplitude at each time is related to the electromagnetic properties of the structuresby which the waves are reflected (electrical resistivity, dielectric constant = relative permittivity andmagnetic permeability). The clearest reflections are produced when the radar pulses are reflected at theinterface of two materials with significantly different dielectric constant values. Smaller amplitudesare produced by reflections at the interfaces of materials with dielectric permittivities that are onlyslightly different. The interpretation of the reflection profiles enables the estimation of the locationsof buried structures and their dimensions in the vertical plane. Many radar profiles collected fromadjacent locations can be merged to create a three-dimensional map of reflection amplitudes, whichmay be displayed using 3D visualization techniques either as isosurface renderings or as 2D slices(cutting planes in 3D) [31].
In the GPR survey carried out at Villasviejas del Tamuja, a Geophysical Survey Systems, Inc.(GSSI) equipment was used, including a SIR-3000 GPR controller with a 400 MHz monostatic antennamounted on a cart with a calibrated tachometer. The survey area of 25× 34 m was covered by 51 paralleltransects with a spacing of 0.5 m, and data were collected in a zig-zag fashion. Table 1 presents theconfiguration used for the GPR measurements.
Table 1. Ground-penetrating radar (GPR) configuration used in the Villasviejas del Tamuja survey.
AcquisitionMode
BitSampling
Scansper
Meter
TimeRange
Samplesper
TraceGain
VerticalFilter(IIR) *
SurfaceAdjustments
Distance 16bits/sample 50 60 ns 1024
4 Pts (20 dB;29 dB;49 dB;58 dB)
LP ** =800 MHzHP ** =
100 MHz
Offset = 4.3 ns;Surface = 7%
* IIR = Infinite impulse response filter; ** LP = Low Pass filter; ** HP = High Pass filter
3. Results
3.1. Magnetic Gradiometry
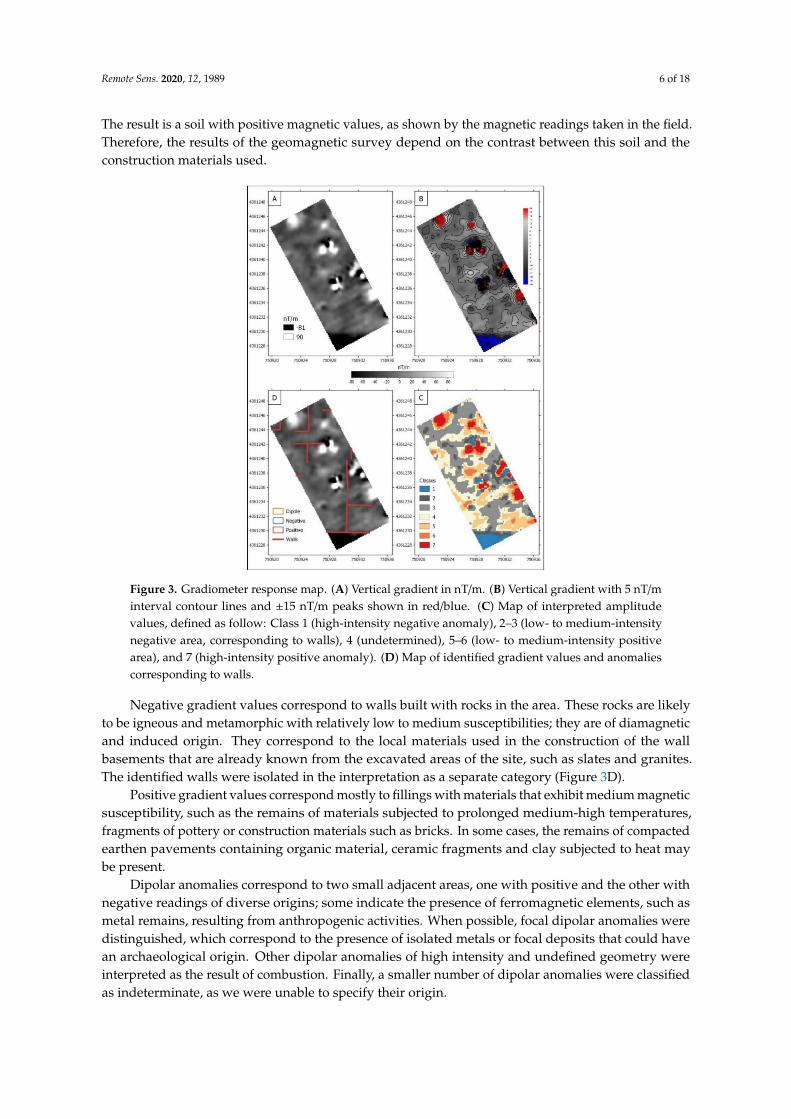
The anomalies were classified into a series of discrete categories to identify wall foundations(certain or probable) and thermoaltered surfaces (Figure 3). Within the latter group, we differentiatedamong possible pavements, burnt structures and possible combustion structures (kilns and fireplaces).
Based on the geological characteristics of the environment, the soil appears to present medium-lowmagnetic properties, which are, however, enhanced by the presence of basic igneous rocks and alikely high concentration of iron oxides in the surface horizon derived from anthropogenic activities.
Remote Sens. 2020, 12, 1989 6 of 18
The result is a soil with positive magnetic values, as shown by the magnetic readings taken in the field.Therefore, the results of the geomagnetic survey depend on the contrast between this soil and theconstruction materials used.
Figure 3. Gradiometer response map. (A) Vertical gradient in nT/m. (B) Vertical gradient with 5 nT/minterval contour lines and ±15 nT/m peaks shown in red/blue. (C) Map of interpreted amplitudevalues, defined as follow: Class 1 (high-intensity negative anomaly), 2–3 (low- to medium-intensitynegative area, corresponding to walls), 4 (undetermined), 5–6 (low- to medium-intensity positivearea), and 7 (high-intensity positive anomaly). (D) Map of identified gradient values and anomaliescorresponding to walls.
Negative gradient values correspond to walls built with rocks in the area. These rocks are likelyto be igneous and metamorphic with relatively low to medium susceptibilities; they are of diamagneticand induced origin. They correspond to the local materials used in the construction of the wallbasements that are already known from the excavated areas of the site, such as slates and granites.The identified walls were isolated in the interpretation as a separate category (Figure 3D).
Positive gradient values correspond mostly to fillings with materials that exhibit medium magneticsusceptibility, such as the remains of materials subjected to prolonged medium-high temperatures,fragments of pottery or construction materials such as bricks. In some cases, the remains of compactedearthen pavements containing organic material, ceramic fragments and clay subjected to heat maybe present.
Dipolar anomalies correspond to two small adjacent areas, one with positive and the other withnegative readings of diverse origins; some indicate the presence of ferromagnetic elements, such asmetal remains, resulting from anthropogenic activities. When possible, focal dipolar anomalies weredistinguished, which correspond to the presence of isolated metals or focal deposits that could havean archaeological origin. Other dipolar anomalies of high intensity and undefined geometry wereinterpreted as the result of combustion. Finally, a smaller number of dipolar anomalies were classifiedas indeterminate, as we were unable to specify their origin.

Remote Sens. 2020, 12, 1989 7 of 18
3.2. Electrical Resistivity Tomography (ERT)
First, we processed each profile separately to identify the main anomalies and study their continuityalong the different profiles; the inversion results had an error of less than 2%. The results are shown inFigure 4, in which three main anomalies that are present in almost all the profiles can be seen. The firstanomaly (A1) has a resistivity of 150 Ωm, is located close to the surface and is approximately 0.5 mwide. Considering that we performed the work in February following rainy days, A1 corresponds tofiller materials (sediments and archaeological deposits) with high water contents. The second anomaly(A2), with a resistivity equal to 700 Ωm, is present in profiles P1, P2, P3, P6 and P7 at a horizontaldistance of 4–7 m from the origin and at a depth between 1 and 2 m. This anomaly is also present inP17 and P18 at 6–10 m from the origin and in P19 at 8–12 m. The third anomaly (A3) has a resistivity of900–1000 Ωm and appears in P4, P5, P14, P15 and P16. The position and dimensions of this anomalyare similar to those of A2; hence these anomalies could belong to the same structure. Another anomalywith lower resistivity values than the surrounding medium, called A4, is present in the P5–P13 profiles,more clearly evident in the results from the 3D study.
Figure 4. Left: locations of the profiles in the grid (the red arrows point towards the end). Right:resistivity distribution obtained via inversion for each profile. A1, A2, A3 and A4 are the main anomaliesrelated to archaeological structures. In each plot, the horizontal axis represents the distances (in m)from the origin point, and the vertical axis represents the depth (in m) from the surface.
Remote Sens. 2020, 12, 1989 8 of 18
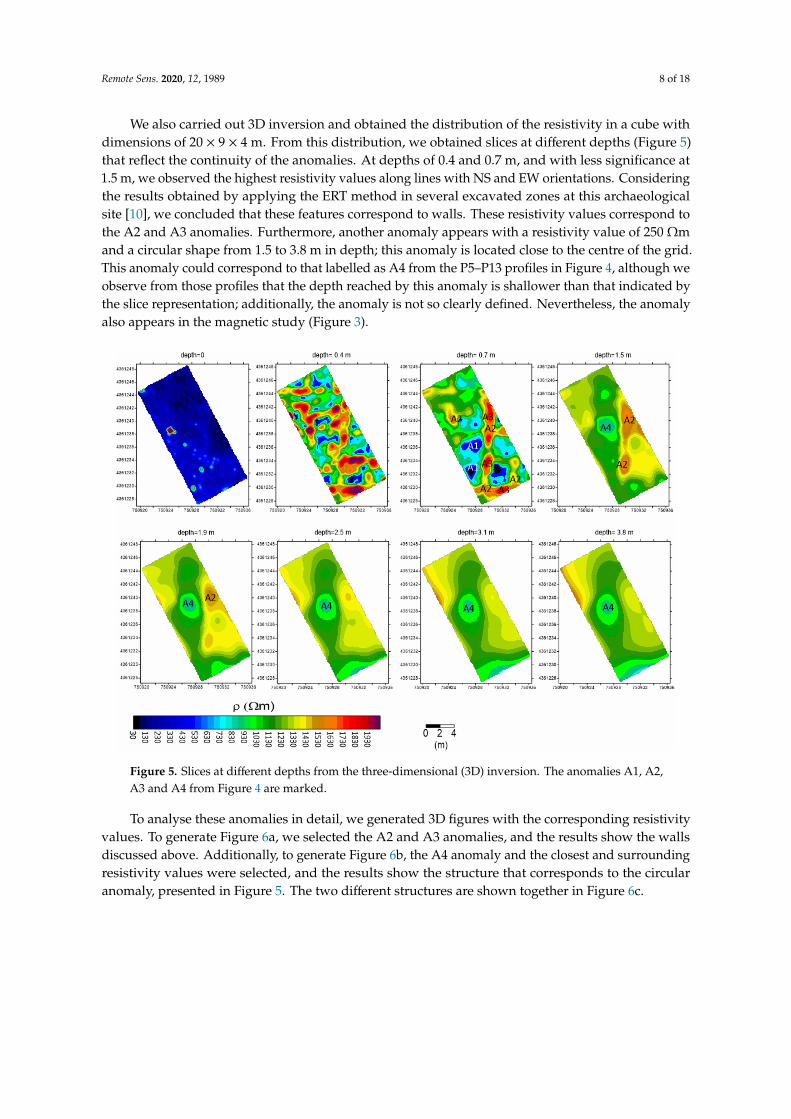
We also carried out 3D inversion and obtained the distribution of the resistivity in a cube withdimensions of 20 × 9 × 4 m. From this distribution, we obtained slices at different depths (Figure 5)that reflect the continuity of the anomalies. At depths of 0.4 and 0.7 m, and with less significance at1.5 m, we observed the highest resistivity values along lines with NS and EW orientations. Consideringthe results obtained by applying the ERT method in several excavated zones at this archaeologicalsite [10], we concluded that these features correspond to walls. These resistivity values correspond tothe A2 and A3 anomalies. Furthermore, another anomaly appears with a resistivity value of 250 Ωmand a circular shape from 1.5 to 3.8 m in depth; this anomaly is located close to the centre of the grid.This anomaly could correspond to that labelled as A4 from the P5–P13 profiles in Figure 4, although weobserve from those profiles that the depth reached by this anomaly is shallower than that indicated bythe slice representation; additionally, the anomaly is not so clearly defined. Nevertheless, the anomalyalso appears in the magnetic study (Figure 3).
Figure 5. Slices at different depths from the three-dimensional (3D) inversion. The anomalies A1, A2,A3 and A4 from Figure 4 are marked.
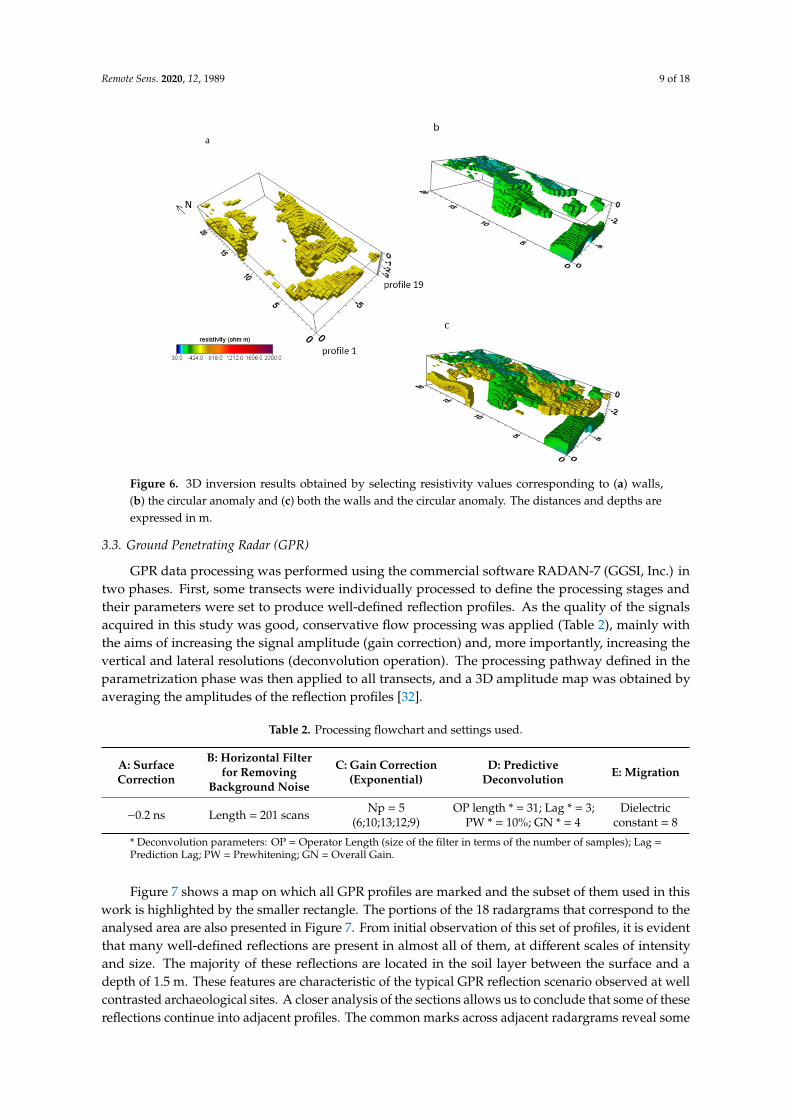
To analyse these anomalies in detail, we generated 3D figures with the corresponding resistivityvalues. To generate Figure 6a, we selected the A2 and A3 anomalies, and the results show the wallsdiscussed above. Additionally, to generate Figure 6b, the A4 anomaly and the closest and surroundingresistivity values were selected, and the results show the structure that corresponds to the circularanomaly, presented in Figure 5. The two different structures are shown together in Figure 6c.
Remote Sens. 2020, 12, 1989 9 of 18
Figure 6. 3D inversion results obtained by selecting resistivity values corresponding to (a) walls,(b) the circular anomaly and (c) both the walls and the circular anomaly. The distances and depths areexpressed in m.
3.3. Ground Penetrating Radar (GPR)
GPR data processing was performed using the commercial software RADAN-7 (GGSI, Inc.) intwo phases. First, some transects were individually processed to define the processing stages andtheir parameters were set to produce well-defined reflection profiles. As the quality of the signalsacquired in this study was good, conservative flow processing was applied (Table 2), mainly withthe aims of increasing the signal amplitude (gain correction) and, more importantly, increasing thevertical and lateral resolutions (deconvolution operation). The processing pathway defined in theparametrization phase was then applied to all transects, and a 3D amplitude map was obtained byaveraging the amplitudes of the reflection profiles [32].
Table 2. Processing flowchart and settings used.
A: SurfaceCorrection
B: Horizontal Filterfor Removing
Background Noise
C: Gain Correction(Exponential)
D: PredictiveDeconvolution E: Migration
−0.2 ns Length = 201 scans Np = 5(6;10;13;12;9)
OP length * = 31; Lag * = 3;PW * = 10%; GN * = 4
Dielectricconstant = 8
* Deconvolution parameters: OP = Operator Length (size of the filter in terms of the number of samples); Lag =Prediction Lag; PW = Prewhitening; GN = Overall Gain.
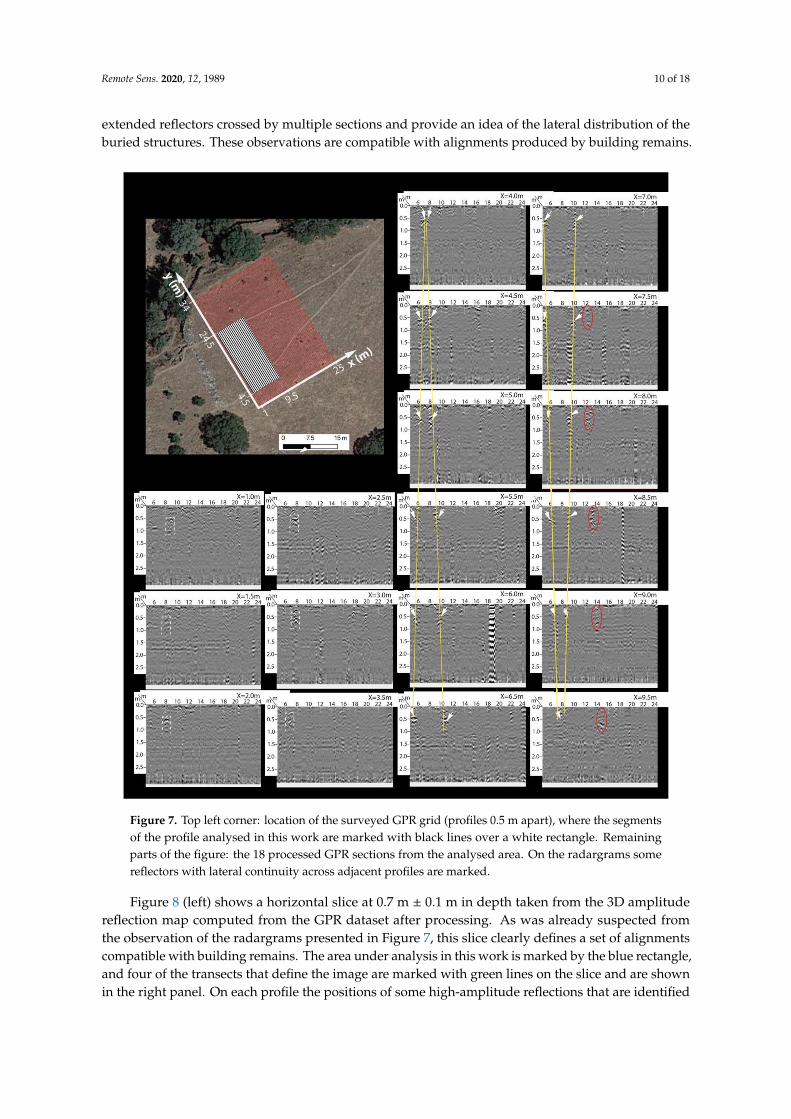
Figure 7 shows a map on which all GPR profiles are marked and the subset of them used in thiswork is highlighted by the smaller rectangle. The portions of the 18 radargrams that correspond to theanalysed area are also presented in Figure 7. From initial observation of this set of profiles, it is evidentthat many well-defined reflections are present in almost all of them, at different scales of intensityand size. The majority of these reflections are located in the soil layer between the surface and adepth of 1.5 m. These features are characteristic of the typical GPR reflection scenario observed at wellcontrasted archaeological sites. A closer analysis of the sections allows us to conclude that some of thesereflections continue into adjacent profiles. The common marks across adjacent radargrams reveal some
Remote Sens. 2020, 12, 1989 10 of 18
extended reflectors crossed by multiple sections and provide an idea of the lateral distribution of theburied structures. These observations are compatible with alignments produced by building remains.
Figure 7. Top left corner: location of the surveyed GPR grid (profiles 0.5 m apart), where the segmentsof the profile analysed in this work are marked with black lines over a white rectangle. Remainingparts of the figure: the 18 processed GPR sections from the analysed area. On the radargrams somereflectors with lateral continuity across adjacent profiles are marked.
Figure 8 (left) shows a horizontal slice at 0.7 m ± 0.1 m in depth taken from the 3D amplitudereflection map computed from the GPR dataset after processing. As was already suspected fromthe observation of the radargrams presented in Figure 7, this slice clearly defines a set of alignmentscompatible with building remains. The area under analysis in this work is marked by the blue rectangle,and four of the transects that define the image are marked with green lines on the slice and are shownin the right panel. On each profile the positions of some high-amplitude reflections that are identified

Remote Sens. 2020, 12, 1989 11 of 18
on the related transects are indicated. We note that the perturbations in the travel time caused bytopographic variations are very small (~1) and do not need correction.
Figure 8. The left panel shows a horizontal slice of the 3D model cut at a depth of 0.7 ± 0.1 m, on whichthe traces corresponding to the four GPR sections shown in the right panel are marked with greenlines. Along each trace, coloured rectangular outlines indicate the higher-amplitude positions that aremarked on the radargrams with similar coloured rectangular outlines. The light grey strip drawn overeach radargram represents the source region of the data that define the horizontal slice.
The 3D amplitude map computed with RADAN-7 was exported in ASCII format using arectangular grid with mesh dimensions of dx = 0.2 m, dy = 0.06 m and dz = 0.1 m. This process wasaccomplished by resampling the image to obtain a cubic mesh of square cells with edges of 0.15 m andapplying 3D median filtering to obtain similar spatial frequency content.
A two-fold approach for visualizing the 3D GPR results was used. First, a 3D image of thereflecting objects was obtained by rendering a selected amplitude range and assigning transparency tothe remaining amplitudes (Figure 9). In the second step, horizontal slices of the absolute amplitude,corresponding to stacking of the energy at a depth of Z ± 0.1 m, were represented using the same gridcell sizes (dx and dy). Figure 10 displays six of these horizontal cuts from depths that coincide with theERT model.
Figure 9. 3D image of the reflecting objects that correspond to walls.

Remote Sens. 2020, 12, 1989 12 of 18
Figure 10. GPR slices from the same depths considered in the electrical resistivity tomography (ERT)study (Figure 5).
3.4. Anomaly Correlation
The relative effectiveness of the three geophysical methods used in this case can be determinedin a decisive way based on the characteristics of the features that are the target of the exploration.This approach refers to the archaeological stratification (thicknesses and types of sediments) and to thedepth and composition of the structures. Regarding the former, the investigated area shows increasingsedimentation in the S-N direction due to the steep slope towards the boundary of the walled enclosure.However, the volume of sediments is generally small and decreases towards the southern part of thearea. The fill that covers the spaces between the structures has a clear signal since the building materialof the walls is mostly mud bricks and rammed earth. In general, the foundations of the structureswere built by means of stone masonry using local materials (slates). Since the foundations appear atvery shallow depths (sometimes only approximately 20 cm from the surface), they show the maximalcontrast with the surrounding materials. For this reason, although the area has not been excavated,we can obtain information about the structures that are present.
As noted previously, we observed two different types of anomalies by applying the ERT method,one corresponding to walls, and the other corresponding to a circular structure. As the magnetic andGPR methods also both reveal clear anomalies corresponding to walls, we performed a correlationanalysis only for this anomaly type. In particular, we conducted the analysis based on the resultscorresponding to a depth of 0.7 m because at this depth, the anomalies are best revealed.
Figure 11 shows the anomaly distribution obtained from the magnetic method (Figure 11a), ERT(Figure 11b) and GPR (Figure 11c) at a depth of 0.7 m. We observe that although the anomaliescorresponding to walls are clearly detected by all three methods, the locations and dimensions are notshown as clearly by the magnetic method as by the other methods. In general, we observe that thezones that are devoid of anomalies coincide among the three methods, but some elements that areevident in the results of one method do not appear in the others. For that reason, to conduct a detailedanalysis of the results, we carried out a spatial correlation analysis.

Remote Sens. 2020, 12, 1989 13 of 18
Figure 11. Anomalies from (a) the magnetic method, (b) ERT and (c) GPR at a depth of 0.7 m.
First, we isolated the anomalies corresponding to walls (Figure 12) from each set of data usingthe same grid spacing and the same number of nodes (a total of 5865). Then, we developed a binarysystem by assigning a value of 1 to the nodes where anomalies were observed and a value of 0 to therest to allow a numerical correlation analysis to be carried out by multiplying these values. In this way,at nodes where an anomaly is present, we obtained a value of 1, and otherwise, we obtained a valueof 0.
Figure 12. Selection of the anomalies corresponding to walls from the results of the magnetic method,ERT and GPR.
We also calculated the corresponding values of the Pearson correlation coefficient (Table 3), whichmeasures the statistical relationship between two variables. In particular, this coefficient is appropriatefor geophysical studies applied in archaeology to identify any correlations existing between datasets
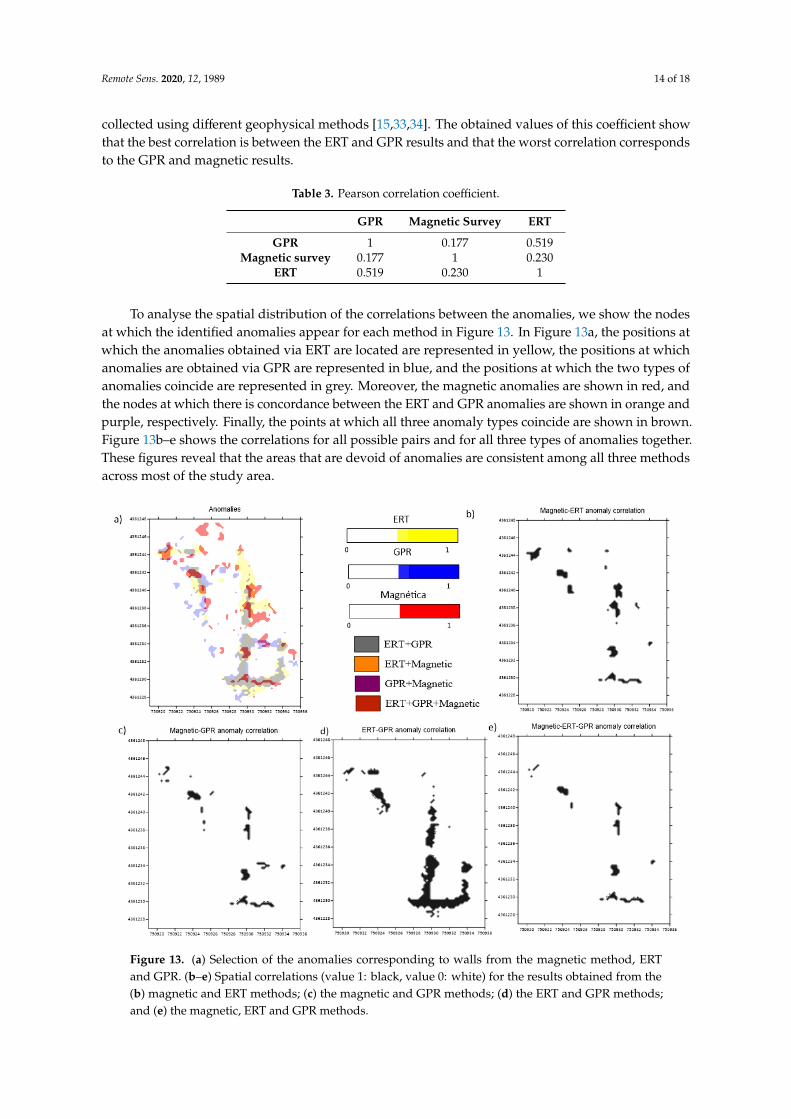
Remote Sens. 2020, 12, 1989 14 of 18
collected using different geophysical methods [15,33,34]. The obtained values of this coefficient showthat the best correlation is between the ERT and GPR results and that the worst correlation correspondsto the GPR and magnetic results.
Table 3. Pearson correlation coefficient.
GPR Magnetic Survey ERT
GPR 1 0.177 0.519Magnetic survey 0.177 1 0.230
ERT 0.519 0.230 1
To analyse the spatial distribution of the correlations between the anomalies, we show the nodesat which the identified anomalies appear for each method in Figure 13. In Figure 13a, the positions atwhich the anomalies obtained via ERT are located are represented in yellow, the positions at whichanomalies are obtained via GPR are represented in blue, and the positions at which the two types ofanomalies coincide are represented in grey. Moreover, the magnetic anomalies are shown in red, andthe nodes at which there is concordance between the ERT and GPR anomalies are shown in orange andpurple, respectively. Finally, the points at which all three anomaly types coincide are shown in brown.Figure 13b–e shows the correlations for all possible pairs and for all three types of anomalies together.These figures reveal that the areas that are devoid of anomalies are consistent among all three methodsacross most of the study area.
Figure 13. (a) Selection of the anomalies corresponding to walls from the magnetic method, ERTand GPR. (b–e) Spatial correlations (value 1: black, value 0: white) for the results obtained from the(b) magnetic and ERT methods; (c) the magnetic and GPR methods; (d) the ERT and GPR methods;and (e) the magnetic, ERT and GPR methods.

Remote Sens. 2020, 12, 1989 15 of 18
We also calculated the percentages of the nodes for which the different types of anomaliescoincided (Table 4). These results are fundamentally the same as those shown in Figure 13, with thebest correlation being between the ERT and GPR approaches; however, the specific values allow us toquantitatively compare the areas of coincidence.
Table 4. Percentage of spatial coincidence.
GPR–ERT Magnetic–ERT Magnetic–GPR GPR–ERT–Magnetic
5.6% 2.3% 1.8% 1.4%
4. Discussion
Although the archaeological exploration of Villasviejas dates back to the mid-19th century, thesystematic research that began in the 1970s allowed discovery of the remains of many buildingstructures. The excavation findings served as useful references to test the validity of the survey results(the area studied in this work has not yet been excavated). A clear coincidence was observed regardingthe shape and orientation. Additionally, results from magnetic survey next to excavated areas allowedus to roughly assign the ranges of geomagnetic survey values corresponding to these structures.These clear results, in combination with the high contrast of the ERT and GPR data, made it possible togo beyond a mere quantitative correlation between data from different methods and provided someclues regarding the structures identified.
It is clear that in general, the three geophysical methods used in the study area offer a fairly goodcomparison for the identification of archaeological targets. Notably, as has been shown by the resultsof the quoted excavations in other areas at the archaeological site, most of the wall foundations arevery shallow, sometimes almost at the surface. Hence, there is no attenuation of the sensor response.Additionally, the building technique used for the structures, which consist of drystone foundationsas a basement for walls made of earth, helps to facilitate anomaly detection. When these structurescollapse, the filling deposits within the rooms are very clean stone blocks, resulting in a very “clean”and homogeneous sensor response.
From the graphical and numerical correlations among the three types of anomalies, we observethat the spatial concordance of the three methods is poor: the greatest coincidence is found for theGPR and ERT results, with the greatest area of positive correlation. This result is also supported by thePearson coefficients, for which the highest value corresponds to the ERT and GPR results (Table 3).Similar results were obtained by Kvamme [15] on the basis of the local Pearson coefficients in smallneighbourhoods; however, this author obtained a better correlation for the magnetic and GPR resultsthan for the magnetic and ERT anomalies. Meanwhile, in this work, we found that the magnetic resultsbest match the ERT results (Table 3 and Figure 13).
Moreover, Figure 13a indicates that the areas that are devoid of anomalies are in agreement amongthe different methods, except in the northern part of the study area, where only the magnetic methodseems to reflect a structure. The same results are shown in detail in Figure 13b–e, where we alsoobserve a correlation for zones without robust anomalies.
Therefore, the visual impression, which is confirmed by statistical validation, suggests that whilethe magnetic method can record subtle variations in the composition of buried deposits, ERT and GPRcan reveal high-definition anomalies corresponding to structures.
The cylindrical anomaly revealed by the ERT data is not seen in the GPR data, probably becausethe corresponding resistivity is lower than the resistivity of the walls; only a small discrepancy withthe surrounding materials is observed, and this difference is difficult to detect with certain methods.Considering the topographic setting of the building, which is on a steep slope facing the walledenclosure of the settlement, it is possible that the hillfort could have a terraced surface with a levelbelow the ground. The artificial division of the rooms in the deep ERT readings supports this idea.In this context, this anomaly could correspond to a cylindrical structure designed for storage or a pit
Remote Sens. 2020, 12, 1989 16 of 18
excavated in the bedrock. Bearing in mind that the ERT study was carried out in February after rainydays, this structure would be occupied by sediments with a high water-content and therefore displaya low electrical resistivity. The magnetic data also show this structure, which appears as a positiveanomaly, corresponding to the filling materials.
5. Conclusions
We analysed the results obtained by applying magnetic, GPR and ERT survey methods overan area with dimensions of 20 × 9 m. These three methods reveal the main anomalies, but weobserve that some structures are not reflected by all of these methods. This finding reveals theimportance of applying different geophysical methods to enable a complete interpretation of anomalies.With magnetic gradiometry, it is possible to cover a wide area within a short time, thereby obtainingthe general locations of the main anomalies with variations in details based on depth. The ERT methodcan yield detailed images (2D and 3D) of the structures, although the field work for this method takesa long time. Finally, the GPR method is quick to implement in the field and provides 2D and 3Dunderground images, but it does not reflect structures with low electrical resistivity values. Regardingthe duration of the acquisition work, in this study, the ERT method took approximately eight hours,the geomagnetic survey of the studied area took less than 20 minutes as part of a larger survey carriedout in a 20 × 20 m grid that covered a broader extent of enclosure B and the GPR method requiredroughly the same time investment as the geomagnetic measurements.
In this work, we developed a methodology for analysing spatial correlations by selecting the mainanomalies and using a binary system to assign a specific value to the points at which they are observed.As a result, we found that the ERT and GPR methods showed the best correlation, followed by the ERTand magnetic methods and, finally, the magnetic and GPR methods. These results were consistentwith the values obtained for the Pearson correlation coefficient. We obtained numerical correlations ata particular depth, but data from different depths could be analysed in a similar way.
This study finds that spatial correlations are of fundamental importance for quantifying therelationships between the results obtained in multi-method studies and that correlation analyses mustbe carried out not only in a graphical way but also by applying a quantitative methodology.
Furthermore, we observe that the Pearson coefficient is an effective tool for investigating thecorrelations of geophysical anomalies, and it offers information about global correlation. To comparethe spatial coincidence of the anomalies revealed by different methods, it is necessary to perform aquantitative correlation.
In addition, the results support the claim that the methodology that we have developed to quantifyspatial correlations is suitable and clearly reflects the areas of coincidence of the anomalies identifiedusing different methods.
Regarding the archaeological model of the site, the study area is part of a larger building with anN-S orientation in which we identified a central hall or distributor space of 15 × 6 m, surrounded by aseries of rooms, some with internal subdivisions. The regular plan of the building, with a tripartitedivision centred on an axial corridor, offers close analogies with architectonic models of Roman/Italicorigin. It fits very well with the early Roman chronology of the last occupation of the site, which issuspected to correspond to a military garrison during the Sertorian War (82–72 BC).
The ERT data indicate that the distributor space has a remarkable stratigraphic depth, detectingan anomaly of low resistivity that reveals a structure that reaches a depth of 2 m, which could berelated to food storage and conservation. To the south, the area is delimited by the closing wall ofthe complex, probably built with slate basements and mud-brick walls, like the rest of the buildingsalready known. The magnetic and ERT data are highly consistent with the wall alignment present inother constructions that were found in excavated areas of the settlement. Regarding the roof, duringprevious archaeological surveys in this sector, several fragments of roof tiles and ceramic buildingmaterial were recorded, including some tegulae raised flanges. These may be part of the areas ofpositive values obtained from the magnetic survey, corresponding to the roof collapse.
Remote Sens. 2020, 12, 1989 17 of 18
Author Contributions: Conceptualization, C.P., M.T.d.T. and V.M.; methodology, C.P., B.C., R.J.O., C.C. and J.F.B.;software: C.P., B.C., C.C. and R.J.O.; validation, C.P. and B.C.; formal analysis, C.P. and B.C.; investigation. C.P.,B.C., M.T.d.T., C.C. and R.J.O.; resources, C.P., B.C., C.C., R.J.O., J.F.B. and V.M.; data curation, C.P., B.C., C.C. andR.J.O.; writing—original draft preparation, C.P.; writing—review and editing, C.P., B.C., M.T.d.T., C.C., R.J.O.,J.F.B. and V.M.; visualization, C.P. and B.C.; supervision, C.P. and B.C. All authors have read and agreed to thepublished version of the manuscript.
Funding: This work has been partially supported by the research project “Desarrollo de métodos de mínimainvasión para la revalorización socio-cultural de zonas arqueológicas” (PRI IB116150) funded by the AutonomousGovernment of Extremadura, by the project “Innovación abierta e inteligente en la EUROACE” with the reference0049_INNOACE_4_E, by the European Union through the European Regional Development Fund included inCOMPETE 2020, and through the Portuguese national funding agency for science, research and technology (FCT)in the scope of the projects SFRH/BSAB/143063/2018 and UIDB/04683/2020. The funders had no role in the designof the study; in the collection, analyses, or interpretation of data; in the writing of the manuscript; or in the decisionto publish the results.
Acknowledgments: The author thanks the reviewers for valuable feedback on an early draft of this manuscript.
Conflicts of Interest: The authors declare no conflicts of interest.
References
1. Díez Balda, M.A.; Vegas, R.; González Lodeiro, F. Autochthonous sequences in the Central Iberian Zone:Structure. In Pre-Mesozoic Geology of Iberia; Dallmeyer, R.D., Martínez García, E., Eds.; Springer: Berlin,Germany, 1999; pp. 172–188.
2. Carrington da Costa, J. Noticia Sobre uma Carta Geologica do Buçaco, de Nery Delgado; Publicación Especialde la Comision de Servicio Geológico de Portugal; Servicio Geológico de Portugal: Lisbon, Portugal, 1950;pp. 1–27.
3. Alvarez Nava, H.; García Casquero, J.L.; Gil Toja, A.; Hernández Urroz, J.; Lorenzo Alvarez, S.; López Díaz, F.;Mira López, M.; Monteserín, V.; Nozal, F.; Pardo, M.V.; et al. Unidades Litoestratigráficas de los MaterialesPrecámbrico-Cámbricos en la Mitad Suroriental de la Zona 917 Centro-Ibérica. In II Congreso Geológico deEspaña; Sociedad Geológica de España: Granada, Spain, 1988; pp. 19–22.
4. San José, M.A.; Pieren, A.P.; García Hidalgo, F.J.; Vilas, L.; Herranz, P.; Peláez, J.R.; Perejón, A. Central IberianZone: Ante-Ordovician stratigraphy. In Pre-Mesozoic Geology of Iberia; Dallmeyer, R.D., Martínez García, E.,Eds.; Springer: Berlin/Heidelberg, Germany; New York, NY, USA, 1990; pp. 147–159.
5. Valladares, M.I.; Barba, P.; Ugidos, J.M.; Colmenero, J.R.; Armenteros, I. Upper Neoproterozoic–LowerCambrian sedimentary successions in the Central Iberian Zone (Spain): Sequence stratigraphy, petrologyand chemostratigraphy. Implications for other European zones. Int. J. Earth Sci. 2000, 89, 2–20. [CrossRef]
6. Rodríguez Alonso, M.D.; Peinado, M.; López-Plaza, M.; Franco, P.; Carnicero, A.; Gonzalo, J.C.Neoproterozoic–Cambrian synsedimentary magmatism in the Central Iberian Zone (Spain): Geology,petrology and geodynamic significance. Int. J. Earth Sci. 2004, 93, 897–920. [CrossRef]
7. Pereira, J.M.; Castro, A.; Fernández, C.; Rodríguez, C. Multiple Paleozoic magmaticorogenic events in theCentral Extremadura batholith (Iberian Variscan belt, Spain). J. Iber. Geol. 2018, 1–27. [CrossRef]
8. De Tena, M.T.; Pro, C.; Charro, C.; Salgado, J.A.; Mayoral, V. Geological characterisation of the settlement ofVillasviejas del Tamuja (Cáceres, Spain). Quat. Int. 2020. [CrossRef]
9. De Tena Rey, M.T.; Rebollada Casado, E.; Muñoz Barco, P.; Charro Lobato, C. Marmitas de gigante en pizarras:Río Tamuja (Botija, Cáceres). In XV Reunión Nacional del Cuaternario; Asociación Española para el Estudio delCuaternario: Bilbao, Spain, 2019; pp. 377–380.
10. Mayoral, V.; Charro, C.; Salgado, J.A.; Pro, C.; de Tena, M.T.; Chapa, T.; Vallés, J.; Terrón, J.M.; Quirós, E.Radiography of an Iron Age hillfort: Non-invasive archaeology in the settlement of Villasviejas del Tamuja(Botija, Cáceres). Trab. Prehist. 2019, 76, 302–322. [CrossRef]
11. Hesse, R. LiDAR-Derived Local Relief Models—A New Tool for Archaeological Prospection. Archaeol. Prospect.2010, 17, 67–72. [CrossRef]
12. Hesse, R. Lidar Visualization Toolbox. Visual Basic.NET (Version 1.0.0.20). 2013. Available online:http://sourceforge.net/projects/livt/?source=navbar (accessed on 9 May 2020).
13. Hernández, F.; Galán Domingo, E.; Martín Bravo, A.M. A la vista de las murallas: Análisis arqueológico delentorno del castro prerromano de Villasviejas del Tamuja (Cáceres). Complutum 2009, 20, 109–132.
Remote Sens. 2020, 12, 1989 18 of 18
14. Nowaczinski, E.; Schukraft, G.; Rassmann, K.; Reiter, S.; Müller-Scheeßel, N.; Hecht, S.; Bátora, J. Amultidimensional research strategy for the evaluation of settlement pits: 3d electrical resistivity tomography,magnetic prospection and soil chemistry. Archaeol. Prospect. 2015, 22, 233–253. [CrossRef]
15. Kvamme, K.L. Geophysical correlation: Global versus local perspectives. Archaeol. Prospect. 2018, 25, 111–120.[CrossRef]
16. Krivánek, R. Comparison Study to the Use of Geophysical Methods at Archaeological Sites Observed byVarious Remote Sensing Techniques in the Czech Republic. Geosciences 2017, 7, 81. [CrossRef]
17. Sala, R.; Garcia-Garcia, E.; Tamba, R. Archaeological Geophysics—From Basics to New Perspectives.In Archaeology, New Approaches in Theory and Techniques; InTech: Rijeka, Croatia, 2012; pp. 133–166.
18. Conyers, L.B.; Goodman, D. Ground-Penetrating Radar: An Introduction for Archaeologists; AltaMira Press:Walnut Creek, CA, USA, 1997; 200p.
19. Gaffney, G.; Gater, J. Revealing the Buried Past: Geophysics for Archaeologists; Tempus Publishing: Stroud, UK,2006; ISBN 0752425560.
20. Gautam, S.; Kumar, M. An Effective Image Fusion Technique Based on Multiresolution Singular ValueDecomposition. INFOCOMP J. Comput. Sci. 2015, 14, 31–43.
21. Bartington, G.; Chapman, C.E. A high-stability fluxgate magnetic gradiometer for shallow geophysicalsurvey applications. Archaeol. Prospect. 2004, 11, 19–34. [CrossRef]
22. Schmidt, A. Electrical and magnetic methods in archaeological prospection. In Seeing the Unseen. Geophysicsand Landscape Archaeology; Campana, S., Piro, S., Eds.; CRC Press/Balkema: Leiden, The Netherlands, 2008;pp. 67–81.
23. Berge, M.A.; Drahor, M.G. Electrical resistivity tomography investigations of multilayered archaeologicalsettlements: Part I—Modeling. Archaeol. Prospect. 2011, 18, 159–171. [CrossRef]
24. Berge, M.A.; Drahor, M.G. Electrical resistivity tomography investigations of multilayered archaeologicalsettlements: Part II—A case from Old Smyrna Höyük, Turkey. Archaeol. Prospect. 2011, 18, 291–302.[CrossRef]
25. Teixidó, T.; Artigot, E.G.; Peña, J.A.; Molina, F.; Nájera, T.; Carrión, F. Geoarchaeological Context of theMotilla de la Vega Site (Spain) Based on Electrical Resistivity Tomography. Archaeol. Prospect. 2013, 20, 11–22.[CrossRef]
26. Kirchner, A.; Zielhofer, C.; Werther, L.; Schneider, M.; Linzen, S.; Wilken, D.; Wunderlich, T.; Rabbel, W.;Meyer, C.; Schmidt, J.; et al. A multidisciplinary approach in wetland geoarchaeology: Survey of the missingsouthern canal connection of the Fossa Carolina (SW Germany). Quat. Int. 2018, 473, 3–20. [CrossRef]
27. Dahlin, T.; Zhou, B. Multiple gradient array measurements for multi-channel 2D resistivity imaging. Near Surf.Geophys. 2006, 4, 113–123. [CrossRef]
28. Milsom, J. Field Geophysics; John Wiley & Sons: West Sussex, UK, 2003; Volume 31, 232p.29. Annan, A.P. Electromagnetic Principles of Ground Penetrating Radar. In Ground Penetrating Radar Theory and
Applications; Jol, H.M., Ed.; Elsevier: Amsterdam, The Netherlands, 2008; pp. 3–40.30. Annan, A.P. Ground penetrating radar. In Near Surface Geophysics; Butler, D.K., Ed.; Investigations in
Geophysics No. 13; Society of Exploration Geophysicists: Tulsa, OK, USA, 2005; pp. 357–438.31. Nuzzo, L.; Leucci, G.; Negri, S.; Carrozzo, M.T.; Quarta, T. Application of 3D visualization techniques in the
analysis of GPR data for archaeology. Ann. Geophys. 2002, 45, 321–337.32. Conyers, L.B. Analysis and interpretation of GPR datasets for integrated archaeological mapping. Near Surf.
Geophys. 2015, 13, 645–651. [CrossRef]33. Agapiou, A.; Lysandrou, V.; Sarris, A.; Papadopoulos, N.; Hadjimitsis, D.G. Fusion of Satellite Multispectral
Images Based on Ground-Penetrating Radar (GPR) Data for the Investigation of Buried ConcealedArchaeological Remains. Geosciences 2017, 7, 40. [CrossRef]
34. Genelle, F.; Sirieix, C.; Joëlle, R.; Naudet, V.; Dabas, M. Detection of landfill cover damage with geophysicalmethods. Near Surf. Geophys. 2014, 12, 599–612. [CrossRef]
© 2020 by the authors. Licensee MDPI, Basel, Switzerland. This article is an open accessarticle distributed under the terms and conditions of the Creative Commons Attribution(CC BY) license (http://creativecommons.org/licenses/by/4.0/).