Embed Size (px)
Citation preview

Exploring the computation of housing need in Wirral
University of LiverpoolCentre for Sustainable and Resilient Cities

2 | EXPLORING THE COMPUTATION OF HOUSING NEED IN WIRRAL
About the Centre for Sustainable and Resilient CitiesThe Centre for Sustainable and Resilient Cities (SaRC) brings together academics from across the University of Liverpool to work collaboratively on the global challenge to make our cities more sustainable and resilient, in the face of climate change, resource depletion, population growth, urbanisation and migration.
To develop solutions to these issues, two things are essential - firstly, that academics from different disciplines cooperate to think outside the ‘disciplinary silos’ that often constrain us; and secondly, we have to work with partners from other sectors.
SaRC includes over 40 research active experts covering topics such as population modelling, housing economics, urban design, environmental assessment, development economics, planning practice, architecture, regional governance and local economic development.
About the University of LiverpoolSince its foundation in 1881 the University of Liverpool has worked for the advancement of learning and ennoblement of life. This remains our mission today and will give focus to all our efforts in the coming years as we strive to achieve our ambitions and aspirations and tackle the grand challenges of the age.
As a connected, global University with multiple physical and virtual campuses - Liverpool, London, Suzhou, Singapore and online - our worldwide influence and impact is unrivalled in higher education.
The University is an inclusive institution, committed to the provision of opportunity for those with the capacity to benefit as individuals but also as members of a wider community dedicated to a sustainable and just society.

| 3 ABOUT THE AUTHORS
Professor Alexander LordAlexander Lord is Lever Chair at the Department of Geography and Planning at the University of Liverpool. He works on the economic effects of urban and environmental planning and has conducted research for a wide range of funders including an Economic and Social Research Council Urban Transformations award on the behavioural economics of real estate markets. Alex has also conducted research for the Royal Town Planning Institute on the potential value of planning as a formal animator of development. He led the consortia of universities which completed the last two iterations of The Value and Incidence of Developer Contributions in England for the Ministry of Housing, Communities and Local Government (2016/17 and 2018/19).
Dr Paul WilliamsonPaul Williamson is a demographer / population geographer with a research focus on small area estimation, household demography and life course transitions. He has contributed to reports for a range of organisations including Yorkshire Water Plc, the Arts Council, the Office for National Statistics, the Economic and Social Research Council and the Omani Census Office.
Dr Richard DunningDr Richard Dunning trained and worked as a surveyor before completing a PhD in housing economics. He is the Vice Chair of the Housing Studies Association, the learned society for housing research in the UK. Richard has worked on Strategic Housing Market Assessments for local authorities, undertaken housing need modelling at the national scale for Shelter Scotland, completed housing and planning research for the Ministry of Housing, Communities and Local Government, the Residential Landlords Association, the Joseph Rowntree Foundation and the Royal Institution of Chartered Surveyors.
Dr Chi-Wan CheangChi-Wan Cheang is a post-doctoral researcher in the Department of Geography and Planning at the University of Liverpool. She holds a PhD in Economics with a specialisation in econometric modelling. Her current research examines the relationship between developer contributions and their associated impacts on land value uplift. Her previous research also looked at the socio-economic impacts of housing bubbles and a novel investment strategy for pension portfolios.
Ms Carol YinCarol is a doctoral candidate in Economics at the University of Liverpool Management School. Her current research covers the fields of Labour, Family and Public Economics, focusing on policy evaluation. She conducted an empirical study of household decision making in the area of fertility and microeconomics and has also worked on the relationship between house prices and fertility rates in England and Wales.
About the Authors

4 | EXPLORING THE COMPUTATION OF HOUSING NEED IN WIRRAL
Contents
Part One: Should Wirral be considered an exceptional housing market area? 5
The mechanics of the standard method 6
Challenging the standard methodology’s computation of housing need on the basis of ‘exceptional local circumstances’ 7
Are there ‘exceptional local circumstances’ in Wirral? 9
Part Two: Population-based computations of household need. Understanding differences in housing need resulting from ONS projections based in different years 15
Population estimation 15
Comparison of the 2014-based and 2018-based mid-year population estimates 16
Population totals 18
2014- vs 2018-based population projections 19
Conclusions: Does Wirral experience ‘exceptional local circumstances’? 21
Appendix B: List of Local Planning Authorities in England 27
Photo credits
Cover: Rodney Street, Birkenhead © Suzanne Yee
P31: Wallacre Road, Wallasey © Suzanne Yee

| 5 PART ONE
1.0 Introduction
1.1 In March 2020 Wirral Metropolitan Borough Council commissioned the Centre for Sustainable and Resilient Cities at the University of Liverpool to provide evidence on the computation of housing need in Wirral. There were two factors that influenced the requirement for further consideration of this issue.
1.2 Firstly, in March 2020 Wirral MBC had embarked upon the latter stages of the preparation of the local authority’s statutory local plan. The development of this document calls for the collation of a robust evidence base.
1.3 Secondly, in the recent past a number of local authorities in England have sought to consider the degree to which the standard methodology by which housing need is computed was wholly reflective of local circumstances. This has prompted some local authorities to think about what circumstances might justify an alternative approach.
1.4 The research undertaken for Wirral MBC and reported in this document, therefore, seeks to address questions in two areas:
A) To what extent are circumstances in Wirral adequately captured by the standard method by which housing need is calculated? To what extent is there a case for the identification of ‘exceptional local circumstances’ in Wirral?
B) How can variations in housing need be understood when different ONS base years are employed?
1.5 The following document is divided into two parts that address each of these questions in turn.
Part One: Should Wirral be considered an exceptional housing market area?
2.0 Introduction
2.1 The delivery of new homes is one of the main priorities for the UK government. In part this policy focus results from estimates of historic under-supply of new dwellings. For example, Wilson and Barton (2018: 3) reported that in 2017/18 around 222,000 new homes were built in comparison with estimates of annual housing need that ranged between 240,000 and 340,000. Research by the BBC in 2020 argued that the gap between demand for new housing and supply had grown to over 1 million dwellings (BBC, 2020).
2.2 Responsibility for meeting the nation’s housing requirement is distributed geographically across all local authorities in England. The logic for this approach turns on the understanding that, if each local planning authority (henceforth LPA) were to meet a specified local target the aggregated national picture would represent a supply side re-alignment to meet demand. A sound assessment of the supply of housing required in each LPA is, therefore, a core component of a sound local plan.
2.3 The approach taken by the UK government to determine the level of under-supply in each LPA is to employ a method using ONS household projections (e.g. ONS, 2018a, 2018b) to arrive at a target number of dwellings for each LPA in the country. These LPA-level targets are determined by a standardised methodology published by the Ministry for Housing, Communities and Local Government.
2.4 This approach informs how the Planning Inspectorate evaluate the validity of local plans. In this respect National Planning Policy Guidance clearly specifies that LPAs should use the housing number resulting from the standard methodology employing 2014 ONS household projections to determine the minimum level of housing need and incorporate this into their local plan. Exceeding this target is permitted but an LPA’s capacity to argue for a lower target is proscribed unless it can be demonstrated that there is clear evidence of ‘exceptional local circumstances’:

6 | EXPLORING THE COMPUTATION OF HOUSING NEED IN WIRRAL
"Where a strategic policy-making authority can show that an alternative approach identifies a need higher than using the standard method, and that it adequately reflects current and future demographic trends and market signals, the approach can be considered sound as it will have exceeded the minimum starting point.
Where an alternative approach results in a lower housing need figure than that identified using the standard method, the strategic policy-making authority will need to demonstrate, using robust evidence, that the figure is based on realistic assumptions of demographic growth and that there are exceptional local circumstances that justify deviating from the standard method. This will be tested at examination". (MHCLG, 2019; emphasis added).
2.5 In the first part of this study we seek to explore this concept of exceptionalism. We begin by setting out the standard methodology and reviewing a small number of cases where LPAs have sought to contest its application on the grounds of exceptional local circumstances. Following this discussion we provide an analysis of what might count as an evidence base for identifying exceptionalism. To achieve this we produce a statistical analysis of all LPAs in England with respect to the inputs that comprise the standard methodology for calculating housing need.
The mechanics of the standard method
2.6 The standard methodology is a household growth model with an adjustment for affordability. The method has three steps: 1) a projection of the change in households, 2) an assess ment of affordability, and 3) a potential cap on the increase in new housing required. Considering each individual component in turn:
Household change projection
2.7 The projected increase in the number of households over the next ten years sets the baseline (e.g. projected number of households in the local authority in 2030 minus the projected number of households in the local authority in 2020). Whilst it was originally planned that the projections would be updated every two years,
using the latest projections, this was rescinded1 in favour of the consistent use of the 2014-based household projections.
2.8 The projection of future housing requirement is, therefore, contingent upon the assumptions that underpin the projections of household growth produced by the Office for National Statistics2. Household growth projections have been a core component of many different methods for assessing housing requirements. However, the difficulty of using trend-based projections in predicting housing requirements has been highlighted regularly. For example, Baker and Wong (1997: 76) note that:
“As the household projections are trend-based forecasts, any new changing socio- economic circumstances that affect the components in the model may not be reflected in the current projections. On the one hand, this retrospective approach means the assumptions sometimes lag behind events (Shaw, 1994). On the other hand, if unusual changes in the very recent socioeconomic trends such as the 1989 recession are picked up, they can exaggerate the effect of changes because the projections are carried out by applying decreasing weightings to the more historical data points in the time series.”
2.9 Over time, the accuracy of household projections has been predicated upon stability in the type and formation of households (Holmans, 2012). As household types changed over the 20th century through changes in trends such as divorce, co-habiting and multi-generational households then historic household projections became less accurate. As such, the 2014-based ONS household projections will be accurate if household types look similar in 2030 to the period prior to 2014. Any changes in birth rates, death rates, migration rates and household types in the intervening period will lead to inaccuracy.
1 The 2016 household projections resulted in a much lower national housing need assessment (through crude addition of all local authorities housing need numbers) than the government’s national house building target. As such the government opted to keep the higher number of housing need using the higher 2014-based household projections.
2 The ONS projections do not take into account the effect of future changes (at the point of projection). So, for example, even where there has been a known change int the death rate (for example due to COVID-19) or an estimate in the increase in birth rate (nine to eleven months on from the COVID-19 lockdown) then these are not included in the projections, which may therefore be known to be outdated at the point of calculation of the standard methodology.

| 7 PART ONE
2.10 Whilst housing need assessments should be ‘objective’, in reality all assessments include normative values intrinsic to the methods and data selection. Three normative positions can be identified with regard to the use of household projections in the standard method. First, future household types should conform to previous household types as projected in the ONS statistics. Second, that there are the same number of adequate dwellings as the number of households at the beginning of the projection period (i.e. all housing is adequate, regardless of either housing quality3 or household size matching dwellings (or can be brought up to standard4 )). Third, that the 2014 household projections are a ‘better’ reflection of the government’s desire to minimise the impact of constraints in household formation than later projections, even when affordability has been taken into account5.
An adjustment to take account of affordability
2.11 To reflect the argument that housing supply needs to be greater in areas that are least affordable the government uses an indicator of affordability to increase the housing need number in the least affordable local authorities6. It does this through an adjustment which accounts for the ratio between average house prices and median work placed incomes.
This adjustment factor is:
3 Housing quality is a contested subject. There are different housing standards for different types of housing in England and apply at different stages (e.g. development / sale), but there is no definition regarding what quality is required in the existing housing stock (Wilson and Barton, 2018).
4 See Whitehead (1991) for a historic account of this argument.5 Wilson and Barton’s review of the rationale for use of the 2014-based projections
is that: “The Government launched a consultation on the method in October 2018, in which it stated that the lower household projections did not affect its target of building 300,000 homes per year. The consultation document argued that new household formation is constrained by housing supply, and that this is part of the reason for the fall in projections; that there has been historic under-delivery of housing which needs remedying; and that low supply has led to declining affordability.” (Wilson and Barton, 2020, p.10)
6 The guidance explains that an adjustment is applied because: “household formation is constrained to the supply of available properties - new households cannot form if there is nowhere for them to live; and people may want to live in an area in which they do not reside currently, for example to be near to work, but be unable to find appropriate accommodation that they can afford. The affordability adjustment is applied in order to ensure that the standard method for assessing local housing need responds to price signals and is consistent with the policy objective of significantly boosting the supply of homes. The specific adjustment in this guidance is set at a level to ensure that minimum annual housing need starts to address the affordability of homes.” (MHCLG, 2019, https://www.gov.uk/guidance/housing-and-economic-development-needs-assessments).
2.12 There are two normative positions within this step. First, housing requirements should reflect the level of affordability within the local authority. Second, that median house prices and median work-based incomes reflect the goals of housing provision and that increasing housing supply will result in housing becoming more affordable 7. This includes the assumption that there is a single housing market in operation within the local authority and that house price changes will be affected across the market through supply in any location within the local authority’s spatial boundaries.
Capping the level of any increase
2.13 The combination of stages one and two could result in a significantly different housing need assessment than the authority’s existing assessment in the local plan (assuming it is still relevant, i.e. within the last five years). As such the standard methodology retains the possibility of the LPA capping the impact on the housing requirement by limiting the increase to 40% above the existing requirement figure.
Challenging the standard methodology’s computation of housing need on the basis of ‘exceptional local circumstances’
2.14 In some cases use of the standard methodology has proven controversial. Although the National Planning Policy Guidance specifies the requirement for ‘exceptional local circumstances’ to be demonstrable in order to deviate from the standard methodology, there is no formal legal definition of what ‘exceptional local circumstances’ might comprise.
2.15 However, in a small number of instances LPAs have sought to contest the use of the standard methodology which provides some interesting planning appeal decisions.
2.16 The two most significant cases in this regard are both from Central Bedfordshire and relate to specific proposals for residential development which were the subject of appeals under section 78 of the 1990 Town and Country Planning
7 This ignores other issues that have an impact on housing affordability locally, including access to finance and the degree of non-residential housing demand (e.g. second and holiday homes). Previous guidance, by the (then) Department for Communities and Local Government argued that housing need differed from housing demand and that many households would choose to consume more housing than they ‘need’ if this is possible (Bramley et al., 2010).
adjustment factor = ( ) X 0.25+1Local affordability ratio -4
4

8 | EXPLORING THE COMPUTATION OF HOUSING NEED IN WIRRAL
Act (where a developer seeks a judgement on a decision to refuse planning consent by the local planning authority). In both cases (ref: APP/P0240/W/18/3206495: Land west of New Road, Clifton SG17 5JH, decision dated 25 June 2019 and Ref: APP/P0240/W/18/3218992: Land at Clophill Road, Maulden, Bedford, MK45 2AA, decision dated 10 July 2019) the planning inspector dismissed the appeal and upheld the original judgement of the local authority to refuse planning consent. In so doing, the inspector on the latter case noted that, “based on the evidence before me I do not find it unreasonable that the Council have proceeded with an alternative approach to the calculation of five year housing land supply” (Norman, 2019: 6).
2.17 This point is significant as (in both cases) this was a specific assessment of an appeal regarding a particular development proposal - it was not an assessment of the local authority’s local plan. In this respect these specific cases referred to the use of the standard methodology relative to the local authority’s ability to demonstrate a five-year housing land supply. In the Central Bedfordshire cases the local authority argued that it could not meet this five year housing land supply required by government against a local housing need target calculated under the standard methodology. Therefore, whilst the standard methodology was a relevant feature of the judgements of the planning inspector in the Central Bedfordshire cases it was not the specific goal of the cases themselves. Indeed, the inspector’s final judgement in the latter case referred to the proposed development’s “harm to the character and appearance of the landscape” rather than that the proposed development was in some way incongruent with the borough-wide estimation of housing need. That test of housing need at the scale of the whole local authority area will come at local plan examination, as clearly indicated in the inspector’s report: “I note the Council’s housing land supply calculations and justification for their methodology is subject to scrutiny at their ongoing Local Plan Examination, however no formal conclusions have been made available at this stage” (Norman, 2019: 5).
2.18 Given that the situation in Wirral specifically relates to the development of an evidence base to support the examination of the local plan it would consequently seem most appropriate to explore similar cases where a local planning authority has sought to contest the use of the standard methodology in the production of a local plan.
However, no LPA has sought to do this to date. The best comparator example that can be found is the case of Sevenoaks District Council where the local authority submitted its local plan for examination despite pre-examination advice from the planning inspector for its withdrawal. This advice was given on the grounds that the plan was premised on the delivery of fewer dwellings than those that would result under the standard methodology with the shortfall not clearly met by neighbouring local authorities under the ‘duty-to-cooperate’:
“The Plan, as submitted, identifies a need for 13,960 dwellings between 2015 and 2035, but sets out a requirement for 10,568 dwellings, which would amount to an unmet need of 3,392 dwellings. The Council advanced a position during the Examination which sought to reduce the unmet need. However, it would still have left an unmet need of 1,316 dwellings, even if I had agreed with the Council’s position”. (Baker, 2020: 5).
2.19 The inspector deemed that the legal requirement for the duty-to-cooperate had not been met with respect to this issue of accommodating housing need and, therefore, did not consider the plan any further but judged that the plan could not be adopted.
2.20 These examples serve to illustrate the requirement for Wirral to assemble a clear evidence base with respect to whether or not the standard methodology should be applied in the preparation of the LPAs local plan or whether there are sufficient grounds to consider there to be exceptional local circumstances that warrant a different approach.
2.21 To address this dilemma in the following sections we test the concept of exceptionalism against each of the inputs to the standard methodology. If a local authority could be shown to be unusual in comparison to the other local authorities in England with respect to the variables that comprise the standard methodology it would follow that exceptional local circumstances might be said to apply.
2.22 In the following sections we perform this analysis by running the standard methodology and all its inputs for all 326 LPAs in England. In each case we identify how Wirral relates to this full set of English local authorities.

| 9
Are there ‘exceptional local circumstances’ in Wirral?
2.23 As described above the Standard Methodology has two main inputs: household projections and an affordability adjustment. In this section of the report we consider the variables that combine to comprise these two inputs. Live births, the fertility rate, deaths, crude death rate, and in- and out- migration constitute the household projection and median house prices and median work-place based earnings constitute the affordability ratio.
2.24 The approach taken in this part of the study is to consider how Wirral compares to the other 325 local planning authorities (LPAs) in England (listed in Appendix B) with regard to these variables underpinning the standard methodology.
2.25 To compare how Wirral relates to other LPAs we position Wirral’s data for each variable in a decile ranking. A decile is a rank-order statistic which divides a distribution (in this case the 326 local planning authorities in England) from lowest to highest (or vice versa) into 10 equally sized groups, in which each group contains 10% of the data. Splitting the data into deciles is helpful in understanding the information about different groups along the entire data distribution. While measures of central tendency (e.g. mean, median, mode) are useful at condensing information, they do not represent the shape of other parts of data, especially around the tails of the distribution. Thus, a decile analysis gives us a clearer summary of what each segment of the data looks like and, for an analysis of exceptionality, where the most interesting data points are located. In this part of the study, the 326 LPAs are assigned into 10 groups from decile 1 to 10 corresponding to the ranks of the input variable, where decile 1 indicates the lowest 10% of LPAs and the decile 10 indicates the highest 10% of LPAs in terms of the ranked values of the input variable.
2.26 The full set of inputs to the standard methodology are set out in two tables in Appendix A. Table A1 presents the summary statistics of the input variables and their relative changes for Wirral. Column 1 of Table A1 reports the value of the input variable, columns 2 and 3 present the decile group and the equivalent percentile of the input variable for Wirral among all the 326 LPA observations, column 4 shows the rank (from low to high) of Wirral for the corresponding input variable
among the 326 LPAs. Table A2 also provides a headline comparison of Wirral in terms of the input variables relative to all other local planning authorities in England.
2.27 In the following section each of these core variables underpinning the standard methodology is considered individually:
- Standard Methodology (based on 2014 projections)- Household projections (2014, 2016, 2018)- Percentage change in household projections
(2014 projections)- Standard Methodology output per 1000 households- Live births and fertility rates- Deaths and death rates- In-migration, out-migration and net migration- Median house prices- Median work-place based earnings- Affordability ratio
2.28 It is important to note that in the following analysis we consider a range of different types of statistic, such as absolute values (e.g. household projections), changes in absolute values (e.g. change in household projections between two periods) and changes in percentages (e.g. household growth as a percentage of the first period number of households) and ratios (e.g. house price to work place-based earnings). We use a range of different types of statistic because they each pertain to an element of the standard methodology. However, the measures employed in the standard methodology are not equally likely to prove that Wirral is, or is not, exceptional. For example, Wirral is a large local authority (by household number) compared to other local authorities in England. Therefore, comparing absolute numbers (e.g. number of deaths) may not be as useful as proportions (e.g. the death rate). Some statistics will consequently be more relevant than others in assessing exceptionality. The rankings presented throughout the study refer to the distribution of LPAs with regard to each input measured lowest to highest.
i. The Standard Methodology
2.29 The standard methodology uses the ONS2014 household projection data. This produces an annual requirement for Wirral of 782 new dwellings per annum which equates to 11,730 over the period 2020-2035.
PART ONE

10 | EXPLORING THE COMPUTATION OF HOUSING NEED IN WIRRAL
2.30 Figure 1 illustrates Wirral’s position relative to the standard methodology’s housing requirement (per annum) for all LPAs in England. On this account Wirral is relatively close to the median (the 61st percentage point). When considered in the context of all 326 English local authorities this places Wirral as 199/326 (rank from low to high).
2.31 It is useful to place the scale of housing need that results from the standard method, depicted in Figure 1, within the context of the size of the local authority. Wirral is a large local authority that accommodates 148,340 existing dwellings (MHCLG, 2018). When considered in this light the 782 dwellings that result from the standard method represent an annual growth of 0.5%. This ratio of the housing need resulting from the standard method relative to the existing housing stock can be produced for every local authority in England (Figure 2).
2.32 Figure 2 shows that, in the context of other English LPAs, the standard method results in a small proportionate increase in the number of new dwellings in Wirral: a housing need of 5.273 new units per 1000 existing dwellings. This places Wirral at the 14th percentile (45th of the 326 local authorities in England). Stated alternatively, in 86% of English local authorities the standard method results in a housing need figure that is greater relative to the existing stock of dwellings than is the case in Wirral.
2.33 When considered together, Figures 1 and 2 present a consistent account for how Wirral relates to all other English local planning authorities. Figure 1 shows that the authority is close to the median experience - almost 40% of LPAs in England have higher absolute housing requirements than Wirral over the period 2020-2035 as assessed by the standard methodology. However, when placed in the context of Wirral’s large existing stock of dwellings the standard methodology’s requirement is far more modest relative to other English local authorities.
2.34 To fully appreciate how the statistics that determine the outputs of the standard method are computed it is necessary to consider all of its inputs and Wirral’s position relative to other English local authorities on each measure.
ii. Household projections
2.35 A core constituent of the standard methodology are ONS household projections. We consider projections for 2014, 2016 and 2018 using the 2014-based ONS projection.
2.36 It is essential to note that, on the basis of the number of households contained in the LPA area, Wirral is a large local authority relative to others in England. Figure 2 is a ‘violin plot’ that presents the density distribution of household projections for 2014, 2016 and 2018 using the ONS 2014 base. It takes its name from the distinctive violin shape in which the data is represented. The red dots denote the value for Wirral. From the plot Wirral’s household projections over the three years places the borough at the very right tail of the density distribution. When considered in absolute terms Wirral’s projected number of households range from 142,000 to 145,000 households (rounded) which places it inside the top 10% of local authorities nationally. Using 2014 and 2016 data Wirral is ranked 309/326 (position 94.8% on the
Figure 1. The distribution of housing need using the standard methodology (2014-based) (all English LPAs
Figure 2. Housing need measured by the standard method relative to existing dwellings (all English LPAs, per 1000 dwellings)
| 11
distribution) and in 2018 it is 307/326 (94.2% of the distribution).
2.37 It is important to contextualise the data presented in Figure 3 as the data represented reports that Wirral is home to a large number of households that is forecast to grow. But what is the scale of this forecast growth relative to other English LPAs?
2.38 Considering the degree of change in the household projection rate over three time periods (2001-2011, 2011-2021 and 2021-2031) the 10-year percentage changes in household projections for Wirral range from 4.5% to 5%. We find Wirral is consistently in the second decile with values ranging between 14.1% to 15.9% of the distribution of English LPAs. This means that, although the number of households in Wirral is nominally large compared to other English LPAs, the projected rate of change in this number of households is low. For example, looking at the 2021-2031 projected change 85.9% of English LPAs have a greater percentage change than Wirral.
Wirral is correspondingly ranked 46/326 among all English LPAs in terms of the 10-year change in household projections. This violin plot of the percentage change in household projections is presented in Figure 4.
iii. Live births and fertility rate
2.39 Using the ONS’ statistics on live births (which is a count of recorded births as part of civil registration in England), Wirral experiences more live births than many other English LPAs. On this measure Wirral has between 3,242 and 3,536 live births for the years 2014, 2016 and 2018 (extrapolated from the 2014-based ONS statistics). For all of the years that we present this statistic in Figure 5, Wirral MBC is in the ninth decile (i.e. it has a large number of live births when compared to other local authorities). For 2014 only 13.8% (rank: 281/326) of local authorities recorded a higher absolute number of live births. As with earlier comments this statistic is a reflection of the size of the Wirral LPA area and its resident population. Figure 5 illustrates how the number of live births in Wirral compares to all other English LPAs.
2.40 In order to understand how similar or exceptional Wirral is we next consider total fertility rates. According to the ONS (who produce the statistics used) total fertility rates account “for the size and age structure of the female population of childbearing age, which affects the number of births” (ONS, 2018c). The total fertility rate is represented graphically in Figure 6. Wirral has total fertility rates ranging from 1.76 to 1.92 for the years 2014, 2016 and 2018. These figures place Wirral close to the median of the distribution of all English
PART ONE
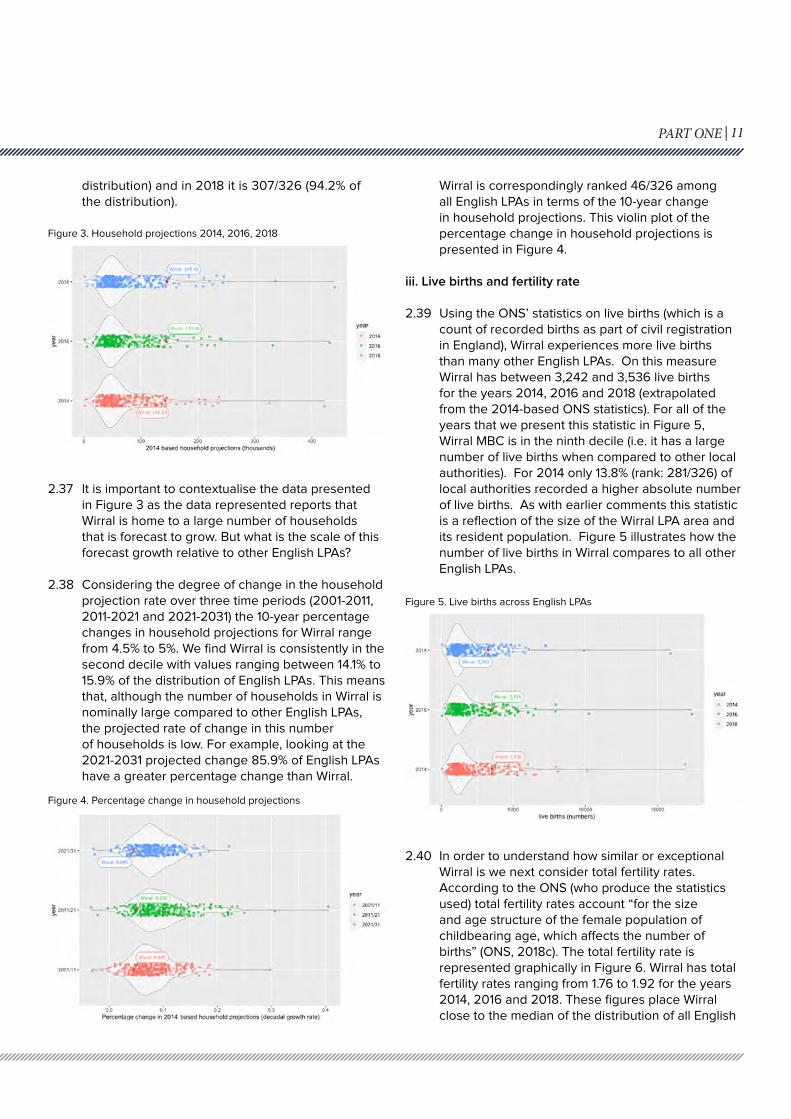
Figure 3. Household projections 2014, 2016, 2018
Figure 4. Percentage change in household projections
Figure 5. Live births across English LPAs

12 | EXPLORING THE COMPUTATION OF HOUSING NEED IN WIRRAL
LPAs: 58.2% (rank: 190/326) in 2014, 47.7% (rank: 156/326) in 2016 and 49.4% (rank: 161/326) in 2018.
iv. Deaths and death rate
2.41 As with the absolute number of births, the absolute number of deaths in Wirral is high, ranging from 3548 to 3789 for the years 2014, 2016 and 2018. This places the absolute number of recorded deaths in Wirral above 97% of other English local authorities over the observed years. Again, this is a result of Wirral being a large and populous local authority area in comparison to local government in the rest of England. Figure 7 illustrates Wirral’s position in this distribution.
2.42 In addition to recording a much higher than average absolute number of deaths, Wirral also has a higher than average death rate when compared to the rest of England with crude death rate ranging from 11.1 to 11.7 for the years 2014, 2016 and 2018. Wirral lies
above 89% of other English LPAs with a rank of 288 to 290 out of 326 LPAs across the observed years. This statistic is represented graphically in Figure 8.
v. In-migration, out-migration and net migration
2.43 In absolute terms in- and out- migration to Wirral is relatively close to the median experienced across other local authorities in England. At its highest for the years we consider, the level of in-migration placed Wirral at 64.7% (2014) of all English local authorities. In the same year out-migration was at its highest relative to other English local authorities: 36.5% of English local authorities had a higher absolute number with respect to out-migration. These numbers are represented graphically in Figures 9 and 10.
2.44 When considered as a rate relative to the overall population size of Wirral the levels of in- and out- migration are very small (the lowest decile) in comparison to the range of experiences across English local government.
2.45 Although in- and out- migration rates are very small for Wirral, the combined impact may be considered through the net migration rate. This is displayed in Figure 11. The net migration rate ranges from 0.1% to 0.2% for the years 2014, 2016 and 2018 which places the borough around the median of the distribution overall. Indeed, in 2014 Wirral was the median local authority in England. Net migration rates of 44.8% and 48.2% respectively for 2016 and 2018 are also very close to the median experience. It is clear on this measure that the experience in Wirral is quite typical of other English LPAs.
Figure 6. Fertility rate across English LPAs
Figure 8. Death rate across all English LPAs
Figure 7. Deaths (nominal) across all English LPAs

| 13
vi. Median house prices
2.46 Median house prices are one of the key inputs to the affordability ratio which is the second constituent of the standard methodology of housing
needs assessment. Wirral’s median house prices (Figure 12) ranged from £139,000 to £160,000 for 2014, 2016 and 2018 and the changes in median house prices (Figure 13) were between 6.6% to 7.7%. These two measures are low in Wirral compared to the rest of England. For both measures Wirral is in the second lowest decile of the distribution.
vii. Median work-place based earnings
2.47 Median work-place based (WPB) gross annual earnings is the other key input in the calculation of the affordability ratio. Median WPB earnings in Wirral range from £25,000 to £26,000. These figures are around the median for 2016 having been slightly lower in 2014 (rank: 133/326; the 40.7th percentage point) among all the English LPAs and quite considerably lower in 2018 to a position of 22.8% (rank: 74/326). Moreover, the percentage change in this measure has been highly variable
PART ONE
Figure 9. In-migration across all English LPAs
Figure 12. Median house prices across all English LPAs
Figure 13. Percentage change in median house prices across
all English LPA'
Figure 10. Out-migration across all English LPAs
Figure 11. Net migration rate across all English LPAs

14 | EXPLORING THE COMPUTATION OF HOUSING NEED IN WIRRAL
with experience in Wirral slightly above the median average between 2014-2016 with 5.4% change in median WPB earnings but very low between 2016-2018 with negative 2.5% deflated median earnings. This means that there are 92% of English local authorities that have experienced a greater degree of growth in median incomes compared to Wirral over the period 2016-2018.
2.48 Figures 14 and 15 show graphically how Wirral compares to other English local authorities on these two measures. Again, as with median house prices these statistics are important in that they represent an input to the affordability ratio.
viii. Affordability ratio
2.49 The affordability ratio is the ratio of median house prices to the median work-place based earnings. The larger the ratio, the less affordable housing is in a given area. It represents one of the essential
constituents in the standard methodology of housing needs assessment. Figure 16 illustrates the distribution of this affordability ratio across all English LPAs. The affordability ratio in Wirral ranges from 5.6 to 6.28 over the years 2014, 2016 and 2018. The position of Wirral among all English LPAs on the affordability ratio has been increasing year-on-year. In 2014 the affordability ratio for Wirral placed the borough at the 39.6th percentage point relative to all other local authorities in England (rank: 129/326). For 2016 it is the median authority. For 2018 Wirral’s affordability position is six percentage points above the median (rank: 184/326) relative to all other English LPAs. On this measure, therefore, Wirral is sufficiently close to the typical experience in England that it could be considered un-exceptional. Figure 14. Median work-place based earnings across all English LPAs
Figure 15. Percentage change in median incomes across all English LPAs
Figure 16. The ‘affordability ratio’ for all English LPAs

PART TWO | 15
Part Two: Population-based computations of household need. Understanding differences in housing need resulting from ONS projections based in different years
3.0 Introduction
3.1 The 2014-based household projections that National Planning Policy Guidance requires all local authorities in England to use in their assessment of housing need are developed in a three-step process. With respect to Wirral, the Office for National Statistics (ONS) makes an estimate of the current Wirral population, disaggregated by age and gender. Using this estimate as a starting point, the ONS then makes a projection of the future population of Wirral MBC, again disaggregated by age and gender. Finally, for 2014, the Department for Communities and Local Government (now the Ministry for Housing, Communities and Local Government) converted these population projections into household projections.
However, representations made through the Regulation 18 consultation argued that the Standard Method and 2014 ONS projections should not be used. It is, therefore, useful to publish this second part of this report alongside Part 1. In what follows we consider the key data and assumptions underpinning the population estimation, population projection and household projection steps before comparing the assumptions, underlying trends and outcomes of these 2014-based projections with the most recently released (2018-based) sub-national projections. This comparison complements a previously commissioned report that compared the 2014-based projections with the now outdated 2016-based projections (Williamson et al., 2018).
Population estimation
3.2 The most recent census (2011) counts for Wirral MBC are taken as a starting point. To bring these counts up-to-date the ONS uses the internationally accepted ‘cohort component’ approach.
3.3 For each year since the last census the population is updated as follows: age all persons by one year; add in the number of observed births; deduct the number of observed deaths; add (or deduct) the estimated number of net within-UK and international migrants; make small adjustments for rare populations (such as prisons and refugees from the conflict in Syria).
3.4 The counts of observed births and deaths comes from local registrar reports, and is believed to be near 100% accurate. The number of within-UK and international migrants, on the other hand, are only estimates, and for this reason are known to be less reliable.
3.5 Within-UK migration patterns are based on changes in address captured through the GP registration system. These changes may not fully reflect the true migration pattern because some people either do not sign-up for a new GP when they move or fail to inform their existing GP of their change of address. This problem particularly applies to young adult males and graduating students. To partly address this problem, information from the Higher Education Statistical Authority is used to estimate the size and destination graduate student migration flows.
3.6 International migration patterns are based mainly on a survey of people entering and leaving major ports and airports, known as the International Passenger Survey (IPS). Estimates based on the IPS have two known problems. First, the sample size is small, which limits the reliability of the survey when it comes to estimating flows to specific local authorities within the UK. Second, the survey asks passengers to declare their intentions regarding the duration they intend to stay (in the UK or overseas) and their intended destination (within the UK). However, passenger intentions can change (e.g. a short stay can become a long-term migration and migrants can move on from their initially intended destination before registering with a GP).
Population projection
3.7 The most recent ONS mid-year population estimate is taken as a starting point (2014 for the 2014 household projections). The cohort component approach is then used to project the future population.
3.8 For each year since the most recent mid-year estimate the population is projected forward as follows: age all persons by one year; add in the number of projected births; deduct the number of projected deaths; add (or deduct) the projected number of net within-UK and international migrants; add projected changes to prison and armed forces populations.

16 | EXPLORING THE COMPUTATION OF HOUSING NEED IN WIRRAL
3.9 The projected number of births and deaths are based upon trends in age-specific fertility and mortality (birth and death) rates observed locally over the last five years, in a way which ensures that the total number of births and deaths projected across all local authorities matches the total number of births and deaths in a separate national population projection.
3.10 In similar fashion within-UK and international in- and out-migration are based upon the most recently estimated local five-year trends. Projected within-UK migration flows to and from Wirral reflect both the size and age-sex structure of Wirral’s population and the projected size and age-sex structure of all other local authorities. Meanwhile the sum of the projected international migrants across all local authorities is constrained to match a separate national projection of the total number of immigrants and emigrants.
The strengths of this approach
• Adopts internationally accepted population projection methods.
• Ensures consistency by applying the same methods, based on the same datasets, to all local authorities.
• Ensures that the sum of the local authority projections matches a separately produced, and more reliable, national projection.
The weaknesses of this approach
• Assumes that trend data from 2009/10 to 2013/14 provides the best indication of future population behavior.
• Migration flows are estimated based on datasets that do not fully capture all moves, particularly for young adult males and graduating students.
Household projection
3.11 Household projections are used by applying local ‘Household Representative Rates’ to the projected local population. The reason that household representative rates are calculated is that the ratio of persons per household varies with age. For example, the elderly often live on their own or with only their partner, whilst middle-aged adults often live in households comprising themselves, a partner and one or more children. The use of household representative rates is equivalent to applying a separate population-to-household ratio
for each age-sex group. Consequently, when using household representative rates, a change in the age structure of the local population will lead to an appropriate change in projected number of households required to house that population.
3.12 The local household representative rates used for projection purposes are derived from the trend in these rates between the 2001 and 2011 Censuses. Unfortunately, there is no more up-to-date dataset is available that is capable of capturing the rates required with sufficient detail or accuracy.
The strengths of this approach
• Takes account of the changing housing requirements that arise from changing population age structures
• Based on observed local trend
The weaknesses of this approach
• Based on the trend in household representative rate observed over the period 2001 to 2011, which at a national level is known to project a faster reduction in household size since 2011 than has been observed subsequently in national surveys.
• The projected number of households for a large authority like Wirral is very sensitive to the assumed trend in household representative rates
Comparison of the 2014-based and 2018-based mid-year population estimates
3.13 As noted in the introduction to this document, National Planning Policy Guidance makes it clear that local authorities should compute housing need using the Office for National Statistics’ 2014-based household projections, which in turn are informed by the 2014-based mid-year population estimates. The 2014-based population estimates provide not only an estimate of Wirral’s population in mid-2014, but mid-year estimates for the years 2009-10 to 2013-14 that provide the five-year trends used as inputs to the population projection process.
3.14 One common question that follows is why the 2014-based sub-national projections should be used when more recent projections are available? For example, the subsequent 2016-based projections resulted in a notably slower increase in population and households for Wirral than the 2014-based projections.

PART TWO | 17
3.15 The most recent ‘2018-based’ subnational population projections were released in March 2020, with the accompanying 2018-based household population projections scheduled for release in early summer 2020. Underpinning both are the 2018-based mid-year estimates, which provide not only a more recent starting point (2018), but also a more recent five-year trend period (2013-14 to 2018-19).
3.16 Before examining differences between the 2014- and 2018-based population projections it is, therefore, necessary to first examine differences between the five-year trends inherent in their underpinning mid-year estimate time series. The analysis of the 2014- and 2018-based population estimates presented in this section serves that purpose.
Births and deaths
3.17 Table 1 summarises the observed births and deaths over the period 2009-10 to 2017-18. Over the five-year period 2009-10 to 2013-14, which informed the 2014-based household projections, the basic story is one of population growth (positive natural change) due to an excess of births over deaths. Since then the story switches to one of increasingly rapid population decline, due to a decrease in the number of births and an increase in the number of deaths. This is explained by an ageing population and a reduction in the number of children born to each woman, in line with national trends.
Within-UK migration
3.18 For the five-year period used to inform the 2014-based projections (2009-10 to 2013-14) the estimated net in-flow of within-UK migrants to Wirral was positive, running at 168 persons per year, although showing considerable year-on-year volatility (see Table 2). For the five-year period 2013-14 to 2017-18 used to inform the 2018-based projections, the equivalent average net migration is estimated to have increased to 530 persons per year.
3.19 It is notable that the highest estimated inflows to Wirral are reported for 2017 and 2018. This may in part reflect a change in the way that within-UK migration has been estimated since 2017 – a point returned to in more detail when comparing the 2014- and 2018-based population projections.
International migration
3.20 Table 3 shows that whilst the 2014- and 2018-based mid-year estimates report the same trends for immigration over the period 2009-10 to 2013-14, they report different trends for emigration. Due to sample size issues, in order to estimate international migration flows statistical models are applied to the data collected via the International Passenger Survey. For the 2018-based estimates, the statistical model used to estimate emigration flows was refined to capture a wider range of local authority attributes that contribute to the size of
Year Births Deaths NaturalChange
2010 3701 3497 204
2011 3769 3530 239
2012 3887 3466 421
2013 3586 3615 -29
2014 3611 3497 114
2015 3498 3675 -177
2016 3565 3725 -160
2017 3418 3656 -238
2018 3297 3753 -456
Table 1. Mid-year population estimate comparison: births and deaths
Source: ONS 2014 and 2018 Mid-year estimates
Within-UK migration
Year In Out Net
2010 7277 7088 189
2011 6784 7120 -336
2012 7722 7676 46
2013 7547 7209 338
2014 8091 7497 594
2015 7654 7504 150
2016 7757 7304 453
2017 8791 8080 711
2018 8825 8174 651
Table 2. Mid-year population estimate comparison: within-UK migration
Source: ONS 2014 and 2018 Mid-year estimates

18 | EXPLORING THE COMPUTATION OF HOUSING NEED IN WIRRAL
such flows. In addition, the modelling strategy for emigrants was switched to modelling the flow as a rate, making the estimate more sensitive to changes in the local authority population by age and sex. The new approach was ‘backcast’ to produce revised mid-year estimates from 2011-12 onwards.
3.21 For the period 2011-12 to 2013-14 the result of the change in methodology is a reduction in the number of people estimated to have emigrated from Wirral by around 170 persons per year. This in turn has led to a reversal of the originally estimated trend in international migration over the five-year period 2009-10 to 2013-14 from the net 84 person per year outflow used in the 2014-based household projections, to a net 31 person per year inflow. For the most recent five-year period covered by the 2018-based mid-year estimates this net inflow is estimated to have increased to 161 persons per year.
Other changes
3.22 A final component of the mid-year estimates is ‘other changes’. This covers changes in the populations of prisons and armed force bases, which does not apply to Wirral, plus special
categories such as asylum seekers from Syria. As Table 4 shows, the 2014-based and 2018-based population estimates for the period 2011-12 to 2013-14 period differ once more, again due to minor changes in methodology, but only by 5 persons per year.
3.23 The large ‘other changes’ reported for 2010 and 2011 relate to adjustments made retrospectively to Wirral’s population estimates for the years 2002 to 2011 in the light of results from the 2011 Census. These adjustments were required because the rolled-forward population estimates from the 2001 Census did not match the 2011 Census count. Evidence suggests that this is in part because the 2001 Census slightly undercounted Wirral’s population, and in part due to an over-estimate of the amount of net migration from Wirral over the period 2001 to 2011. Since 2012 the number of persons added to Wirral’s population due to ‘other changes’ has been very modest.
Population totals
3.24 As Figure 17 illustrates, the net impact of the differences between the 2014- and 2018-based population estimates is a smoothing out of the previously estimated temporary stall in population growth between 2012 and 2013, followed by a slightly faster rate of growth than previously estimated. This raises the question of which of the two sets of mid-year estimates is most plausible.
Mid-year estimates2014 and 2018
2014 2018 2014 2018
International migration Difference
Year In Out Out Net Net (2018 – 2014)
2010 679 646 646 33 33
2011 771 713 713 58 58
2012 591 695 546 -104 45 149
2013 613 879 675 -266 -63 203
2014 693 832 611 -139 82 221
2015 719 513 206
2016 696 507 189
2017 753 647 106
2018 942 719 223
Table 3. Mid-year population estimate comparison: International migration
Source: ONS 2014 and 2018 Mid-year estimates
Mid-year estimates2014 2018 Difference
Year Other changes
Other changes
(2018 – 2014)
2010 881 881
2011 798 798
2012 29 40 11
2013 23 35 12
2014 50 43 -7
2015 18
2016 34
2017 1
2018 21
Table 4. Mid-year population estimate comparison: Other changes
Source: ONS 2014 and 2018 Mid-year estimates

PART TWO | 19
3.25 In theory it might be possible to shed some light on this question by examining alternative data sources, such as council tax records and school and electoral rolls. In reality, by 2014 the nearly 600-person difference between the two competing population estimates accounts for less than 0.2% of the total Wirral population, and is, therefore, unlikely to be detectable given the usual margins-of-error associated with such administrative data. Instead, the plausibility of the two sets of population estimates has to be assessed by reference to their underlying methodologies.
3.26 For the period 2011-12 to 2013-14 the differences between the two estimates are almost entirely due to the changed approach to estimating emigration. In principle the new method adopted for the 2018-based estimates should be more reliable, since it takes account of a wider range of local authority attributes, including better account of local age and sex population structures. Therefore the 2018-based mid-year estimates are to be preferred.
2014- vs 2018-based population projections
3.27 Figure 18 compares population projections for Wirral made using the 2014-based and 2018-based population trends reviewed above. Comparison of the two principal projections that use these trends show that they both follow very similar paths between 2018 and 2035. In addition, the difference in their projections for Wirral’s population in 2035 differs by less than 100 persons.
Projection variants
3.28 In 2016 the key data source for estimating within-UK flows switched from the National Health Service Central Register (NHSCR) to the National Health Service Personal Demographics Service (PDS). This switch in data sources, forced by the closure of the NHSCR, is known to have introduced some discontinuities in observed migration trends. In consequence, when compiling its 2018-based subnational projections the ONS had to choose between making projections informed by a two-year trend derived from PDS data, or a five-year trend derived from a mix of PDS and NHSCR data. ONS decided to opt for the two-year trend, in order to avoid problems associated with the known NHSCR/PDS data discontinuities. The outcome of using this two-year trend data is illustrated in Figure 18 as ONS’s preferred or ‘principal’ 2018-based projection.
3.29 However, trends based on only two data points are themselves problematic due to their inherent instability - there is a danger that a two year ‘trend’ is really a two year ‘anomaly’. In recognition of this, for their 2018-based projections ONS released a series of variant projections drawing on various mixtures of PDS and NHSCR data. The first variant used five-year trend data produced by mixing data from the PDS for 2016 and 2017 with data from the NHS Central Register (NHSCR) for 2013 to 2015. The second variant used additional NHSCR data from earlier years to estimate a ten-year trend.
3.30 As Figure 18 shows, the projected growth of Wirral’s population is very sensitive to the internal
Figure 17. Mid-year estimates of Wirral’s population
Source: ONS mid-2014 and mid-2018 subnational mid-year population estimates
Figure 18. ONS Population Projections for Wirral
Source: ONS 2014- and 2018-based subnational population projections

20 | EXPLORING THE COMPUTATION OF HOUSING NEED IN WIRRAL
migration trends used as an input to the projection. The 5-year trend variant leads to a near halving in the projected growth for Wirral between 2018 and 2035, compared to the 2018-based principal projection, whilst the 10-year trend variant leads to an 80% reduction.
3.31 Whilst these variants flag the clear sensitivity of the ONS projections to the migration trends used as inputs, it does nothing to shed light on which variant is to be preferred.
3.32 Unfortunately, as highlighted when discussing the differences between the 2014- and 2018-based population estimates, there is no real way of telling which of the 2- and 5-year trends most accurately captures recent migration trends in Wirral, since the administrative data that could be used as a point of reference typically have too large a margin-of-error.
3.33 This leaves us having to rely upon ONS’s expert judgement, based upon their own extensive analysis, that, for their 2018-based projections, it was better to base their principal (i.e. officially preferred) projection on the 2-year trend measured using the PDS, rather than on the 5-year trend derived from mixed data sources with known discontinuities.
3.34 This decision, forced upon ONS by the data and evidence available, does not change the view of ONS, long accepted by local authorities, that wherever data allow, projections based upon a five-year trend strike a good balance between being responsive to recent local changes without being overly sensitive to the occasional anomalous year. The 2014-based subnational projections were based upon observed five-year migration trends, and it is ONS’s stated position that future subnational projections will also revert to using five-year internal migration trends as soon as five-years’ worth of PDS migration data have been accumulated.
3.35 The 2018-based projection ’10-year trend’ variant has the same disadvantage as the 5-year trend variant, of drawing on mixed NHSCR/PDS data with known discontinuities, but compounds this problem by using a longer time-series than the five-years used by ONS to project all other elements of subnational population change, making the projection less sensitive to more recent changes in migration trends.
3.36 Some submissions to the public consultation on the Wirral Local Plan refer to other variant projections issued by ONS which explore the impact of alternative assumptions about the rate of net immigration into the UK and, hence, into each local authority. These variants are not considered here for two reasons. First, adoption of an immigration-based variant would involve challenging the officially accepted principal population projection for the United Kingdom. Second, the purpose of a projection (as opposed to a forecast) is to examine the impact of current trends continuing on into the future. The immigration-based variants are instead speculations of what would happen if current trends did not continue.
Implications for household projections
3.37 In summary, in the absence of any other evidence to the contrary, the 2018-based principal projection is the current best projection of Wirral’s future population, using the most up-to-date data and estimation techniques. However, the strikingly close alignment between the 2014- and 2018-based principal projections suggests that using the 2014-based projection for planning purposes, as required by MHCLG, will make little material difference.
3.38 The official 2018-based subnational projections have not yet been released. They are calculated using household representative rates to convert projected populations into projected households. Household representative rates take account of the way in which household sizes vary over a person’s life-course, from lone-person ‘bachelor pads’ through multi-person family homes (e.g. a couple plus their children) to two-person ‘empty nest’ and one-person ‘widower’ households. Hence, they help convert populations into households in a way which more accurately reflects that population’s underlying age structure, which is important when faced with a population that is ageing over time.
3.39 As Figure 19 shows, the 2014- and 2018-based projected age structures for Wirral’s population in 2035 are very similar. This, combined with the near identical projected population total for 2035, strongly suggests that the 2018-based subnational household projection for Wirral, when published, will look very similar to the already published 2014-based household projection that MHCLG

CONCLUSIONS | 21
currently requires local planning authorities to use when assessing local housing need.
Conclusions: Does Wirral experience ‘exceptional local circumstances’?
4.1 In the preceding two sections of this report we have considered, firstly, how Wirral relates to the full set of English local authorities with regard to the ingredients that comprise the standard method and, secondly, the impact of considering different base years for the projection of household formation.
4.2 With respect to the standard method for the computation of housing need, on many measures, Wirral is typical of the experience across English local authorities. Indeed, for some of the inputs to the standard methodology Wirral is the median authority (e.g. the net migration rate and the affordability ratio in 2016).
4.3 When the standard methodology is run for every local authority in the country Wirral is just eleven percentage points above the median. If this figure is placed in the context of the existing housing stock in Wirral the scale of housing need resulting from the standard methodology represents a 0.5% annual increase. This scale of growth places Wirral in the second bottom decile with respect to other English LPAs: the application of the standard method results in a greater proportionate increase in the existing housing stock for 86% of English local authorities.
4.4 The only cases where Wirral could be said to experience exceptional local circumstances are in
relation to some of the absolute measures (crude deaths, live births) but these are absolute values that reflect the fact that Wirral is a large and more populous LPA relative to other English LPAs. This can be seen in the discontinuity between the absolute number of households projected for Wirral (which places it in the top deciles) and this figure relative to the number of existing households (which places it in the second bottom decile).
4.5 In relation to projected household formation it can clearly be seen in Part Two of this report that short run deviations between the principal projections using the 2014 and 2018 ONS statistics give way to the two trends harmonising by 2035. Whilst there might be good academic reasons to use the most recently available statistics, using the mandated 2014 ONS projections result in no material difference for planning purposes.
4.6 On the basis of the evidence presented in this report it would be difficult to sustain the argument that Wirral experiences exceptional local circumstances when compared to other English local authorities.
Figure 19. Population age structure projected for 2035
Source: ONS 2014- and 2018-based subnational population projections

22 | EXPLORING THE COMPUTATION OF HOUSING NEED IN WIRRAL
Appendix A: Summary statistics for Wirral’s position with respect to the 326 local planning authorities in England for each of the inputs to the standard methodology
Input Variable Year 1. Value 2. Decile (1 to 10)
3. Percentile (1 to 100)
4. Rank (low to high) among 326 LPAs
Housing needs assessment by standard method
Y20/30 782.270 7 0.610 199
Standard method housing needs per annum relative to existing housing stock (per 1000 dwellings, 2018)
2018 5.273 2 0.138 45
Household projections for every two years (2014 base)
Y2014 142.525 10 0.948 309
Y2016 143.902 10 0.948 309
Y2018 145.403 10 0.942 307
Household projections for every two years (2016 base)
Y2014 141.349 10 0.951 310
Y2016 142.191 10 0.948 309
Y2018 143.012 10 0.945 308
Household projections for every 10 years (2014 base)
Y2001 134.516 10 0.960 313
Y2011 140.592 10 0.951 310
Y2021 147.669 10 0.942 307
Y2031 154.353 10 0.920 300
Household projections for every 10 years (2016 base)
Y2011 140.042 10 0.954 311
Y2021 144.216 10 0.939 306
Y2031 148.552 10 0.926 302
Y2041 152.062 10 0.917 299
10-year % change in household projection (2014 base)
Y20/30 0.047 2 0.138 45
Y01/11 0.045 2 0.159 52
Y11/21 0.050 2 0.153 50
Y21/31 0.045 2 0.141 46
10-year % change in household projection (2016 base)
Y20/30 0.030 1 0.098 32
Y11/21 0.030 1 0.083 27
Y21/31 0.030 2 0.101 33
Y31/41 0.024 1 0.092 30
Live births (count)
Y2014 3536.000 9 0.862 281
Y2016 3434.000 9 0.843 275
Y2018 3242.000 9 0.827 270
Table 1. Input variables summary table of LPA Wirral

APPENDIX A | 23
Input Variable Year 1. Value 2. Decile (1 to 10)
3. Percentile (1 to 100)
4. Rank (low to high) among 326 LPAs
Total fertility rate
Y2014 1.920 6 0.582 190
Y2016 1.880 5 0.477 156
Y2018 1.760 5 0.494 161
Deaths (count)
Y2014 3548 10 0.966 315
Y2016 3718 10 0.969 316
Y2018 3789 10 0.968 315
Crude death rate
Y2014 11.100 9 0.890 290
Y2016 11.600 9 0.883 288
Y2018 11.700 9 0.887 289
In-migration (count)
Y2014 8091.000 7 0.647 211
Y2016 7757.000 7 0.629 205
Y2018 8825.000 7 0.632 206
In-migration rate
Y2014 0.025 1 0.015 5
Y2016 0.024 1 0.003 1
Y2018 0.027 1 0.012 4
Out-migration (count)
Y2014 7497.000 7 0.635 207
Y2016 7304.000 7 0.607 198
Y2018 8174.000 6 0.589 192
Out-migration rate
Y2014 0.023 1 0.003 1
Y2016 0.023 1 0.006 2
Y2018 0.025 1 0.003 1
Net-migration
Y2014 594.000 8 0.727 237
Y2016 453.000 7 0.620 202
Y2018 651.000 7 0.678 221
Net-migration rate
Y2014 0.002 5 0.500 163
Y2016 0.001 5 0.448 146
Y2018 0.002 5 0.482 157
Median house prices (£ thousands)
Y2014 138.988 3 0.231 75
Y2016 148.113 2 0.199 65
Y2018 159.500 2 0.189 62
Two-year % change in median house price
Y14/16 0.066 2 0.125 41
Y16/18 0.077 3 0.269 88
Median gross annual income (£ thousands)
Y2014 24971.000 5 0.407 133
Y2016 26320.000 5 0.481 157
Y2018 25655.000 3 0.228 74

24 | EXPLORING THE COMPUTATION OF HOUSING NEED IN WIRRAL
Input Variable Year 1. Value 2. Decile (1 to 10)
3. Percentile (1 to 100)
4. Rank (low to high) among 326 LPAs
Two-year % change in median income
Y14/16 0.054 6 0.599 195
Y16/18 -0.025 1 0.077 25
Affordability ratios
Y2014 5.600 4 0.396 129
Y2016 5.700 6 0.506 165
Y2018 6.280 6 0.564 184
Two-year % change in affordability ratios
Y14/16 0.018 2 0.164 53
Y16/18 0.102 8 0.759 247
Input variable YearDecile 1 - 10 (1 decile = 10 Percentiles)
1 2 3 4 5 6 7 8 9 10
Housing needs assessment by standard method
Y20/30 0.610
Standard method housing needs per annum relative to existing housing stock (per 1000 dwellings, 2018)
2018 0.138
Household projections for every two years (2014 base)
Y2014 0.948
Y2016 0.948
Y2018 0.942
Household projections for every two years (2016 base)
Y2014 0.951
Y2016 0.948
Y2018 0.945
Household projections for every 10 years (2014 base)
Y2001 0.960
Y2011 0.951
Y2021 0.942
Y2031 0.920
Household projections for every 10 years (2016 base)
Y2011 0.954
Y2021 0.939
Y2031 0.926
Y2041 0.917
Table 2. The percentiles of the input variables from housing assessment for LPA Wirral in corresponding deciles

APPENDIX A | 25
Input variable YearDecile 1 - 10 (1 decile = 10 Percentiles)
1 2 3 4 5 6 7 8 9 10
10-year % change in household projection (2014 base)
Y20/30 0.138
Y01/11 0.159
Y11/21 0.153
Y21/31 0.141
10-year % change in household projection (2016 base)
Y20/30 0.098
Y11/21 0.083
Y21/31 0.101
Y31/41 0.092
Live births (count)
Y2014 0.862
Y2016 0.843
Y2018 0.827
Total fertility rate
Y2014 0.582
Y2016 0.477
Y2018 0.494
Deaths (count)
Y2014 0.966
Y2016 0.969
Y2018 0.968
Crude death rate
Y2014 0.890
Y2016 0.883
Y2018 0.887
In-migration (count)
Y2014 0.647
Y2016 0.629
Y2018 0.632
In-migration rate
Y2014 0.015
Y2016 0.003
Y2018 0.012
Out-migration (count)
Y2014 0.635
Y2016 0.607
Y2018 0.589

26 | EXPLORING THE COMPUTATION OF HOUSING NEED IN WIRRAL
Input variable YearDecile 1 - 10 (1 decile = 10 Percentiles)
1 2 3 4 5 6 7 8 9 10
Out-migration rate
Y2014 0.003
Y2016 0.006
Y2018 0.003
Net-migration
Y2014 0.727
Y2016 0.620
Y2018 0.678
Net-migration rate
Y2014 0.500
Y2016 0.448
Y2018 0.482
Median house prices (£ thousands)
Y2014 0.231
Y2016 0.199
Y2018 0.189
Two-year % change in median house price
Y14/16 0.125
Y16/18 0.269
Median gross annual income (£ thousands)
Y2014 0.407
Y2016 0.481
Y2018 0.228
Two-year % change in median income
Y14/16 0.599
Y16/18 0.077
Affordability ratios
Y2014 0.396
Y2016 0.506
Y2018 0.564
Two-year % change in affordability ratios
Y14/16 0.164
Y16/18 0.759
Note: Where the value of the variable for Wirral falls into the most outlying categories - the first or last decile – the cell is shaded red. Where the borough falls into the next two deciles (11-30% and 71-90%) the cell is shaded yellow. Finally, the two deciles surrounding the median (31-70%) are shaded green.

APPENDIX B | 27
Adur Castle Point Enfield King's Lynn and West Norfolk
Northampton South Cambridgeshire
Tonbridge and Malling
Allerdale Central Bedfordshire
Epping Forest Kingston upon Hull, City of
Northumberland South Derbyshire
Torbay
Amber Valley Charnwood Epsom and Ewell
Kingston upon Thames
Norwich South Gloucestershire
Torridge
Arun Chelmsford Erewash Kirklees Nottingham South Hams Tower Hamlets
Ashfield Cheltenham Exeter Knowsley Nuneaton and Bedworth
South Holland Trafford
Ashford Cherwell Fareham Lambeth Oadby and Wigston
South Kesteven Tunbridge Wells
Aylesbury Vale Cheshire East Fenland Lancaster Oldham South Lakeland Uttlesford
Babergh Cheshire West and Chester
Forest Heath Leeds Oxford South Norfolk Vale of White Horse
Barking and Dagenham
Chesterfield Forest of Dean Leicester Pendle South Northamptonshire
Wakefield
Barnet Chichester Fylde Lewes Peterborough South Oxfordshire
Walsall
Barnsley Chiltern Gateshead Lewisham Plymouth South Ribble Waltham Forest
Barrow-in-Furness
Chorley Gedling Lichfield Poole South Somerset Wandsworth
Basildon Christchurch Gloucester Lincoln Portsmouth South Staffordshire
Warrington
Basingstoke and Deane
City of London Gosport Liverpool Preston South Tyneside Warwick
Bassetlaw Colchester Gravesham Luton Purbeck Southampton Watford
Bath and North East Somerset
Copeland Great Yarmouth Maidstone Reading Southend-on-Sea
Waveney
Bedford Corby Greenwich Maldon Redbridge Southwark Waverley
Bexley Cornwall Guildford Malvern Hills Redcar and Cleveland
Spelthorne Wealden
Appendix B: List of Local Planning Authorities in England

28 | EXPLORING THE COMPUTATION OF HOUSING NEED IN WIRRAL
Birmingham Cotswold Hackney Manchester Redditch St Albans Wellingborough
Blaby County Durham Halton Mansfield Reigate and Banstead
St Edmundsbury
Welwyn Hatfield
Blackburn with Darwen
Coventry Hambleton Medway Ribble Valley St. Helens West Berkshire
Blackpool Craven Hammersmith and Fulham
Melton Richmond upon Thames
Stafford West Devon
Bolsover Crawley Harborough Mendip Richmondshire Staffordshire Moorlands
West Dorset
Bolton Croydon Haringey Merton Rochdale Stevenage West Lancashire
Boston Dacorum Harlow Mid Devon Rochford Stockport West Lindsey
Bournemouth Darlington Harrogate Mid Suffolk Rossendale Stockton-on-Tees
West Oxfordshire
Bracknell Forest
Dartford Harrow Mid Sussex Rother Stoke-on-Trent West Somerset
Bradford Daventry Hart Middlesbrough Rotherham Stratford-on-Avon
Westminster
Braintree Derby Hartlepool Milton Keynes Rugby Stroud Weymouth and Portland
Breckland Derbyshire Dales
Hastings Mole Valley Runnymede Suffolk Coastal Wigan
Brent Doncaster Havant New Forest Rushcliffe Sunderland Wiltshire
Brentwood Dover Havering Newark and Sherwood
Rushmoor Surrey Heath Winchester
Brighton and Hove
Dudley Herefordshire, County of
Newcastle upon Tyne
Rutland Sutton Windsor and Maidenhead
Bristol, City of Ealing Hertsmere Newcastle-under-Lyme
Ryedale Swale Wirral
Broadland East Cambridgeshire
High Peak Newham Salford Swindon Woking
Bromley East Devon Hillingdon North Devon Sandwell Tameside Wokingham

APPENDIX B | 29
Bromsgrove East Dorset Hinckley and Bosworth
North Dorset Scarborough Tamworth Wolverhampton
Broxbourne East Hampshire Horsham North East Derbyshire
Sedgemoor Tandridge Worcester
Broxtowe East Hertfordshire
Hounslow North East Lincolnshire
Sefton Taunton Deane Worthing
Burnley East Lindsey Huntingdonshire North Hertfordshire
Selby Teignbridge Wychavon
Bury East Northamptonshire
Hyndburn North Kesteven Sevenoaks Telford and Wrekin
Wycombe
Calderdale East Riding of Yorkshire
Ipswich North Lincolnshire
Sheffield Tendring Wyre
Cambridge East Staffordshire
Isle of Wight North Norfolk Shepway Test Valley Wyre Forest
Camden Eastbourne Isles of Scilly North Somerset Shropshire Tewkesbury York
Cannock Chase Eastleigh Islington North Tyneside Slough Thanet
Canterbury Eden Kensington and Chelsea
North Warwickshire
Solihull Three Rivers
Carlisle Elmbridge Kettering North West Leicestershire
South Bucks Thurrock

30 | EXPLORING THE COMPUTATION OF HOUSING NEED IN WIRRAL
References
Baker, K. (2020) Report to Sevenoaks District Council. Sevenoaks District Council. Available at: h t t p s : / / w w w . s e v e n o a k s . g o v . u k / d o w n l o a d s / fi l e / 2 8 9 3 / s e v e n o a k s _ fi n a l _ r e p o r t . Accessed 27th March 2020.
Bramley, G. et al. (2010) Estimating Housing Need: Research report, Communities and Local Government, UK.
Bramley, G. (2018) Housing supply requirements across Great Britain: for low- income households and homeless people, December 2018, A report for Crisis, available at: https://www.crisis.org.uk/media/239700/crisis_housing_supply_requirements_across_great_britain_2018.pdf
BBC (2020) Housing shortage. Scale of UK’s housing gap revealed. BBC Online. Available at: https://www.bbc.co.uk/news/business-51605912 Accessed 23rd February 2020.
Gould, G. (2019) Appeal decisions ref. APP/P0240/W/18/3206495 and ref: APP/P0240/W/19/3220640. Planning Inspectorate, available at: https://acp.planninginspectorate.gov.uk/ViewCase.aspx?caseid=3206495 Accessed 23rd March 2020.
House of Commons Communities and Local Government Committee (2018) Housing for Older people. House of Commons: London. Available at: h t t p s : / / p u b l i c a t i o n s p a r l i a m e n t . u k / p a / c m 2 0 1 7 1 9 / c m s e l e c t / c m c o m l o c / 3 7 0 / 3 7 0 . p d f
Maclennan, D. (1986), The Demand for Housing: An Economics Perspective, Edinburgh, Scottish Development Department.
MHCLG (2018) Dwelling stock. Number of dwellings by tenure and district in England, 2018. Live Table 100. Available at: h t t p s : / / w w w . g o v . u k / g o v e r n m e n t / s t a t i s t i c a l - d a t a - s e t s / l i v e - t a b l e s - o n - d w e l l i n g - s t o c k - i n c l u d i n g - v a c a n t s Accessed 27th March 2020.
MHCLG (2019) Guidance: Housing and Economic Needs Assessment. Ministry for Housing, Communities and Local Government: London. Available at: h t t p s : / / w w w . g o v . u k / g u i d a n c e / h o u s i n g - a n d - e c o n o m i c - d e v e l o p m e n t - n e e d s - a s s e s s m e n t s Accessed 20th February 2020.
Norman, R. (2019) Appeal decision ref. APP/P0240/W/18/3218992. Planning Inspectorate, available at: https://acp.planninginspectorate.gov.uk/ViewCase.aspx?caseid=3206495 Accessed 23rd March 2020.
ONS (2018a) Household projections in England:
2016-based, Statistical bulletin, Office for National Statis-tics, Titchfield. h t t p s : / / w w w . o n s . g o v . u k / p e o p l e p o p u l a t i o n a n d c o m m u n i t y / p o p u l a t i o n a n d m i g r a t i o n / p o p u l a t i o n p r o j e c t i o n s / b u l l e t i n s / 2 0 1 6 b a s e d h o u s e h o l d p r o j e c t i o n s i n e n g l a n d / 2 0 1 6 b a s e d h o u s e h o l d p r o j e c t i o n s i n e n g l a n d . Accessed 25th January 2020.
ONS (2018b) Household projections for England, compar-isons with other sources: 2001 to 2018, Office for National Statistics, London. h t t p s : / / w w w . o n s . g o v . u k / p e o p l e p o p u l a t i o n a n d c o m m u n i t y / p o p u l a t i o n a n d m i g r a t i o n / p o p u l a t i o n p r o j e c t i o n s / a r t i c l e s / h o u s e h o l d p r o j e c t i o n s f o r e n g l a n d c o m p a r i s o n s w i t h o t h e r s o u r c e s / 2 0 0 1 t o 2 0 1 8 Accessed 25th January 2020.
ONS (2018c) Births in England and Wales: 2018, Office for National Statistics. h t t p s : / / w w w . o n s . g o v . u k / p e o p l e p o p u l a t i o n a n d c o m m u n i t y / b i r t h s d e a t h s a n d m a r r i a g e s / l i v e b i r t h s / b u l l e t i n s / b i r t h s u m m a r y t a b l e s e n g l a n d a n d w a l e s / 2 0 1 8
Simpson (2018) An objective assessment of the latest ONS Household Projections for Wirral Metropolitan Borough
Williamson, P., Lord, A. and Dunning R. (2018) Evaluating the validity of the population and household projections underpinning the Wirral Local Plan: a response to public submissions. Wirral MBC. Available at: h t t p s : / / w w w . w i r r a l . g o v . u k / p l a n n i n g - a n d - b u i l d i n g / l o c a l - p l a n s - a n d - p l a n n i n g - p o l i c y / l o c a l - p l a n n i n g - e v i d e n c e - a n d - r e s e a r c h - r e p o r t - 1 3
Wilson, W. and Barton, C. (2018) Tackling the under-supply of housing in Britain. House of Commons Library Briefing Paper 07671, 12th December 2018.

| 31

32 | EXPLORING THE COMPUTATION OF HOUSING NEED IN WIRRAL