Embed Size (px)
Citation preview
Exploring the Challenges of Climate Science Literacy:Lessons from Students, Teachers and Lifelong Learners
Lesley-Ann L. Dupigny-Giroux*Department of Geography, University of Vermont
Abstract
Today more than ever, being climate literate is a critical skill and knowledge area that influencesour interaction with the environment around us, our understanding of scientific news and thedaily decisions that we make. Yet, the term climate literacy can be misunderstood, as are the termsweather, climate and climate variability. This article surveys the existing literature and highlightssix challenges to achieving a climate literate citizenry in both formal and informal or lifelonglearning. The lessons learned from high school and undergraduate students, teachers and lifelonglearners, many of whom are retired, serve as the threads which are woven into a tapestry of strate-gies for embedding climate science principles across entire school curricula as well as society atlarge.
Introduction
Science literacy in general refers to the knowledge, skills and attitudes needed to applyinquiry or problem-based approaches to new situations and decision making. It can begeared towards student learning in science, mathematics and technology, as in the case ofthe American Association for the Advancement of Science’s (AAAS 1993) Benchmarksfor Science Literacy, adult or lifelong learners only, or everyone as identified in theAAAS’ (1989) Science for All Americans. Over the last decade, geoscience literacy hasemerged as a particular area of interest and concern within the larger framework of sci-ence literacy. Out of the conversations among federal agencies, funding sources, univer-sity educators and scientists, a number of organising frameworks have coalesced aroundocean literary (Ocean Literacy, 2005), earth science literacy (Earth Science Literacy Prin-ciples, 2009), atmospheric science literacy (Atmospheric Science Literacy, 2008) and cli-mate literacy (2009).
Many of these literacy frameworks were developed primarily for the formal educationstructure with benchmarks and principles appropriate to elementary and secondary schoolstudents. Hoffman and Barstow (2007) reviewed the implementation of these literacyframeworks in the United States and concluded that in general, significant improvementswere needed across the United States in Earth System science education. In particular,the incorporation of the atmosphere, weather and climate into state standards was medio-cre with 30, twelve and eight states directly, indirectly or failing to address these conceptsrespectively.
While climate literacy encompasses many of the tenets outlined in the AAAS’ (1989) Sci-ence for All Americans document, it is a distinct subset of science literacy in a number ofways. Climate science examines the dynamics and interactions among the atmosphere, landand ocean systems at varying spatial and temporal scales, using methods that draw uponstatistics, modelling, visualisation and geospatial technologies to name a few. Climate
Geography Compass 4/9 (2010): 1203–1217, 10.1111/j.1749-8198.2010.00368.x
ª 2010 The AuthorGeography Compass ª 2010 Blackwell Publishing Ltd
literacy is also concerned with the complexity and interconnectedness ofhydrometeorologic patterns (e.g. droughts, cold spells) over space and time, the role thathumans exert and the ability to ‘act accordingly’ having understood the above, as well asthe recognition of bias or the change in behaviour due to a deeper appreciation of an issueor concept (Dupigny-Giroux 2008:483). The Essential Principles of Climate Science Liter-acy (US Global Change Research Program. 2009) were developed through a collaborativeprocess among a number of science agencies, scientists, educators, non-governmental agen-cies and U.S. governmental agencies including NOAA (National Oceanic and AtmosphericAdministration), AAAS and the National Science Foundation (NSF). It states that
People who are climate science literate know that climate science can inform our decisions thatimprove quality of life. They have a basic understanding of the climate system, including thenatural and human-caused factors that affect it. Climate science literate individuals understandhow climate observations and records as well as computer modeling contribute to scientificknowledge about climate. They are aware of the fundamental relationship between climate andhuman life and the many ways in which climate has always played a role in human health.They have the ability to assess the validity of scientific arguments about climate and to use thatinformation to support their decisions.
Recently, climate literacy has received special notice from both the formal and informalsectors alike, as public attention has been captured by anthropogenic climate change,deadly heat waves in Europe and the impact of El Nino on coastal storms. At the sametime, a number of journals have dedicated special issues to the topic of climate literacyand the understanding of weather, climate and climate change concepts. These includethe December 2008 issue of Physical Geography guest edited by Dupigny-Giroux (2008)and the Special Issue on Climate Change Communication of the International Journal ofSustainability Communication guest edited by Maibach (2008). Other complementary publi-cations include the use of mental models to quantify seventh grade students’ understand-ing of the greenhouse effect (Shepardson et al. 2009); the thematic overview of publicopinion, perception and understanding of global climate change (Leiserowitz 2007) as afunction of their beliefs, motivations, risk perception and other behavioural characteristics(Maibach et al. 2009); a presentation about children’s weather misconceptions at theNational Association of Research in Science Teaching (Henriques 2000); and the urgencyand rationale for reaching informal or lifelong learners (Stephens and Graham 2008).
These studies are important in presenting facets of climate literacy from the viewpointsof certain populations (e.g. children or students) or themes (e.g. climate change). Theyalso highlight key barriers to understanding and knowledge creation such as the role ofperception, beliefs, country of origin and the phrasing of survey questions. A recent solic-itation from the National Science Foundation’s Geoscience Education program high-lighted additional obstacles to climate and geoscience literacy including state and localcurricular constraints that lead to uneven depth and content coverage (Stevermer et al.2007); lack of content knowledge among elementary and secondary school teachers(Hoffman and Barstow 2007) and; the difficulties in surmounting student misconceptionsand preconceptions in the face of complex Earth processes at varying spatial and temporalscales.
The goal of this article is to synthesise these recurring themes and to combine them withthe content analysis of surveys and observations made by the author to deconstruct the majorobstacles to achieving a climate literate citizenry and suggest remedial strategies. These quali-tative data were acquired over the last decade from Grade 11 high school students, introduc-tory undergraduate classes at the University of Vermont, elementary and secondary school
1204 Challenges to addressing climate science literacy
ª 2010 The Author Geography Compass 4/9 (2010): 1203–1217, 10.1111/j.1749-8198.2010.00368.xGeography Compass ª 2010 Blackwell Publishing Ltd
teachers in Vermont and presentations to lifelong learners. The latter are also called informallearners or K-gray (kindergarten to gray) learners, representing anyone who is not part of aformal education structure.
Challenge 1: The Language of the Climate Sciences
Like other natural and physical sciences, the climate sciences use specific vocabulary, ter-minology and methods (see the American Meteorological Society (AMS, 2000) onlineGlossary of Meteorology) that are clearly understood by practitioners of the atmosphericsciences, but whose subtleties may not be as transparent to those in other disciplines or tothe lay public in general. Hassol (2008:106) refers to such jargon as scientists ‘speaking incode’. The first 4–5 weeks of introductory meteorology or climate sciences classes tendto be devoted to the linear acquisition of this vocabulary or terminology, before inquiry-based activities or other learning strategies are used. In much the same way as learning asecond or third language, these newly acquired terms and concepts must be placed intheir proper context and practised often. Student and teacher comments alike reflect thisstruggle with new terms:
… there are many names and concepts that seem foreign to me and hard to remember.I think for any gender, vocabulary is the most challenging part and being able to remember keyterms and explaining them correctly.
The use of metaphors to aid the learning of this vocabulary often leads to the ‘badscience’ or ‘bad meteorology’ so eloquently elucidated by Harrington (2008) in his expla-nation of the origins of commonly held misconceptions in the climate and atmosphericsciences. The processes operating in the greenhouse effect are a common example of themisuse of explanatory terminology leading to misconceptions. Students are often unableto grasp the difference between the shortwave radiation emitted by the Sun that isabsorbed by the Earth and re-emitted as longwave radiation, due to the very differenttemperatures of the two bodies. This is exacerbated by explaining the role of clouds andatmospheric gases such as water vapour and carbon dioxide as ‘trapping heat’ or ‘bounc-ing back energy’, instead of referring to their absorption and re-emission of the terrestrialor longwave radiation. Such language misuse conjures up mental images of a physical lidon the atmosphere below which the ‘trapped heat’ circulates like water boiling in a potwith its lid in place. Shepardson et al. (2009) present an in-depth look at the constructionof such mental models and their origins.
Even more fundamental is the concept of radiation itself. For an atmospheric scientist,radiation refers to the radiant energy emitted by a body such as the sun or the earth.However, the term radiation can conjure up images of nuclear energy or chemotherapytreatments making it critical to define key terms before lecturing or discussing subsequenttopics. As climate scientists, we are often unaware of how difficult it is to grasp abstractconcepts that cannot be readily visualised by students or which are outside their realm ofdirect experience. Thus, although the notion of the earth’s rotation on its axis whilerevolving around the Sun giving us the four astronomical seasons is the first tenet of theClimate Literacy Principles (U.S. Global Change Research Program 2009), undergraduatestudent feedback sheds light on their struggles:
The Earth’s rotation is a harder to grasp, however, because it seems to lack the face-to-faceexample. The geographical concepts that have comprehensible, smaller versions are not as hard
Challenges to addressing climate science literacy 1205
ª 2010 The Author Geography Compass 4/9 (2010): 1203–1217, 10.1111/j.1749-8198.2010.00368.xGeography Compass ª 2010 Blackwell Publishing Ltd
as astronomical concepts. The concepts that lack imaginable proportion expand into a realmthat feels abstract, almost made-up.I had a very hard time spatially picturing the earth in reference to its orbit around the sun, rota-tion, and angle position according to the seasons. Geometry has been a struggle of mine sincehigh school and putting an image to angles and degrees is my biggest weakness.
At the root of it all is the fuzzy understanding among non-atmospheric scientists of the dif-ferences between weather and climate, the processes involved and the temporal and spatialtimescales over which atmospheric events evolve (Dupigny-Giroux 2008). Weather is cha-otic, dynamic and non-linear in nature while climate is deterministic. Both are intercon-nected systems with inherent uncertainties. Feedback loops in the land–ocean–atmospherecan act to enhance observed changes or to suppress them. Local climates which areobserved on the order of square centimetres (plant microclimates) or square kilometres(urban microclimates), are in turn influenced by regional and ultimately global climates,but modified by local characteristics such as topography, surface cover and boundary layerdynamics. When these interconnections are not fully understood, weather and climateeither become interchangeable concepts or synonymous with only one variable or processsuch as temperature and precipitation, climate change, the carbon cycle or extreme eventssuch as tornadoes or tsunamis. However, when undergraduate students fully grasp themany interconnected facets of the land–ocean–atmosphere system, they comment that ‘Iam also more conscious of the fact that learning about climate is not all learning about cli-mate change and there are a lot of different topics that make up climate.’
Challenge 2: The Role of Misconceptions
Climate science misconceptions have been well studied in the past (e.g. Harrington 2008;Hendriques 2000; McCaffrey and Buhr 2008; Shepardson et al. 2009). Among the mostprevalent are (i) the Ozone hole causes or exacerbates global warming, (ii) the use of thethree-cell model to explain global atmospheric circulation (Harrington 2008), (iii) thatseasons result from the Earth–Sun distance changing over the course of the year (McCaf-frey and Buhr 2008), (iv) the distinction between weather and climate, the processesinvolved and scales over which these operate, (v) why clouds exist or that raindrops aretear-shaped (Hendriques 2000) and (vi) urban sprawl, deforestation and canal dredgingare evidence of climate change.
Of these, the ozone hole causing global warming misconception is particularly deeplyengrained. An example of this was extracted from two assignments given to the introduc-tory physical geography course called Weather, Climate and Landscapes (hereafterreferred to as WCL) in Fall 2009. The first was a reflective journaling exercise based on aScience article about the new Environmental Protection Agency (EPA) standard for tropo-spheric ozone levels. Students were then exposed to the concepts of the vertical profileof the atmosphere; the difference between the stratosphere and troposphere; and theabsorption of ultraviolet radiation by stratospheric ozone versus the longwave or terrestrialradiation absorbed by tropospheric ozone. On the midterm examination, students werethen asked to list two wavelengths that are shorter than visible light, as well as to describe‘two consequences of a thinner ozone shield in the stratosphere’. While over 75% of theclass was able to identify ultraviolet, gamma rays or X-rays as shortwave radiation, only13% (twenty students) correctly identified consequences such as skin cancer and vegeta-tion damage as resulting from a thinner stratospheric ozone shield. The other 87% of stu-dent responses included ‘global warming’, ‘global climate change’, polar bear mortality
1206 Challenges to addressing climate science literacy
ª 2010 The Author Geography Compass 4/9 (2010): 1203–1217, 10.1111/j.1749-8198.2010.00368.xGeography Compass ª 2010 Blackwell Publishing Ltd
and ice cap melting due to stratospheric ozone depletion, an alarming percentage whichhas remained unchanged over the last 5 years of offering this class.
The root of this ozone hole ⁄global warming misconception is that many perceivestratospheric ozone depletion to be an actual hole through which longwave radiation is lostto space. Or as one lifelong learner wrote ‘The Ozone hole allows in more radiation, act-ing as a catalyst for climate change.’ This is a classic example of a concept that is resistantto instructional remediation (Chi 2005), making it imperative that the misconception beavoided altogether. Hendriques (2000) identifies some possible sources of misconceptionsincluding textbook diagrams, verbal explanations, personal observations and the storiesrecounted to young children.
Challenge 3: Where in the Curriculum?
One of the most fundamental challenges in creating a climate literate citizenry is theimparting of the fundamental concepts and understandings in such a way that is age-appropriate for a given audience (formal and informal), and which can be built uponthrough life-long learning experiences. Traditionally, since climatology is one of thepillars of physical geography, weather and climate principles tend to be found in geogra-phy, social studies or earth science curricula. However, the timing and scope of this con-tent delivery is far from uniform. In some school districts, neither geography nor earth istaught in the elementary or secondary school curriculum. In other cases, students areexposed to weather at the elementary ⁄primary levels, while others take an earth scienceor environmental science class in high school only. For many others, an undergraduategeography or meteorology class is their first exposure to climate science basics. With thisnewly acquired content knowledge, undergraduates in the WCL class spoke about theneed to make this material accessible to everyone:
This class has helped tremendously with the clarification of terms and concepts that should becommon knowledge in my eyes.Considering the fact that my everyday life consists of weather, climate and landscape, I can’tbelieve I had such little knowledge of the formation of thunderstorms, precipitation, blue skiesand every other physical geographical experience I encounter.
Exposure to weather and climate principles in primary and secondary school increasedstudent understanding and comfort level with these concepts at the tertiary level, givingthem an advantage over other classmates. They report that:
I found the composition of the atmosphere and radiation, heat transport and temperature unitseasiest to understand and absorb quickly. It may have been because I was exposed to this mate-rial in my earlier schooling.I had little background in the realm of climate prior to taking this class, and I wish that I had alittle bit more to fall back on to make up for moments when I struggled.
However, as Dupigny-Giroux (2008:483) noted, ‘not everyone will have the benefit ofhaving taken a climate-related class as part of their undergraduate studies’, an AdvancedPlacement (AP) Environmental Science class in their final year of high school or geogra-phy ⁄earth science content at the elementary levels. One way to address this challenge is toembed core climate concepts in other science and math classes in an integrated mannerthat supports the larger framework being taught. Core principles that transcend disciplinaryscience boundaries include radiation, temperature, motion, pressure difference, gradientsand acceleration to name a few. An example of a teacher professional development pro-
Challenges to addressing climate science literacy 1207
ª 2010 The Author Geography Compass 4/9 (2010): 1203–1217, 10.1111/j.1749-8198.2010.00368.xGeography Compass ª 2010 Blackwell Publishing Ltd
gram that is testing this transdisciplinary climate content dissemination is the Satellites,Weather and Climate (SWAC) program at the University of Vermont. Participatingmiddle school and high school teachers come from social science, earth science, chemistry,physics and biology backgrounds and are working within a constructivist, problem-based,inquiry-based framework to embed core climate concepts into their respective curricula.SWAC’s use of remote sensing to focus on the atmosphere–land–ocean system sets it apartfrom other atmospheric ⁄ climate programs such as EARTHSTORM, COMET (Jacksonand Carr 1995), GLOBE, CERES S’COOL (Chambers et al. 2002), Project DataStreme,Project ATMOSPHERE (Ginger et al. 1996) and the Oklahoma Climate Survey’s climatetraining workshops (Shafer et al. 2009).
Apart from teacher professional development, another tenet of the SWAC program ismaking weather and climate accessible at an early age. Introducing weather and climateconcepts in an inquiry-based setting allows educators to capitalise on children’s naturalcuriosity about the environment around them, while drawing upon the Nature of Sci-ence literature (see AAAS’ Science for all Americans, 1989). We cannot underestimatethe early experiences of children in this realm. One student in reflecting upon her fear oftornadoes touching down in her Massachusetts hometown wrote that ‘If I had takenGeography 040 [WCL] when I was a child, it would have saved me years of restlessnights.’ Other undergraduate comments include:
In second grade Tom Messner spoke to my class, which I have never forgotten, as he explainedall about the way the ‘weather man’ does his job.I remember learning a song back in elementary school, ‘cumulus, cirrus, nimbus, stratus, thoseare the clouds that come right at us!I remember keeping a cloud journal and memorizing the different types of clouds that exist inour atmosphere. To this day, I remember all the different types of clouds because of my seventhgrade teacher.
Challenge 4: The Importance of Learning Styles
There are number of learning style models to summarise the preferences by which welearn and process information. Four commonly used ones are the Myers–Briggs TypeIndicator, Kolb’s Learning Style Model, Hermann Brain Dominance Instrument andFelder–Silverman Learning Style Model (Felder 1996). The author has used the Kolb’s(1984, 1985) Learning Style Model with undergraduate students who display a preferencefor concrete experience, abstract conceptualisation, active experimentation or reflective observation.Educators should be aware of the mixture of learning styles present in their classroom(s)so that the techniques and methods of delivery used address both the preferred styles ofstudents as well as their less preferred styles, allowing them to develop ‘mental dexterity’in learning (Felder 1996). This is critically important in cases where one learning prefer-ence dominates the student population and goes beyond best practices for science teach-ing. As Karstens et al. (2009) demonstrate, there are approaches and perspectives that setgeoscientists apart in their study of the earth as a system. These include the notion that‘feedback loops function as a threshold concept’; learning in the field leads to ‘professionalvision’; spatial thinking and the notion some students are spatially challenged; and geosci-entists’ experiences, approaches and values lead them to problem-solve in a connected,interdisciplinary way. The fact that some students may be spatially challenged will influ-ence their ability to conceptualise many geoscience and climate science phenomena thatare two-dimensional and three-dimensional in nature.
1208 Challenges to addressing climate science literacy
ª 2010 The Author Geography Compass 4/9 (2010): 1203–1217, 10.1111/j.1749-8198.2010.00368.xGeography Compass ª 2010 Blackwell Publishing Ltd
Reflective journaling exercises assigned in the WCL class revealed that over 50% ofthe students were concrete experience learners. Such learners rely on feeling-based pro-cessing and are often the most creative writers in the class. For them, a visual aid such asa graph or a thematic diagram may be understood when presented in class, but without adirect connection to their senses, does not become internalised and lead to the produc-tion of new knowledge. Thus, while an abstract conceptualiser student would intuitivelyunderstand the concept of dew point temperatures from a saturation vapour pressurecurve diagram, a concrete experience student would prefer to visualise standing in theearly morning dew with swirling mist and cool temperatures. Similarly, while numerical-and factual-based evaluations may adequately test the knowledge and understanding ofabstract conceptualisers and reflective observers, other forms are also valid for concreteexperience learners. As one such student wrote, ‘when provided with the chance toexplore all of the information we have learned over the semester in essay form I wasmore than excited.’
This understanding of learning styles has implications for our roles as educators asmotivator, expert, coach or non-interventionist. It also has implications for deconstruct-ing observed trends in climate science learning where a linear approach is often usedfor the explanatory diagrams and constructs taught. As aforementioned, abstract con-cepts such as radiation and earth–sun relationships can be challenging for students, espe-cially when these foundational concepts are taught at the beginning of many physicalgeography ⁄earth science classes. In addition in recent years, there seems to be anincreasing inability on the part of students to conceptualise processes in three-dimen-sional space. Three-dimensional processing forms the backbone of many core andapplied concepts in the atmospheric sciences, with examples ranging from multilevelozone and atmospheric stability to global circulation patterns. Finally, there is anincreasing reliance by students on animations and simulations (over static black ⁄whiteor colour diagrams) to explain concepts that involve motion such as convection cur-rents or the Coriolis force. Where such aids are absent, kinesthetic learning allows stu-dents to ‘act out’ the various components of, for example, warm air colliding with coldair to form a cold front, or the development of wind as air moves from areas of highpressure to low pressure.
Challenge 5: Educators Can Make a Difference
The need for sufficient numbers of highly qualified Earth Science teachers in the K-12 work-force is a problem that has contributed to a lack of awareness of, and interest in, the geosciencesamong students. Geoscience Education Working Group II (2005:9)
Many US federal funding agencies including NASA, NOAA and the National ScienceFoundation continue to stress that educators are a critical link in addressing the challengesof climate science literacy. Not only can we stimulate student interest and begin theirprocess of lifelong learning, but in many cases, we as teachers are their first point of con-tact with weather and climate information. When asked the source of their climate infor-mation (see Challenge 6 for more detailed results), many 11th grade students respondedwith ‘my teacher’. Teacher enthusiasm can be contagious and spur students in unforeseenways. For example, 20% of the Fall 2009 WCL students chose to complete their termprojects on the influence of volcanic eruptions and sandstorms on weather and climates,because they had been so struck by the NASA MODIS images of Saharan dust plumesand recent volcanic eruptions shown on the first day of class. Like the 11th grade high
Challenges to addressing climate science literacy 1209
ª 2010 The Author Geography Compass 4/9 (2010): 1203–1217, 10.1111/j.1749-8198.2010.00368.xGeography Compass ª 2010 Blackwell Publishing Ltd
school students surveyed in 2009, these WCL undergraduates were previously unaware ofvolcanic activity as a contributor to climate variations.
As aforementioned, professional development programs assist teachers in acquiring thecontent knowledge and skills with which to effect change in their classrooms. SWACparticipating teachers report being ‘more enthusiastic in class’ with the newly acquiredcontent, ‘thrilled’ to use new applications like Google Earth in their classes and usingSWAC:
to design curriculum that is problem based and framed around essential questions and under-standings’ a design that ‘has added relevance, clarity, and organization to my weather unit.’ Inresponse to this shift ‘[s]tudents have appreciated this and have invested more time and energyinto their learning.
Such feedback from educators echoes the call made by the Geoscience Education Work-ing Group II (2005:21) that ‘[g]eoscience teachers need opportunities to gain content-areaknowledge so that they have the confidence to make changes in their lessons, goingbeyond the facts given in textbooks.’ The successful implementation of climate and otherknowledge is often constrained, however, by the lack of cohesion in the curricula orfragmented resources faced by European teachers (Uherek and Schuepbach 2008), a feel-ing of personal isolation and lack of preparation to impart climate science (Johnson et al.2008) and the need to ‘teach to the test’. Thus, given that a dedicated semester or year-long course on weather and climate may not be feasible at the primary and secondaryschool levels, core concepts should be embedded where appropriate in a whole-schoolmanner.
Challenge 6: The Role of Life Experience
The importance of one’s life experience surfaced from surveys distributed to lifelonglearners and other student groups whenever the author gave a climate-based talk, askingthem to comment on the source of their weather, climate and climate change informa-tion. Prior to this, elementary and secondary school teachers had been polled about theirperceptions of their students’ weather and climate knowledge, with responses rangingfrom watching the news or forecasts on television, the Weather Channel, science classes,folklore and familial knowledge among farming ⁄hunting families. The responses to theactual student and lifelong learner surveys provide insights into which high impact sourcescould or should be targeted by climate literacy professionals at various levels includingthe governmental organizations outlined in Niepold et al. (2008) or the U.S. NationalClimate Service discussed in Shafer (2008). As Arndt and LaDue (2008) have alreadynoted, the approaches and learning needs of lifelong or adult learners differ markedlyfrom school-aged students, and this becomes especially relevant for ongoing decision-making efforts and funding allocations that involve climate science knowledge and literacyin both the short and long terms.
Figures 1–5 summarise the responses to the question ‘What is the source of your globalwarming ⁄ climate change knowledge?’ among five different populations – 11th gradeenvironmental science high school students (in 2008 and 2009), introductory WorldRegional Geography undergraduates (2008), Focus the Nation climate teach-in attendees(2008) and staff at the University of Vermont (UVM) (2008). Striking qualitative andquantitative differences emerged across the populations. Student respondents, both highschool and undergraduates alike (24–57%), reported that most of their knowledge wasgained in previous classes, especially earth science and environmental science courses.
1210 Challenges to addressing climate science literacy
ª 2010 The Author Geography Compass 4/9 (2010): 1203–1217, 10.1111/j.1749-8198.2010.00368.xGeography Compass ª 2010 Blackwell Publishing Ltd
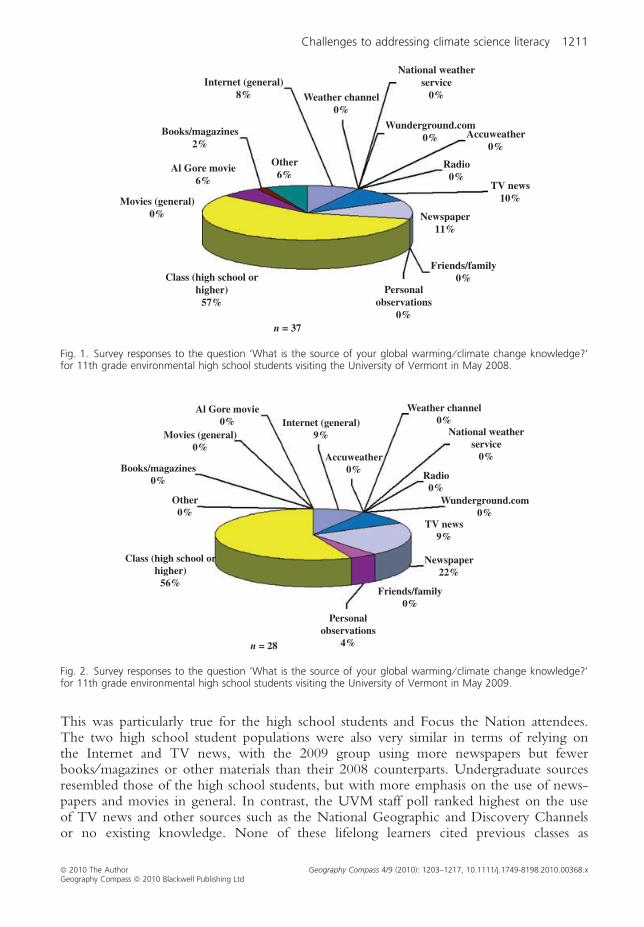
This was particularly true for the high school students and Focus the Nation attendees.The two high school student populations were also very similar in terms of relying onthe Internet and TV news, with the 2009 group using more newspapers but fewerbooks ⁄ magazines or other materials than their 2008 counterparts. Undergraduate sourcesresembled those of the high school students, but with more emphasis on the use of news-papers and movies in general. In contrast, the UVM staff poll ranked highest on the useof TV news and other sources such as the National Geographic and Discovery Channelsor no existing knowledge. None of these lifelong learners cited previous classes as
Internet (general)8%
Books/magazines2%
Al Gore movie6%
Movies (general)0%
Class (high school orhigher)
57%
n = 37
Personalobservations
0%
Friends/family0%
Newspaper11%
TV news10%
Radio0%
Accuweather0%
Wunderground.com0%
National weatherservice
0%Weather channel0%
Other6%
Fig. 1. Survey responses to the question ‘What is the source of your global warming ⁄ climate change knowledge?’for 11th grade environmental high school students visiting the University of Vermont in May 2008.
Internet (general)9%
Weather channel0%
Movies (general)0%
Accuweather0%
Radio0%
Wunderground.com0%
TV news9%
Newspaper22%
Friends/family0%
Personalobservations
4%n = 28
Class (high school orhigher)
56%
Other0%
Books/magazines0%
Al Gore movie0%
National weatherservice
0%
Fig. 2. Survey responses to the question ‘What is the source of your global warming ⁄ climate change knowledge?’for 11th grade environmental high school students visiting the University of Vermont in May 2009.
Challenges to addressing climate science literacy 1211
ª 2010 The Author Geography Compass 4/9 (2010): 1203–1217, 10.1111/j.1749-8198.2010.00368.xGeography Compass ª 2010 Blackwell Publishing Ltd
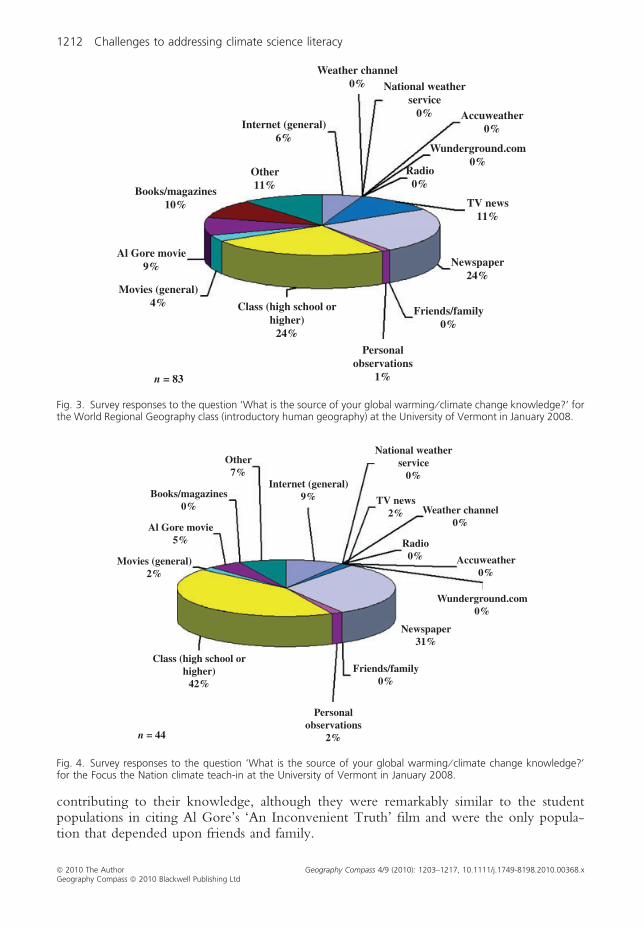
contributing to their knowledge, although they were remarkably similar to the studentpopulations in citing Al Gore’s ‘An Inconvenient Truth’ film and were the only popula-tion that depended upon friends and family.
Weather channel0% National weather
service0% Accuweather
0%
Wunderground.com0%
Radio0%
TV news11%
Newspaper24%
Friends/family0%
Personalobservations
1%
Class (high school orhigher)
24%
n = 83
Movies (general)4%
Al Gore movie9%
Books/magazines10%
Other11%
Internet (general)6%
Fig. 3. Survey responses to the question ‘What is the source of your global warming ⁄ climate change knowledge?’ forthe World Regional Geography class (introductory human geography) at the University of Vermont in January 2008.
Internet (general)9%
Other7%
Books/magazines0%
Al Gore movie5%
Movies (general)2%
Class (high school orhigher)
42%
n = 44
Personalobservations
2%
Friends/family0%
Newspaper31%
Wunderground.com0%
Accuweather0%
Radio0%
Weather channel0%
TV news2%
National weatherservice
0%
Fig. 4. Survey responses to the question ‘What is the source of your global warming ⁄ climate change knowledge?’for the Focus the Nation climate teach-in at the University of Vermont in January 2008.
1212 Challenges to addressing climate science literacy
ª 2010 The Author Geography Compass 4/9 (2010): 1203–1217, 10.1111/j.1749-8198.2010.00368.xGeography Compass ª 2010 Blackwell Publishing Ltd
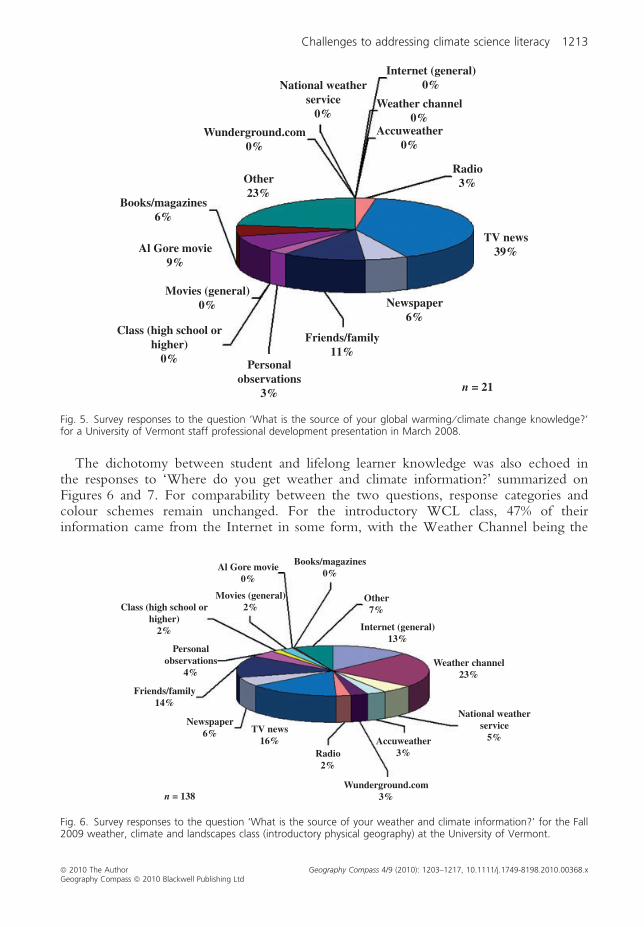
The dichotomy between student and lifelong learner knowledge was also echoed inthe responses to ‘Where do you get weather and climate information?’ summarized onFigures 6 and 7. For comparability between the two questions, response categories andcolour schemes remain unchanged. For the introductory WCL class, 47% of theirinformation came from the Internet in some form, with the Weather Channel being the
Internet (general)13%
National weatherservice
5%
Books/magazines0%
Al Gore movie0%
Movies (general)2%Class (high school or
higher)2%
Personalobservations
4%
Friends/family14%
Newspaper6% TV news
16%
n = 138Wunderground.com
3%
Radio2%
Accuweather3%
Other7%
Weather channel23%
Fig. 6. Survey responses to the question ‘What is the source of your weather and climate information?’ for the Fall2009 weather, climate and landscapes class (introductory physical geography) at the University of Vermont.
Internet (general)0%National weather
service0%
Wunderground.com0%
Other23%
Books/magazines6%
Al Gore movie9%
Movies (general)0%
Class (high school orhigher)
0% Personalobservations
3%
Friends/family11%
n = 21
Newspaper6%
TV news39%
Radio3%
Accuweather0%
Weather channel0%
Fig. 5. Survey responses to the question ‘What is the source of your global warming ⁄ climate change knowledge?’for a University of Vermont staff professional development presentation in March 2008.
Challenges to addressing climate science literacy 1213
ª 2010 The Author Geography Compass 4/9 (2010): 1203–1217, 10.1111/j.1749-8198.2010.00368.xGeography Compass ª 2010 Blackwell Publishing Ltd
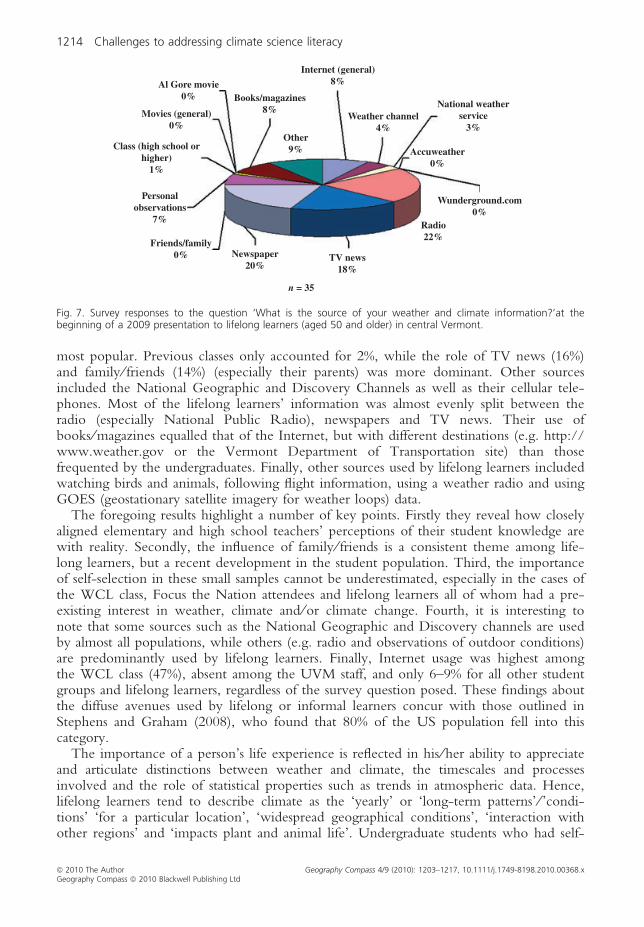
most popular. Previous classes only accounted for 2%, while the role of TV news (16%)and family ⁄ friends (14%) (especially their parents) was more dominant. Other sourcesincluded the National Geographic and Discovery Channels as well as their cellular tele-phones. Most of the lifelong learners’ information was almost evenly split between theradio (especially National Public Radio), newspapers and TV news. Their use ofbooks ⁄ magazines equalled that of the Internet, but with different destinations (e.g. http://www.weather.gov or the Vermont Department of Transportation site) than thosefrequented by the undergraduates. Finally, other sources used by lifelong learners includedwatching birds and animals, following flight information, using a weather radio and usingGOES (geostationary satellite imagery for weather loops) data.
The foregoing results highlight a number of key points. Firstly they reveal how closelyaligned elementary and high school teachers’ perceptions of their student knowledge arewith reality. Secondly, the influence of family ⁄ friends is a consistent theme among life-long learners, but a recent development in the student population. Third, the importanceof self-selection in these small samples cannot be underestimated, especially in the cases ofthe WCL class, Focus the Nation attendees and lifelong learners all of whom had a pre-existing interest in weather, climate and ⁄or climate change. Fourth, it is interesting tonote that some sources such as the National Geographic and Discovery channels are usedby almost all populations, while others (e.g. radio and observations of outdoor conditions)are predominantly used by lifelong learners. Finally, Internet usage was highest amongthe WCL class (47%), absent among the UVM staff, and only 6–9% for all other studentgroups and lifelong learners, regardless of the survey question posed. These findings aboutthe diffuse avenues used by lifelong or informal learners concur with those outlined inStephens and Graham (2008), who found that 80% of the US population fell into thiscategory.
The importance of a person’s life experience is reflected in his ⁄her ability to appreciateand articulate distinctions between weather and climate, the timescales and processesinvolved and the role of statistical properties such as trends in atmospheric data. Hence,lifelong learners tend to describe climate as the ‘yearly’ or ‘long-term patterns’ ⁄ ’condi-tions’ ‘for a particular location’, ‘widespread geographical conditions’, ‘interaction withother regions’ and ‘impacts plant and animal life’. Undergraduate students who had self-
Internet (general)8%
Weather channel4%
National weatherservice
3%
Accuweather0%
Wunderground.com0%
Radio22%
TV news18%
n = 35
Newspaper20%
Friends/family0%
Personalobservations
7%
Class (high school orhigher)
1%
Movies (general)0%
Al Gore movie0% Books/magazines
8%
Other9%
Fig. 7. Survey responses to the question ‘What is the source of your weather and climate information?’at thebeginning of a 2009 presentation to lifelong learners (aged 50 and older) in central Vermont.
1214 Challenges to addressing climate science literacy
ª 2010 The Author Geography Compass 4/9 (2010): 1203–1217, 10.1111/j.1749-8198.2010.00368.xGeography Compass ª 2010 Blackwell Publishing Ltd
selected into the WCL class also gave similar definitions of climate using phrases such asthe ‘occurrence of weather over long periods of time. Localized to specific regions asclimates vary among places’, ‘the average weather in an area, sometimes grouped by timeof year’ or ‘the habitual conditions of Earth’s atmosphere in a specific region over alonger period of time.’ In contrast, high school students tend to think of climate in termsof one meteorological variable only (usually temperature), as synonymous with weatheror ‘how that area mainly is’ with less reference to temporal or spatial scales and interac-tions.
Concluding Remarks
Achieving climate science literacy will require a connected web of disciplinary, inter-disciplinary, multidisciplinary and transdisciplinary approaches. Recent advances havebeen made in inviting cognitive sciences such as Psychology to enrich the conversa-tion around how beliefs, culture and attitudes shape learning, perceptions and behav-iour (Swim et al. 2009). The recognition and elucidation of six major challengesoutlined in this article highlight existing obstacles and mitigative strategies for boostingclimate literacy in both the formal and informal settings. In the formal arena, contin-ued teacher professional development and support for curricular reform is essential,while providing students with cutting-edge content, skills and inquiry-based experi-ences within which to apply them. In order to work with students’ learning stylesand help them begin to conceptualise processes in an integrated or earth systemsscience way of thinking, core weather and climate concepts should be introduced orincorporated in other classes apart from Geography, Earth Science or EnvironmentalScience. The SWAC program at the University of Vermont has proven the viabilityof embedding these principles in History and Social Studies curricula, as well asPhysics, Chemistry and Biology.
In terms of lifelong learning, suggestions are more numerous because of the variouspathways to learning that exist. These include but are not limited to, speaker series,workshops and seminars; programs designed for science museums, planetariums and othergalleries; online courses or summer courses; partnering with outdoor agencies and groupssuch as gardening clubs, hiking clubs, nature protection groups and land trusts; capitalisingon local knowledge and personalities including local weather reporters, forecasters, histor-ical societies and tertiary institutions; and working with public radio or public televisionaffiliates to produce segments of global importance, with a local flavour. In that way, awhole-school curricula change would be complemented by the whole-society educationsuggested by Stephens and Graham (2008) and the Geoscience Education WorkingGroup II (2005) as well.
Acknowledgement
I would like to acknowledge my M.Sc. and Ph.D. advisor Dr. John E. Lewis whosetraining as both a climatologist and remote sensing specialist inspired me to become like-wise and to eventually found the SWAC program. I would also like to thank the manystudents, teachers (especially SWAC participants) and audience members whose insightsand questions have allowed me to become engaged in promoting the scholarship ofclimate literacy. This research was supported by the National Science Foundation Geosci-ence Education award 0807787.
Challenges to addressing climate science literacy 1215
ª 2010 The Author Geography Compass 4/9 (2010): 1203–1217, 10.1111/j.1749-8198.2010.00368.xGeography Compass ª 2010 Blackwell Publishing Ltd
Short Biography
Dr. Lesley-Ann Dupigny-Giroux is an associate professor in the Geography Departmentat the University of Vermont, and Vermont State Climatologist. Her teaching responsibil-ities and research interests climate variability and change, historical climatology, climateliteracy, severe weather hazards, drought, remote sensing, Geographic Information Sci-ence, and the regional climatology of New England, Brazil and the Caribbean. Sheobtained her M.Sc. and Ph.D. degrees from McGill University. Her work on droughtcharacterization and mitigation, published in the Journal of the American Water ResourcesAssociation, has been used by the Vermont Emergency Management in developing a miti-gation strategy for the state. Hydrometeorological analyses of drought and severe weatherdynamics have appeared in Weather, International Journal of Remote Sensing, PhotogrammetricEngineering and Remote Sensing as well as Remote Sensing of Environment. She is also the leadeditor of Historical Climate Variability and Impacts in North America (published by Springer)the first monograph of its kind in North America to deal with the use of documentaryand other ancillary records in the analysis of climate variability and change.
Dr. Dupigny-Giroux served as the director of the Climate Specialty Group of theAssociation of American Geographers from 2006 to 2008. During her term, she foundedthe AAG Climate Literacy Initiative, a national and international collaboration devoted tothe standardization of information and resources by which to promote a climate literatecitizenry at all levels. She is also a founding member of the Climate Literacy Network,made up of groups and individuals interested in promoting both climate literacy and cli-mate action efforts. In order to create a state-of-the-knowledge reference on climate liter-acy, she served as the guest editor of a special issue of the Physical Geography journal (ofwhich she is an Editorial Board member) devoted to many lenses through which ClimateLiteracy can be understood. Finally in 2008, she was awarded a National Science Founda-tion (NSF) Geoscience Education grant to work with Vermont teachers on enhancingtheir professional development around the area of climate content knowledge.
Note
* Corresponding address: Lesley-Ann L. Dupigny-Giroux, PhD, Associate Professor and Vermont State Climatolo-gist, Department of Geography, University of Vermont, 200 Old Mill Building, 94 University Place, Burlington,VT 05405-0114, USA. E-mail: [email protected].
References
American Association for the Advancement of Science (AAAS) (1989). Science for all Americans. New York, NY:Oxford University Press.
American Association for the Advancement of Science (AAAS) (1993). Benchmarks for science literacy. New York,NY: Oxford University Press.
AMS (The American Meteorological Society) (2000). Glossary of meteorology, 2nd ed. Lawrence, KS: The Allen Press.[Online]. Retrieved on 13 March 2010 from: http://amsglossary.allenpress.com/glossary/search?id=climate1
Arndt, D. S., and LaDue, D. S. (2008). Applying concepts of adult education to improve weather and climate liter-acy. Physical Geography 29, pp. 487–499.
Atmospheric Science Literacy (2008). [Online] Retrieved on 13 March 2010 from: http://www.eo.ucar.edu/asl/pdfs/ASLbrochureFINAL.pdf.
Chambers, L. H., et al. (2002). The CERES S’COOL Project. Bulletin of the American Meteorological Society 84(6),pp. 759–765.
Chi, M. (2005). Commonsense conceptions of emergent processes: why some misconceptions are robust. Journal ofthe Learning Sciences 14, pp. 161–199.
Dupigny-Giroux, L.-A. L. (2008). Introduction – Climate science literacy: a state of the knowledge overview.Physical Geography 29, pp. 483–486.
1216 Challenges to addressing climate science literacy
ª 2010 The Author Geography Compass 4/9 (2010): 1203–1217, 10.1111/j.1749-8198.2010.00368.xGeography Compass ª 2010 Blackwell Publishing Ltd
Earth Science Literacy Principles: The Big Ideas and Supporting Concepts of Earth Science (2009). [Online].Retrieved on 13 March 2010 from: http://earthscienceliteracy.org/es_literacy_22may09.pdf.
Felder, R. M. (1996). Matters of Style. ASEE Prism 6(4), pp. 18–23. [Online]. Retrieved on 13 March 2010 from:http://www4.ncsu.edu/unity/lockers/users/f/felder/public/Papers/LS-Prism.htm.
Geoscience Education Working Group II. (2005). Geoscience education and diversity: vision for the future andstrategies for success. Arlington, VA: National Science Foundation; [Online]. Retrieved on 13 March 2010 from:http://nsf.gov/geo/adgeo/geoedu/GEWGII_Report_sept_2005.pdf.
Ginger, K. M., et al. (1996). Project ATMOSPHERE 1995 Teacher Enhancement Programs. Bulletin of the Ameri-can Meteorological Society 77(4), pp. 763–769.
Harrington, J. Jr (2008). Misconceptions: barriers to improved climate literacy. Physical Geography 29, pp. 575–584.Hassol, S. J. (2008). Improving how scientists communicate about climate change. EOS 89(11), pp. 106–107.Hendriques, L. (2000). Children’s misconceptions about the weather: A review of the literature, presented at the
annual meeting of the National Association of Research in Science Teaching, New Orleans, Louisiana, USA, 29April. [Online]. Retrieved on 13 March 2010 from: http://www.csulb.edu%7Elhenriqu/NARST2000.htm.
Hoffman, M., and Barstow, D. (2007). Revolutionizing Earth System Science Education for the 21st Century,Report and Recommendations from a 50-State Analysis of Earth Science Education Standards. Cambridge, MA:TERC.
Jackson, V. C., and Carr, F. H. (1995). A Mesoscale Meteorology Course for University Faculty. Bulletin of theAmerican Meteorological Society 76(11), pp. 2459–2462.
Johnson, R. M., et al. (2008). Lessons learned through our climate change professional development program formiddle and high school teachers. Physical Geography 29, pp. 500–511.
Karstens, K. A., et al. (2009). How geoscientists think and learn. EOS, Transactions. American Geophysical Union90(31), pp. 265–266.
Kolb, D. A. (1984). Experiential Learning: Experience as the Source of Learning and Development. Englewood Cliffs, NJ:Prentice-Hall.
Kolb, D. A. (1985). Learning style inventory. Boston, MA: McBer and Company.Leiserowitz, A. (2007). Global public perception, opinion, and understanding of climate change: Current patterns,
trends, and limitations. Thematic paper for: Human Development Report 2007: Climate Change and HumanDevelopment – Rising to the Challenge. United Nations Development Program. [Online]. Retrieved on 13March 2010 from: http://hdr.undp.org/en/reports/global/hdr2007-2008/papers/leiserowitz_anthony.pdf.
Maibach, E. (2008). Editorial, special issue on climate change communication. International Journal of SustainabilityCommunication, June. [Online]. Retrieved on 13 March 2010 from: http://www.ijsc-online-online.org | IJSC3(2008), pp. 2–4.
Maibach, E., Roser-Renouf, C., and Leiserowitz, A. (2009). Global Warming’s Six Americas 2009: An audiencesegmentation. New Haven, CT: Yale University and George Mason University. Yale Project on ClimateChange. [Online]. Retrieved on 13 March 2010 from: http://environment.yale.edu/uploads/6Americas2009.pdf.
McCaffrey, M. S., and Buhr, S. (2008). Clarifying climate confusion: Addressing systemic holes, cognitive gaps andmisconceptions through climate literacy. Physical Geography 29, pp. 512–528.
Niepold, F., Herring, D., and McConville, D. (2008). The role of narrative and geospatial visualization in fosteringclimate-literate citizens. Physical Geography 29, pp. 529–544.
Ocean Literacy: Essential Principles and Fundamental Concepts of Ocean Sciences (2005). [Online]. Retrieved on13 March 2010 from: http://www.coexploration.org/oceanliteracy/documents/OceanLitChart.pdf.
Shafer, M. A. (2008). Climate literacy and a National Climate Service. Physical Geography 29, pp. 561–574.Shafer, M. A., James, T. E. and Giuliano, N. (2009). Enhancing climate literacy. 18th Symposium on Education,
American Meteorological Society, Phoenix, AZ.Shepardson, D. P., Choi, S., Niyogi, D. and Charusombat, U. (2009). Seventh grade students’ mental models of
the greenhouse effect. Environmental Education Research 15(5), pp. 549–570.Stephens, J. C., and Graham, A. C. (2008). Climate science to citizen action: Energizing nonformal climate science
education. EOS 89(22), pp. 204–205.Stevermer, A., Geary, E., Hoffman, M., and Barstow, B. (2007). A Status Report on K-12 Earth and Space Science
Education in the United States, 2006, TERC Center for Earth and Space Science Education.Swim, J., et al. (2009). Psychology and Global Climate Change: Addressing a Multi-faceted Phenomenon and Set
of Challenges. A Report b the American Psychological Association’s Task Force on the Interface Between Psy-chology and Global Climate Change. [Online]. Retrieved on 13 March 2010 from: http://www.apa.org/science/climate-change.
Uherek, E., and Schuepbach, E. (2008). European efforts in Earth science education. Physical Geography 29, pp.545–560.
US Global Change Research Program. (2009). Climate Literacy: The Essential Principles of Climate Science, AGuide for Individuals and Communities ⁄ a jointly published brochure; [Online]. Retrieved on 13 March 2010from: http://www.globalchange.gov/resources/educators/climate-literacy.
Challenges to addressing climate science literacy 1217
ª 2010 The Author Geography Compass 4/9 (2010): 1203–1217, 10.1111/j.1749-8198.2010.00368.xGeography Compass ª 2010 Blackwell Publishing Ltd