Embed Size (px)
Citation preview
Vol.:(0123456789)
Transportationhttps://doi.org/10.1007/s11116-021-10227-y
1 3
Exploring the attitudes of Millennials and Generation Xers toward ridesourcing services
Ghazaleh Azimi1 · Alireza Rahimi1 · Xia Jin1
Accepted: 24 August 2021 © The Author(s), under exclusive licence to Springer Science+Business Media, LLC, part of Springer Nature 2021
AbstractThis paper presents a study investigating the potential market of ridesourcing services, with a focus on the attitudinal and preferential differences between Millennials and Generation Xers. Data obtained from a stated preference survey were utilized, where the respond-ents were asked to choose between a conventional mode (private vehicle driver, transit, or private vehicle passenger) and ridesourcing modes (exclusive ride and shared ride). Error component nested logit models were developed for Generation Xers and Millenni-als, respectively. Latent attitudes derived through factor analysis were incorporated into models. A wide range of attitudinal indicators, including general mobility attitudes, per-ceived benefits and concerns of shared mobility services, reasons for or against owning a car, reasons for ridings Autonomous Vehicles (AV), and the most desired AV features were considered to extract latent attitudes. Model results indicated distinct mode choice behav-ior between Millennials and Generation Xers. For Generation Xers, the choice to switch to ridesourcing was highly dependent on the perceived time and cost benefits of shared mobility. On the other hand, Millennials’ choices were more likely to be influenced by their attitudes or desire toward technology, on-demand services, and driving stress relief. Interestingly, the joy of driving showed a negative impact on Millennials’ use of shared-ride services only. The findings from this study provide a more in-depth understanding of the distinct behavior of Generation Xers and Millennials toward shared mobility services, which could help develop strategies and policies to focus more effectively on the needs and concerns of individuals based on their characteristics and attitudes and help promote sus-tainable transportation system.
Keywords Ridesourcing · Attitudes · Nested logit model · Millennials · Generation xers
* Xia Jin [email protected]
Ghazaleh Azimi [email protected]
Alireza Rahimi [email protected]
1 Department of Civil and Environmental Engineering, Florida International University, 10555 W. Flagler Street, EC3725, Miami, FL 33174, USA
Transportation
1 3
Introduction
A generation is a peer group identified by its demographic characteristics as well as its historic life events within a given period (Borges et al. 2006). While each member of a gen-eration has unique characteristics, a generational cohort is likely to possess shared values and behaviors due to similar significant events, social influences, and technological experi-ences (Borges et al. 2006; Fernandez, 2009). These generational characteristics may affect the attitudes, lifestyles, and priorities of the cohort (Rogler 2002).
As the largest adult group in the United States (Fry 2016; Rainer and Rainer, 2011), Millennials are defined as those born between 1981 and 2000. Millennials have distinct characteristics, values, and attitudes that set them apart from the preceding generations, particularly Generation Xers, another large cohort composed of people born between 1965 and 1980 (Fishman 2016; Borges et al. 2006; Alemi et al. 2019). Compared to Generation Xers, Millennials are more confident and idealistic, more socially active, better educated, and have more racial diversity (Reisenwitz and Iyer 2009; Howe and Strauss 2000).
Millennials also show different attitudes and behaviors toward travel modes compared to Generation Xers (Blumenberg et al. 2016; Kuhnimhof et al. 2012). They show higher preferences for walking and transit than the previous generations (Blumenberg et al. 2016; Kuhnimhof et al. 2012). Millennials are generally less likely to make substantial invest-ments in private vehicles (Thompson and Weissmann 2012). This generation has a lower driver’s license and car ownership rate and made fewer trips with lower vehicle miles trave-led (VMT) (Polzin et al. 2014; Sivak and Schoettle 2011; Delbosc and Currie, 2013; Blu-menberg et al. 2016).
Moreover, Millennials hold an in-depth understanding and intuitive knowledge of tech-nology usage (Coombes 2009); therefore, they were referred to as “digital natives” in the literature (Prensky 2001). These open-to-innovation and technology-embracing attitudes among Millennials presented them as early adopters and stable customers of shared mobil-ity services. Ridesourcing services (such as Uber and Lyft), which use online platforms to connect travelers and drivers via an automated reservation and checkout system, are the most popular forms of shared mobility services. The literature showed that young people were more likely to adopt ridesourcing services and showed a considerably higher fre-quency of ridesourcing usage than older adults (Acheampong et al. 2020, Asgari and Jin 2020, Zhen 2015, Rayle et al. 2016, Clewlow and Mishra 2017, Circella et al. 2016a, b, Gehrke et al. 2018, Deka and Fei 2019, Sikder 2019, Dias et al. 2017).
Despite the general agreement on the differences between Millennials and Generation Xers in view of their travel patterns, there is limited knowledge on the factors that contrib-ute to these differences and the mechanism of their influences on travel behavior. Recent studies showed that only 10–25% of the differences in travel patterns between Millennials and Generation Xers could be explained by the demographic shifts of the Millennials, and about 35–50% of the differences could be explained by attitudinal changes and the rise of telecommunications and virtual mobility (i.e., online shopping, social media) (McDonald 2015; Rahimi et al. 2020a). Motivated by the above issue, we put an effort to further ana-lyze the differences between Millennials and Generation Xers in view of their mode choice focusing on how their attitudes and mobility preferences might differ and how much these factors may contribute to their mode choice toward ridesourcing services.
Focusing on the potential market of ridesourcing, the distinctive contribution of this study is twofold. First, this study investigates the choice behavior of Millennials and Gen-eration Xers to identify whether and how their unique socioeconomic and demographic
Transportation
1 3
characteristics (SED) and mobility profiles may lead to different behavior toward the ridesourcing market. Second, as discussed above, Millennials and Generation Xers pos-sess different attitudes with considerable impacts on their mode choice behavior. Hence, in this study, we explore how these generations might have distinct attitudes and preferences toward emerging and traditional modes and how these factors may influence their inclina-tion toward ridesourcing services.
For this study, data from a stated preference (SP) survey in the United States were used. This survey provided valuable information on individuals’ travel characteristics, mobility preferences, attitudes, as well as socioeconomic and demographic attributes. SP scenarios were also designed to ask the respondents to select their preferred mode among one con-ventional mode (auto or transit) and two ridesourcing modes (exclusive ride and shared ride). Error component multinomial logit (MNL) and nested logit (NL) models were devel-oped for both Generation Xers and Millennials, and their performances were compared. The results of error component NL models were presented in terms of the significant con-tributing factors. The findings of this study are expected to help better understand the gen-erational differences in terms of their views toward mobility options and provide insights on the potential market of ridesourcing services. This knowledge may help us improve the design of shared mobility services and suggest policies to serve potential users.
Literature review
In this section, we first summarized the findings of previous studies on factors that influ-ence the adoption or frequency of use of ridesourcing services. Next, we reviewed the literature on the choice between shared and exclusive ridesourcing services. Finally, we summarized the studies that examined the impact of attitudinal factors on individuals’ pro-pensity to use ridesourcing services.
Ridesourcing adoption and frequency
In general, the literature suggested that ridesourcing users tend to be younger individuals, but the definition of the age range might differ. Asgari and Jin (2020) conducted a survey in the U.S. and showed that young graduates (18–4 years old) had a positive tendency to adopt ridesourcing services. Using the survey data conducted in Ghana, Acheampong et al. (2020) found that users of ridesourcing services were more likely to be between 18 and 39 years old. Similarly, Young and Farber (2020) analyzed the data from a 2016 survey conducted in Ontario, Canada, and found that ridesourcing users were more likely to be adults between 20 and 39 years old.
Alemi et al. (2018) and Alemi et al. (2019) analyzed survey data conducted in the U.S., targeting Millennials (25–34 years old) and Generation Xers (35–50 years old), and they found that Millennials were more likely to adopt ridesourcing services than Generation Xers. Using the survey data conducted in the U.S., Rayle et al. (2016) found that rides-ourcing users were more likely to be young (younger than 35 years old) individuals who preferred lower wait times and fast origin-to-destination services. Gehrke et al. (2018) also found the people younger than 35 years old had a more positive tendency toward ridesourc-ing services. Clewlow and Mishra (2017) analyzed the data survey conducted in the U.S. and showed that individuals between 18 and 29 years old reflect showed levels of rides-ourcing adoption.
Transportation
1 3
In view of ridesourcing frequency, the literature also showed that ridesourcing frequency tended to be higher among younger groups. Using an online questionnaire carried out in the U.S., Barbour et al. (2020) found that Millennials (younger than 35 years old) were more likely to adopt ridesourcing at least once per week than their older age groups. Dias et al. (2017) utilized the 2014–2015 Puget Sound Regional Travel Study data and found that riders of ridesourcing services tended to be young (18–34 years old), well-educated individuals who live in high-density locations. Sikder (2019) utilized the 2017 National Household Travel Survey (NHTS) and showed that young individuals (16–35 years old) had a higher probability of using ridesourcing services than other age groups. Using the same dataset, Deka and Fei (2019) found that the frequency of ridesourcing adoption was higher among people younger than 44 years old. Grahn et al. (2019) also used the 2017 NHTS dataset and found that individuals younger than 35 years old were most likely to accept ridesourcing as a frequent travel mode.
Other socioeconomic and demographic characteristics that have a positive association with the adoption or frequency of use of ridesourcing services include full-time employ-ment (Sikder 2019; Asgari and Jin 2020), higher level of income (Acheampong et al. 2020; Asgari and Jin 2020; Clewlow and Mishra 2017; Dias et al. 2017; Barbour et al. 2020; Deka and Fei 2019; Grahn et al. 2019; Sikder 2019), higher level of education (Acheam-pong et al. 2020; Asgari and Jin 2020; Rayle et al. 2016; Clewlow and Mishra 2017; Cir-cella et al. 2018; Alemi et al. 2018; Deka and Fei 2019; Dias et al. 2017; Sikder 2019; Grahn et al. 2019), and households with zero or inadequate private vehicle (Gehrke et al. 2018; Alemi et al. 2019; Barbour et al. 2020; Sikder 2019). Moreover, in view of trip pat-terns, ridesourcing are more likely to be used for social trips (Rayle et al. 2016, Aninanya et al. 2020, Asgari and Jin 2020, Zhen 2015, Henao 2017), commuting trips (Acheampong et al. 2020), and trips with shorter travel time (Acheampong et al. 2020).
Exclusive‑ride versus shared‑ride services
Few studies examined the factors that impact individuals’ mode choice between shared-ride and exclusive-ride services. Considering the role of age, Gehrke et al. (2021) showed that young individuals (18–24 years old) were more likely to prefer shared rides over exclu-sive services. Spurlock et al. (2019) also showed that people younger than 39 years old had a positive tendency to use shared rides over exclusive services. Other studies showed similar results (Sarriera et al. 2017; Chen et al. 2018; Brown 2020).
Moreover, the literature showed that lower education level was associated with the choice of shared rides over non-shared rides, and travel cost was the main reason for this preference (Gehrke et al. 2021; Spurlock et al. 2019; de Souza Silva et al. 2018). Also, zero household vehicles or limited access to private vehicles increased the probability of choosing shared rides over exclusive rides (Gehrke et al. 2021; Sarriera et al. 2017; Chen et al. 2018; Brown 2020). On the other hand, individuals with a higher income level were more likely to choose single rides over shared rides (Gehrke et al. 2021; Azimi et al. 2020). In view of trip patterns, Lee et al. (2018) found that higher time variability of shared rides was the main reason that discouraged people from using these services over exclusive rides. They also showed that people were more inclined to adopt shared rides for short trips due to lower time variability. Young et al. (2020) showed similar findings and suggested that reducing the detour time of shared rides might increase the probability of choosing shared rides over single rides. In addition, Gehrke et al. (2021) showed that shared rides-ourcing was more desired in the inner core neighborhoods. This finding was corroborated
Transportation
1 3
by a study by Young et al. (2020), which suggested that higher demand for shared services in downtown areas could be related to the higher matching rates in these areas.
Attitudinal factors
Only a few studies considered the impact of attitudes and lifestyle on individuals’ mode choice behavior in light of ridesourcing services. These studies showed that environmen-tal concerns (Lavieri and Bhat 2019; Circella et al. 2018; Alemi et al. 2018; Simmons 2018a), technology-based lifestyle (Fu 2020; Azimi et al. 2020; Acheampong et al. 2020; Circella et al. 2018; Alemi et al. 2018), and variety-seeking attitudes (Lavieri and Bhat 2019; Circella et al. 2018; Alemi et al. 2018) encouraged the adoption of ridesourcing ser-vices. Moreover, perceived easiness or convenience of use (Fu 2020; Acheampong et al. 2020) and perceived hedonic benefits (Fu 2020; Acheampong et al. 2020) also increased the probability of choosing ridesourcing services.
On the other hand, the inclination to own and use private cars (Alemi et al. 2019; Acheampong et al. 2020; Azimi et al. 2020), safety or data privacy concerns (Lee et al. 2018; Azimi et al. 2020; Lavieri and Bhat 2019; Alemi et al. 2019; de Souza Silva et al. 2018), and the habitual use of traditional modes (Asgari and Jin 2020) decreased the prob-ability of using ridesourcing services.
In summary, there is a consensus in the literature that young adults were the most promi-nent market for ridesourcing services, although the defining age range varies slightly. Other contributing factors included income, education, land use density, familiarity with tech-nology, etc. While most existing studies used household travel surveys, such as the 2017 NHTS data or other revealed preference (RP) surveys, this study is motivated to employ an SP-based approach. The major motivation for this approach is to examine the propensity toward ridesourcing services beyond cost considerations. Income has been identified as one of the most influential factors in mobility choices by numerous studies. The current fare levels of ridesourcing services may present considerable barriers to frequent service adop-tion for many people. Considering that future AV technologies may reduce the cost of ride-sourcing services by removing the cost associated with human drivers (Compostella et al. 2020; Walker Johnson, 2016; Stocker and Shaheen 2018; Spieser et al. 2014; Karamanis et al. 2018), this study employed SP scenarios where the ridesourcing costs were decreased to be more comparable with driving costs. With this experiment, we were able to focus on other potential barriers (such as attitudes, habits, and perceptions, etc.) to the adoption of shared mobility compared to private vehicles. In this regard, the SP survey also collected information on personal attitudes and preferences. In particular, we focused on how these factors may contribute to ridesourcing modes’ choice and how their impacts differ between Millennials and Generation Xers.
Survey data
This study used data from an online behavior survey, which was carried out in April and March 2017. The survey covered ten metropolitan areas in the United States (includ-ing New York, Chicago, Dallas, Atlanta, San Francisco, Phoenix, Seattle, Minneapolis, Denver, and Cincinnati) and the entire state of Florida. These areas were chosen based on their population size and geographic locations to cover the country. The 2010 Census representative sample for various sociodemographic characteristics, including age, gender,
Transportation
1 3
education, income, and ethnicity, were targeted in this survey. A stratified sampling strat-egy was employed to ensure a representative sample.
The major focus of the survey was on Florida (due to request of funding agency), and the objective was to collect 1000 responses from all areas in this state and 500 responses from other metropolitan areas. The final dataset consists of 1087 respondents nationwide. No monetary motivation was offered to the respondents as it may encourage them to respond to survey questions in a “good behavior” and hide their “bad behavior” (Rahimi et al. 2020b; Preisendörfer and Wolter 2014). Details of the survey design were elaborated in previous studies (Asgari et al. 2018; Jin et al. 2020).
SP design
To explore individuals’ choice behavior toward shared mobility (ridesourcing services) and traditional modes (Private cars and transit), the survey gathered information on indi-viduals’ choice behavior through SP scenarios. Respondents were asked to report a regular trip as the reference trip. Based on the selected mode for the reference trip, respondents were assigned to different scenarios, where three alternative modes were presented, includ-ing one conventional mode (Driver, Passenger, or Transit depending on the mode they indicated for the regular trip), and two ridesourcing modes (Exclusive Rides, and Shared Rides). Three attributes described each alternative: travel time, travel cost, and either driver availability (for the passenger mode) or multitasking level (for the other modes).
Travel time referred to the door-to-door travel time, including walking to/from transit stations and ridesourcing waiting time. Travel cost was defined as travel fare for public transit or ridesourcing and average driving cost (per mile) for private vehicles. Three levels were considered for travel cost and time, varying from -30% to 30% of the base value.
The values of travel time and costs presented in the scenarios were determined by trip distance. Average travel time was derived from Google Map estimates. Six distance seg-ments, varying from 5 to 30 miles by 5-mile increments, were considered. In addition, we incorporated parking times for private vehicles and waiting time for transit and ridesourc-ing services. The base values for travel time were calculated as shown below:
• Private Vehicle = Trip Time + 5 min (for parking + access/egress)• Public Transit = Trip Time + 10 min (for waiting + access/egress)• Exclusive Ridesourcing = Trip Time + 2 min (for waiting time)• Shared Ridesourcing = Trip Time + 8 min (for waiting time)
The base values of travel cost were determined based on a comprehensive review of recent mobility studies in the United States (Corwin et al. 2015, American Public Transportation Association (APTA), 2016). By considering a 15,000 mileage per year, the average travel cost per mile for a private car is estimated to be about $0.57. The average travel cost and time reported by the 2016 APTA were considered for transit, with an average fare of $0.25 per mile.
For ridesourcing services, the current costs were reduced to one-third of its current fare, so we can investigate ridesourcing adoption beyond cost consideration and consider the potential travel cost reduction by introducing AV technologies to the market (Walker and Johnson 2016). The base travel cost for exclusive and shared rides was considered to be $0.5 and $0.4 per mile, respectively. The base values for travel cost were calculated as shown below:
Transportation
1 3
• Private Vehicle = 0.5*Trip Distance + $0.8 (For Parking)• Public Transit = 0.25*Trip Distance• Exclusive Ridesourcing = 0.5*Trip Distance• Shared Ridesourcing = 0.4*Trip Distance
Driver availability for the passenger mode had three values randomly assigned to each sce-nario: low, medium, and high. This attribute measures the level of convenience to depend on others for travel activities. Higher driver availability means there is always a drive avail-able to drive the respondent for the trip at his/her desired time. The multitasking level was specified in the survey as the level of easiness and convenience to engage in other activi-ties during the trip. This attribute is specified as a fixed attribute: low for public transit, medium for shared ridesourcing, and high for single rides.
Sample characteristics
This study focused on two different generations: Generation Xers and Millennials. As dis-cussed earlier, these two generations have distinct behaviors, attitudes, and preferences toward emerging and traditional modes. These differences might also affect their adoption and usage of ridesourcing services.
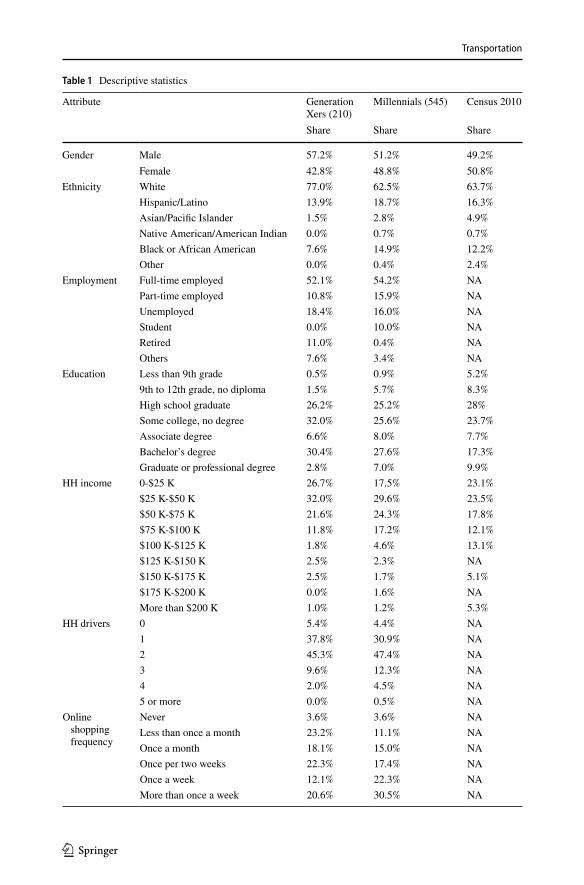
The dataset consists of 210 Generation Xers with 2989 scenarios and 545 Millennials with 7496 scenarios. Table 1 shows the descriptive statistics for Generation Xers and Mil-lennials. As shown in Table 1, Millennials had a higher proportion of female users, they were more ethnically diverse, and they had a lower percentage of unemployed and retired users compared to Generation Xers. On the other hand, generation X had higher propor-tions (58.7%) of lower-income groups (less than $50 K) compared to Millennials (47.1%). Moreover, the number of household drivers was generally higher for Millennials relative to Generation Xers. As expected, Millennials showed a higher frequency of online shopping compared to Generation Xers.
Attitudes and personal preferences
Attitudes have substantial effects on people’s mode choice behavior; therefore, one major contribution of this study is exploring the effects of these factors on individuals’ inclina-tions toward ridesourcing services. To achieve this goal, respondents were asked about their general attitudes toward mobility options (general mobility attitudes), perceived ben-efits and concerns of shared mobility (perceptions), the reasons for owning or not owning cars (private vehicle ownership), and reasons to use AVs and the most desired AV features (AV features). The following figures illustrate the observed patterns in attitudes and prefer-ences for Generation Xers and Millennials. In addition, T-tests were conducted to deter-mine whether the differences between the mean of the attitudinal indicators were signifi-cant at the 90% significance level.
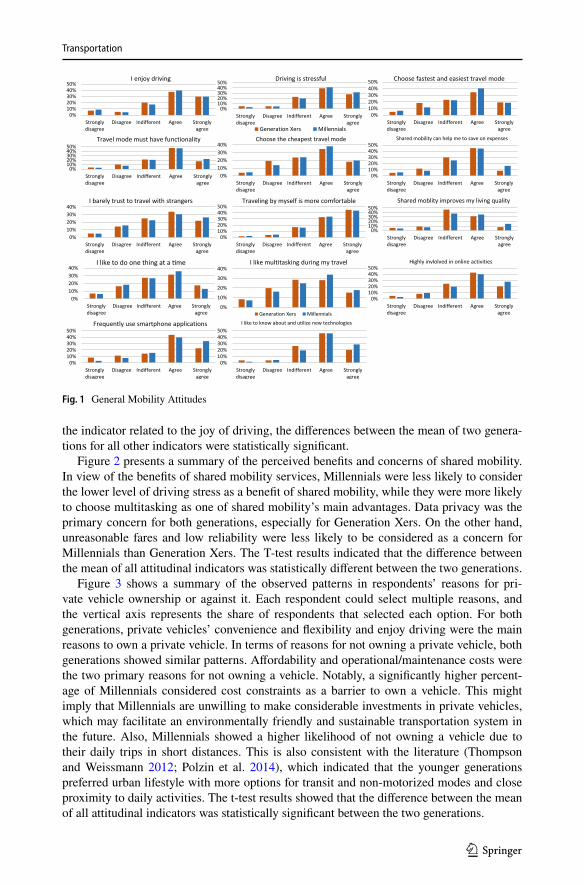
Figure 1 illustrates the pattern of general mobility attitudes for Generation Xers and Millennials. A higher proportion of Millennials believed that shared mobility increased their living quality, and they could save on their expenses by using shared mobility. Moreo-ver, Millennials were more likely to prefer multitasking during their trips. Also, Millenni-als showed a higher interest in learning new technologies, they used smartphone apps more regularly, and they were more engaged in online activities. T-tests showed that except for
Transportation
1 3
Table 1 Descriptive statistics
Attribute Generation Xers (210)
Millennials (545) Census 2010
Share Share Share
Gender Male 57.2% 51.2% 49.2%Female 42.8% 48.8% 50.8%
Ethnicity White 77.0% 62.5% 63.7%Hispanic/Latino 13.9% 18.7% 16.3%Asian/Pacific Islander 1.5% 2.8% 4.9%Native American/American Indian 0.0% 0.7% 0.7%Black or African American 7.6% 14.9% 12.2%Other 0.0% 0.4% 2.4%
Employment Full-time employed 52.1% 54.2% NAPart-time employed 10.8% 15.9% NAUnemployed 18.4% 16.0% NAStudent 0.0% 10.0% NARetired 11.0% 0.4% NAOthers 7.6% 3.4% NA
Education Less than 9th grade 0.5% 0.9% 5.2%9th to 12th grade, no diploma 1.5% 5.7% 8.3%High school graduate 26.2% 25.2% 28%Some college, no degree 32.0% 25.6% 23.7%Associate degree 6.6% 8.0% 7.7%Bachelor’s degree 30.4% 27.6% 17.3%Graduate or professional degree 2.8% 7.0% 9.9%
HH income 0-$25 K 26.7% 17.5% 23.1%$25 K-$50 K 32.0% 29.6% 23.5%$50 K-$75 K 21.6% 24.3% 17.8%$75 K-$100 K 11.8% 17.2% 12.1%$100 K-$125 K 1.8% 4.6% 13.1%$125 K-$150 K 2.5% 2.3% NA$150 K-$175 K 2.5% 1.7% 5.1%$175 K-$200 K 0.0% 1.6% NAMore than $200 K 1.0% 1.2% 5.3%
HH drivers 0 5.4% 4.4% NA1 37.8% 30.9% NA2 45.3% 47.4% NA3 9.6% 12.3% NA4 2.0% 4.5% NA5 or more 0.0% 0.5% NA
Online shopping frequency
Never 3.6% 3.6% NALess than once a month 23.2% 11.1% NAOnce a month 18.1% 15.0% NAOnce per two weeks 22.3% 17.4% NAOnce a week 12.1% 22.3% NAMore than once a week 20.6% 30.5% NA
Transportation
1 3
the indicator related to the joy of driving, the differences between the mean of two genera-tions for all other indicators were statistically significant.
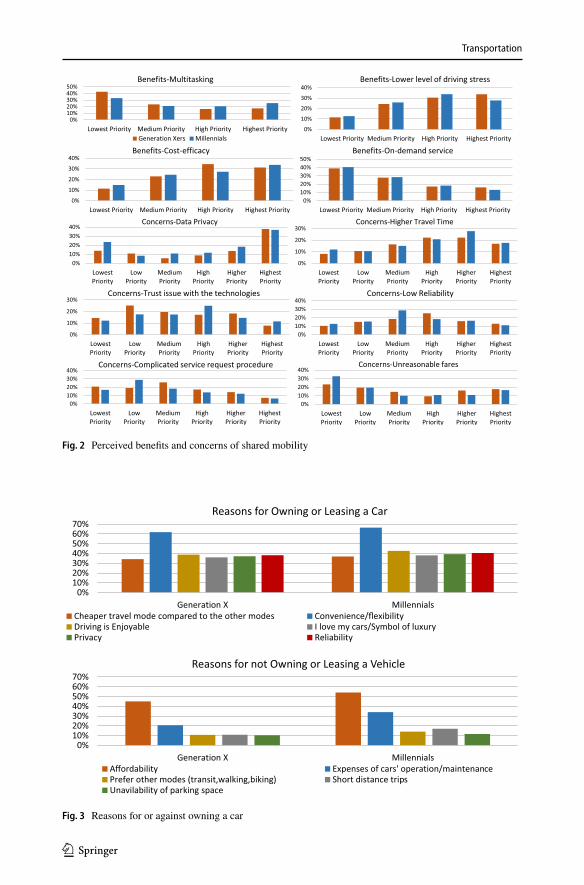
Figure 2 presents a summary of the perceived benefits and concerns of shared mobility. In view of the benefits of shared mobility services, Millennials were less likely to consider the lower level of driving stress as a benefit of shared mobility, while they were more likely to choose multitasking as one of shared mobility’s main advantages. Data privacy was the primary concern for both generations, especially for Generation Xers. On the other hand, unreasonable fares and low reliability were less likely to be considered as a concern for Millennials than Generation Xers. The T-test results indicated that the difference between the mean of all attitudinal indicators was statistically different between the two generations.
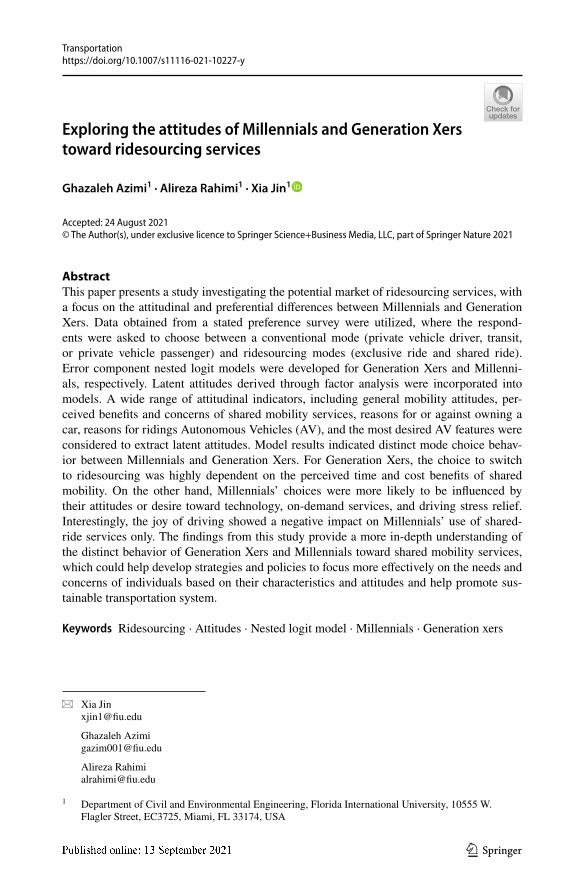
Figure 3 shows a summary of the observed patterns in respondents’ reasons for pri-vate vehicle ownership or against it. Each respondent could select multiple reasons, and the vertical axis represents the share of respondents that selected each option. For both generations, private vehicles’ convenience and flexibility and enjoy driving were the main reasons to own a private vehicle. In terms of reasons for not owning a private vehicle, both generations showed similar patterns. Affordability and operational/maintenance costs were the two primary reasons for not owning a vehicle. Notably, a significantly higher percent-age of Millennials considered cost constraints as a barrier to own a vehicle. This might imply that Millennials are unwilling to make considerable investments in private vehicles, which may facilitate an environmentally friendly and sustainable transportation system in the future. Also, Millennials showed a higher likelihood of not owning a vehicle due to their daily trips in short distances. This is also consistent with the literature (Thompson and Weissmann 2012; Polzin et al. 2014), which indicated that the younger generations preferred urban lifestyle with more options for transit and non-motorized modes and close proximity to daily activities. The t-test results showed that the difference between the mean of all attitudinal indicators was statistically significant between the two generations.
Fig. 1 General Mobility Attitudes
Transportation
1 3
Fig. 2 Perceived benefits and concerns of shared mobility
0%10%20%30%40%50%60%70%
Generation X Millennials
Reasons for Owning or Leasing a Car
Cheaper travel mode compared to the other modes Convenience/flexibilityDriving is Enjoyable I love my cars/Symbol of luxuryPrivacy Reliability
0%10%20%30%40%50%60%70%
Generation X Millennials
Reasons for not Owning or Leasing a Vehicle
Affordability Expenses of cars' operation/maintenancePrefer other modes (transit,walking,biking) Short distance tripsUnavilability of parking space
Fig. 3 Reasons for or against owning a car
Transportation
1 3
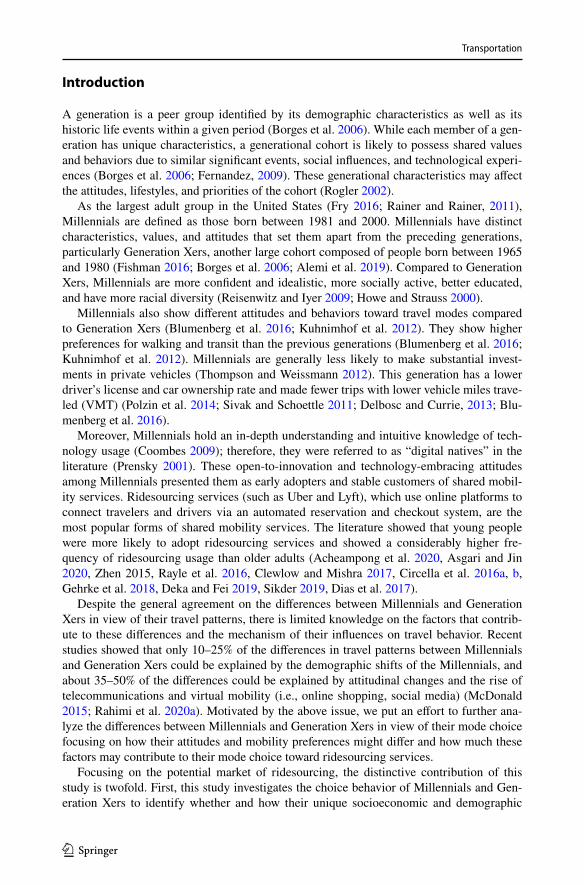
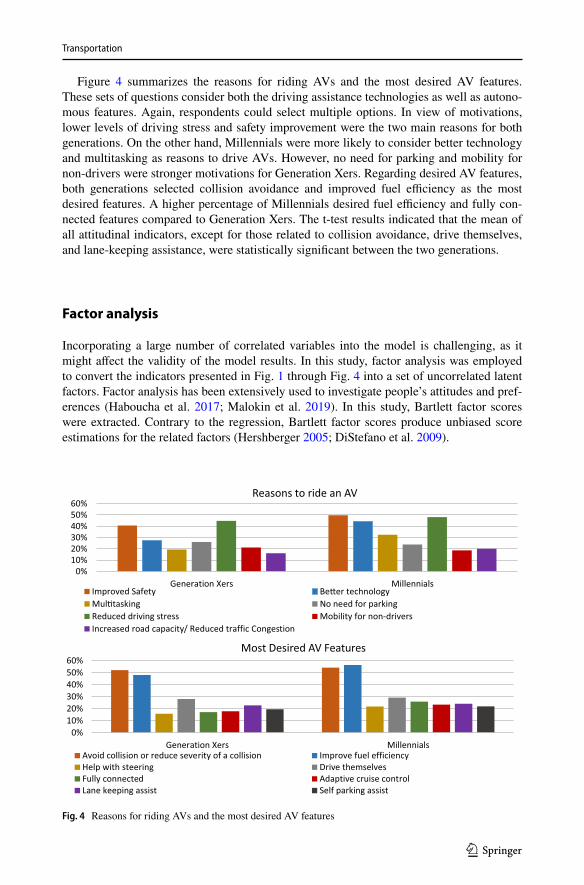
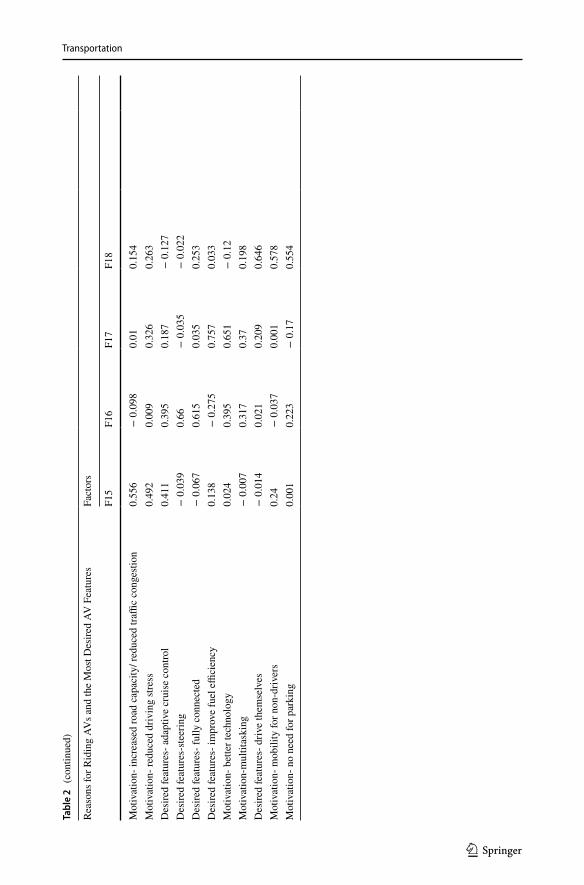
Figure 4 summarizes the reasons for riding AVs and the most desired AV features. These sets of questions consider both the driving assistance technologies as well as autono-mous features. Again, respondents could select multiple options. In view of motivations, lower levels of driving stress and safety improvement were the two main reasons for both generations. On the other hand, Millennials were more likely to consider better technology and multitasking as reasons to drive AVs. However, no need for parking and mobility for non-drivers were stronger motivations for Generation Xers. Regarding desired AV features, both generations selected collision avoidance and improved fuel efficiency as the most desired features. A higher percentage of Millennials desired fuel efficiency and fully con-nected features compared to Generation Xers. The t-test results indicated that the mean of all attitudinal indicators, except for those related to collision avoidance, drive themselves, and lane-keeping assistance, were statistically significant between the two generations.
Factor analysis
Incorporating a large number of correlated variables into the model is challenging, as it might affect the validity of the model results. In this study, factor analysis was employed to convert the indicators presented in Fig. 1 through Fig. 4 into a set of uncorrelated latent factors. Factor analysis has been extensively used to investigate people’s attitudes and pref-erences (Haboucha et al. 2017; Malokin et al. 2019). In this study, Bartlett factor scores were extracted. Contrary to the regression, Bartlett factor scores produce unbiased score estimations for the related factors (Hershberger 2005; DiStefano et al. 2009).
0%10%20%30%40%50%60%
Generation Xers Millennials
Reasons to ride an AV
Improved Safety Be�er technologyMul�tasking No need for parkingReduced driving stress Mobility for non-driversIncreased road capacity/ Reduced traffic Congestion
0%10%20%30%40%50%60%
Generation Xers Millennials
Most Desired AV Features
Avoid collision or reduce severity of a collision Improve fuel efficiencyHelp with steering Drive themselvesFully connected Adaptive cruise controlLane keeping assist Self parking assist
Fig. 4 Reasons for riding AVs and the most desired AV features
Transportation
1 3
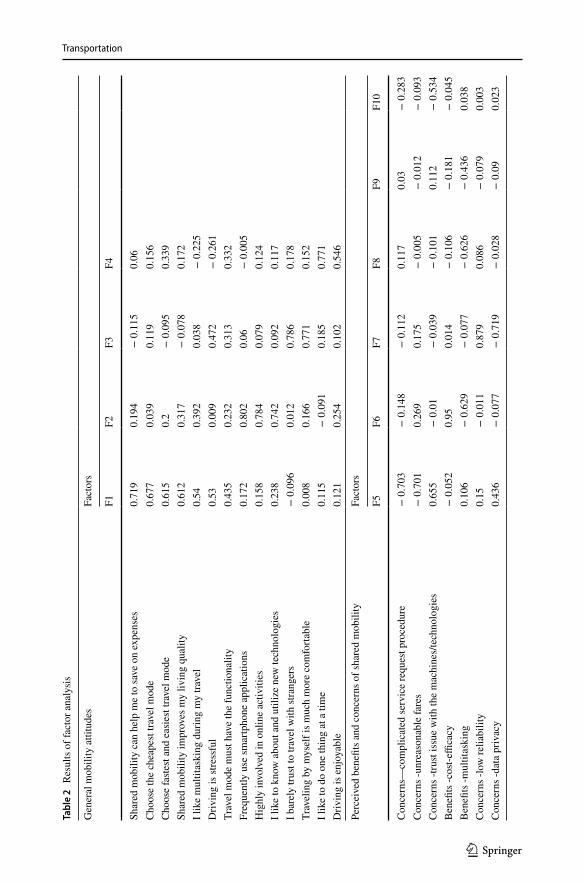
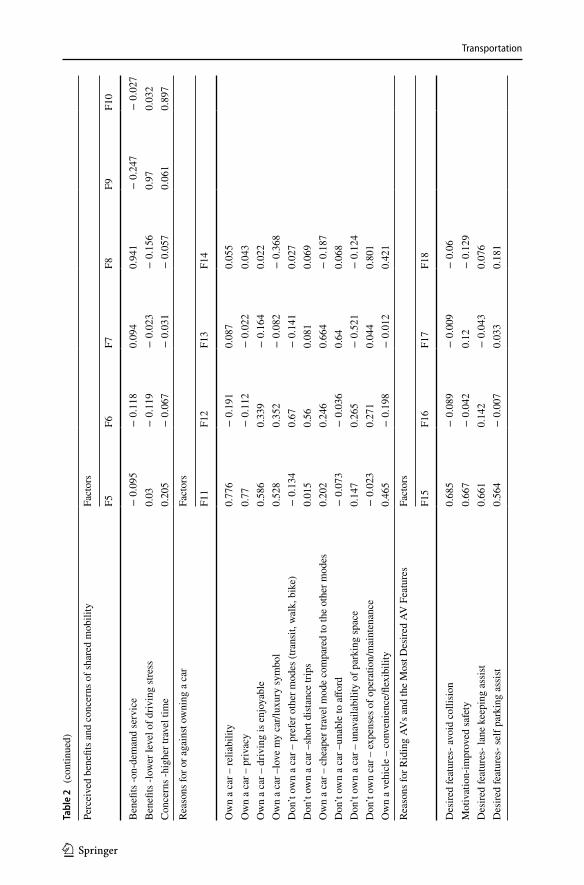
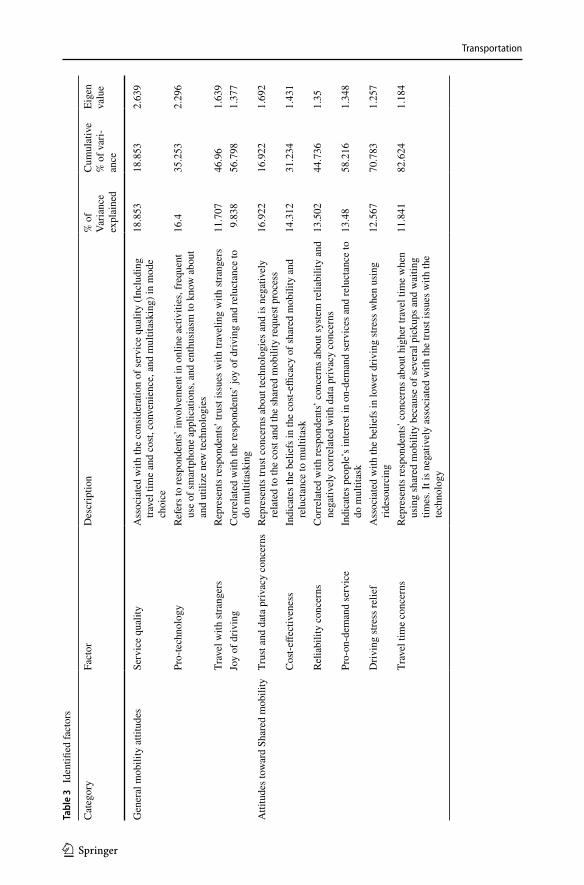
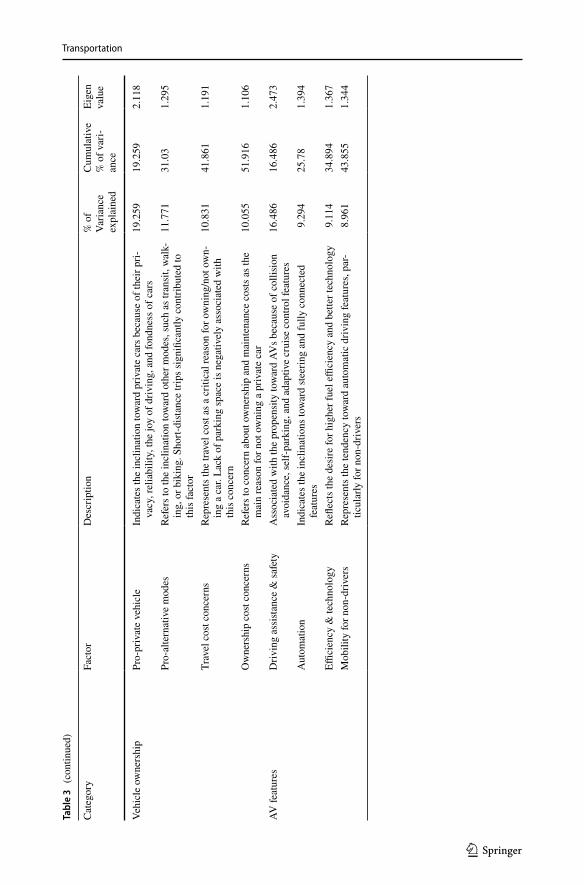
For each set of questions, separate explanatory factor analyses were applied. Table 2 presents the results of the factor analysis. The Eigenvalue larger than one was used as the criterion to specify the number of factors. Eigenvalue measures how much of the variance of the indicators a factor can explain. Highlighted cells show the indicators associated with each identified factor; green cells represent a positive association with the factor, while blue cells reflect a negative association. All indicators are presented in Fig. 1 through Fig. 4. Table 3 presents the list of all factors, including the labels and description of the factors, the percent of explained variance by each factor, the total explained variance for each category, and the eigenvalues for each factor.
Model structure
The survey presented multiple scenarios to each respondent, who were asked to select the most likely mode they would use in each scenario. Hence multiple responses were col-lected from each individual, which rendered the survey data with a panel structure. To address the potential variations in individuals’ behavior, we employed an error component model structure, one of the most frequently used approaches for analyzing panel data in econometrics (Hensher et al., 2005). The variability in a panel has two potential compo-nents, the cross-group variability that measures the taste heterogeneity among individu-als and the within-group variability that reflects the intra-person variability between the scenarios.
The error component logit model is an expansion of the multinomial logit (MNL) mod-els. In MNL models, the utility associated with each mode is presumed to be stochastic and is defined by a linear form of explanatory variables; and the error term ∈ij , which accounts for the stochastic portion. ∈ij is assumed to be independently and identically distributed (IID) (McFadden 1973), and users are assumed to select the option that maximizes the utility.
To account for the presence of heterogeneity in the choice of individuals among modes, an error component terms ( �kr) were included in the utility function of the MNL model. This model is called the error component multinomial logit model and can be expressed as below:
Ykr is the perceived utility of mode r for individual k, ar . is the constant, B is the vector of coefficients,xkr is the observed explanatory variables, Vkr is a subgroup of independent vari-ables with random distributions among people, �kr(error component term) is presumed to have a normal distribution, and ∈kr is the random error.
In this study, we assumed that travel time and costs have random distritions among indi-viduals. Additionally, to capture the correlations between exclusive and shared ridesourc-ing services, a nested structure was defined. The utility function of the nested logit error component model can be expressed as follows:
Where.Ykrm = Utility of respondent k selecting mode r in scenario m.ar = Mode-specific constant.
(1)Ykr = ar + Bxkr + �krVkr+ ∈kr
(2)Ykrm = ar +(
Bxkr)
+
(
BT + �T�kT
)
Trm +
(
BC + �C�kC
)
Crm + �r�n�k,n+ ∈kmr
Transportation
1 3
Tabl
e 2
Res
ults
of f
acto
r ana
lysi
s
Gen
eral
mob
ility
atti
tude
sFa
ctor
s
F1F2
F3F4
Shar
ed m
obili
ty c
an h
elp
me
to sa
ve o
n ex
pens
es0.
719
0.19
4−
0.1
150.
06C
hoos
e th
e ch
eape
st tra
vel m
ode
0.67
70.
039
0.11
90.
156
Cho
ose
faste
st an
d ea
sies
t tra
vel m
ode
0.61
50.
2−
0.0
950.
339
Shar
ed m
obili
ty im
prov
es m
y liv
ing
qual
ity0.
612
0.31
7−
0.0
780.
172
I lik
e m
ultit
aski
ng d
urin
g m
y tra
vel
0.54
0.39
20.
038
− 0
.225
Driv
ing
is st
ress
ful
0.53
0.00
90.
472
− 0
.261
Trav
el m
ode
mus
t hav
e th
e fu
nctio
nalit
y0.
435
0.23
20.
313
0.33
2Fr
eque
ntly
use
smar
tpho
ne a
pplic
atio
ns0.
172
0.80
20.
06−
0.0
05H
ighl
y in
volv
ed in
onl
ine
activ
ities
0.15
80.
784
0.07
90.
124
I lik
e to
kno
w a
bout
and
util
ize
new
tech
nolo
gies
0.23
80.
742
0.09
20.
117
I bar
ely
trust
to tr
avel
with
stra
nger
s−
0.0
960.
012
0.78
60.
178
Trav
elin
g by
mys
elf i
s muc
h m
ore
com
forta
ble
0.00
80.
166
0.77
10.
152
I lik
e to
do
one
thin
g at
a ti
me
0.11
5−
0.0
910.
185
0.77
1D
rivin
g is
enj
oyab
le0.
121
0.25
40.
102
0.54
6
Perc
eive
d be
nefit
s and
con
cern
s of s
hare
d m
obili
tyFa
ctor
s
F5F6
F7F8
F9F1
0
Con
cern
s—co
mpl
icat
ed se
rvic
e re
ques
t pro
cedu
re−
0.7
03−
0.1
48−
0.1
120.
117
0.03
− 0
.283
Con
cern
s -un
reas
onab
le fa
res
− 0
.701
0.26
90.
175
− 0
.005
− 0
.012
− 0
.093
Con
cern
s -tru
st is
sue
with
the
mac
hine
s/te
chno
logi
es0.
655
− 0
.01
− 0
.039
− 0
.101
0.11
2−
0.5
34B
enefi
ts -c
ost-e
ffica
cy−
0.0
520.
950.
014
− 0
.106
− 0
.181
− 0
.045
Ben
efits
-mul
titas
king
0.10
6−
0.6
29−
0.0
77−
0.6
26−
0.4
360.
038
Con
cern
s -lo
w re
liabi
lity
0.15
− 0
.011
0.87
90.
086
− 0
.079
0.00
3C
once
rns -
data
priv
acy
0.43
6−
0.0
77−
0.7
19−
0.0
28−
0.0
90.
023
Transportation
1 3
Tabl
e 2
(con
tinue
d)
Perc
eive
d be
nefit
s and
con
cern
s of s
hare
d m
obili
tyFa
ctor
s
F5F6
F7F8
F9F1
0
Ben
efits
-on-
dem
and
serv
ice
− 0
.095
− 0
.118
0.09
40.
941
− 0
.247
− 0
.027
Ben
efits
-low
er le
vel o
f driv
ing
stres
s0.
03−
0.1
19−
0.0
23−
0.1
560.
970.
032
Con
cern
s -hi
gher
trav
el ti
me
0.20
5−
0.0
67−
0.0
31−
0.0
570.
061
0.89
7
Reas
ons f
or o
r aga
inst
owni
ng a
car
Fact
ors
F11
F12
F13
F14
Ow
n a
car –
relia
bilit
y0.
776
− 0
.191
0.08
70.
055
Ow
n a
car –
priv
acy
0.77
− 0
.112
− 0
.022
0.04
3O
wn
a ca
r – d
rivin
g is
enj
oyab
le0.
586
0.33
9−
0.1
640.
022
Ow
n a
car –
love
my
car/l
uxur
y sy
mbo
l0.
528
0.35
2−
0.0
82−
0.3
68D
on’t
own
a ca
r – p
refe
r oth
er m
odes
(tra
nsit,
wal
k, b
ike)
− 0
.134
0.67
− 0
.141
0.02
7D
on’t
own
a ca
r –sh
ort d
istan
ce tr
ips
0.01
50.
560.
081
0.06
9O
wn
a ca
r – c
heap
er tr
avel
mod
e co
mpa
red
to th
e ot
her m
odes
0.20
20.
246
0.66
4−
0.1
87D
on’t
own
a ca
r –un
able
to a
fford
− 0
.073
− 0
.036
0.64
0.06
8D
on’t
own
a ca
r – u
nava
ilabi
lity
of p
arki
ng sp
ace
0.14
70.
265
− 0
.521
− 0
.124
Don
’t ow
n ca
r – e
xpen
ses o
f ope
ratio
n/m
aint
enan
ce−
0.0
230.
271
0.04
40.
801
Ow
n a
vehi
cle
– co
nven
ienc
e/fle
xibi
lity
0.46
5−
0.1
98−
0.0
120.
421
Reas
ons f
or R
idin
g AV
s and
the
Mos
t Des
ired
AV F
eatu
res
Fact
ors
F15
F16
F17
F18
Des
ired
feat
ures
- avo
id c
ollis
ion
0.68
5−
0.0
89−
0.0
09−
0.0
6M
otiv
atio
n-im
prov
ed sa
fety
0.66
7−
0.0
420.
12−
0.1
29D
esire
d fe
atur
es- l
ane
keep
ing
assi
st0.
661
0.14
2−
0.0
430.
076
Des
ired
feat
ures
- sel
f par
king
ass
ist0.
564
− 0
.007
0.03
30.
181
Transportation
1 3
Tabl
e 2
(con
tinue
d)
Reas
ons f
or R
idin
g AV
s and
the
Mos
t Des
ired
AV F
eatu
res
Fact
ors
F15
F16
F17
F18
Mot
ivat
ion-
incr
ease
d ro
ad c
apac
ity/ r
educ
ed tr
affic
cong
estio
n0.
556
− 0
.098
0.01
0.15
4M
otiv
atio
n- re
duce
d dr
ivin
g str
ess
0.49
20.
009
0.32
60.
263
Des
ired
feat
ures
- ada
ptiv
e cr
uise
con
trol
0.41
10.
395
0.18
7−
0.1
27D
esire
d fe
atur
es-s
teer
ing
− 0
.039
0.66
− 0
.035
− 0
.022
Des
ired
feat
ures
- ful
ly c
onne
cted
− 0
.067
0.61
50.
035
0.25
3D
esire
d fe
atur
es- i
mpr
ove
fuel
effi
cien
cy0.
138
− 0
.275
0.75
70.
033
Mot
ivat
ion-
bet
ter t
echn
olog
y0.
024
0.39
50.
651
− 0
.12
Mot
ivat
ion-
mul
titas
king
− 0
.007
0.31
70.
370.
198
Des
ired
feat
ures
- driv
e th
emse
lves
− 0
.014
0.02
10.
209
0.64
6M
otiv
atio
n- m
obili
ty fo
r non
-driv
ers
0.24
− 0
.037
0.00
10.
578
Mot
ivat
ion-
no
need
for p
arki
ng0.
001
0.22
3−
0.1
70.
554
Transportation
1 3
Tabl
e 3
Iden
tified
fact
ors
Cat
egor
yFa
ctor
Des
crip
tion
% o
f Va
rianc
e ex
plai
ned
Cum
ulat
ive
% o
f var
i-an
ce
Eige
nva
lue
Gen
eral
mob
ility
atti
tude
sSe
rvic
e qu
ality
Ass
ocia
ted
with
the
cons
ider
atio
n of
serv
ice
qual
ity (I
nclu
ding
tra
vel t
ime
and
cost,
con
veni
ence
, and
mul
titas
king
) in
mod
e ch
oice
18.8
5318
.853
2.63
9
Pro-
tech
nolo
gyRe
fers
to re
spon
dent
s’ in
volv
emen
t in
onlin
e ac
tiviti
es, f
requ
ent
use
of sm
artp
hone
app
licat
ions
, and
ent
husi
asm
to k
now
abo
ut
and
utili
ze n
ew te
chno
logi
es
16.4
35.2
532.
296
Trav
el w
ith st
rang
ers
Repr
esen
ts re
spon
dent
s’ tr
ust i
ssue
s with
trav
elin
g w
ith st
rang
ers
11.7
0746
.96
1.63
9Jo
y of
driv
ing
Cor
rela
ted
with
the
resp
onde
nts’
joy
of d
rivin
g an
d re
luct
ance
to
do m
ultit
aski
ng9.
838
56.7
981.
377
Atti
tude
s tow
ard
Shar
ed m
obili
tyTr
ust a
nd d
ata
priv
acy
conc
erns
Repr
esen
ts tr
ust c
once
rns a
bout
tech
nolo
gies
and
is n
egat
ivel
y re
late
d to
the
cost
and
the
shar
ed m
obili
ty re
ques
t pro
cess
16.9
2216
.922
1.69
2
Cos
t-effe
ctiv
enes
sIn
dica
tes t
he b
elie
fs in
the
cost-
effica
cy o
f sha
red
mob
ility
and
re
luct
ance
to m
ultit
ask
14.3
1231
.234
1.43
1
Relia
bilit
y co
ncer
nsC
orre
late
d w
ith re
spon
dent
s’ c
once
rns a
bout
syste
m re
liabi
lity
and
nega
tivel
y co
rrel
ated
with
dat
a pr
ivac
y co
ncer
ns13
.502
44.7
361.
35
Pro-
on-d
eman
d se
rvic
eIn
dica
tes p
eopl
e’s i
nter
est i
n on
-dem
and
serv
ices
and
relu
ctan
ce to
do
mul
titas
k13
.48
58.2
161.
348
Driv
ing
stres
s rel
ief
Ass
ocia
ted
with
the
belie
fs in
low
er d
rivin
g str
ess w
hen
usin
g rid
esou
rcin
g12
.567
70.7
831.
257
Trav
el ti
me
conc
erns
Repr
esen
ts re
spon
dent
s’ c
once
rns a
bout
hig
her t
rave
l tim
e w
hen
usin
g sh
ared
mob
ility
bec
ause
of s
ever
al p
icku
ps a
nd w
aitin
g tim
es. I
t is n
egat
ivel
y as
soci
ated
with
the
trust
issu
es w
ith th
e te
chno
logy
11.8
4182
.624
1.18
4
Transportation
1 3
Tabl
e 3
(con
tinue
d)
Cat
egor
yFa
ctor
Des
crip
tion
% o
f Va
rianc
e ex
plai
ned
Cum
ulat
ive
% o
f var
i-an
ce
Eige
nva
lue
Vehi
cle
owne
rshi
pPr
o-pr
ivat
e ve
hicl
eIn
dica
tes t
he in
clin
atio
n to
war
d pr
ivat
e ca
rs b
ecau
se o
f the
ir pr
i-va
cy, r
elia
bilit
y, th
e jo
y of
driv
ing,
and
fond
ness
of c
ars
19.2
5919
.259
2.11
8
Pro-
alte
rnat
ive
mod
esRe
fers
to th
e in
clin
atio
n to
war
d ot
her m
odes
, suc
h as
tran
sit,
wal
k-in
g, o
r bik
ing.
Sho
rt-di
stan
ce tr
ips s
igni
fican
tly c
ontri
bute
d to
th
is fa
ctor
11.7
7131
.03
1.29
5
Trav
el c
ost c
once
rns
Repr
esen
ts th
e tra
vel c
ost a
s a c
ritic
al re
ason
for o
wni
ng/n
ot o
wn-
ing
a ca
r. La
ck o
f par
king
spac
e is
neg
ativ
ely
asso
ciat
ed w
ith
this
con
cern
10.8
3141
.861
1.19
1
Ow
ners
hip
cost
conc
erns
Refe
rs to
con
cern
abo
ut o
wne
rshi
p an
d m
aint
enan
ce c
osts
as t
he
mai
n re
ason
for n
ot o
wni
ng a
priv
ate
car
10.0
5551
.916
1.10
6
AV fe
atur
esD
rivin
g as
sist
ance
& sa
fety
Ass
ocia
ted
with
the
prop
ensi
ty to
war
d AV
s bec
ause
of c
ollis
ion
avoi
danc
e, se
lf-pa
rkin
g, a
nd a
dapt
ive
crui
se c
ontro
l fea
ture
s16
.486
16.4
862.
473
Aut
omat
ion
Indi
cate
s the
incl
inat
ions
tow
ard
steer
ing
and
fully
con
nect
ed
feat
ures
9.29
425
.78
1.39
4
Effici
ency
& te
chno
logy
Refle
cts t
he d
esire
for h
ighe
r fue
l effi
cien
cy a
nd b
ette
r tec
hnol
ogy
9.11
434
.894
1.36
7M
obili
ty fo
r non
-driv
ers
Repr
esen
ts th
e te
nden
cy to
war
d au
tom
atic
driv
ing
feat
ures
, par
-tic
ular
ly fo
r non
-driv
ers
8.96
143
.855
1.34
4
Transportation
1 3
B = Fixed coefficients.xkr = Fixed explanatory variables.BT = Mean Coefficient of travel time.BC = Mean Coefficients of travel cost.�T = Standard deviations of travel time.�C = Standard deviations of travel cost.Trm = Travel time of mode r in scenario m.Crm = Travel cost of mode r in scenario m.�r = if mode r goes to the nest, it is equal to 1; otherwise, it is 0.�n = The covariance factor for the nest.�k,T , �k,C, �k,n = Standard normal random effects ~ N (0,1).∈kmr = I.I. D error term.
Model results
Since the main objective of this study is to understand the potential differences between Generation Xers and Millennials regarding their propensity toward ridesourcing services, separate error component models were developed for these two generations. Both MNL and NL structures were explored. For NL models, the nest was defined for shared and exclusive ridesourcing services.
As mentioned earlier, each respondent was asked to choose among three alternatives, including one conventional mode (driver, passenger, or transit depending on the mode in their regular trip) and two ridesourcing modes (exclusive rides and shared rides). The con-ventional mode serves as the reference alternative. A full model with all the independent variables was defined for each generation. At the 90% significance level, the models were optimized by eliminating insignificant variables while considering the improvement in the model’s performance (evaluated using log-likelihood value). The variables not selected in the first run of optimization were reevaluated to obtain a fully optimized model.
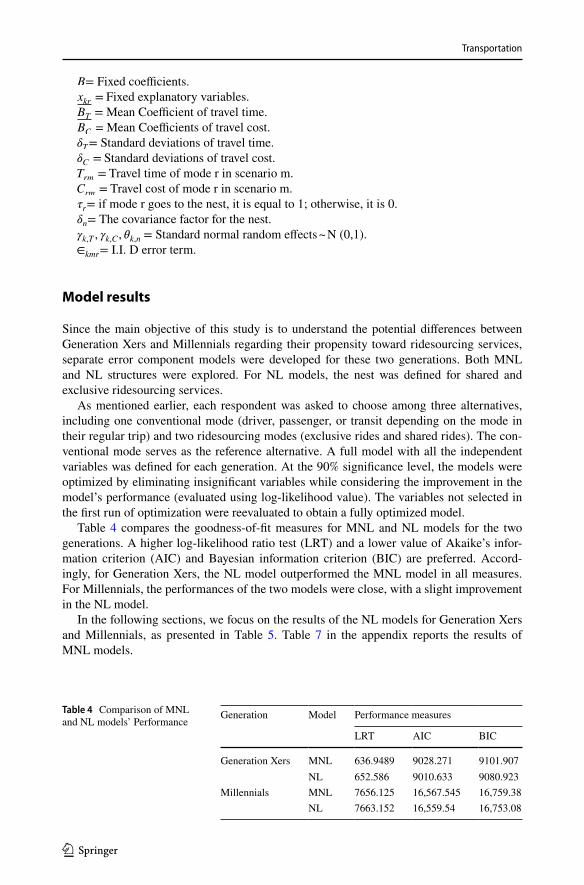
Table 4 compares the goodness-of-fit measures for MNL and NL models for the two generations. A higher log-likelihood ratio test (LRT) and a lower value of Akaike’s infor-mation criterion (AIC) and Bayesian information criterion (BIC) are preferred. Accord-ingly, for Generation Xers, the NL model outperformed the MNL model in all measures. For Millennials, the performances of the two models were close, with a slight improvement in the NL model.
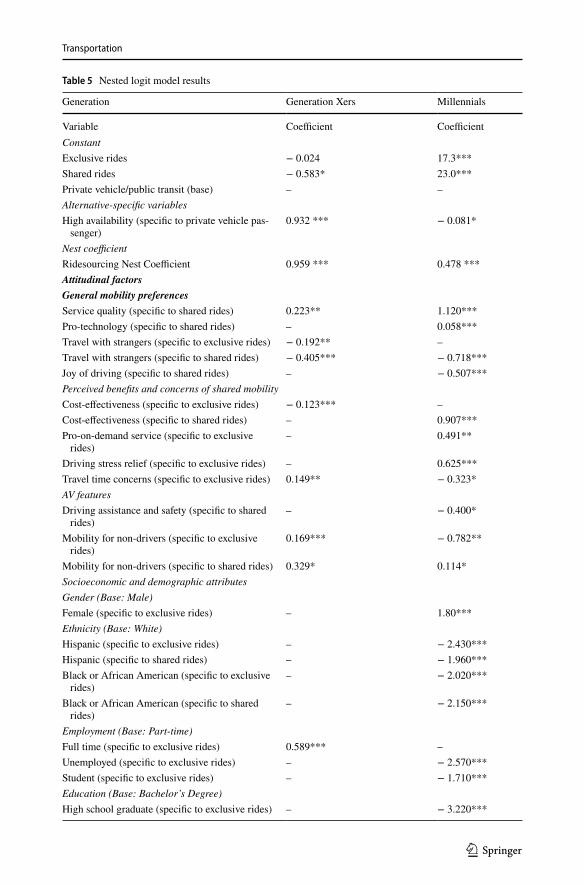
In the following sections, we focus on the results of the NL models for Generation Xers and Millennials, as presented in Table 5. Table 7 in the appendix reports the results of MNL models.
Table 4 Comparison of MNL and NL models’ Performance
Generation Model Performance measures
LRT AIC BIC
Generation Xers MNL 636.9489 9028.271 9101.907NL 652.586 9010.633 9080.923
Millennials MNL 7656.125 16,567.545 16,759.38NL 7663.152 16,559.54 16,753.08
Transportation
1 3
Table 5 Nested logit model results
Generation Generation Xers Millennials
Variable Coefficient CoefficientConstantExclusive rides − 0.024 17.3***Shared rides − 0.583* 23.0***Private vehicle/public transit (base) – –Alternative-specific variablesHigh availability (specific to private vehicle pas-
senger)0.932 *** − 0.081*
Nest coefficientRidesourcing Nest Coefficient 0.959 *** 0.478 ***Attitudinal factorsGeneral mobility preferencesService quality (specific to shared rides) 0.223** 1.120***Pro-technology (specific to shared rides) – 0.058***Travel with strangers (specific to exclusive rides) − 0.192** –Travel with strangers (specific to shared rides) − 0.405*** − 0.718***Joy of driving (specific to shared rides) – − 0.507***Perceived benefits and concerns of shared mobilityCost-effectiveness (specific to exclusive rides) − 0.123*** –Cost-effectiveness (specific to shared rides) – 0.907***Pro-on-demand service (specific to exclusive
rides)– 0.491**
Driving stress relief (specific to exclusive rides) – 0.625***Travel time concerns (specific to exclusive rides) 0.149** − 0.323*AV featuresDriving assistance and safety (specific to shared
rides)– − 0.400*
Mobility for non-drivers (specific to exclusive rides)
0.169*** − 0.782**
Mobility for non-drivers (specific to shared rides) 0.329* 0.114*Socioeconomic and demographic attributesGender (Base: Male)Female (specific to exclusive rides) – 1.80***Ethnicity (Base: White)Hispanic (specific to exclusive rides) – − 2.430***Hispanic (specific to shared rides) – − 1.960***Black or African American (specific to exclusive
rides)– − 2.020***
Black or African American (specific to shared rides)
– − 2.150***
Employment (Base: Part-time)Full time (specific to exclusive rides) 0.589*** –Unemployed (specific to exclusive rides) – − 2.570***Student (specific to exclusive rides) – − 1.710***Education (Base: Bachelor’s Degree)High school graduate (specific to exclusive rides) – − 3.220***
Transportation
1 3
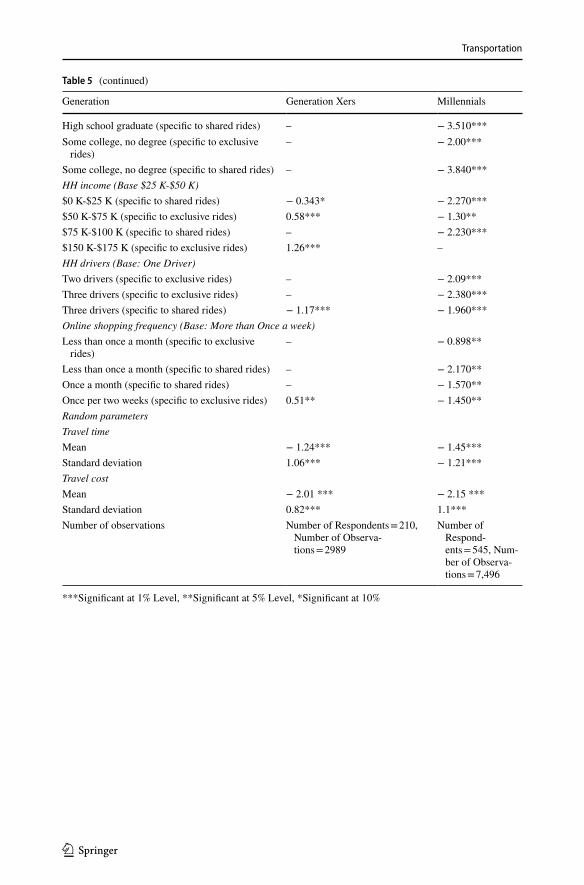
Table 5 (continued)
Generation Generation Xers Millennials
High school graduate (specific to shared rides) – − 3.510***Some college, no degree (specific to exclusive
rides)– − 2.00***
Some college, no degree (specific to shared rides) – − 3.840***HH income (Base $25 K-$50 K)$0 K-$25 K (specific to shared rides) − 0.343* − 2.270***$50 K-$75 K (specific to exclusive rides) 0.58*** − 1.30**$75 K-$100 K (specific to shared rides) – − 2.230***$150 K-$175 K (specific to exclusive rides) 1.26*** –HH drivers (Base: One Driver)Two drivers (specific to exclusive rides) – − 2.09***Three drivers (specific to exclusive rides) – − 2.380***Three drivers (specific to shared rides) − 1.17*** − 1.960***Online shopping frequency (Base: More than Once a week)Less than once a month (specific to exclusive
rides)– − 0.898**
Less than once a month (specific to shared rides) – − 2.170**Once a month (specific to shared rides) – − 1.570**Once per two weeks (specific to exclusive rides) 0.51** − 1.450**Random parametersTravel timeMean − 1.24*** − 1.45***Standard deviation 1.06*** − 1.21***Travel costMean − 2.01 *** − 2.15 ***Standard deviation 0.82*** 1.1***Number of observations Number of Respondents = 210,
Number of Observa-tions = 2989
Number of Respond-ents = 545, Num-ber of Observa-tions = 7,496
***Significant at 1% Level, **Significant at 5% Level, *Significant at 10%
Transportation
1 3
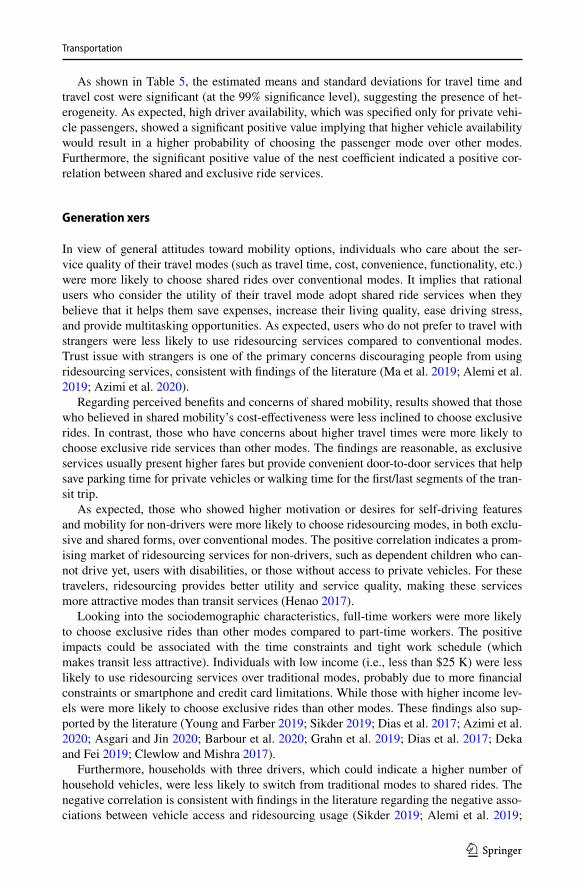
As shown in Table 5, the estimated means and standard deviations for travel time and travel cost were significant (at the 99% significance level), suggesting the presence of het-erogeneity. As expected, high driver availability, which was specified only for private vehi-cle passengers, showed a significant positive value implying that higher vehicle availability would result in a higher probability of choosing the passenger mode over other modes. Furthermore, the significant positive value of the nest coefficient indicated a positive cor-relation between shared and exclusive ride services.
Generation xers
In view of general attitudes toward mobility options, individuals who care about the ser-vice quality of their travel modes (such as travel time, cost, convenience, functionality, etc.) were more likely to choose shared rides over conventional modes. It implies that rational users who consider the utility of their travel mode adopt shared ride services when they believe that it helps them save expenses, increase their living quality, ease driving stress, and provide multitasking opportunities. As expected, users who do not prefer to travel with strangers were less likely to use ridesourcing services compared to conventional modes. Trust issue with strangers is one of the primary concerns discouraging people from using ridesourcing services, consistent with findings of the literature (Ma et al. 2019; Alemi et al. 2019; Azimi et al. 2020).
Regarding perceived benefits and concerns of shared mobility, results showed that those who believed in shared mobility’s cost-effectiveness were less inclined to choose exclusive rides. In contrast, those who have concerns about higher travel times were more likely to choose exclusive ride services than other modes. The findings are reasonable, as exclusive services usually present higher fares but provide convenient door-to-door services that help save parking time for private vehicles or walking time for the first/last segments of the tran-sit trip.
As expected, those who showed higher motivation or desires for self-driving features and mobility for non-drivers were more likely to choose ridesourcing modes, in both exclu-sive and shared forms, over conventional modes. The positive correlation indicates a prom-ising market of ridesourcing services for non-drivers, such as dependent children who can-not drive yet, users with disabilities, or those without access to private vehicles. For these travelers, ridesourcing provides better utility and service quality, making these services more attractive modes than transit services (Henao 2017).
Looking into the sociodemographic characteristics, full-time workers were more likely to choose exclusive rides than other modes compared to part-time workers. The positive impacts could be associated with the time constraints and tight work schedule (which makes transit less attractive). Individuals with low income (i.e., less than $25 K) were less likely to use ridesourcing services over traditional modes, probably due to more financial constraints or smartphone and credit card limitations. While those with higher income lev-els were more likely to choose exclusive rides than other modes. These findings also sup-ported by the literature (Young and Farber 2019; Sikder 2019; Dias et al. 2017; Azimi et al. 2020; Asgari and Jin 2020; Barbour et al. 2020; Grahn et al. 2019; Dias et al. 2017; Deka and Fei 2019; Clewlow and Mishra 2017).
Furthermore, households with three drivers, which could indicate a higher number of household vehicles, were less likely to switch from traditional modes to shared rides. The negative correlation is consistent with findings in the literature regarding the negative asso-ciations between vehicle access and ridesourcing usage (Sikder 2019; Alemi et al. 2019;
Transportation
1 3
Gehrke et al. 2018). Individuals who shopped once every two weeks were likely to adopt exclusive rides than other modes, compared to those with other online shopping frequency levels.
Millennials
Similar to Generation Xers, those Millennials who cared about service quality were more likely to use shared rides, and those who had concerns on traveling with strangers were less likely to use shared rides. Unlike the Generation Xers, the concerns of traveling with strangers would not affect Millennials’ probability of adopting exclusive-ride services. Two additional attitudes played significant roles in Millennials’ mode choice: pro-technology and joy of driving. Specifically, Millennials with pro-technology attitudes were more likely to use shared-ride services than other modes. Familiarity with technology has been noted with positive impacts on adopting shared mobility in previous studies (Acheampong et al. 2020; Simmons 2018; Dias et al. 2017; Azimi et al. 2020; Alemi et al. 2019). Millennials who enjoyed driving were less likely to choose shared rides than other modes.
In view of perceived benefits and concerns of shared mobility, only one attitude showed significant impacts for both Generation Xers and Millennials. Interestingly, it showed the opposite effects between the two groups. Millennials who had concerns of higher travel time of shared mobility were less likely to use exclusive rides, while Generation Xers who shared the same concerns were more likely to use exclusive rides. This exhibited different views on travel time and perceptions of shared mobility between the two generations. It indicates that Millennials were more likely to use the conventional modes when they are under time constraints probably because they see these modes as more reliable and time-efficient options.
Again, additional attitudes were at play in Millennials’ mode choice behavior compared to the previous generation. Specifically, Millennials who appreciated the benefits of on-demand service and driving stress relief were more likely to prefer exclusive ridesourcing services, while those who care about the cost-effectiveness of shared mobility were more likely to prefer shared-ride services compared to those who do not perceive these as ben-efits of shared mobility services.
Regarding AV features, similar to Generation Xers, the desire for mobility for non-driv-ers would encourage Millennials to use shared rides, however, unlike the previous genera-tion, Millennials who shared the same attitude were less likely to adopt exclusive rides than other modes. This may be due to the financial constraints with non-drivers, who do not see exclusive rides as a viable option for regular use. From another perspective, this might also indicate that Millennials were less likely to be bothered by sharing rides with others.
Also, Millennials who look for driving assistance and safety features were less likely to prefer shared rides than conventional modes. This might indicate their desire to still partici-pate in driving activities to some degree.
Considering sociodemographic characteristics, more variables showed significant impacts on Millennials’ mode choice compared to Generation Xers, including gender, eth-nicity, and education. Female users were more likely to adopt exclusive services compared to male users. Hispanic and African American individuals were less likely to use rides-ourcing services (both exclusive and shared services) over traditional modes compared to Whites. As expected, unemployed individuals and students were less likely to adopt exclusive rides than other modes, probably due to their higher costs. Similarly, people with
Transportation
1 3
lower education levels (less than bachelor’s degree) were less likely to adopt ridesourcing services than conventional modes.
Direct elasticities and marginal effects
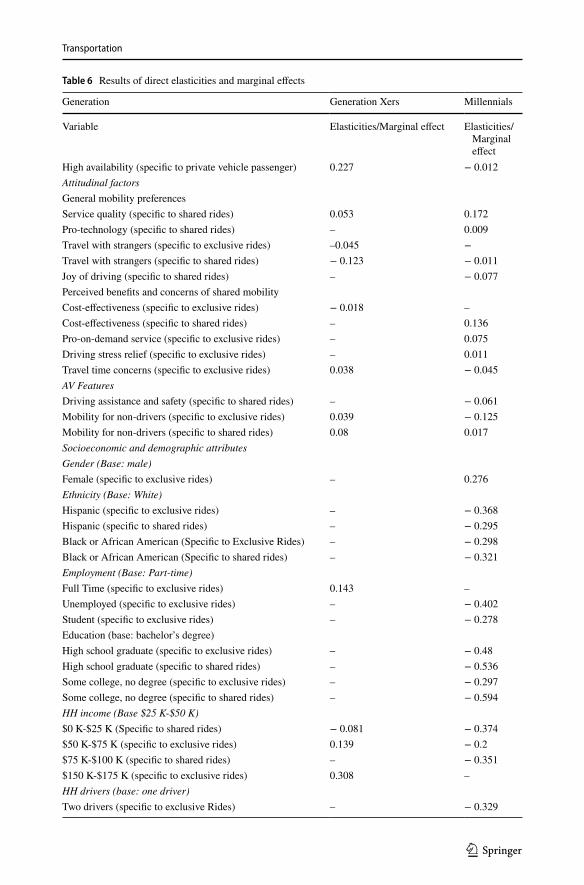
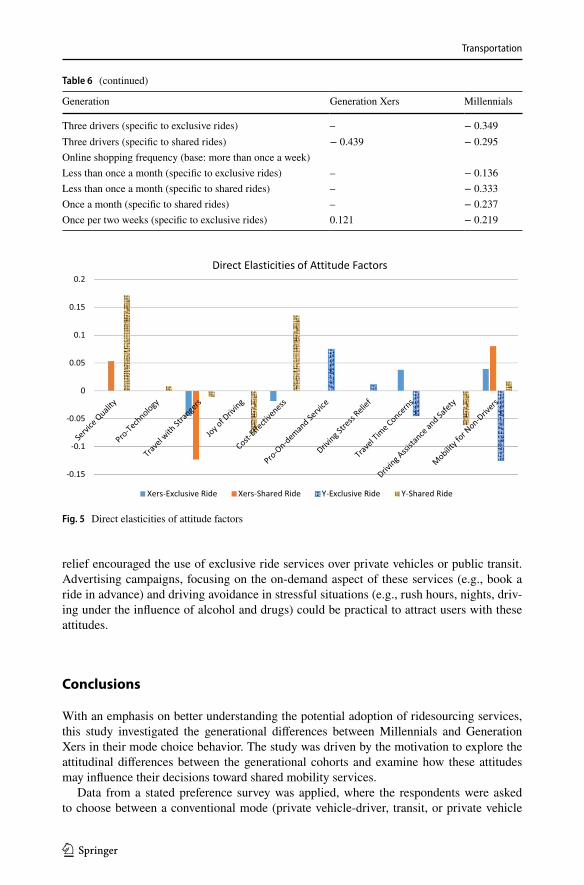
Since the magnitude and the sign of the variables is not interpretable, direct elasticities and marginal effects were calculated to compare the impact of estimated parameters. Direct elasticities, defined as the percent change in the probability of dependent variable due to 1% change in the estimated parameters, were estimated for the continuous variables (i.e., attitudinal factors) (Yang et al. 2013). Marginal effects, defined as the change in the prob-ability of the choice as the value of categorical variables changes from zero to one, were estimated for the dummy variables (i.e., SED factors) (Rasciute and Pentecost 2010). Table 6 presents the results of direct elasticities and marginal effects. Figure 5 shows the elasticity values for the attitude factors for Generation Xers and Millennials.
For Generation Xers, mobility for non-drivers was the most encouraging attitude toward exclusive rides and shared rides, increasing the probability of their adoption by about 4% and 8%, respectively. On the other hand, travel with strangers had the highest negative impact on the use of ridesourcing services, making individuals about 4.5 and 12.3% less likely to choose exclusive and shared rides, respectively.
For Millennials, the most encouraging attitude to use exclusive rides originated from the positive attitude toward on-demand services, increasing the probability of its adoption by 7.5%. Besides, the most encouraging attitudes toward shared rides was service quality and cost-effectiveness, increasing the probability of using shared rides by 17.2% and 13.6%, respectively. On the other hand, the attitude with the largest negative impact on exclusive and shared rides was mobility for non-drivers and the joy of driving, respectively. These attitudes reduced the probability of adopting exclusive rides and shared rides by 12.5% and 7.7%, respectively.
Policy implications
Ridesourcing services have grown considerably in the past few years, and they hold great potentials in societal, environmental, and economic benefits by providing mobility for non-drivers, potentially promoting shared mobility, and reducing vehicle ownership and vehicle emissions especially in shared ridesourcing form. This study focuses on the role of atti-tudes toward mobility options in ridesourcing adoption, and particularly the differences between the two generations, which could provide information for planners, service provid-ers and policy makers to develop specific strategies and programs that facilitate the growth of shared mobility.
In terms of similarities, for both generations, individuals who care about the service quality of their mode favor shared ridesourcing services over private vehicles or public transit. It indicates shared mobility as a viable option for those who believe it would save expenses and travel time, increase the quality of life, ease driving stress, and provide multi-tasking opportunities. Publicizing ridesourcing capabilities in decreasing travel time (e.g., private vehicle parking time or public transit access/egress and waiting time) could create a more positive perception of these services. Marketing plans focusing on driving avoidance in stressful situations (e.g., heavy traffic, peak-hour, drinking and driving) or multitasking
Transportation
1 3
ability (especially for commuters) also could be highly effective in attracting individuals who care about the utility of their travel mode.
For both generations, issues on traveling with strangers discourage the use of ridesourc-ing services. However, there were also notable differences. This issue discouraged the use of both exclusive and shared rides for Generation Xers, while it only showed significant negative impacts on Millennials’ use of shared rides. It indicates that while traveling with strangers is a major barrier toward the adoption of ridesourcing, Millennials were less likely to be bothered by this concern in their mode choice decisions. Some policies and strategies to address this concern may include imposing strict regulations for hiring drivers (checking for mental health and driving abilities), use of security cameras in ridesourcing fleet, drivers’ training sessions to improve their driving skills and attitudes, and responsive customer service (in case of any problem with the driver or other passengers).
Among the latent factors directly related to attitudes toward shared mobility, cost-effec-tiveness showed significant impacts for both groups. Generation Xers, who believed in the cost-effectiveness of shared mobility, were less likely to choose exclusive rides, while Mil-lennials with the same belief were more likely to choose shared ride services than other modes. It can be stated that the current fares for exclusive rides may still be high compared to driving private vehicles; reducing the fare of these services, providing reward programs, and offering deep discounts could encourage people to the more frequent use of these ser-vices. Future integration of these services with AV technologies may help reduce cost and make shared mobility a more cost-effective and attractive mode.
The concern about the higher travel time of ridesourcing services showed opposite effects for Generation Xers and Millennials. It encouraged the use of exclusive rides rather than private vehicles or transit among Generation Xers but had negative effects on Millen-nials’ propensity to choose ridesourcing services. It may imply that Generation Xers, who were more time-sensitive or on a tight schedule, would use an exclusive ride to save park-ing time or walking time to the destination, while Millennials may give a higher penalty for waiting times as they prefer to be on-the-move. Policies to improve service quality and reliability could affect the users’ perceptions toward ridesourcing services, especially for Millennials. Marketing strategies may focus on the convenience of ridesourcing trips (pro-viding door-to-door trips and multitasking ability) or their abilities to decrease travel time by eliminating private vehicles’ parking time or transit’s waiting time.
Similar findings were also observed for the desire toward mobility for non-drivers. While the desire for mobility for non-drivers showed a positive effect on the adoption of shared rides over traditional modes for both generation groups, it had opposite effects on the choice of exclusive ride. For Generation Xers who believed in the benefits of shared mobility in providing mobility for non-drivers, they had a positive inclination to use exclu-sive services over traditional modes, while Millennials with the same attitude were less likely to choose exclusive ride over traditional modes, probably due to lifestyle preferences or cost considerations. Non-drivers could represent dependent children who cannot drive yet, users with disabilities, or those without access to private vehicles. These users could be attracted to ridesourcing services since it gives them autonomy and freedom for their daily activities. Regular ridesourcing adoption, especially single-ride services, could be costly for non-drivers, and promotions and reward programs might be practical tools to attract these uses.
In addition, some factors showed unique impacts on Millennials’ mode choice behavior. Particularly, technology savviness encouraged the adoption of shared rides, while the joy of driving tended to discourage the use of shared ride services over private vehicles or pub-lic transit. Moreover, for Millennials, the benefits of on-demand service and driving-stress
Transportation
1 3
Table 6 Results of direct elasticities and marginal effects
Generation Generation Xers Millennials
Variable Elasticities/Marginal effect Elasticities/Marginal effect
High availability (specific to private vehicle passenger) 0.227 − 0.012Attitudinal factorsGeneral mobility preferencesService quality (specific to shared rides) 0.053 0.172Pro-technology (specific to shared rides) – 0.009Travel with strangers (specific to exclusive rides) –0.045 − Travel with strangers (specific to shared rides) − 0.123 − 0.011Joy of driving (specific to shared rides) – − 0.077Perceived benefits and concerns of shared mobilityCost-effectiveness (specific to exclusive rides) − 0.018 –Cost-effectiveness (specific to shared rides) – 0.136Pro-on-demand service (specific to exclusive rides) – 0.075Driving stress relief (specific to exclusive rides) – 0.011Travel time concerns (specific to exclusive rides) 0.038 − 0.045AV FeaturesDriving assistance and safety (specific to shared rides) – − 0.061Mobility for non-drivers (specific to exclusive rides) 0.039 − 0.125Mobility for non-drivers (specific to shared rides) 0.08 0.017Socioeconomic and demographic attributesGender (Base: male)Female (specific to exclusive rides) – 0.276Ethnicity (Base: White)Hispanic (specific to exclusive rides) – − 0.368Hispanic (specific to shared rides) – − 0.295Black or African American (Specific to Exclusive Rides) – − 0.298Black or African American (Specific to shared rides) – − 0.321Employment (Base: Part-time)Full Time (specific to exclusive rides) 0.143 –Unemployed (specific to exclusive rides) – − 0.402Student (specific to exclusive rides) – − 0.278Education (base: bachelor’s degree)High school graduate (specific to exclusive rides) – − 0.48High school graduate (specific to shared rides) – − 0.536Some college, no degree (specific to exclusive rides) – − 0.297Some college, no degree (specific to shared rides) – − 0.594HH income (Base $25 K-$50 K)$0 K-$25 K (Specific to shared rides) − 0.081 − 0.374$50 K-$75 K (specific to exclusive rides) 0.139 − 0.2$75 K-$100 K (specific to shared rides) – − 0.351$150 K-$175 K (specific to exclusive rides) 0.308 –HH drivers (base: one driver)Two drivers (specific to exclusive Rides) – − 0.329
Transportation
1 3
relief encouraged the use of exclusive ride services over private vehicles or public transit. Advertising campaigns, focusing on the on-demand aspect of these services (e.g., book a ride in advance) and driving avoidance in stressful situations (e.g., rush hours, nights, driv-ing under the influence of alcohol and drugs) could be practical to attract users with these attitudes.
Conclusions
With an emphasis on better understanding the potential adoption of ridesourcing services, this study investigated the generational differences between Millennials and Generation Xers in their mode choice behavior. The study was driven by the motivation to explore the attitudinal differences between the generational cohorts and examine how these attitudes may influence their decisions toward shared mobility services.
Data from a stated preference survey was applied, where the respondents were asked to choose between a conventional mode (private vehicle-driver, transit, or private vehicle
Table 6 (continued)
Generation Generation Xers Millennials
Three drivers (specific to exclusive rides) – − 0.349Three drivers (specific to shared rides) − 0.439 − 0.295Online shopping frequency (base: more than once a week)Less than once a month (specific to exclusive rides) – − 0.136Less than once a month (specific to shared rides) – − 0.333Once a month (specific to shared rides) – − 0.237Once per two weeks (specific to exclusive rides) 0.121 − 0.219
-0.15
-0.1
-0.05
0
0.05
0.1
0.15
0.2Direct Elasticities of Attitude Factors
Xers-Exclusive Ride Xers-Shared Ride Y-Exclusive Ride Y-Shared Ride
Fig. 5 Direct elasticities of attitude factors
Transportation
1 3
-passenger depending on their RP mode of a regular trip), exclusive ridesourcing, and shared ridesourcing services. Nested logit error component models were developed for Generation Xers and Millennials, respectively. Latent attitudes derived through factor anal-ysis were incorporated into models. A wide range of attitudinal indicators, including gen-eral mobility attitudes, perceived benefits and costs of shared mobility services, reasons for and against owning a car, reasons for riding AVs, and the most desired AV features, were considered to extract latent factors.
In terms of general mobility attitudes, Millennials were more likely to prefer multitask-ing during their trips. Notably, a higher proportion of Millennials believed that shared mobility increased their life quality, and they could save on their expenses by using shared mobility. Regarding the reasons for or against owning a car, a significantly higher percent-age of Millennials considered cost constraints a barrier to owning a vehicle. Besides, more Millennials cited short daily trips as a reason not to own a vehicle. This is consistent with the literature in that the younger generations preferred an urban lifestyle with more options for transit and non-motorized modes and proximity to daily activities. These findings show significant implications for future land development and urban design policies.
In terms of the impacts of these attitudes on their mode choice behavior, results from the nested logit models revealed similarities between the two generations. For instance, the belief that shared mobility would save expenses and travel time, increase the quality of life, and provide multitasking opportunities increased the probability of adopting ridesourcing for both groups. While those who were concerned about traveling with strangers were less likely to switch from traditional modes to these services. It should be noted that Generation Xers showed more concerns on this issue, which negatively affected their propensity to use even exclusive rides.
Distinct behaviors were also observed between Millennials and Generation Xers. For Generation Xers, their mode choice of ridesourcing was highly impacted by the perceived time and cost benefits of shared mobility. On the other hand, while travel cost is a deter-mining factor for Millennials, their mode choice was more likely to be influenced by their attitudes or desire toward technology, on-demand services, and driving stress relief than the older generation. Interestingly, the joy of driving showed a negative impact on the Millen-nials’ propensity to choose shared rides over traditional modes. The findings of this study present important and helpful insights into the propensity toward ridesourcing services. This study provides a more in-depth understanding of the distinct behavior of Generation Xers and Millennials toward shared ridesourcing services.
It should be noted that as data for this study were collected before the COVID-19 pan-demic, it does not reflect the impact of the outbreak on individuals’ mode choice behavior and attitudes toward ridesourcing services. COVID-19 substantially affected the adoption of ridesourcing services as well as individuals’ attitudes and perceptions toward these ser-vices (Morshed et al. 2021). We can anticipate that people, especially those who already use cars as their regular mode, are more likely to be attached to their private vehicles due to hygiene concerns and maintaining social distance (Shakibaei et al. 2021). Moreover,
Transportation
1 3
the concern about traveling with strangers probably is deepened during the pandemic, par-ticularly for Generation Xers. On the other hand, although ridesourcing services can adopt strategies like installing barriers between driver and passengers and providing sanitizers and thermometers to ensure the passengers of a safe trip, these measures probably would increase the fare of these services (Morshed et al. 2021). As a result, people may not per-ceive shared mobility services as cost-efficient travel modes for a long time.
The findings from this study are subject to the limitations of the dataset. The designed scenarios are based on the stated preference method, which might not fully resemble real-world situations. Future studies could focus on revealed preference scenarios. Moreover, as stated preference scenarios are based on hypothetical situations, the availability of rides-ourcing services was not verified across the study area. Future studies, which use revealed preference scenarios, need to check for the availability of these services in their study area. Further research could also benefit from large sample size and geographic areas. Research-ers are encouraged to apply this analysis to other datasets and further test the transferability of the findings. Explicit attitudes related to environmental concerns could be added to the survey data and may further strengthen the analysis. Future analysis can also investigate heterogeneity within the generations, such as between younger Millennials and older Mil-lennials. Further study may also explore the relationships between attitudinal factors and sociodemographic characteristics.
Appendix
See Table 7
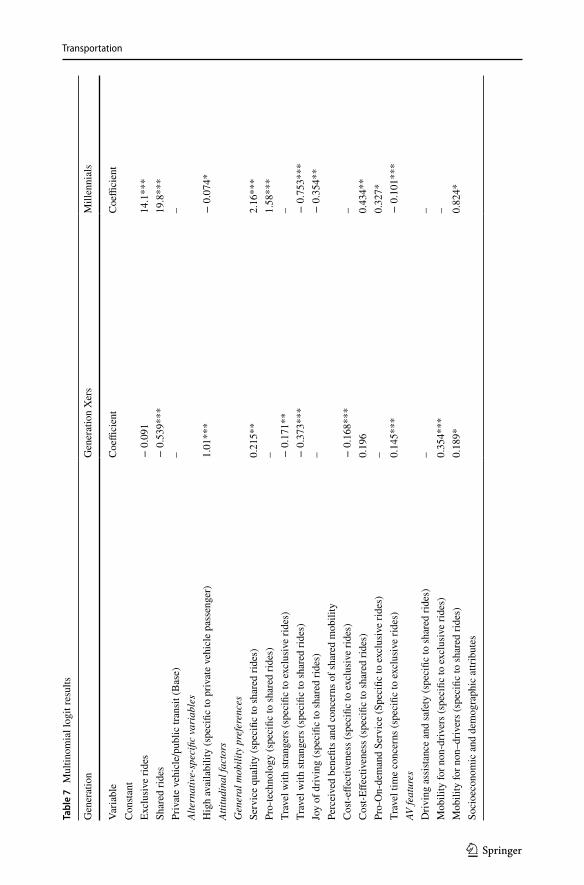
Transportation
1 3
Tabl
e 7
Mul
tinom
ial l
ogit
resu
lts
Gen
erat
ion
Gen
erat
ion
Xer
sM
illen
nial
s
Varia
ble
Coe
ffici
ent
Coe
ffici
ent
Con
stan
tEx
clus
ive
rides
− 0
.091
14.1
***
Shar
ed ri
des
− 0
.539
***
19.8
***
Priv
ate
vehi
cle/
publ
ic tr
ansi
t (B
ase)
––
Alte
rnat
ive-
spec
ific
vari
able
sH
igh
avai
labi
lity
(spe
cific
to p
rivat
e ve
hicl
e pa
ssen
ger)
1.01
***
− 0
.074
*At
titud
inal
fact
ors
Gen
eral
mob
ility
pre
fere
nces
Serv
ice
qual
ity (s
peci
fic to
shar
ed ri
des)
0.21
5**
2.16
***
Pro-
tech
nolo
gy (s
peci
fic to
shar
ed ri
des)
–1.
58**
*Tr
avel
with
stra
nger
s (sp
ecifi
c to
exc
lusi
ve ri
des)
− 0
.171
**–
Trav
el w
ith st
rang
ers (
spec
ific
to sh
ared
ride
s)−
0.3
73**
*−
0.7
53**
*Jo
y of
driv
ing
(spe
cific
to sh
ared
ride
s)–
− 0
.354
**Pe
rcei
ved
bene
fits a
nd c
once
rns o
f sha
red
mob
ility
Cos
t-effe
ctiv
enes
s (sp
ecifi
c to
exc
lusi
ve ri
des)
− 0
.168
***
–C
ost-E
ffect
iven
ess (
spec
ific
to sh
ared
ride
s)0.
196
0.43
4**
Pro-
On-
dem
and
Serv
ice
(Spe
cific
to e
xclu
sive
ride
s)–
0.32
7*Tr
avel
tim
e co
ncer
ns (s
peci
fic to
exc
lusi
ve ri
des)
0.14
5***
− 0
.101
***
AV fe
atur
esD
rivin
g as
sist
ance
and
safe
ty (s
peci
fic to
shar
ed ri
des)
––
Mob
ility
for n
on-d
river
s (sp
ecifi
c to
exc
lusi
ve ri
des)
0.35
4***
–M
obili
ty fo
r non
–driv
ers (
spec
ific
to sh
ared
ride
s)0.
189*
0.82
4*So
cioe
cono
mic
and
dem
ogra
phic
attr
ibut
es
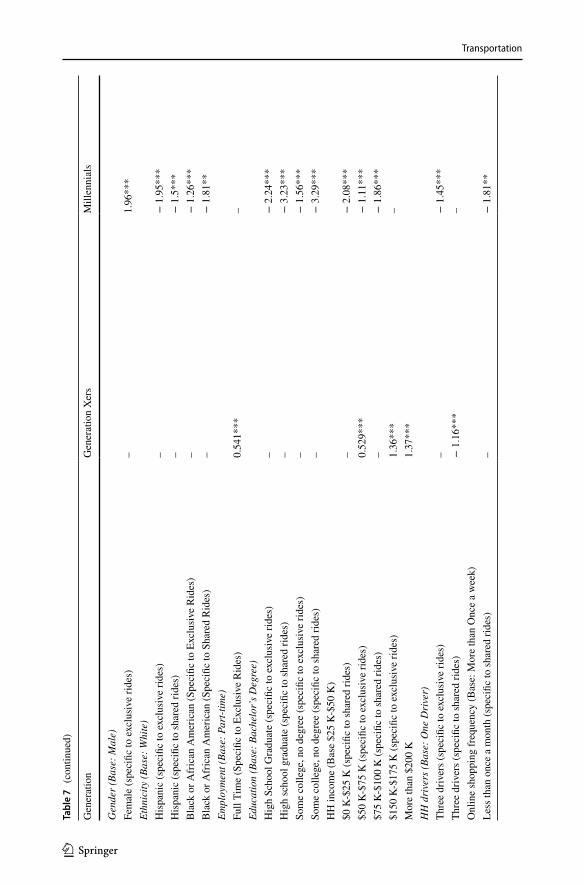
Transportation
1 3
Tabl
e 7
(con
tinue
d)
Gen
erat
ion
Gen
erat
ion
Xer
sM
illen
nial
s
Gen
der (
Base
: Mal
e)Fe
mal
e (s
peci
fic to
exc
lusi
ve ri
des)
–1.
96**
*Et
hnic
ity (B
ase:
Whi
te)
His
pani
c (s
peci
fic to
exc
lusi
ve ri
des)
–−
1.9
5***
His
pani
c (s
peci
fic to
shar
ed ri
des)
–−
1.5
***
Bla
ck o
r Afr
ican
Am
eric
an (S
peci
fic to
Exc
lusi
ve R
ides
)–
− 1
.26*
**B
lack
or A
fric
an A
mer
ican
(Spe
cific
to S
hare
d R
ides
)–
− 1
.81*
*Em
ploy
men
t (Ba
se: P
art-t
ime)
Full
Tim
e (S
peci
fic to
Exc
lusi
ve R
ides
)0.
541*
**–
Educ
atio
n (B
ase:
Bac
helo
r’s D
egre
e)H
igh
Scho
ol G
radu
ate
(spe
cific
to e
xclu
sive
ride
s)–
− 2
.24*
**H
igh
scho
ol g
radu
ate
(spe
cific
to sh
ared
ride
s)–
− 3
.23*
**So
me
colle
ge, n
o de
gree
(spe
cific
to e
xclu
sive
ride
s)–
− 1
.56*
**So
me
colle
ge, n
o de
gree
(spe
cific
to sh
ared
ride
s)–
− 3
.29*
**H
H in
com
e (B
ase
$25
K-$
50 K
)$0
K-$
25 K
(spe
cific
to sh
ared
ride
s)–
− 2
.08*
**$5
0 K
-$75
K (s
peci
fic to
exc
lusi
ve ri
des)
0.52
9***
− 1
.11*
**$7
5 K
-$10
0 K
(spe
cific
to sh
ared
ride
s)–
− 1
.86*
**$1
50 K
-$17
5 K
(spe
cific
to e
xclu
sive
ride
s)1.
36**
*–
Mor
e th
an $
200
K1.
37**
*H
H d
rive
rs (B
ase:
One
Dri
ver)
Thre
e dr
iver
s (sp
ecifi
c to
exc
lusi
ve ri
des)
–−
1.4
5***
Thre
e dr
iver
s (sp
ecifi
c to
shar
ed ri
des)
− 1
.16*
**–
Onl
ine
shop
ping
freq
uenc
y (B
ase:
Mor
e th
an O
nce
a w
eek)
Less
than
onc
e a
mon
th (s
peci
fic to
shar
ed ri
des)
–−
1.8
1**
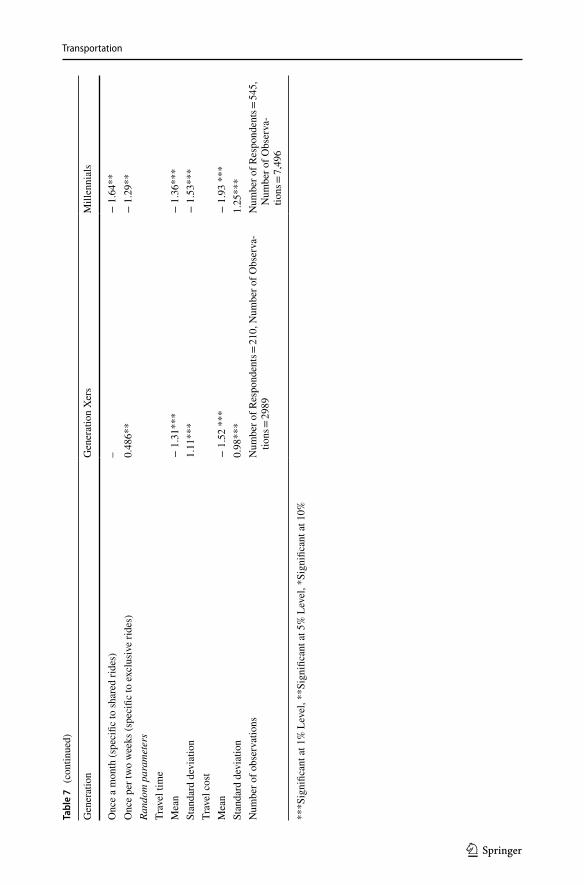
Transportation
1 3
Tabl
e 7
(con
tinue
d)
Gen
erat
ion
Gen
erat
ion
Xer
sM
illen
nial
s
Onc
e a
mon
th (s
peci
fic to
shar
ed ri
des)
–−
1.6
4**
Onc
e pe
r tw
o w
eeks
(spe
cific
to e
xclu
sive
ride
s)0.
486*
*−
1.2
9**
Rand
om p
aram
eter
sTr
avel
tim
eM
ean
− 1
.31*
**−
1.3
6***
Stan
dard
dev
iatio
n1.
11**
*−
1.5
3***
Trav
el c
ost
Mea
n−
1.5
2 **
*−
1.9
3 **
*St
anda
rd d
evia
tion
0.98
***
1.25
***
Num
ber o
f obs
erva
tions
Num
ber o
f Res
pond
ents
= 21
0, N
umbe
r of O
bser
va-
tions
= 29
89N
umbe
r of R
espo
nden
ts =
545,
N
umbe
r of O
bser
va-
tions
= 7,
496
***S
igni
fican
t at 1
% L
evel
, **S
igni
fican
t at 5
% L
evel
, *Si
gnifi
cant
at 1
0%
Transportation
1 3
Acknowledgements This research is sponsored by the Florida Department of Transportation (BDV29 977-47). The thoughts, outcomes, and conclusions stated in this paper are those of the authors and not essentially those of the Florida Department of Transportation or the U.S. Department of Transportation.
Author contribution Conceptualization: GA and XJ; Methodology: GA, AR and XJ; Formal analysis and investigation: GA; Writing—original draft preparation: GA and XJ; Writing—review and editing: GA, AR and XJ; Funding acquisition: XJ; Resources: XJ; Supervision: XJ.
Declarations
Conflicts of interest The authors declare that they have no conflict of interest.
References
Acheampong, R.A., Siiba, A., Okyere, D.K., Tuffour, J.P.: Mobility-on-demand: An empirical study of internet-based ride-hailing adoption factors, travel characteristics and mode substitution effects. Trans-portation Research Part C: Emerging Technologies 115, 102638 (2020)
Alemi, F., Circella, G., Handy, S., Mokhtarian, P.: What influences travelers to use Uber? Exploring the fac-tors affecting the adoption of on-demand ride services in California. Travel Behaviour and Society 13, 88–104 (2018)
Alemi, F., Circella, G., Mokhtarian, P., Handy, S.: What drives the use of ridehailing in California? Ordered probit models of the usage frequency of Uber and Lyft. Transport. Res. Part C Emerging Technol 102, 233–248 (2019)
American Public Transportation Association. 2016 public transportation fact book.Asgari, H., Jin, X., Corkery, T.: A stated preference survey approach to understanding mobility choices
in light of shared mobility services and automated vehicle technologies in the US. Transp. Res. Rec. 2672(47), 12–22 (2018)
Asgari, H., Jin, X.: Incorporating habitual behavior into Mode choice Modeling in light of emerging mobil-ity services. Sustain. Cities Soc. 52, 101735 (2020)
Au-Yong-Oliveira, M., Gonçalves, R., Martins, J., Branco, F.: The social impact of technology on Millenni-als and consequences for higher education and leadership. Telematics Inform. 35(4), 954–963 (2018)
Azimi, G., Rahimi, A., Asgari, H., & Jin, X. (2020). Transit and non-transit users’ mode choice of rides-ourcing: the role of attitudes. transportation research record, August
Barbour, N., Zhang, Y., Mannering, F.: An exploratory analysis of the role of socio-demographic and health-related factors in ridesourcing behavior. J. Transp. Health 16, 100832 (2020)
Bert, J., Collie, B., Gerrits, M., & Xu, G.: Whats ahead for car sharing? The new mobility and its impact on vehicle sales. tech. rep. boston consulting group (2016)
Blumenberg, E., Ralph, K., Smart, M., Taylor, B.D.: Who knows about kids these days? Analyzing the determinants of youth and adult mobility in the US between 1990 and 2009. Transportation Research Part A: Policy and Practice 93, 39–54 (2016)
Blumenberg, E., Taylor, B. D., Smart, M., Ralph, K., Wander, M., & Brumbagh, S.: What’s youth got to do with it? Exploring the travel behavior of teens and young adults (2012)
Bolarinwa, O.A.: Principles and methods of validity and reliability testing of questionnaires used in social and health science research. Nigerian Postgraduate Med. J. 22(4), 195 (2015)
Borges, N.J., Manuel, R.S., Elam, C.L., Jones, B.J.: Comparing millennial and generation X medical stu-dents at one medical school. Acad. Med. 81(6), 571–576 (2006)
Brown, A.E.: Who and where rideshares? Rideshare travel and use in Los Angeles. Transport. Res. Part A Policy Practice 136, 120–134 (2020)
Chen, X., Zheng, H., Wang, Z., Chen, X.: Exploring impacts of on-demand ridesplitting on mobility via real-world ridesourcing data and questionnaires. Transportation (2018). https:// doi. org/ 10. 1007/ s11116- 018- 9916-1
Circella, G., Alemi, F., Tiedeman, K., Handy, S., & Mokhtarian, P.: The adoption of shared mobility in Cali-fornia and its relationship with other components of travel behavior (2018)
Circella, G., Tiedeman, K., Handy, S., Alemi, F., & Mokhtarian, P.: What affects millennials’ mobility? PART I: Investigating the environmental concerns, lifestyles, mobility-related attitudes and adoption of technology of young adults in California. (2016).
Transportation
1 3
Circella, G., Tiedeman, K., Handy, S., Alemi, F., & Mokhtarian, P.:What affects US passenger travel? Cur-rent trends and future perspectives (2016)
Clewlow, R. R., & Mishra, G. S.:Disruptive transportation: The adoption, utilization, and impacts of rides-ourcing in the United States (2017)
Colli, E.: Towards a mobility transition? Understanding the environmental impact of Millennials and Baby Boomers in Europe. Travel Behaviour and Society 20, 273–289 (2020)
Compostella, J., Fulton, L.M., De Kleine, R., Kim, H.C., Wallington, T.J.: Near-(2020) and long-term (2030–2035) costs of automated, electrified, and shared mobility in the United States. Transp. Policy 85, 54–66 (2020)
Coombes, B.: Generation Y: Are they really digital natives or more like digital refugees. Synergy 7(1), 31–40 (2009)
Corwin, S., Vitale, J., Kelly, E., & Cathles, E.:The future of mobility. How transportation technology and social trends are creating a new business ecosystem (2015)
de Souza Silva, L.A., de Andrade, M.O., Maia, M.L.A.: How does the ride-hailing systems demand affect individual transport regulation? Res. Transp. Econ. 69, 600–606 (2018)
Deka, D., Fei, D.: A comparison of the personal and neighborhood characteristics associated with ridesourc-ing, transit use, and driving with NHTS data. J. Transp. Geogr. 76, 24–33 (2019)
Delbosc, A., Currie, G.: Causes of youth licensing decline: a synthesis of evidence. Transp. Rev. 33(3), 271–290 (2013)
Dias, F.F., Lavieri, P.S., Garikapati, V.M., Astroza, S., Pendyala, R.M., Bhat, C.R.: A behavioral choice model of the use of car-sharing and ride-sourcing services. Transportation 44(6), 1307–1323 (2017)
DiStefano, C., Zhu, M., Mindrila, D.: Understanding and using factor scores: Considerations for the applied researcher. Pract. Assess. Res. Eval. 14(1), 20 (2009)
Drost, E.A.: Validity and reliability in social science research. Edu. Res. Perspect. 38(1), 105 (2011)Dubernet, I., Dubernet, T., Axhausen, K.W.: Comparing values of travel time obtained from workplace and
short-term decisions. Travel Behaviour and Society 20, 83–90 (2020)Economics, D. A.:Economic effects of ridesharing in Australia: Uber. Deloitte Access Economics (2016).Fernandez, S.:Comparing generation X to generation Y on work-related beliefs (2009).Fishman, A.A.: How generational differences will impact America’s aging workforce: Strategies for dealing
with aging Millennials, Generation X, and Baby Boomers. Strategic HR Rev. (2016). https:// doi. org/ 10. 1108/ SHR- 08- 2016- 0068
Fry, R.: Millennials overtake Baby Boomers as America’s largest generation. Pew Res. Center 25, 1 (2016)Fu, X.M.: Does heavy ICT usage contribute to the adoption of ride-hailing app? Travel Behaviour and Soci-
ety 21, 101–108 (2020)Garikapati, V.M., Pendyala, R.M., Morris, E.A., Mokhtarian, P.L., McDonald, N.: Activity patterns, time
use, and travel of Millennials: a generation in transition? Transp. Rev. 36(5), 558–584 (2016)Gehrke, S.R., Huff, M.P., Reardon, T.G.: Social and trip-level predictors of pooled ride-hailing service
adoption in the greater boston region. Case Studies on Transport Policy (2021). https:// doi. org/ 10. 1016/j. cstp. 2021. 05. 004
Gehrke, S., Felix, A., & Reardon, T.:Fare choices: A survey of ride-hailing passengers in metro Boston. Metro-politan Area Planning Council (2018)
Grahn, R., Harper, C.D., Hendrickson, C., Qian, Z., Matthews, H.S.: Socioeconomic and usage characteris-tics of transportation network company (TNC) riders. Transportation (2019). https:// doi. org/ 10. 1007/ s11116- 019- 09989-3
Gurbuz, O., Cheu, R.L.: Survey to explore behavior, intelligent transportation systems needs, and level of ser-vice expectations for student parking at a University Campus. Transp. Res. Rec. 2674(1), 168–177 (2020)
Haboucha, C.J., Ishaq, R., Shiftan, Y.: User preferences regarding autonomous vehicles. Transport. Res. Part C Emerging Technol 78, 37–49 (2017)
Henao, A.: Impacts of Ridesourcing-Lyft and Uber-on Transportation Including VMT, Mode Replacement, Parking, and Travel Behavior. University of Colorado at Denver. (2017)
Hensher, D.A., Rose, J.M., Greene, W.H.: Applied choice analysis: a primer. Cambridge University Press (2005)Hershberger, S.L.: Factor score estimation. Encyclopedia of Statistics in Behavioral Science (2005). https:// doi.
org/ 10. 1002/ 04700 13192. bsa726Howe, N., & Strauss, W.: Millennials rising: The next great generation. Vintage (2000)Jin X, Rahimi A, Azimi G.:The impacts of emerging mobility options and vehicle technologies on travel behav-
ior. Florida Department of Transportation. 2020.Jin, S.T., Kong, H., Wu, R., Sui, D.Z.: Ridesourcing, the sharing economy, and the future of cities. Cities 76,
96–104 (2018)
Transportation
1 3
Karamanis, R., Angeloudis, P., Sivakumar, A., & Stettler, M.:Dynamic pricing in one-sided autonomous ride-sourcing markets. In 2018 21st International Conference on Intelligent Transportation Systems (ITSC) (pp. 3645–3650). IEEE. (2018)
Ketter, E.: Millennial travel: tourism micro-trends of European Generation Y. J. Tourism Futures (2020). https:// doi. org/ 10. 1108/ JTF- 10- 2019- 0106
Knittel, C. R., & Murphy, E.:Generational trends in vehicle ownership and use: Are Millennials any differ-ent? (No. w25674). National Bureau of Economic Research (2019)
Kuhnimhof, T., Armoogum, J., Buehler, R., Dargay, J., Denstadli, J.M., Yamamoto, T.: Men shape a down-ward trend in car use among young adults—evidence from six industrialized countries. Transp. Rev. 32(6), 761–779 (2012)
Lancaster, L. C., & Stillman, D. (2003). When generations collide: Who they are, why they clash, how to solve the generational puzzle at work. New York, NY: HarperBusiness.
Lavieri, P.S., Bhat, C.R.: Modeling individuals’ willingness to share trips with strangers in an autonomous vehi-cle future. Transportation Research Part A: Policy and Practice 124, 242–261 (2019)
Lee, Z.W., Chan, T.K., Balaji, M.S., Chong, A.Y.L.: Why people participate in the sharing economy: an empiri-cal investigation of Uber. Int. Res. (2018). https:// doi. org/ 10. 1108/ IntR- 01- 2017- 0037
Li, W., Pu, Z., Li, Y., Ban, X.J.: Characterization of ridesplitting based on observed data: A case study of Chengdu, China. Transportation Research Part C: Emerging Technologies 100, 330–353 (2019)
Ma, L., Zhang, X., Ding, X., Wang, G.: Risk perception and intention to discontinue use of ride-hailing services in China: Taking the example of DiDi Chuxing. Transport. Res. F: Traffic Psychol. Behav. 66, 459–470 (2019)
Malokin, A., Circella, G., Mokhtarian, P.L.: How do activities conducted while commuting influence mode choice? Using revealed preference models to inform public transportation advantage and autonomous vehicle scenarios. Transport. Res. Part A Policy Practice 124, 82–114 (2019)
Manfreda, A., Ljubi, K., Groznik, A.: Autonomous vehicles in the smart city era: An empirical study of adop-tion factors important for Millennials. Int. J. Inf. Manag. 58, 102050 (2019)
McDonald, N.C.: Are Millennials really the “go-nowhere” generation? J. Am. Plann. Assoc. 81(2), 90–103 (2015)McFadden, D.L.: Frontiers in econometrics. Wiley, New York (1973)Morshed, S.A., Khan, S.S., Tanvir, R.B., Nur, S.: Impact of COVID-19 pandemic on ride-hailing services based
on large-scale Twitter data analysis. J. Urban Manag. (2021). https:// doi. org/ 10. 1016/j. jum. 2021. 03. 002Polzin, S.E., Chu, X., Godfrey, J.: The impact of Millennials’ travel behavior on future personal vehicle travel.
Energ. Strat. Rev. 5, 59–65 (2014)Preisendörfer, P., Wolter, F.: Who is telling the truth? A validation study on determinants of response behavior
in surveys. Public Opin. Q. 78(1), 126–146 (2014)Prensky, M.: Digital natives, digital immigrants. On the Horizon 9(5), 1 (2001)Rahimi, A., Azimi, G., Jin, X.: Investigating generational disparities in attitudes toward emerging mobility
options. Transp Res Part C Emerging Technol 121, 102836 (2020a)Rahimi, A., Azimi, G., Jin, X.: Examining human attitudes toward shared mobility options and autonomous
vehicles. Transport. Res. F: Traffic Psychol. Behav. 72, 133–154 (2020b)Rainer, T. S., & Rainer, J. (2011). The Millennials. B&H Publishing Group.Rasciute, S., Pentecost, E.J.: A Nested logit approach to modelling the location of foreign direct investment in
the Central and Eastern European Countries. Econ. Model. 27(1), 32–39 (2010)Rayle, L., Dai, D., Chan, N., Cervero, R., Shaheen, S.: Just a better taxi? A survey-based comparison of taxis,
transit, and ridesourcing services in San Francisco. Transp. Policy 45, 168 (2016)Raymond, E.L., Dill, J., Lee, Y.: Millennial first-time homebuyers and location choice. J. Plan. Education Res.
(2018). https:// doi. org/ 10. 1177/ 07394 56X18 807751Reisenwitz, T.H., Iyer, R.: Differences in generation x and generation y: Implications for the organization and
marketers. Marketing Manag. J. 19(2), 1 (2009)Richard K. Miller and Associates Consumer Behavior 2011: Millennial Consumers, Richard K. Miller and
Associates (RKMA), Loganville, GA, pp. 211‐6. (2011a),Rogler, L.H.: Historical generations and psychology: The case of the Great Depression and World War II. Am.
Psychol. 57(12), 1013 (2002)Sarriera, J.M., Álvarez, G.E., Blynn, K., Alesbury, A., Scully, T., Zhao, J.: To share or not to share: Investigating
the social aspects of dynamic ridesharing. Transp. Res. Rec. 2605(1), 109–117 (2017)Schwieterman, J., Smith, C.S.: Sharing the ride: A paired-trip analysis of UberPool and Chicago Transit
Authority services in Chicago, Illinois. Res. Transp. Econ. 71, 9–16 (2018)Shakibaei, S., De Jong, G.C., Alpkökin, P., Rashidi, T.H.: Impact of the COVID-19 pandemic on travel behavior
in Istanbul: A panel data analysis. Sustain. Cities Soc. 65, 102619 (2021)Sikder, S.: Who uses ride-hailing services in the United States? Transp Res Record (2019). https:// doi. org/ 10.
1177/ 03611 98119 859302
Transportation
1 3
Simmons, R. O. B.:Disruptive digital technology services: the case of uber car ridesharing in Ghana (2018).Sivak, M., Schoettle, B.: Recent changes in the age composition of US drivers: Implications for the extent,
safety, and environmental consequences of personal transportation. Traffic Inj. Prev. 12(6), 588–592 (2011)
Smith, A.:Shared, collaborative and on demand: The new digital economy. Pew Research Center, 19 (2016)Spieser, K., Treleaven, K., Zhang, R., Frazzoli, E., Morton, D., & Pavone, M.:Toward a systematic approach to
the design and evaluation of automated mobility-on-demand systems: A case study in Singapore. In Road vehicle automation (pp. 229–245). Springer, Cham (2014)
Spurlock, C.A., Sears, J., Wong-Parodi, G., Walker, V., Jin, L., Taylor, M., Todd, A.: Describing the users: Understanding adoption of and interest in shared, electrified, and automated transportation in the San Francisco Bay Area. Transp. Res. Part D: Transp. Environ. 71, 283–301 (2019)
Stocker, A., Shaheen, S.: Shared automated mobility: early exploration and potential impacts. Road Vehicle Automation 4, 125–139 (2018)
Taylor, P., & Keeter, S.: Millennials: A portrait of generation next. Pew Research Center, 1, (2010)The American automobile association. Your Driving Costs, 2016The American public transportation association. 2016 Public Transportation Fact Book, 2017Thompson, D., & Weissmann, J. (2012). The cheapest generation. The Atlantic, 22.Van der Waerden, P., Timmermans, H., van Neerven, R.: Extent, nature, and covariates of multitasking of rail
passengers in an urban corridor: A Dutch case study. Transp. Res. Rec. 2110(1), 106–111 (2009)Walker, J., & Johnson, C.:Peak car ownership: the market opportunity of electric automated mobility ser-
vices. Rocky Mountain Institute. (2016)Wang, Z., Chen, X., Chen, X.M.: Ridesplitting is shaping young people’s travel behavior: Evidence from com-
parative survey via ride-sourcing platform. Transp. Res. Part D: Transp. Environ. 75, 57–71 (2019)Warnock-Smith, D., O’Connell, J.F., Maleki, M.: An analysis of ongoing trends in airline ancillary revenues. J.
Air Transp. Manag. 64, 42–54 (2017)Woldeamanuel, M., Nguyen, D.: Perceived benefits and concerns of autonomous vehicles: An exploratory study
of Millennials’ sentiments of an emerging market. Res. Transp. Econ. 71, 44–53 (2018)Yang, L., Zheng, G., Zhu, X.: Cross-nested logit model for the joint choice of residential location, travel mode,
and departure time. Habitat Int. 38, 157–166 (2013)Young, M., Farber, S.: The who, why, and when of Uber and other ride-hailing trips: An examination of a large
sample household travel survey. Trans. Res. Part A Policy Practice 119, 383–392 (2019)Impact of ride-sourcing services on travel habits and transportation planning (Doctoral dissertation, University
of Pittsburgh).Young, M., Farber, S., Palm, M.: The true cost of sharing: A detour penalty analysis between UberPool and
UberX trips in Toronto. Transp. Res. Part D: Transp. Environ. 87, 102540 (2020)
Publisher’s Note Springer Nature remains neutral with regard to jurisdictional claims in published maps and institutional affiliations.
Ghazaleh Azimi is a Ph.D. candidate at the Department of Civil and Environmental Engineering at Flor-ida International University. She joined Florida International University as a graduate research assistant in 2018, and her research focus is on transportation engineering with particular emphasis on travel behavior, traffic safety, and transportation planning. Ms. Azimi has experience with GIS and data analytics and has worked on various projects funded by the Florida Department of Transportation (FDOT) and University Transportation Centers (UTC).
Alireza Rahimi received a Ph.D. in transportation engineering from Florida International University. He holds an M.S. in transportation engineering from the University of Tehran and a B.S. in civil engineering from K.N. Toosi University. He received the National Operations Center of Excellence Student Award in 2019 and the Ajabshir International Research Scholarship Award in 2020. Dr. Rahimi has an interdiscipli-nary background in data science, statistics, and transportation engineering. His research interests include travel behavior, transit planning, roadway safety, and traffic engineering.
Dr. Xia Jin is an Associate Professor with the Civil and Environmental Engineering at the Florida Inter-national University (FIU). She is the director of the Travel Behavior and System Modeling lab at FIU. Her research areas include human and freight mobility behavior analysis, travel demand forecasting, emerging mobility options and vehicle technologies, stated preference surveys. Her expertise includes econometric modeling, stated preference surveys, and mobile-phone data mining and analytics.