Embed Size (px)
Citation preview
1
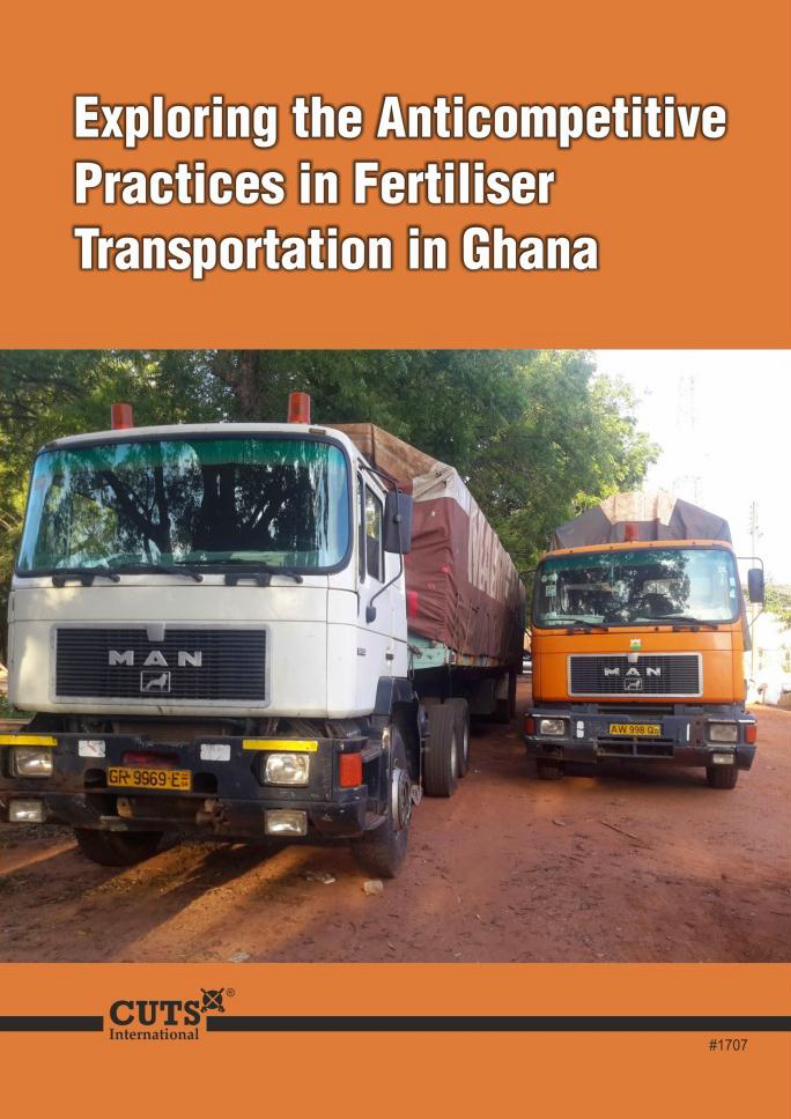
Exploring the Anticompetitive Practices in Fertiliser
Transportation in Ghana
Published by
Consumer Unity & Trust Society D-217, Bhaskar Marg, Bani Park, Jaipur 302016, India
Ph: 91.141.228 2821, Fx: 91.141.228 2485 Email: [email protected], Web: www.cuts-international.org
Researched and Written by: Paulina Agyekum (PhD), P. O. Box GP 18280, Accra, Ghana
Email: [email protected]
With the support of:
© CUTS Accra, 2017
First published: March 2017
Citation: CUTS (2017), Exploring the Anticompetitive Practices in Fertiliser Transportation in Ghana,
CUTS, Jaipur
The material in this publication produced under the project entitled, ‘Competition Reforms in Key
Markets for Enhancing Economic and Social Welfare in Developing Countries’ (CREW project)
implemented by CUTS, may be referred to for education or non-profit uses, without special permission
from the copyright holders, provided acknowledgment of the source is made.
#1707

2
CONTENTS
Acronyms ......................................................................................................................... ........................................... 4
Acknowledgements ................................................................................................................................................. 5
Executive Summary................................................................................................................................................. 6
1. Introduction ............................................................................................................................................... 8
2. Methodology of Study .......................................................................................................................... 12
3. Results and Discussions ...................................................................................................................... 14
4. Competition in Customs Clearing Procedures: Impact on
Competitive Fertiliser Supply Chain ................................................................................................. 18
5. Fertiliser Distribution, Marketing and Transportation Channels ....................................... 26
6. Competition Practices amongst Fertiliser Operators and Handlers .................................. 34
7. High Fertiliser Prices, Remote Causes and Challenges of FSP .............................................. 36
8. Constraints to Competitiveness of Fertiliser Markets in Ghana .......................................... 41
9. Conclusion and Recommendations ................................................................................................. 43
Appendix 1 ....................................................................................................................................................... 50
3
LIST OF TABLES
Table 1.1: Share of Agriculture in GDP ............................................................................................................... 9
Table 1.2: Growth Rates in Agricultural Sub-sectors..................................................................................... 9
Table 2:1: List of key Players Interviewed in the Fertiliser Industry ................................................. 12
Table 4:1: Registered Fertiliser Importers in Ghana .................................................................................. 19
Table 4:2: Clearing Charges and Duration ....................................................................................................... 21
Table 4:3: Registered Fertiliser Imported and Used in Ghana ................................................................ 25
Table 5.1: Average Distance to the Nearest Fertiliser Seller………………………………………...……...31
Table 6.1: Location-wise Unit Cost of Fertilisers…………………………………………………………...…....49
LIST OF FIGURES
Figure 1.1: Share of Total Labour Force by Sector (15 Years & above) ................................................... 8
Figure 4:1: Private Sector Involvement in Government Subsidy Programme ................................... 24
Figure 5.1: Fertiliser Distribution Network in Ghana .................................................................................. 26
Figure 5.2: Transport Availability for Fertiliser Distribution ................................................................... 28
Figure 5.3: Port Charges by Fertiliser Type ...................................................................................................... 28
Figure 5.4: Transport Cost of Fertiliser Distribution by Importers ....................................................... 29
Figure 5.5: Transport Challenges at Distribution Stage .............................................................................. 30
Figure 5.6: Transport Challenges at Retail Stage ........................................................................................... 30
Figure 5.7: Fertiliser Transport Cost Rating .................................................................................................... 31
Figure 5.8: Percentage Stock of Fertiliser out of Season ............................................................................. 32
Figure 5.9: Fertiliser Availability to the Farmers ........................................................................................... 33
Figure 6.1: Source of Fertilisers ........................................................................................................................... 35
Figure 7.1: Average Price Build-up of NPK from Importer to the Farmer .......................................... 37
Figure 7.2: Ability to Source for Alternate Means of Fertilisers .............................................................. 39
Figure 7.3: Ease of Sourcing for Alternate Source of Fertilisers .............................................................. 39
Figure 7.4: Cost of Sourcing for Alternate Source of Fertilisers............................................................... 39
Figure 7.5: Duration for Sourcing Alternate Source of Fertiliser Supply ............................................. 40
Figure 7.6: Level of Fertiliser Utilisation ........................................................................................................... 40
LIST OF BOXES
Box 5.1: Retailers Perspective .......................................................................................................................... 30
Box 5.2: Retailer’s Opinion……………………………………………………………………………………………...32
4
Aronyms
AAGDS Accelerated Agricultural Growth and Development Strategy
CRI Crops Reseach Institute
DCR Diagnostic Country Report
DfID Department for International Development
EPA Evironmental Protection Agency
FOB Free-On-Board
FSP Fertiliser Subsidy Programme
GDP Gross Domestic Product
GRA Ghana Revenue Authority
GSA Ghana Standard Authority
GSS Ghana Statistical Service
IFDC International Fertiliser Development Centre
OMS Open Market Sales
MFA Ministry of Food and Agriculture
MoFA Ministry of Foreign Affairs
MOP Muriate of Potash
MTADP Medium Term Agricultural Development Programme
NPK Nitrogen-Phosphorus-Potassium
PFAG Peasant Farmers Association of Ghana
PPRSD Plant Protection and Regulatory Service Directorate
RGD Registrar General Department
TSP Triple Superphosphate
SRI Soil Research Institute
VAT Value Added Tax
5
Acknowledgments
“Exploring the Anticompetitive Practices in Fertiliser Transportation in Ghana” report
was undertaken by the CUTS Accra Centre with the aim of exploring possible causes of
high prices of subsidised fertilisers in the country. The study was carried out with the
sole aim to investigate if any anticompetitive practices are prevailing at the port-
handling and inland transportation of fertilisers as well as to determine the possible
effects of such anticompetitive practices on the retail cost of fertilisers in Ghana.
The research study emerged from the project entitled “Competition Reforms in Key
Markets for Enhancing Social and Economic Welfare in Developing Countries’ (CREW
Project), a project which was implemented in Ghana, India, Philippines and the Zambia,
across two common sectors: 1) Staple Food and 2) Bus Transport sectors with the aim
to demonstrate the benefits of competition reforms to consumers and producers. From
the CREW project research findings it was revealed that the cost of subsidised fertilisers
still remain high and thus some low income farmers are unable to purchase the
subsidised fertilisers due to their high prices.
The diligent efforts in the form of contributions, reviews, encouragements and guidance
of many have contributed to the production of this study report. The Centre is especially
grateful to Dr Paulina Agyekum, the lead researcher in carrying out this study, for her
incredible contribution and insights. Also, we are grateful for the valuable efforts of
Abraham Zaato from the National Road Safety Commission (NRSC), Ghana for his
contributions in preparation of the report.
The Centre also acknowledges the tireless efforts of the CUTS Accra team for their
incessant contributions in data collection and document reviews during course of the
study. Finally, our gratitude to CUTS International Headquarters team – Pradeep S
Mehta (General Secretary), Rijit Sengupta, Kshitiz Sharma, Shreya Kaushik and Neha
Tomar of CUTS. Special thanks to Madhuri Vasnani, Garima Shrivastava and Mukesh
Tyagi for editing and layout of this report.
6
Executive Summary
Agriculture plays an important role in Ghana’s economy. The sector accounts for
22 percent of Gross Domestic Product (GDP) and employs nearly 45 percent of the
labour force. In recent years, agricultural sector share of the GDP has been growing at
about 6 percent per annum and hike in commodity prices have contributed to
agriculture’s contribution to GDP. However, the agriculture sector continues to
comprise mainly smallholder farmers using minimal inputs of improved seeds, chemical
fertilisers and irrigation to cultivate small and fragmented plots of land over wide
geographical areas.
This study was designed among others, to investigate if any anticompetitive practices
are prevailing in port-handling and inland transportation of fertilisers and determine
the possible effect of such anticompetitive practices on the retail cost of fertilisers in
Ghana. Collated field and secondary data were compiled using both quantitative and
qualitative methods. The data was analysed to understand the structures, systems and
mechanisms of the operation of the fertiliser market and the factors that either
constrain or enhance fertiliser marketing in terms of competitiveness and performance
in the industry.
The findings showed that currently Ghana does not produce chemical fertilisers,
although there are some deposits of rock phosphate in the country. All the fertilisers
used in the country are imported. Therefore, Ghana’s fertiliser supply chain begins with
importers who are mostly private companies. It was found that there are no deliberate
state policies that promote anticompetitive practices, however, the complex nature of
registration, clearing and handling nature at the ports appear to promote inefficiencies
resulting in delays in release of chemical fertilisers from the port and increase cost of
transaction, which in the end, is passed on to the farmer resulting in high cost of
fertilisers.
The number of firms (from importer to retailer) seems to be too small as compared to
the large number of smallholder farmers across the country. The situation was found to
be so because of the huge capital investment required to initiate such enterprises.
Moreover, the operations of importers, distributors and retailers along value chains was
found to be highly competitive as firms and individuals along this chain have been
operating independently to draw more clients (farmers) in spite of the numerous
challenges confronting the sector.
The sector is, however, still in the process of developing. The same cannot be stated for
the transporters who are probably involved in collusive behaviour by creating a union
7
and fixing the price to be charged per bag of chemical fertilisers for a particular
distance. Nearly 80 percent fertiliser distributers indicated that they have access
available to transport, though the major distribution challenge is high cost of transport
associated with it.
An obvious but necessary condition for farmers to use fertilisers is that they should be
readily available at the time when farmers want to buy and use them. About 55 percent
of the fertiliser distributers and wholesalers are able to stock fertilisers even out of
farming season.
Furthermore, an unfavourable fertiliser/crop price ratio is a serious constraint to input
market development in Ghana. Compared to international market prices, fertiliser
prices in Ghana were found to be quite high due to the small size of the market and its
limited development. At the same time, output prices are lower, compared to fertiliser
prices, due to inefficient markets.
Most of the farm crops cultivated are perishable produce, which are mostly sold at the
farm-gate at lower price level due to high transport costs. Thus, the returns on the sale
of the produce are not able to cover the cost of fertilisers and the expected profit margin
and this does not motivate the farmers to use the required quantities of fertilisers.
In order to boost the competitiveness of the fertiliser markets for both suppliers and
users, there is a need for some fundamental advancements in policy considering the
following aspects:
Policy focus in fertiliser market at retail and farmer-level
Reducing bureaucracy and discretionary controls in registration, clearing and port
handling procedures to promote efficiencies
Promoting free and effective transport system and enhanced road infrastructure to
reduce cost associated to transportation
Harmonising the activities and responsibilities of the regulatory agencies and
departments in charge of the fertiliser industry in Ghana
Stabilising the macro-economy and
Increasing access to credit and capital
8
1. Introduction
Background
Agriculture plays an important role in Ghana’s economy. The sector accounts for
22 percent of GDP and employs nearly 45 percent of the labour force. In recent years,
agricultural share of the GDP has been growing at about 6 percent per annum and
increase in commodity prices have contributed to the GDP (see Figure 1.1, Tables 1.1
and 1.2). However, the agriculture sector continues to comprise mainly smallholder
farmers using minimal inputs of improved seeds, chemical fertilisers, and irrigation to
cultivate small and fragmented plots of land.
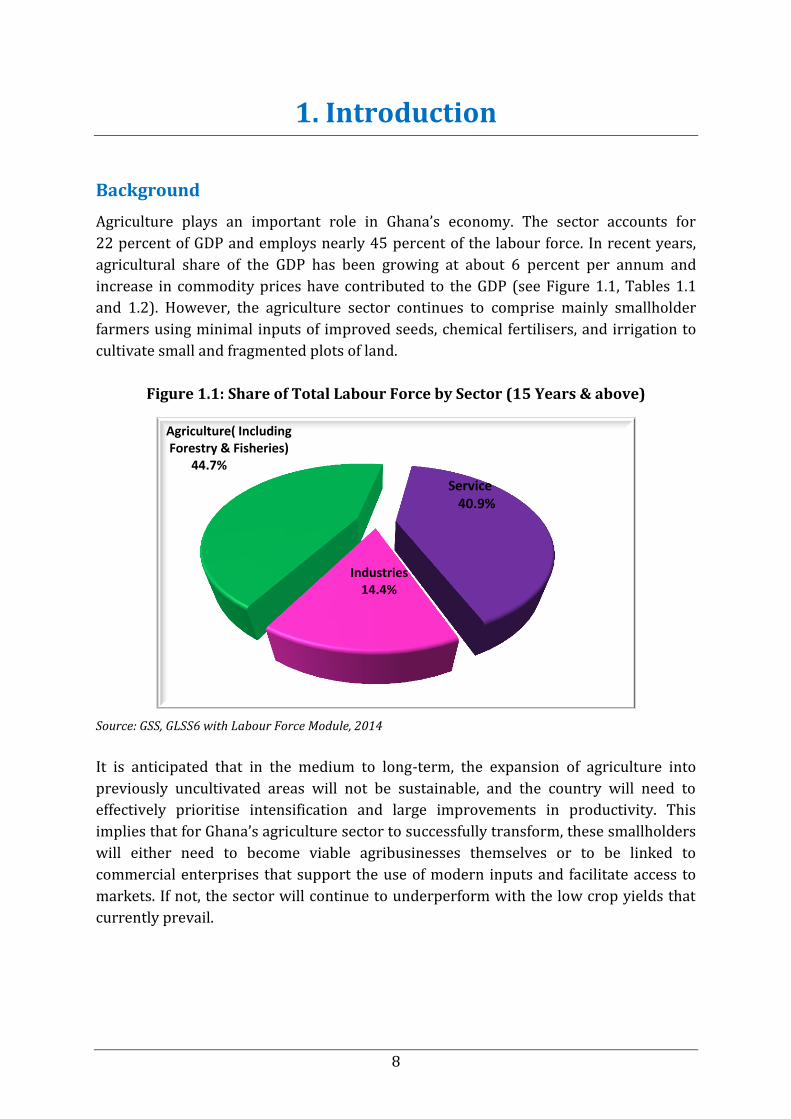
Figure 1.1: Share of Total Labour Force by Sector (15 Years & above)
Source: GSS, GLSS6 with Labour Force Module, 2014
It is anticipated that in the medium to long-term, the expansion of agriculture into
previously uncultivated areas will not be sustainable, and the country will need to
effectively prioritise intensification and large improvements in productivity. This
implies that for Ghana’s agriculture sector to successfully transform, these smallholders
will either need to become viable agribusinesses themselves or to be linked to
commercial enterprises that support the use of modern inputs and facilitate access to
markets. If not, the sector will continue to underperform with the low crop yields that
currently prevail.
Agriculture( Including Forestry & Fisheries) 44.7%
Service 40.9%
Industries 14.4%
9
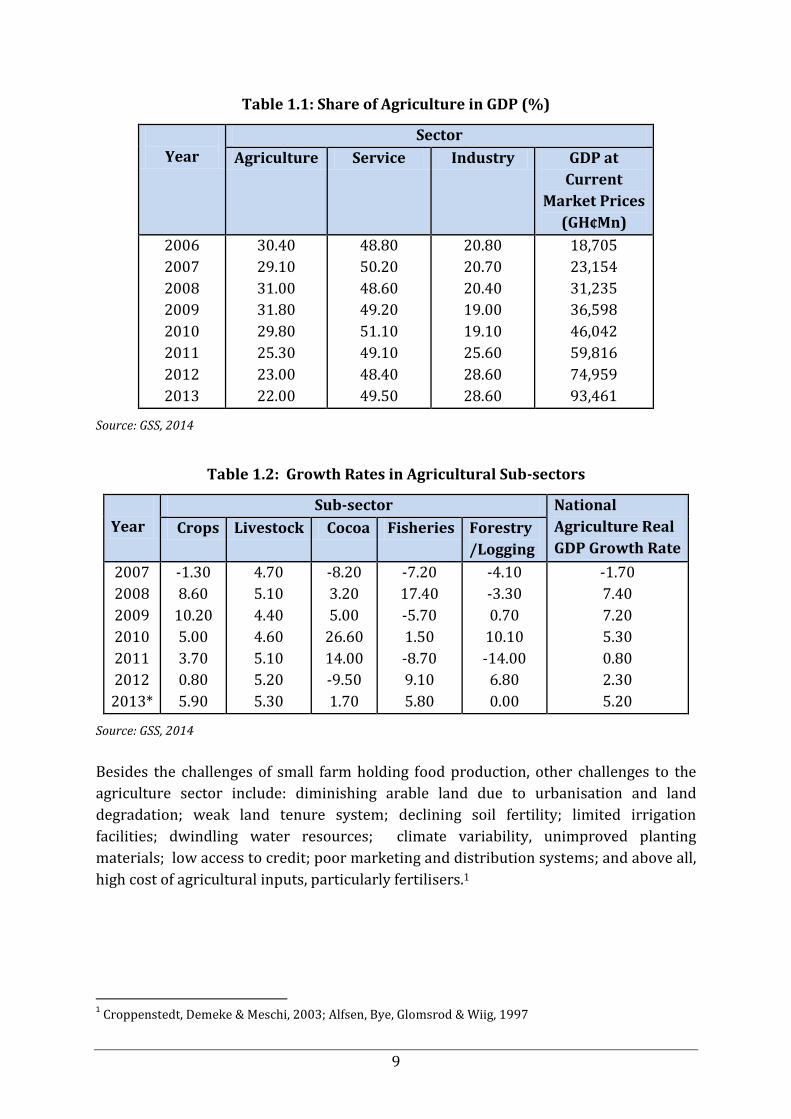
Table 1.1: Share of Agriculture in GDP (%)
Year
Sector
Agriculture Service Industry GDP at
Current
Market Prices
(GH¢Mn)
2006
2007
2008
2009
2010
2011
2012
2013
30.40
29.10
31.00
31.80
29.80
25.30
23.00
22.00
48.80
50.20
48.60
49.20
51.10
49.10
48.40
49.50
20.80
20.70
20.40
19.00
19.10
25.60
28.60
28.60
18,705
23,154
31,235
36,598
46,042
59,816
74,959
93,461
Source: GSS, 2014
Table 1.2: Growth Rates in Agricultural Sub-sectors
Year
Sub-sector National
Agriculture Real
GDP Growth Rate
Crops Livestock Cocoa Fisheries Forestry
/Logging
2007
2008
2009
2010
2011
2012
2013*
-1.30
8.60
10.20
5.00
3.70
0.80
5.90
4.70
5.10
4.40
4.60
5.10
5.20
5.30
-8.20
3.20
5.00
26.60
14.00
-9.50
1.70
-7.20
17.40
-5.70
1.50
-8.70
9.10
5.80
-4.10
-3.30
0.70
10.10
-14.00
6.80
0.00
-1.70
7.40
7.20
5.30
0.80
2.30
5.20
Source: GSS, 2014
Besides the challenges of small farm holding food production, other challenges to the
agriculture sector include: diminishing arable land due to urbanisation and land
degradation; weak land tenure system; declining soil fertility; limited irrigation
facilities; dwindling water resources; climate variability, unimproved planting
materials; low access to credit; poor marketing and distribution systems; and above all,
high cost of agricultural inputs, particularly fertilisers.1
1 Croppenstedt, Demeke & Meschi, 2003; Alfsen, Bye, Glomsrod & Wiig, 1997

10
It is a proven fact that high input usage of inorganic fertiliser has been a key component
of Green Revolutions around the world.2 Higher rate of soil fertility decline and
consistent lower crop yields necessitate increased use of inorganic fertilisers in Africa.3
However, the high cost of inorganic fertilisers prevents particularly small-holder
farmers, who are resource-constrained (predominantly within low income bracket),
from using the required levels of fertilisers to boost crop production in developing
countries like Ghana.
A study by Guo et al. (2009) suggested that high cost of fertiliser to smallholder farmers
is attributed to low volumes of imports, poor infrastructure, low population densities,
inadequate and costly financial services as well as high transport and marketing costs
where farms are very far from the nearest port.
The Government of Ghana enacted the Plants and Fertilisers Act in 2008 to increase the
use of fertilisers among farmers through the provision of government subsidies on the
product. The responsibility to implement the same is assigned to a dedicated
department under the Ministry of Food and Agriculture – the Plant Protection and
Regulatory Services Directorate (PPRSD). This has increased the demand for fertiliers
within the farming communities across the nation.
However, the use of fertilisers in Ghana is estimated at 8 kg per hectare, which
represents one of the lowest rates still among countries in Sub-Saharan Africa, which
already indicates that it is the lowest fertiliser consumer in the world (MOFA, 2007).
Research findings from the ‘Competition Reforms in Key Markets for Enhancing Social
and Economic Welfare in Developing Countries (CREW)’ Project Diagnostic Country
Report (DCR) of 2014 also revealed that though fertilisers are subsidised by the
Government of Ghana, the fertiliser market is very fragmented at the retail level, and the
retail prices offered to farmers still remain high.
A number of factors have been identified, which might influence the pricing of the
fertilisers at the retail level. These include: rising international prices of fertiliser inputs;
fluctuating foreign exchange rate; port handling and clearance issues; internal
transportation costs coupled with anticompetitive practices among the fertiliser
distributers.
While some of the external factors (like the sliding exchange rate and rising
international prices of fertiliser inputs) are difficult to address – it would be crucial for
the Government of Ghana to identify domestic factors that have kept the price of
fertilisers high. Two factors seem to emerge from the analysis-port handling and
2 Kelly, Adesina, & Gordon, 2003; Tomich, Kilby, & Johnston, 1995; Kherallah, Delgado, Gabre-Madhin,
Minot, & Johnson, 2002; Viyas, 1983; Reuler & Prins, 1993 3 Alfsen et al., 1997; Xu, Burke, Jayne, & Govereh, 2009; Larson, 1993
11
clearance, and internal transportation costs and the presence of anticompetitive
practices among the operators.
Moreover, some assessment is necessary to explore if these costs and anticompetitive
practices do really exist and can be controlled, so that the cost of fertilisers to the
farmers can be reduced. It is, therefore, necessary to conduct an intensive study in this
sector to understand the possible anticompetitive practices, if any and operational
factors resulting in high fertiliser retail prices, and the best ways to address these
situations. This study explores and addresses these issues.
Objectives of the Study
The main objectives of the study are:
To investigate whether anticompetitive practices are prevailing in port-handling
and
To determine the probable impact of such anticompetitive practices on retail
cost of fertilisers in Ghana.
Scope of the Study
The study encompasses and defines the following important aspects:
Identifying the presence of competition practices amongst fertiliser operators
and handlers in Ghana
Suggesting government actions to deal with anticompetitive practices, if any that
will result in reducing the price of the fertilisers
Understanding competition issues in customs clearing procedures and how they
might affect competitive fertiliser supply chain with respect to cost of clearing,
informal payment and any delay and
Approaching to improve the distribution network of fertilisers so as to cover
both farmers in the peri-urban centres and those in the remote areas.
12
2. Methodology of Study
The study method involved secondary review and data collation by desk studies as well
as primary data collection through field studies.
Field Data Collection
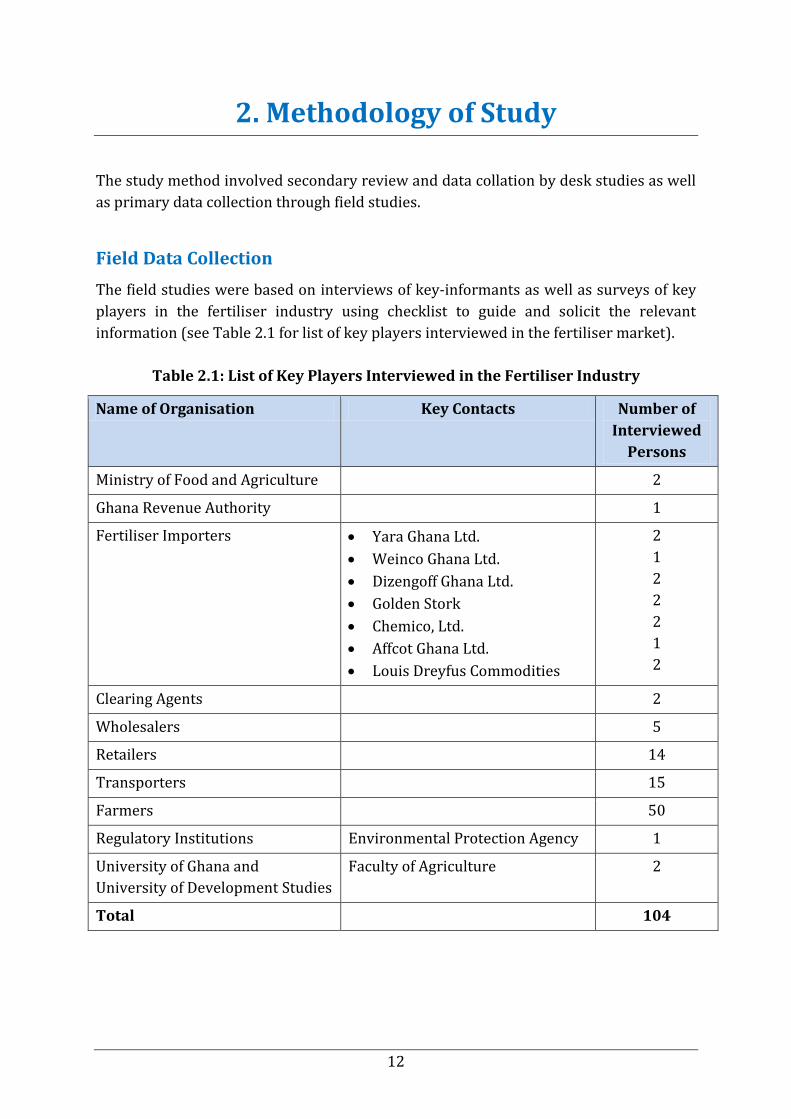
The field studies were based on interviews of key-informants as well as surveys of key
players in the fertiliser industry using checklist to guide and solicit the relevant
information (see Table 2.1 for list of key players interviewed in the fertiliser market).
Table 2.1: List of Key Players Interviewed in the Fertiliser Industry
Name of Organisation Key Contacts Number of
Interviewed
Persons
Ministry of Food and Agriculture 2
Ghana Revenue Authority 1
Fertiliser Importers Yara Ghana Ltd.
Weinco Ghana Ltd.
Dizengoff Ghana Ltd.
Golden Stork
Chemico, Ltd.
Affcot Ghana Ltd.
Louis Dreyfus Commodities
2
1
2
2
2
1
2
Clearing Agents 2
Wholesalers 5
Retailers 14
Transporters 15
Farmers 50
Regulatory Institutions Environmental Protection Agency 1
University of Ghana and
University of Development Studies
Faculty of Agriculture 2
Total 104
13
Apart from eliciting general information related to the sector, the background and
operations of their respective organisations, interviewees were also asked to provide
their views on the state of competition in the sector, after which they were asked to
endorse their opinions.
There were several weeks of field trips within the Greater Accra and Brong Ahafo
Regions during the peak periods of operations of most actors in the supply and
distribution of fertilisers in Ghana to obtain relevant data and information for this
assignment.
Data Analysis
Collated field and secondary data were compiled using both quantitative and qualitative
methods. The data was analysed to understand the structures, systems and mechanisms
of the operation of the fertiliser market and the factors that either constrain or enhance
fertiliser marketing in terms of competitiveness and performance in the industry. This
was accomplished to acquire greater clarity and understanding the sustainability of the
industry in particular.
Study Areas
The research was conducted in two out of the ten regions of Ghana i.e. Greater Accra
and Brong Ahafo regions. These two regions were purposively sampled, taking into
consideration the fact that all fertilisers are imported through the Tema port in the
Greater Accra region and most offices of the importers were also located in Accra and
Tema.
The regulatory institutions, such as Ministry of Food and Agriculture (MoFA) and
Environmental Protection Agency (EPA) were also located in Greater Accra Region. The
location of Brong Ahafo Region is strategic to this study as it assisted in generating
issues related to transport and distribution. Besides, in both regions, all actors in the
fertiliser supply chain were willing to cooperate.
14
3. Results and Discussions
Overview of the Fertiliser Industry in Ghana
Ghana’s fertiliser industry has followed a general trend in terms of transitioning from
enormous levels of interventions in the 1960s and 1970s to liberalisation of markets of
the 1980s and 1990s followed more recently by moderate interventions including
liberation, some tax waivers and subsidies.
Till date, all imported fertiliser products are brought into the country by less than 20
active privately registered importing companies due to huge investment capital
requirements, unstable macro-economic indicators including foreign exchange rate,
inflation and interest rates. The Government of Ghana is not involved in the
importation of fertilisers into the country but only concerned to provide the same to
farmers through some privately approved and registered fertiliser importing
companies.
Two systems of fertiliser import and marketing and/or distribution exist in Ghana:
Open Market Sales (OMS) and Fertiliser Subsidy Programme (FSP). In the open market
sales, importers price the fertilisers, according to forces of demand and supply. This
normally exists during the off-farming season or anytime the government subsidised
fertiliser has finished or among importers who are not listed for the subsidy
programme.
It must be stressed, however, that these importers are able to sell only when farmers do
not have access to the subsidised fertiliser. This is because they are unable to compete
with the lower prices of the subsidised fertilisers or where there is no subsidy
programme for the year under consideration or the subsidised fertilisers had finished.
The open market is highly competitive.
In July 2008, the Government of Ghana instituted and launched a country-wide subsidy
programme with the hope to increase per hectare usage of fertilisers. Taxes, such as
import tax, Value Added Tax (VAT) were waived on the import of fertilisers with the
intention to reduce final price to be paid by the farmers.
Currently, there is no specific legislation or regulation governing the marketing of
fertiliser products in the country with the exception of mandatory monitoring by MoFA
and product quality certification by the EPA at the port. The product quality control is
aimed at protecting farmers by ensuring that fertiliser products are not nutrient
deficient, adulterated, or sold in short weight bags. However, there is no effective
fertiliser product inspection and sample validation in Ghana.
15
Under the subsidy programme, prior to the beginning of the farming season the
Government advertised for expression of interest in the newspapers for bidding to
participate in the fertiliser subsidy programme. Evaluated and listed companies then
meet with the Government to work out the modalities of implementation and prices.
The modalities include the actual open market price and to the extent Government is
willing to ‘pay-off’ this for farmers. The cost of transportation is also taken into
consideration and absorbed by the Government and this is to ensure that the prices are
equal or the same in every part of the country.
The waybill system is used to track the quantities of fertilisers sold by the various
companies as subsidy is paid only on the quantities of fertilisers sold to the farmers. For
farmers to be able to purchase government subsidised fertilisers, they must get a copy
of farmers’ passbook at the nearest District Agriculture Offices. The passbooks, which
are not for sale are to enable farmers document their farm operations as well as track
beneficiary of the subsidy programme as it complements a daily record system
introduced at the retail end.
Unlike the open market system the prices for the sale of the approved fertilisers (mainly
Nitrogen-Phosphorous-Potasium or NPK and Urea) for the subsidy programme are fixed
and must be sold at the same price throughout the country. The results showed that as
in the year 2015, the subsidised price for the NPK and Urea were GH¢89.00 and
GH¢84.00 respectively. This forms 21 to 25 percent reduction to the open market price.
In 2015, five companies namely Yara Ghana Limited, Chemico Limited, Afcott Ghana
Limited, AMG West Africa Limited, Louis Dreyfus Commodities Limited, and ETC Ghana
Limited were evaluated and awarded quotas to provide subsidised fertilisers on behalf
of the Government. Yara Ghana Limited – though the largest distributor but later pulled
out of the 2015 programme. This might be due to delays in the payment of the subsidy
by the Government though the company would not state the official position for pulling
out to the general public. It must be noted that Yara Ghana Limited is the largest
importer or supplier of fertilisers in the market. It supplies about 50 percent of the total
quantity in the market.
Challenges with Current Structure of Implementation
There are only few agents in the distribution of the fertilisers. Most of these
agents are located in inner cities or regional capitals with little or no
representation in the rural areas where majority of the smallholder farmers
are located.
Farmers are unable to buy subsidised fertilisers from the agents because of
the long distance they have to travel to meet them.
16
Those farmers who are able to make it to the fertiliser agents points of sales
are usually unable to purchase them because of the high price. Due to this,
some farmers purchase lesser the required bags per hectare. Each farmer by
law is entitled to procure five bags of compound fertiliser and one bag of urea
per hectare of land.
Those farmers who are able to purchase the subsidised fertilisers tend to
purchase more than they required for their farm lands and then sell the
surplus at a higher price to other farmers.
Some agents also are in the practise of purchasing the surplus subsidised
fertilisers, which remain when farmers are not able to purchase. They sell
these surpluses at the open market price to other farmers in order to make
money.
Regulation of the Fertiliser Industry in Ghana
Currently, there is no specific legislation governing the marketing of fertiliser products
in the country with the exception of mandatory monitoring by Ministry of Foreign
Affairs (MoFA) and product quality certification by the Economic Partnership
Agreement (EPA) at the port. The product quality control is aimed at protecting the
farmers by ensuring that fertiliser products are not nutrient deficient, adulterated, or
sold in unstandardised weight bags.
Furthermore, it provides a rationale for standardising pricing. This protects honest
fertiliser dealers as well as reduces illegal trade practices, such as adulteration and sale
of bogus products in the form of cheaper domestically produced packages.
There is no effective fertiliser product inspection and sample validation in Ghana. There
are only a few inspection companies operating upon, which importers rely on for
inspection and certification at the point of loading only. Though the Plant Protection and
Regulatory Services Directorate (PPRSD) of MoFA have pesticide and seed inspectors
they are not properly equipped to inspect sample fertiliser products.
Despite the fact that Ghana does have numerous laboratories with varying capacity to
analyse fertiliser samples; there is no evidence of fertiliser dealer utilisation of such
facilities. The EPA does not also effectively perform its mandate of sampling, testing and
certification of fertiliser brought into the country. Even when it is done, it usually results
in unnecessary delays of the ship with associated cost implications on the importer.
Thus, the quality of fertiliser sold in the Ghanaian market cannot be said to be wholly
guaranteed, particularly in terms of its nutrient content, the net product weight and its
physical quality.
The story of adulterated fertiliser products is found only among small-scale illegal
imports that come into the country by land. Nevertheless, it is important to recognise
17
that quality control and truth in labelling are critical to the proper development of any
fertiliser market, particularly when it is becoming as diverse and dynamic as the
Ghanaian market.
An International Fertiliser Development Centre (IFDC) assessment in collaboration
with the MoFA has proposed a draft legislation and regulations as well as necessary
investments and organisations that could help address these problems if these
documents are enacted into law and implemented effectively.
Key Components of Success of the Fertiliser Industry
Some of the components of success associated with Ghana’s fertiliser industry are as
follows:
Significant agriculture demand and prices
Availability of improved and increased quality research
Increased investment and
Government subsidies
18
4. Competition in Customs Clearing
Procedures:
Impact on Competitive Fertiliser Supply Chain
The fertiliser consignment goes through a port clearance procedure upon arrival at the
port. This is usually undertaken by a clearing agent at no import duty charges, except in
situations where the product cannot be certified by port authorities to be a fertiliser
product. The clearing process appears to quite cumbersome as suggested by the
importers because they have to deal with nearly seven agencies and departments before
acquing the fertiliser clearance from the port.
There is lack of coordination among the agencies and the number of agencies and
departments to deal with and their associated fees have also increased the cost of
transactions and this cost is passed on to the farmer. This results in higher cost of
operations, with related corrupt practices as well as less timely input for distribution,
which does not promote effective competition. The cumbersome and overlong nature of
the clearing processor often causes delay and inefficiencies in the distribution of the
subsidised fertilisers.
The Government charges at the port of fertiliser imports is about 7 percent whilst port
charges on losses and demurrage is about 11 percent. These constitute an average of 17
percent of the total cost of fertiliser import prices. At present, importers rarely pool
their orders, and rarely do they arrange for joint handling, storage, and distribution, so
this is highly competitive. However, Government regulations to inspect fertiliser on
land cause delays, as does the lack of dedicated berths at the port. According to
Chemico Ltd., which claims to have been fined US$100 or US$1000 in demurrage
charges, it would be better for fertiliser inspection to be conducted on ships to avoid
such charges.
Poor security at the port leads to high losses from the theft of fertiliser in transit and
storage. Also, national regulations that require distribution by domestic transporters
sometimes necessitate an additional round of loading and loading, which adds to costs
and increases security problems. Poor quality warehouses and long storage periods in
humid climates lead to substantial losses from fertiliser caking with resultants cost
escalations for importers. Limited port capacity adds further to costs since large
shipments face delays and high demurrage charges. Congestion at port makes it difficult
access to containers.
19
Fertiliser Importation in Ghana
At present, no Ghanaian firm manufactures chemical fertilisers, although there are
some deposits of rock phosphate in the country. All the chemical fertilisers used in the
country are imported. Therefore, Ghana’s fertiliser supply chain begins with importers
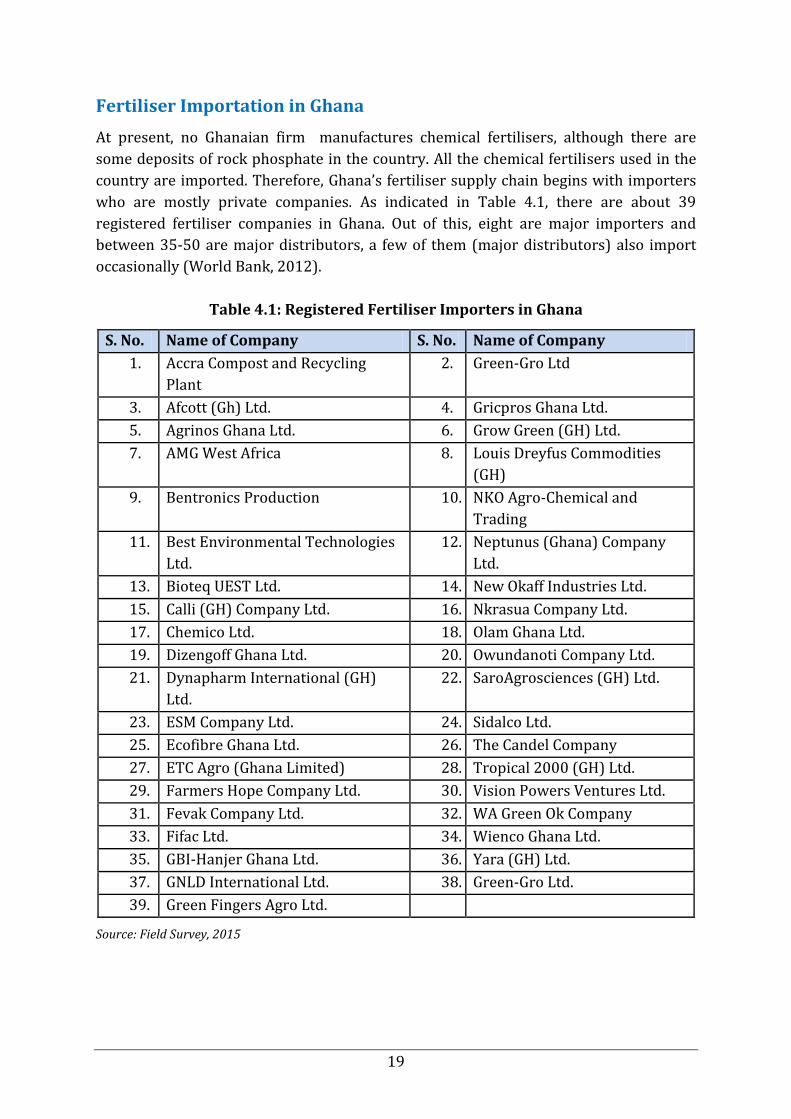
who are mostly private companies. As indicated in Table 4.1, there are about 39
registered fertiliser companies in Ghana. Out of this, eight are major importers and
between 35-50 are major distributors, a few of them (major distributors) also import
occasionally (World Bank, 2012).
Table 4.1: Registered Fertiliser Importers in Ghana
S. No. Name of Company S. No. Name of Company
1. Accra Compost and Recycling
Plant
2. Green-Gro Ltd
3. Afcott (Gh) Ltd. 4. Gricpros Ghana Ltd.
5. Agrinos Ghana Ltd. 6. Grow Green (GH) Ltd.
7. AMG West Africa 8. Louis Dreyfus Commodities
(GH)
9. Bentronics Production 10. NKO Agro-Chemical and
Trading
11. Best Environmental Technologies
Ltd.
12. Neptunus (Ghana) Company
Ltd.
13. Bioteq UEST Ltd. 14. New Okaff Industries Ltd.
15. Calli (GH) Company Ltd. 16. Nkrasua Company Ltd.
17. Chemico Ltd. 18. Olam Ghana Ltd.
19. Dizengoff Ghana Ltd. 20. Owundanoti Company Ltd.
21. Dynapharm International (GH)
Ltd.
22. SaroAgrosciences (GH) Ltd.
23. ESM Company Ltd. 24. Sidalco Ltd.
25. Ecofibre Ghana Ltd. 26. The Candel Company
27. ETC Agro (Ghana Limited) 28. Tropical 2000 (GH) Ltd.
29. Farmers Hope Company Ltd. 30. Vision Powers Ventures Ltd.
31. Fevak Company Ltd. 32. WA Green Ok Company
33. Fifac Ltd. 34. Wienco Ghana Ltd.
35. GBI-Hanjer Ghana Ltd. 36. Yara (GH) Ltd.
37. GNLD International Ltd. 38. Green-Gro Ltd.
39. Green Fingers Agro Ltd.
Source: Field Survey, 2015
20
This makes a stable exchange rate essential for stabilising import costs in local
currency; also an adequate supply of foreign exchange is needed to import the product
at the right time to meet demand. Ghana’s high cost of finance and high freight costs
associated with small shiploads also influence these high procurement costs. Importers’
margins vary between 16-20 percent.
Retailers’ margins are in the range of 3 to 5 percent. With such margins, trading
fertiliser alone is a risky business. As a result, many retailers also sell crop protection
chemicals partially because their margins are much higher. The limited profitability of
fertiliser use has also led to decreased demand and consequently to adverse effects on
soil fertility, productivity, food security and the environment. Under these conditions of
low profitability and poor soil fertility, improving the efficacy of fertiliser use becomes
very important.
Port Requirement and Clearance for Fertiliser Imports
The fertiliser consignment goes through a port clearance procedure on the arrival at the
port. This is usually undertaken by a clearing agent at no import duty charges, except in
situations where the product cannot be certified by port authorities to be a fertiliser
product.
Port Clearing Procedure
The clearing procedures for fertilisers include the following steps:
Application for a permit from MoFA
Application to the pesticide division
Customs for declaration
Securing all documents, invoice and exemption letters
Obtaining shipping line charges pay and taking release
Custom examination at the terminal and release and
Discharge of consignment from containers to trucks and exit the port gate after
processing
Challenges to Port Clearing
The challenges to port requirement and system for clearance of fertiliser imports are as
following:
i. Operantional constraints
Operational efficiency at the port during port clearing of fertiliser consignment is
deemed to be cumbersome and time-consuming due to poor coordination across the
different agencies involved. This results in higher cost in operations, with related
corrupt practices as well as less timely input for distribution, which does not afford
effective competition.
21
Specifically, the lack of coordination among inspection agencies at ports affects port
handing processes is a major constraint. Inspections by various government agencies –
including Customs, the PPRSD, the Ghana Standards Authority (GSA), often carried out
separately means at least at four separate occasions and this adds significant delays to
clearance times.
Furthermore, this generates opportunity for illicit payments. This extra burden
multiplies transaction costs that are already high, thereby increasing the cost of
imported fertilisers. Consequently. this makes end products less competitive in local
and regional markets.
ii. Other constraints
Other constraints associated with port clearance and distribution of fertilisers are:
Cumbersome and lengthy customs procedures in acquiring permit
Numerous clearing agents involved in the clearing of goods at the port
Delays in documentation processing for clearance
Risk of divisions and break down of trucks
Delays at the discharging point and
Time consuming procedure for unstuffing of fertilisers from containers to trucks
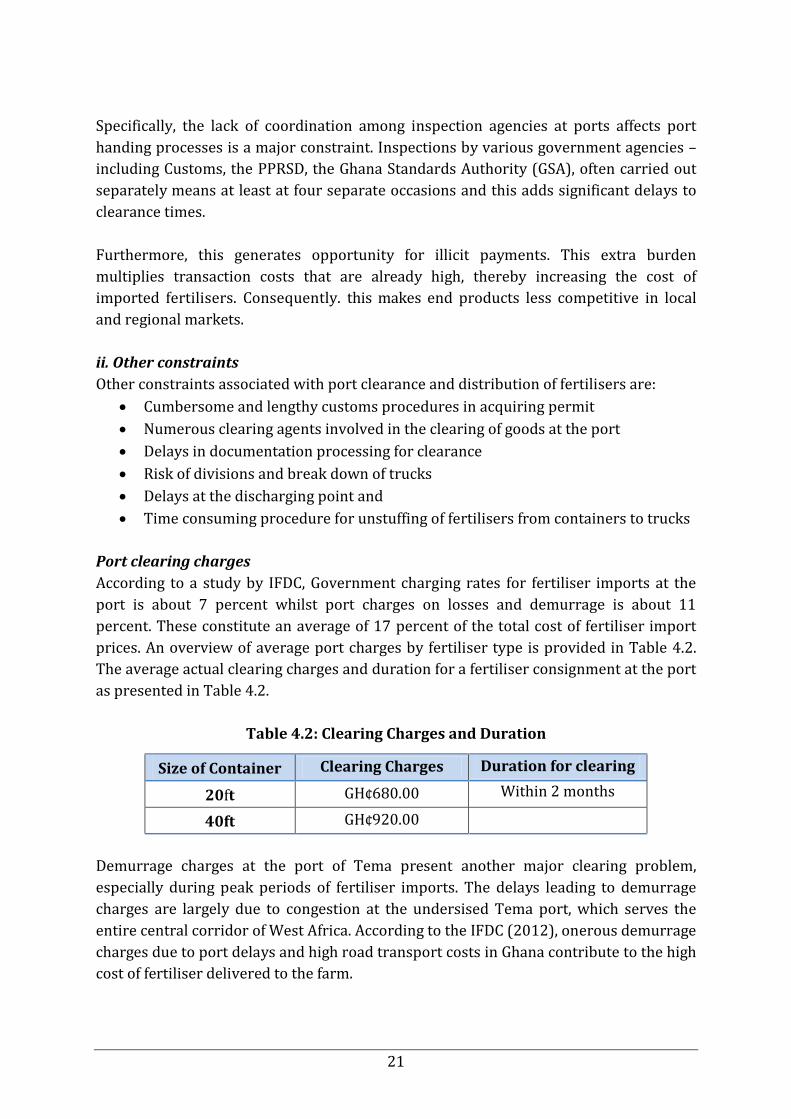
Port clearing charges
According to a study by IFDC, Government charging rates for fertiliser imports at the
port is about 7 percent whilst port charges on losses and demurrage is about 11
percent. These constitute an average of 17 percent of the total cost of fertiliser import
prices. An overview of average port charges by fertiliser type is provided in Table 4.2.
The average actual clearing charges and duration for a fertiliser consignment at the port
as presented in Table 4.2.
Table 4.2: Clearing Charges and Duration
Size of Container Clearing Charges Duration for clearing
20ft GH¢680.00 Within 2 months
40ft GH¢920.00
Demurrage charges at the port of Tema present another major clearing problem,
especially during peak periods of fertiliser imports. The delays leading to demurrage
charges are largely due to congestion at the undersised Tema port, which serves the
entire central corridor of West Africa. According to the IFDC (2012), onerous demurrage
charges due to port delays and high road transport costs in Ghana contribute to the high
cost of fertiliser delivered to the farm.
22
Currently, importers rarely pool their orders, and rarely do they arrange for joint
handling, storage, and distribution so this is highly competitive. However,
Government regulations to inspect fertiliser on land cause delays, as does the lack of
dedicated berths at the port. According to Chemico Ltd., which claimed to have been
fined hundreds of thousands of US$ in demurrage charges it will be better for
fertiliser inspection to be done on ships to avoid such charges.
Security at the port
Poor security at the port leads to high losses from the theft of fertilisers in transit and
storage. Also, national regulations that require distribution by domestic transporters
sometimes necessitate an additional round of loading and loading, which adds to costs
and increases security problems.
Limited Warehousing capacity
Poor-quality warehouses and long storage periods in humid climates lead to substantial
losses from fertiliser caking with resultants cost escalations for importers.
Limited Port Capacity
Limited port capacity adds further to costs since large shipments face delays and high
demurrage charges. Congestion at port makes it difficult access to containers.
Requirements for Operating Fertiliser Business
Currently, the requirement for becoming a fertiliser importer includes the following
steps:
1. Application to the Minister of Food and Agriculture, stating the intention of
registering a Fertiliser Company/Product (s)
2. Purchase application form(s) after acceptance of initial letter
3. Submit application form(s) with the under listed documents attached:
Dossier
Certificate of registration (Registrar Generals Department)
Copies of laboratory analysis of the product
Product label
Product sample (if it is a new product)
4. Review of application letter and other relevant documents by the fertiliser
administrator
5. Payment of recommended fees
6. Analysis of fertiliser samples in a designated laboratory to verify guaranteed levels
of fertiliser nutrients and
7. Granting of fertiliser product or company registration certificate or a fertiliser
dealer’s licence by the Pesticides and Fertiliser Regulatory Division.
23
Import Requirements for Fertiliser Product(s)
Application for fertiliser import permit is required on a letter head and submitted to the
nearest regional agricultural office or to PPRSD headquarters. The application should
include the following:
Name and address of importer
Name and address of exporter
Name of fertiliser product (s)
Name of compounds and concentration
Type of formulation
Quantity of fertiliser product(s) to be imported like kg, bag, litre etc.
Country of origin of fertiliser
Indication of the port of entry
Company registration number or document (Registrar General's Department)
Pro forma invoice or technical document of the fertiliser product (s)
Challenges to Fertiliser Import Entry
Despite the absence of barriers to entry, market opportunity does not automatically
translate into market access for many prospective fertiliser importers due to the following
constraints:
i. High capital investment
Investing in fertiliser trading is not attractive to all prospective investors because of
the high capital outlay and limited access to credit, especially for local Ghanaian
companies. This has resulted in a small concentration of businesses at the import
and wholesale levels. For example, Yara, the leading fertiliser company, is one of the
major importers in Ghana and has a market share of 50-60 percent of fertiliser
imports (MoFA 2015).
ii. Limited agro-dealers
Similarly, agro-dealers are also limited, especially in remote rural areas where the
product is most needed for use, since investment in domestic distribution network
is neglected.
iii. Registration requirements for fertiliser imports
The process of acquiring clearance from MoFA for fertiliser import is also
considered to be relatively difficult by importers. Firstly, potential business
investors face high information gathering and transactions costs to obtain
necessary government approvals. This does not offer effective platform for
competition. Secondly, every year, an agro-dealer has to spend many weeks
obtaining separate registrations. Specifically, applying for import duty exemption is
very time-consuming, requiring a letter from MoFA to the Ministry of Finance and
24
ultimately the GRA (Internal Revenue Service) who oversees income and corporate
taxes, Value Added Tax (VAT) and Ghana Revenue Authority (Customs Division).
This is a key deterrent to some potential investors in product market and this
indirectly affects smallholders.
iv. Delays in subsidy payment
Although well-meaning and a good tool for making fertiliser available and
affordable for small farmers in Ghana, the fertiliser subsidy programme is being
implemented in ways that are problematic to the private sector. Though the
fertiliser subsidy system works best for importers, they tend to wait a long time
for their subsidy reimbursement. Delays in subsidy challenges affects credit
availability for future imports. In addition to this, the delays create significant
cost to invested capital, especially from the effects of foreign exchange
fluctuations.
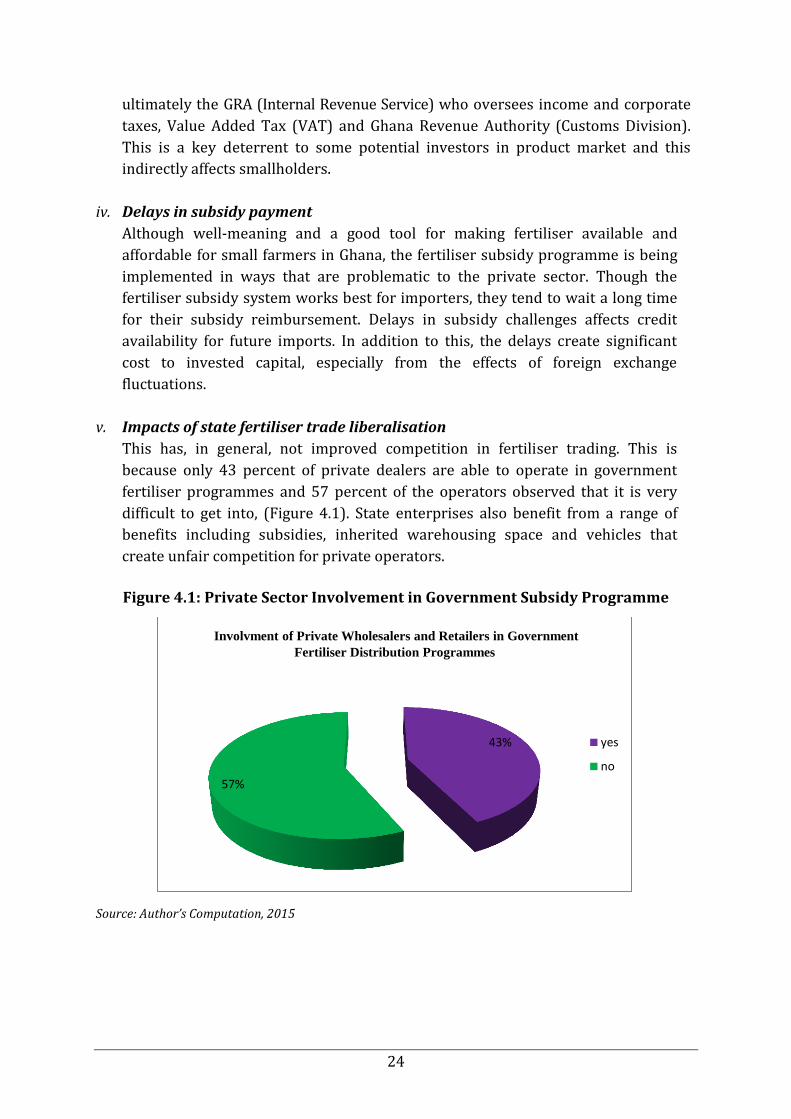
v. Impacts of state fertiliser trade liberalisation
This has, in general, not improved competition in fertiliser trading. This is
because only 43 percent of private dealers are able to operate in government
fertiliser programmes and 57 percent of the operators observed that it is very
difficult to get into, (Figure 4.1). State enterprises also benefit from a range of
benefits including subsidies, inherited warehousing space and vehicles that
create unfair competition for private operators.
Figure 4.1: Private Sector Involvement in Government Subsidy Programme
Source: Author’s Computation, 2015
43%
57%
Involvment of Private Wholesalers and Retailers in Government
Fertiliser Distribution Programmes
yes
no
25
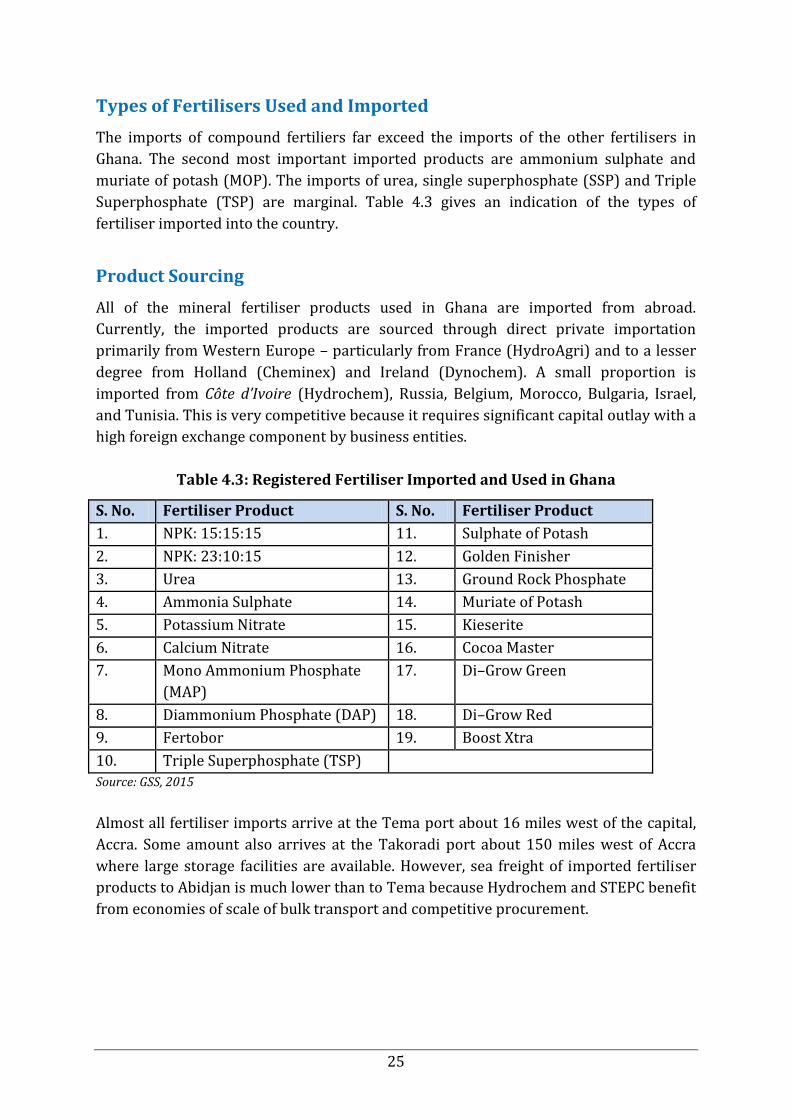
Types of Fertilisers Used and Imported
The imports of compound fertiliers far exceed the imports of the other fertilisers in
Ghana. The second most important imported products are ammonium sulphate and
muriate of potash (MOP). The imports of urea, single superphosphate (SSP) and Triple
Superphosphate (TSP) are marginal. Table 4.3 gives an indication of the types of
fertiliser imported into the country.
Product Sourcing
All of the mineral fertiliser products used in Ghana are imported from abroad.
Currently, the imported products are sourced through direct private importation
primarily from Western Europe – particularly from France (HydroAgri) and to a lesser
degree from Holland (Cheminex) and Ireland (Dynochem). A small proportion is
imported from Côte d’Ivoire (Hydrochem), Russia, Belgium, Morocco, Bulgaria, Israel,
and Tunisia. This is very competitive because it requires significant capital outlay with a
high foreign exchange component by business entities.
Table 4.3: Registered Fertiliser Imported and Used in Ghana
S. No. Fertiliser Product S. No. Fertiliser Product
1. NPK: 15:15:15 11. Sulphate of Potash
2. NPK: 23:10:15 12. Golden Finisher
3. Urea 13. Ground Rock Phosphate
4. Ammonia Sulphate 14. Muriate of Potash
5. Potassium Nitrate 15. Kieserite
6. Calcium Nitrate 16. Cocoa Master
7. Mono Ammonium Phosphate
(MAP)
17. Di–Grow Green
8. Diammonium Phosphate (DAP) 18. Di–Grow Red
9. Fertobor 19. Boost Xtra
10. Triple Superphosphate (TSP)
Source: GSS, 2015
Almost all fertiliser imports arrive at the Tema port about 16 miles west of the capital,
Accra. Some amount also arrives at the Takoradi port about 150 miles west of Accra
where large storage facilities are available. However, sea freight of imported fertiliser
products to Abidjan is much lower than to Tema because Hydrochem and STEPC benefit
from economies of scale of bulk transport and competitive procurement.

26
5. Fertiliser Distribution, Marketing and
Transportation Channels
A schematic view of the distribution and marketing channels of chemical fertilisers is
illustrated in Figure 5.1.
Figure 5.1: Fertiliser Distribution Network in Ghana
Because there is little suitable warehouse storage for bulk fertiliser products in the
Tema port, most of the imports come in 50 kg and 25 kg labelled bags. Loose fertiliser is
also bagged into 50 kg bags and transported by road to distribution depots or
warehouses of respective wholesalers around the country.
Most of the importers operate distribution depots in Tema, Takoradi, Kumasi, and
Tamale. The main private importers have wholesale outlets to deliver directly to end-
IMPORTER
DISTRIBUTOR OR AGENT
RETAILER 1
RETAILER 2
LARGE SCALE FARMER
SMALLHOLDER FARMER
27
users, primarily in the oil palm, tobacco, and cotton subsectors and in the large rice
irrigation projects.
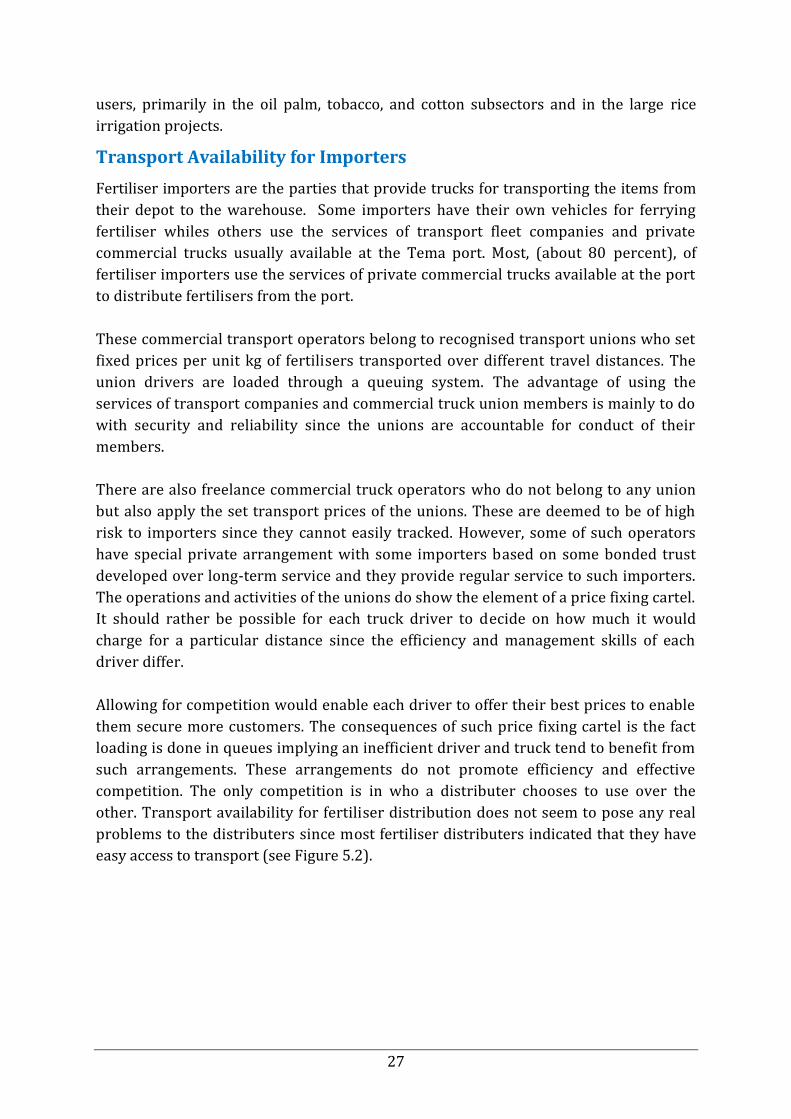
Transport Availability for Importers
Fertiliser importers are the parties that provide trucks for transporting the items from
their depot to the warehouse. Some importers have their own vehicles for ferrying
fertiliser whiles others use the services of transport fleet companies and private
commercial trucks usually available at the Tema port. Most, (about 80 percent), of
fertiliser importers use the services of private commercial trucks available at the port
to distribute fertilisers from the port.
These commercial transport operators belong to recognised transport unions who set
fixed prices per unit kg of fertilisers transported over different travel distances. The
union drivers are loaded through a queuing system. The advantage of using the
services of transport companies and commercial truck union members is mainly to do
with security and reliability since the unions are accountable for conduct of their
members.
There are also freelance commercial truck operators who do not belong to any union
but also apply the set transport prices of the unions. These are deemed to be of high
risk to importers since they cannot easily tracked. However, some of such operators
have special private arrangement with some importers based on some bonded trust
developed over long-term service and they provide regular service to such importers.
The operations and activities of the unions do show the element of a price fixing cartel.
It should rather be possible for each truck driver to decide on how much it would
charge for a particular distance since the efficiency and management skills of each
driver differ.
Allowing for competition would enable each driver to offer their best prices to enable
them secure more customers. The consequences of such price fixing cartel is the fact
loading is done in queues implying an inefficient driver and truck tend to benefit from
such arrangements. These arrangements do not promote efficiency and effective
competition. The only competition is in who a distributer chooses to use over the
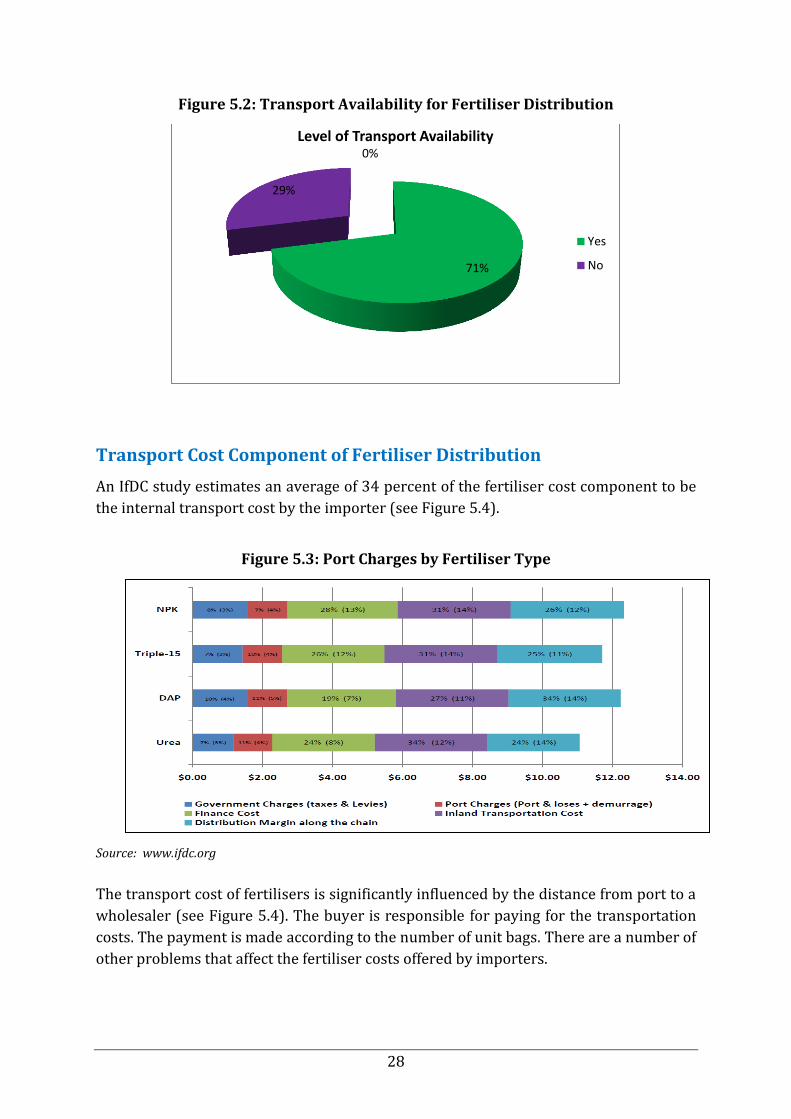
other. Transport availability for fertiliser distribution does not seem to pose any real
problems to the distributers since most fertiliser distributers indicated that they have
easy access to transport (see Figure 5.2).
28
Figure 5.2: Transport Availability for Fertiliser Distribution
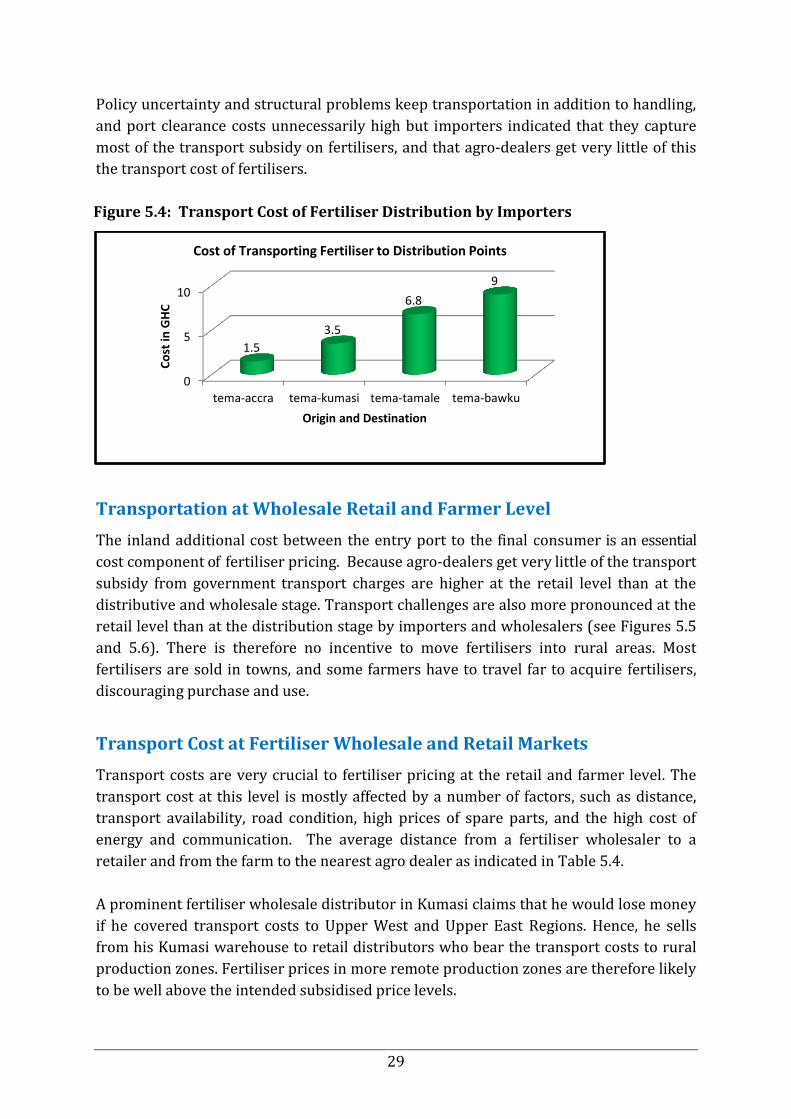
Transport Cost Component of Fertiliser Distribution
An IfDC study estimates an average of 34 percent of the fertiliser cost component to be
the internal transport cost by the importer (see Figure 5.4).
Figure 5.3: Port Charges by Fertiliser Type
Source: www.ifdc.org
The transport cost of fertilisers is significantly influenced by the distance from port to a
wholesaler (see Figure 5.4). The buyer is responsible for paying for the transportation
costs. The payment is made according to the number of unit bags. There are a number of
other problems that affect the fertiliser costs offered by importers.
0%
71%
29%
Level of Transport Availability
Yes
No
29
Policy uncertainty and structural problems keep transportation in addition to handling,
and port clearance costs unnecessarily high but importers indicated that they capture
most of the transport subsidy on fertilisers, and that agro-dealers get very little of this
the transport cost of fertilisers.
Figure 5.4: Transport Cost of Fertiliser Distribution by Importers
Transportation at Wholesale Retail and Farmer Level
The inland additional cost between the entry port to the final consumer is an essential
cost component of fertiliser pricing. Because agro-dealers get very little of the transport
subsidy from government transport charges are higher at the retail level than at the
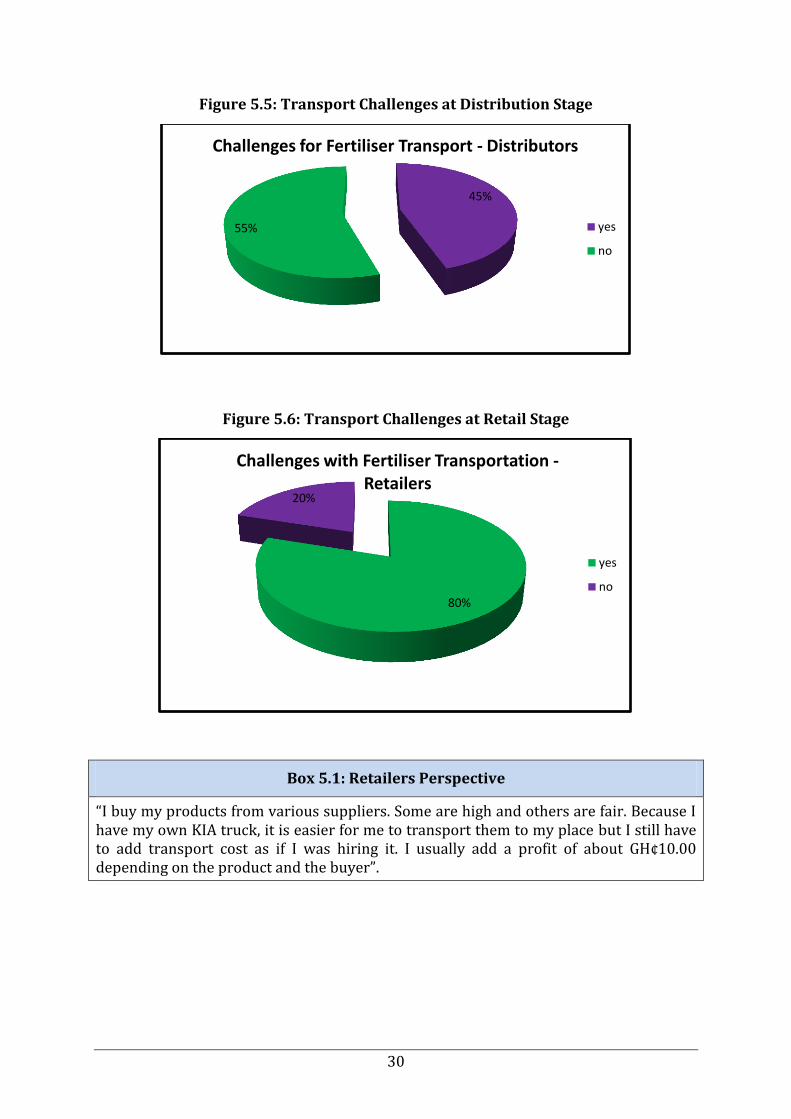
distributive and wholesale stage. Transport challenges are also more pronounced at the
retail level than at the distribution stage by importers and wholesalers (see Figures 5.5
and 5.6). There is therefore no incentive to move fertilisers into rural areas. Most
fertilisers are sold in towns, and some farmers have to travel far to acquire fertilisers,
discouraging purchase and use.
Transport Cost at Fertiliser Wholesale and Retail Markets
Transport costs are very crucial to fertiliser pricing at the retail and farmer level. The
transport cost at this level is mostly affected by a number of factors, such as distance,
transport availability, road condition, high prices of spare parts, and the high cost of
energy and communication. The average distance from a fertiliser wholesaler to a
retailer and from the farm to the nearest agro dealer as indicated in Table 5.4.
A prominent fertiliser wholesale distributor in Kumasi claims that he would lose money
if he covered transport costs to Upper West and Upper East Regions. Hence, he sells
from his Kumasi warehouse to retail distributors who bear the transport costs to rural
production zones. Fertiliser prices in more remote production zones are therefore likely
to be well above the intended subsidised price levels.
0
5
10
tema-accra tema-kumasi tema-tamale tema-bawku
1.5
3.5
6.8
9
Co
st in
GH
C
Origin and Destination
Cost of Transporting Fertiliser to Distribution Points
30
Figure 5.5: Transport Challenges at Distribution Stage
Figure 5.6: Transport Challenges at Retail Stage
Box 5.1: Retailers Perspective
“I buy my products from various suppliers. Some are high and others are fair. Because I have my own KIA truck, it is easier for me to transport them to my place but I still have to add transport cost as if I was hiring it. I usually add a profit of about GH¢10.00 depending on the product and the buyer”.
45%
55%
Challenges for Fertiliser Transport - Distributors
yes
no
80%
20%
Challenges with Fertiliser Transportation - Retailers
yes
no
31
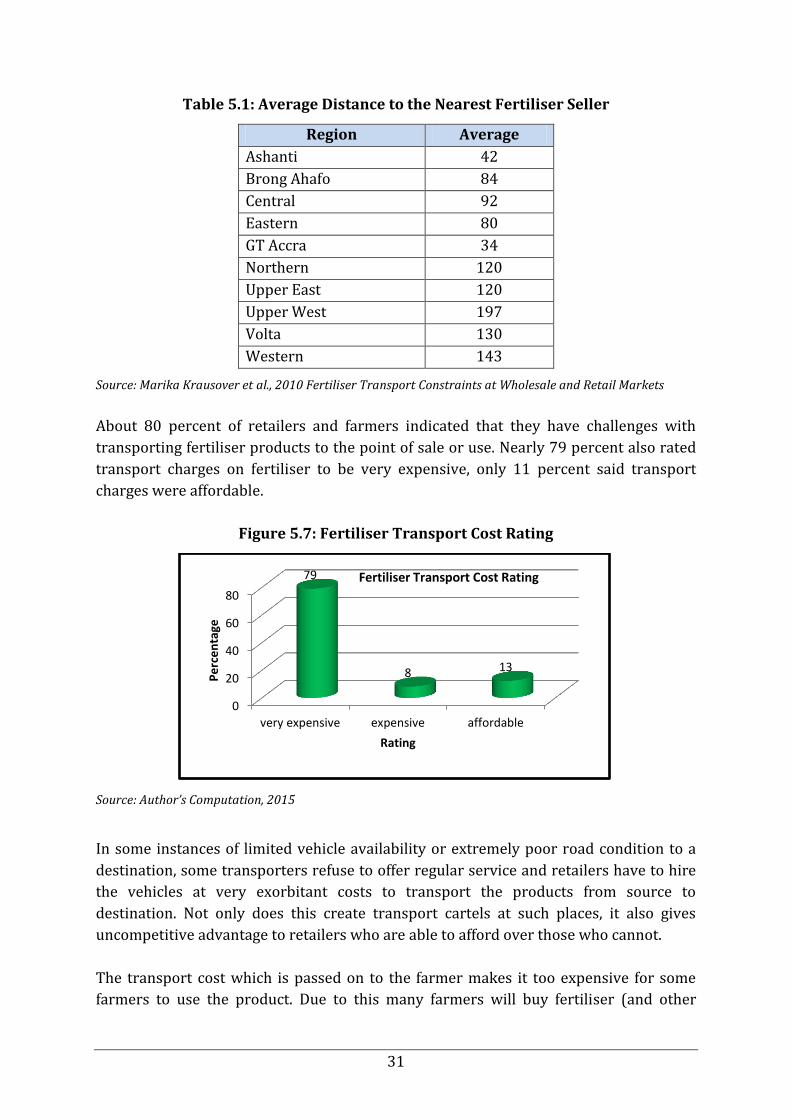
Table 5.1: Average Distance to the Nearest Fertiliser Seller
Region Average
Ashanti 42
Brong Ahafo 84
Central 92
Eastern 80
GT Accra 34
Northern 120
Upper East 120
Upper West 197
Volta 130
Western 143
Source: Marika Krausover et al., 2010 Fertiliser Transport Constraints at Wholesale and Retail Markets
About 80 percent of retailers and farmers indicated that they have challenges with
transporting fertiliser products to the point of sale or use. Nearly 79 percent also rated
transport charges on fertiliser to be very expensive, only 11 percent said transport
charges were affordable.
Figure 5.7: Fertiliser Transport Cost Rating
Source: Author’s Computation, 2015
In some instances of limited vehicle availability or extremely poor road condition to a
destination, some transporters refuse to offer regular service and retailers have to hire
the vehicles at very exorbitant costs to transport the products from source to
destination. Not only does this create transport cartels at such places, it also gives
uncompetitive advantage to retailers who are able to afford over those who cannot.
The transport cost which is passed on to the farmer makes it too expensive for some
farmers to use the product. Due to this many farmers will buy fertiliser (and other
0
20
40
60
80
very expensive expensive affordable
79
8 13
Pe
rce
nta
ge
Rating
Fertiliser Transport Cost Rating
32
inputs) only if the shop or supply outlet is within easy walking distance or at best a
cycling distance. Many small farmers cannot afford to buy a 50 kg bag of fertilisers and
so it is desirable in areas where small farmers predominate that fertilisers should be
sold in smaller quantities – 1, 2, 5 and 10 kg.
Box 5.2: Retailer’s Opinion
“I started this business because there was no one selling fertiliser and other chemicals here. We all usually go the nearest town to buy chemicals. Initially, when I started, business was good. But now, a lot of people are selling in small quantities and others and that is affecting me now and there is nothing I can do about it”.
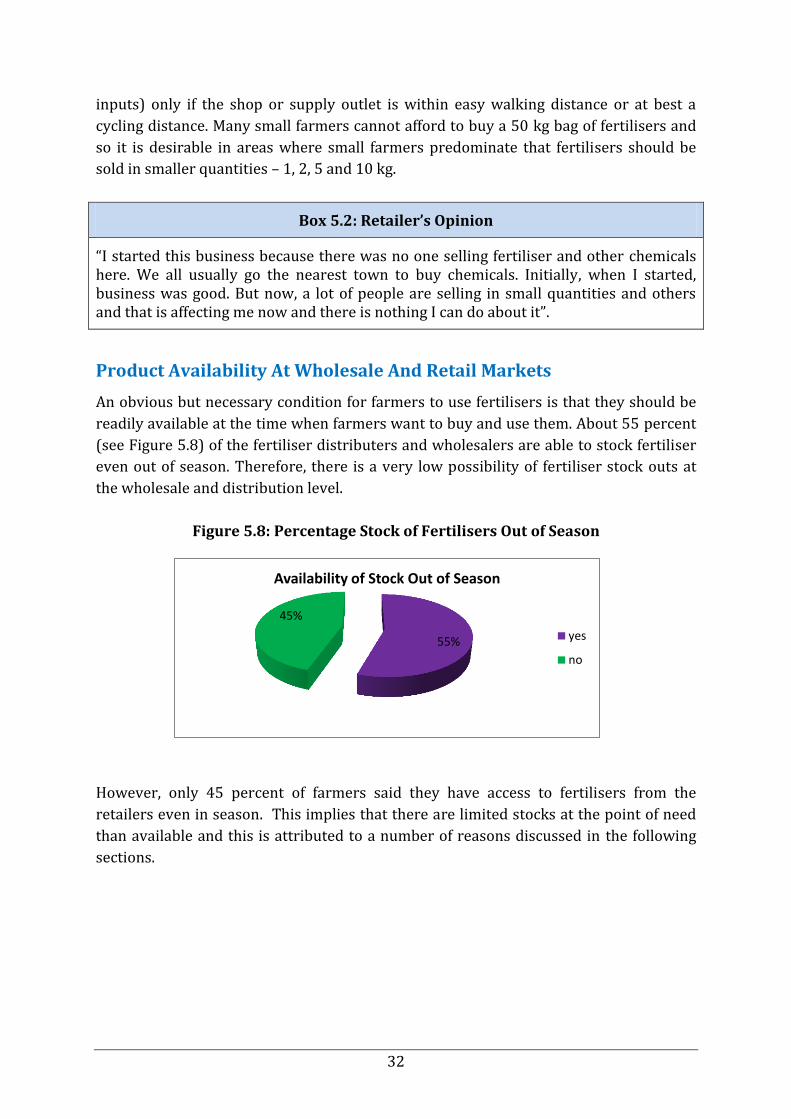
Product Availability At Wholesale And Retail Markets
An obvious but necessary condition for farmers to use fertilisers is that they should be
readily available at the time when farmers want to buy and use them. About 55 percent
(see Figure 5.8) of the fertiliser distributers and wholesalers are able to stock fertiliser
even out of season. Therefore, there is a very low possibility of fertiliser stock outs at
the wholesale and distribution level.
Figure 5.8: Percentage Stock of Fertilisers Out of Season
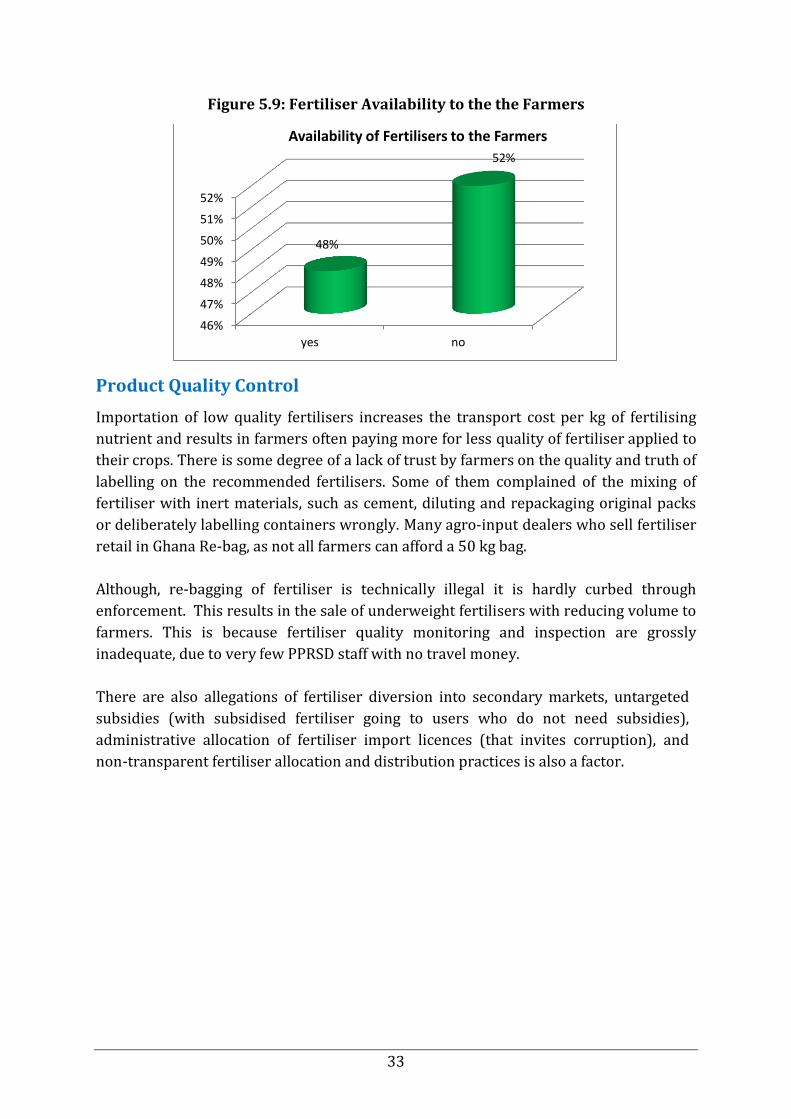
However, only 45 percent of farmers said they have access to fertilisers from the
retailers even in season. This implies that there are limited stocks at the point of need
than available and this is attributed to a number of reasons discussed in the following
sections.
55%
45%
Availability of Stock Out of Season
yes
no
33
Figure 5.9: Fertiliser Availability to the the Farmers
Product Quality Control
Importation of low quality fertilisers increases the transport cost per kg of fertilising
nutrient and results in farmers often paying more for less quality of fertiliser applied to
their crops. There is some degree of a lack of trust by farmers on the quality and truth of
labelling on the recommended fertilisers. Some of them complained of the mixing of
fertiliser with inert materials, such as cement, diluting and repackaging original packs
or deliberately labelling containers wrongly. Many agro-input dealers who sell fertiliser
retail in Ghana Re-bag, as not all farmers can afford a 50 kg bag.
Although, re-bagging of fertiliser is technically illegal it is hardly curbed through
enforcement. This results in the sale of underweight fertilisers with reducing volume to
farmers. This is because fertiliser quality monitoring and inspection are grossly
inadequate, due to very few PPRSD staff with no travel money.
There are also allegations of fertiliser diversion into secondary markets, untargeted
subsidies (with subsidised fertiliser going to users who do not need subsidies),
administrative allocation of fertiliser import licences (that invites corruption), and
non-transparent fertiliser allocation and distribution practices is also a factor.
46%
47%
48%
49%
50%
51%
52%
yes no
48%
52%
Availability of Fertilisers to the Farmers

34
6. Competition Practices amongst Fertiliser
Operators and Handlers
Competitiveness of Fertiliser Trade
There are no barriers for entry and exit to the fertilisers import, wholesale and retail
markets in Ghana. However, as stated earlier, huge investment capital requirements,
stringent bank requirements and high interest rates at (30-40 percent per annum)
deter most investors from entering. All the importers and distributors or agents
interviewed for this research (Yara, Louis Dreyfus, Afcott and Chemico) indicated that
so far as one has the investment capital and fulfill all the necessary registration
procedures and quality checks the company or individual is allowed to operate.
Observations and interviews with marketing executives of importing companies
interviewed for this research indicated that the industry is highly competitive.
This is reflected in the unwillingness of companies to divulge information, especially on
prices they quote for their products to a third party. As in the words of one of the
marketing executives, “I am providing you with these information (prices, agents and
business arrangements) because you (interviewer) has assured me (interviewee) that
the information is for only research purposes”. It was observed that these companies
and agents are highly competing for customers and by divulging key business
information to a third party may be used by their competitors to outwit them in the
market.
The results of the price quotes by the companies reflect this assertion because the data
on price of the various importers interviewed vary from one importer to the other. See
Appendix 1 for the various prices quoted by the importers. To a large extent, fertiliser
pricing in Ghana by importers follows a price leadership model; smaller importers peg
their prices to the prices of the market leader (Yara). Though there is no evidence of
collusive behaviour or cartel, these fertiliser marketing companies follow each other
closely in prices as seen in Appendix 1.
Some importers as a way of enticing their agents and farmers provide them some
incentives, such as bearing part of the transportation cost and providing gift vouchers to
distributors for onward presentation to the farmers. It appears, however, that the
industry has few suppliers or importers who are actively involved in the fertiliser trade.
There is the tendency that there may be inefficiencies in practices of these importers
but because of the few numbers of players these may go unnoticed. This may be so
because where there are few players there is a greater possibility of transferring
inefficiencies to consumers because there are not many very strong competitors.
35
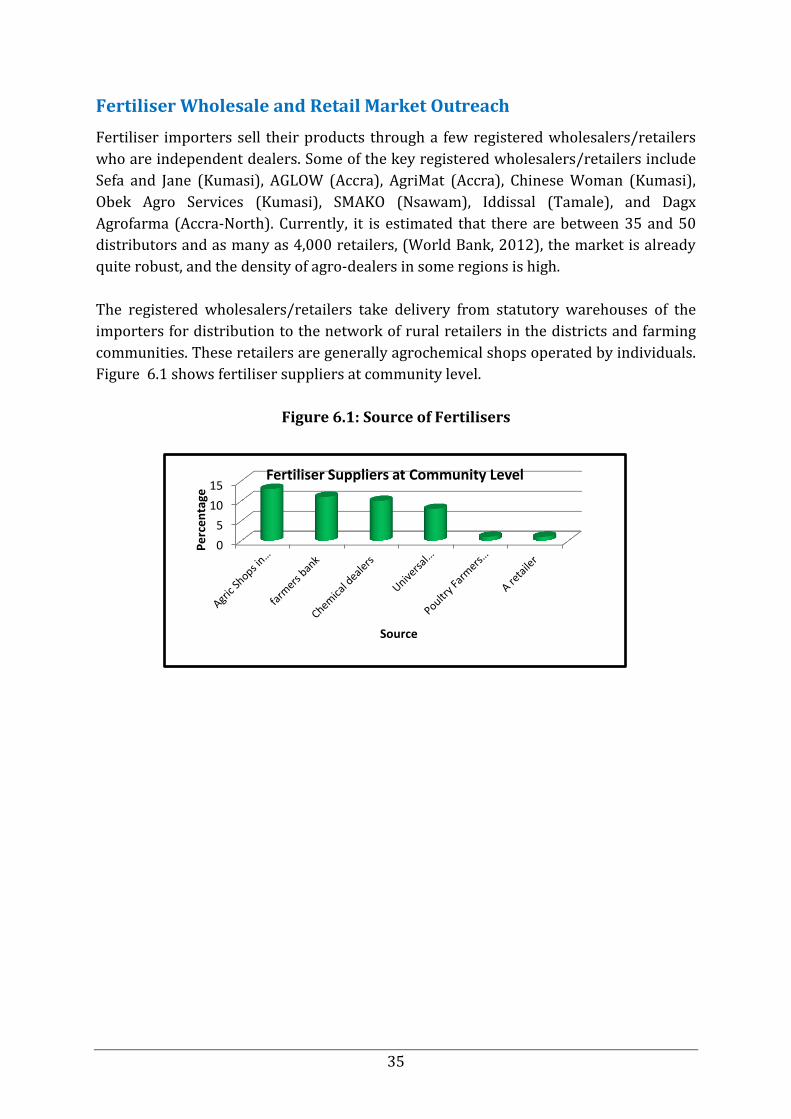
Fertiliser Wholesale and Retail Market Outreach
Fertiliser importers sell their products through a few registered wholesalers/retailers
who are independent dealers. Some of the key registered wholesalers/retailers include
Sefa and Jane (Kumasi), AGLOW (Accra), AgriMat (Accra), Chinese Woman (Kumasi),
Obek Agro Services (Kumasi), SMAKO (Nsawam), Iddissal (Tamale), and Dagx
Agrofarma (Accra-North). Currently, it is estimated that there are between 35 and 50
distributors and as many as 4,000 retailers, (World Bank, 2012), the market is already
quite robust, and the density of agro-dealers in some regions is high.
The registered wholesalers/retailers take delivery from statutory warehouses of the
importers for distribution to the network of rural retailers in the districts and farming
communities. These retailers are generally agrochemical shops operated by individuals.
Figure 6.1 shows fertiliser suppliers at community level.
Figure 6.1: Source of Fertilisers
0
5
10
15
Pe
rce
nta
ge
Source
Fertiliser Suppliers at Community Level
36
7. High Fertiliser Prices, Remote
Causes and Challenges of FSP
Fertiliser Pricing by Importers
Marketing margin typically determined as a percentage of the total cost of the product
at each stage of the distribution and value chain is set by business owners to cover
unaccounted costs, expenses, and profit to pay for their entrepreneurial efforts. It also
includes port handling and transport costs. The fertiliser product pricing is caused by
the following factors:
Studies of fertiliser cost structures suggest that high prices are due more to
policy uncertainty and structural problems that keep transportation costs
unnecessarily high, than to excessive margins, especially at the retail level.
Inflation rate, exchange rate depreciation or appreciation (and degree of
currency over- or under-valuation), interest rates (including Treasury bill/note
rates, Central Bank reserve rates), size of budget deficit (and extent to which
Government borrows to cover deficit) also affect fertiliser prices.
Inability of the Government to add organic fertiliser (a substitute to chemical
fertiliser) which is been produced in the country to the subsidy programme.
Inability of buyers to organise themselves to the extent that they could demand
participation in price setting.
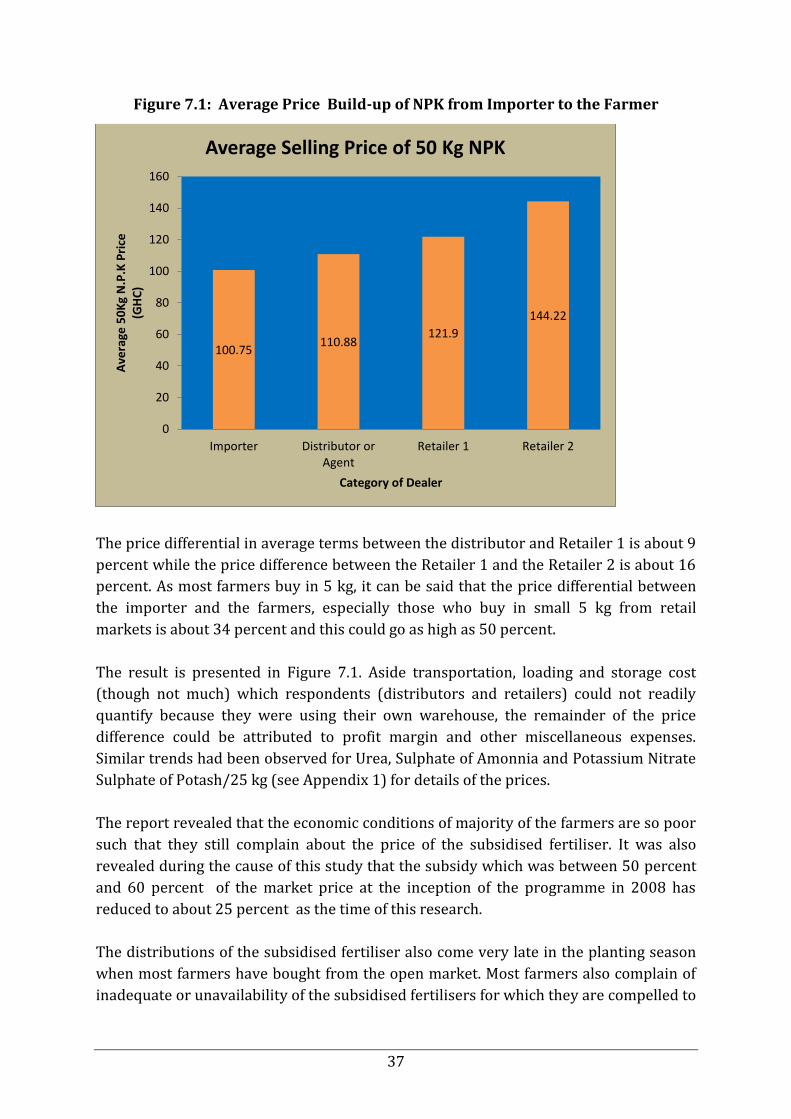
There most commonly used fertiliser for crop production in Ghana is NPK and there are
combinations of this which are: NPK: 23:10:15/50 kg and NPK: 15:15:15/50 kg. The
data, however, showed that the prices on the market are the same for them. The results
showed that the average price of 50 kg bag of NPK is sold by the importers at
GH¢100.75 on the open market and the distributors or agents sells it at an average price
of GH¢110.88. This represents about 9 percent price difference between the importer
and distributor.
The cost of transportation between the importer and the destination of the distributors
depends on the distance and it is charged per bag. This range from GH¢1.50 through
GH¢5.00 to GH¢9.00 per bag depending on the part of the country the distributor is
located. Loading is also charged per bag and this was quoted GH¢0.60 per bag from the
importer to the distributor as at the time of this study. Retailers (shall be called Retailer
1) who sells in 50 kg bags for farmers sells at an average price of GH¢121.90 while those
(shall be called Retailer 2) who buy from Retailer 1 and sells in 5 kg bowls (popularly
called Olonka) sells a 50 kg bag of NPK at an average price of and a high as GH¢155.00.
37
Figure 7.1: Average Price Build-up of NPK from Importer to the Farmer
The price differential in average terms between the distributor and Retailer 1 is about 9
percent while the price difference between the Retailer 1 and the Retailer 2 is about 16
percent. As most farmers buy in 5 kg, it can be said that the price differential between
the importer and the farmers, especially those who buy in small 5 kg from retail
markets is about 34 percent and this could go as high as 50 percent.
The result is presented in Figure 7.1. Aside transportation, loading and storage cost
(though not much) which respondents (distributors and retailers) could not readily
quantify because they were using their own warehouse, the remainder of the price
difference could be attributed to profit margin and other miscellaneous expenses.
Similar trends had been observed for Urea, Sulphate of Amonnia and Potassium Nitrate
Sulphate of Potash/25 kg (see Appendix 1) for details of the prices.
The report revealed that the economic conditions of majority of the farmers are so poor
such that they still complain about the price of the subsidised fertiliser. It was also
revealed during the cause of this study that the subsidy which was between 50 percent
and 60 percent of the market price at the inception of the programme in 2008 has
reduced to about 25 percent as the time of this research.
The distributions of the subsidised fertiliser also come very late in the planting season
when most farmers have bought from the open market. Most farmers also complain of
inadequate or unavailability of the subsidised fertilisers for which they are compelled to
100.75 110.88
121.9
144.22
0
20
40
60
80
100
120
140
160
Importer Distributor orAgent
Retailer 1 Retailer 2
Ave
rage
50
Kg
N.P
.K P
rice
(G
HC
)
Category of Dealer
Average Selling Price of 50 Kg NPK
38
rely on the open market, which is usually very expensive as per the views of the
farmers.
It was revealed that some farmers are not even aware of the existence of the fertiliser
subsidy programme. According to the Peasant Farmers Association of Ghana (PFAG)
most farmers are in very remote areas for which they do not even have knowledge of
the existence of the programme. PFAG also indicated that the introduction of
commercial farmers into the subsidy programme has also affected the quantity that
smallholder farmers have access to. In some instances, these well-to-do commercial
farmers buy more than they need and later sell it in the open market for the famers who
are not able to buy directly from the distributors.
The Government of Ghana is also not able to subsidise prices for the quantity need by
smallholder farmers and has even reduced the subsidy percentage in the country
because of budgetary constraints. PFAG again indicated that some agents are notorious
for causing artificial shortages and selling subsidised fertilisers to farmers at high
prices. In addition, the association added that the Government normally add the
transport to subsidy up to the regional levels and since most of the retailers are located
in the district capitals and zonal areas, these retailers tend to add that cost, which
sometimes send the higher than the approved subsidised price.
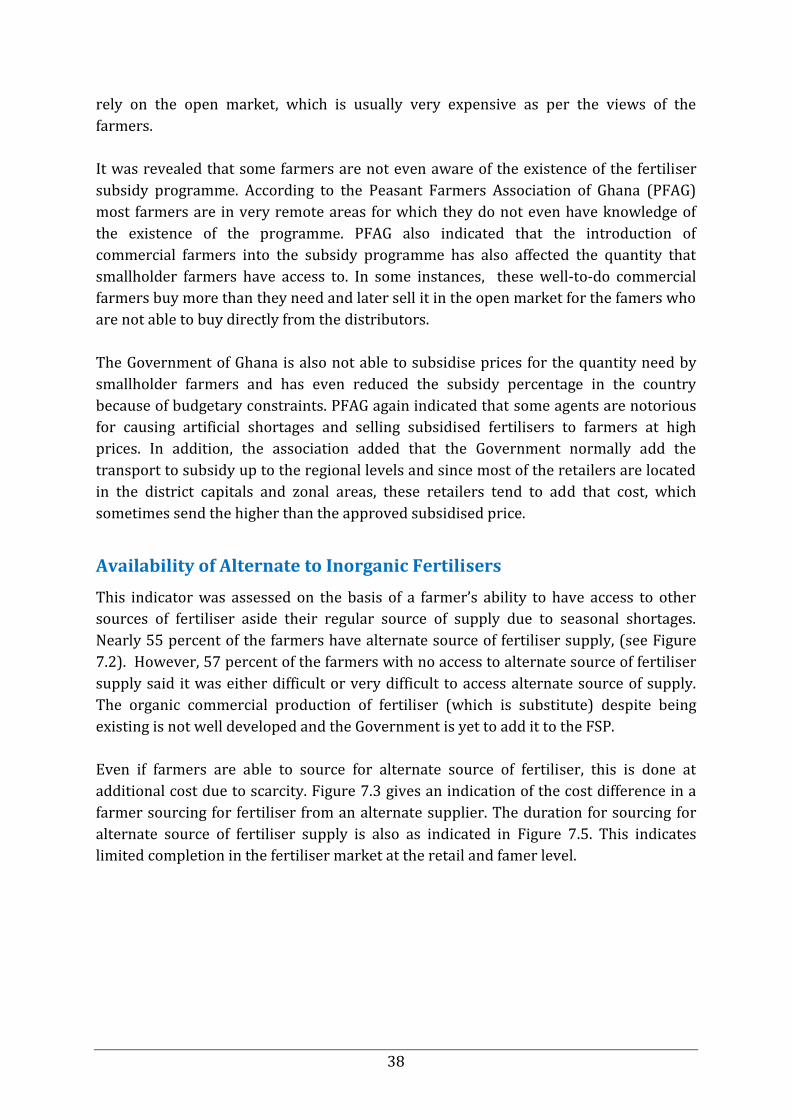
Availability of Alternate to Inorganic Fertilisers
This indicator was assessed on the basis of a farmer’s ability to have access to other
sources of fertiliser aside their regular source of supply due to seasonal shortages.
Nearly 55 percent of the farmers have alternate source of fertiliser supply, (see Figure
7.2). However, 57 percent of the farmers with no access to alternate source of fertiliser
supply said it was either difficult or very difficult to access alternate source of supply.
The organic commercial production of fertiliser (which is substitute) despite being
existing is not well developed and the Government is yet to add it to the FSP.
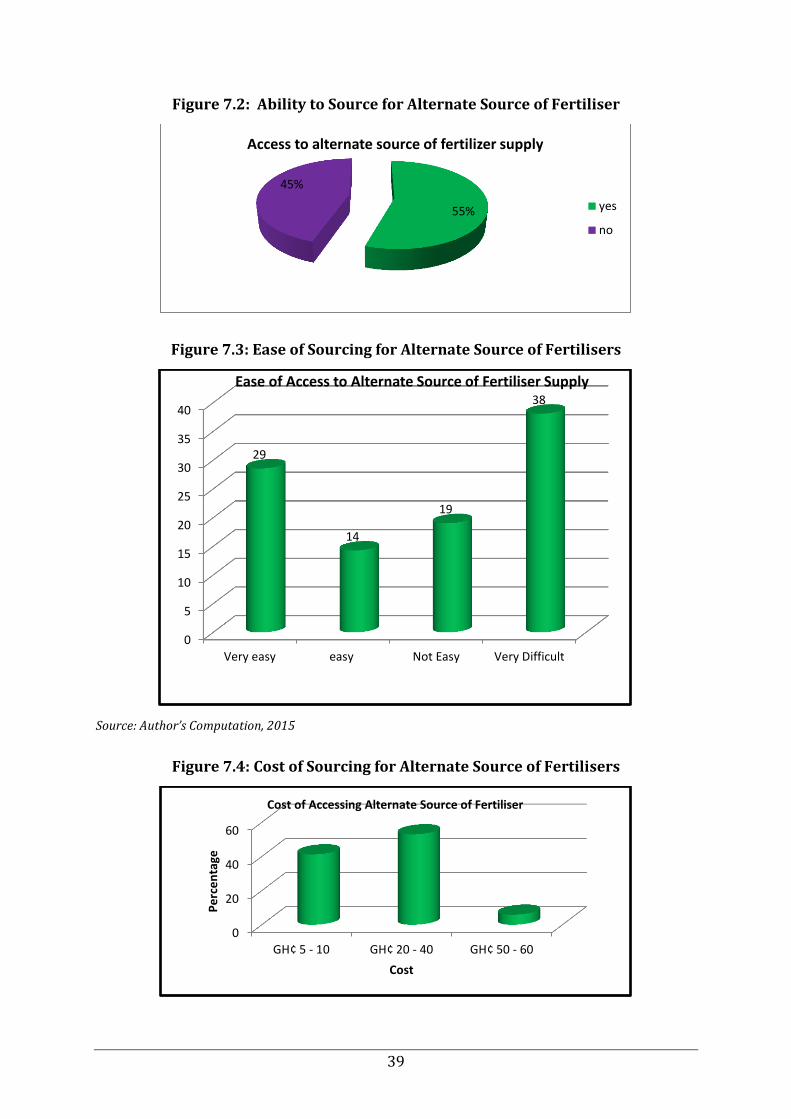
Even if farmers are able to source for alternate source of fertiliser, this is done at
additional cost due to scarcity. Figure 7.3 gives an indication of the cost difference in a
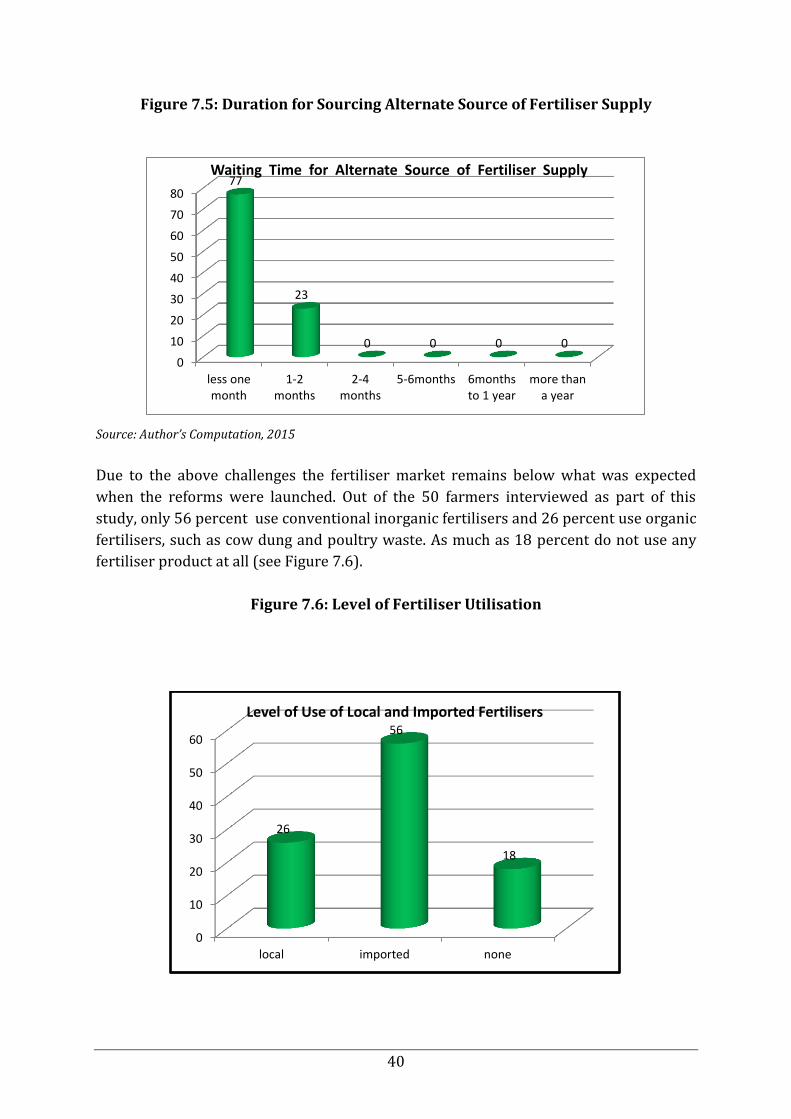
farmer sourcing for fertiliser from an alternate supplier. The duration for sourcing for
alternate source of fertiliser supply is also as indicated in Figure 7.5. This indicates
limited completion in the fertiliser market at the retail and famer level.
39
Figure 7.2: Ability to Source for Alternate Source of Fertiliser
Figure 7.3: Ease of Sourcing for Alternate Source of Fertilisers
Source: Author’s Computation, 2015
Figure 7.4: Cost of Sourcing for Alternate Source of Fertilisers
55%
45%
Access to alternate source of fertilizer supply
yes
no
0
5
10
15
20
25
30
35
40
Very easy easy Not Easy Very Difficult
29
14
19
38
Ease of Access to Alternate Source of Fertiliser Supply
0
20
40
60
GH¢ 5 - 10 GH¢ 20 - 40 GH¢ 50 - 60
Pe
rce
nta
ge
Cost
Cost of Accessing Alternate Source of Fertiliser
40
Figure 7.5: Duration for Sourcing Alternate Source of Fertiliser Supply
Source: Author’s Computation, 2015
Due to the above challenges the fertiliser market remains below what was expected
when the reforms were launched. Out of the 50 farmers interviewed as part of this
study, only 56 percent use conventional inorganic fertilisers and 26 percent use organic
fertilisers, such as cow dung and poultry waste. As much as 18 percent do not use any
fertiliser product at all (see Figure 7.6).
Figure 7.6: Level of Fertiliser Utilisation
0
10
20
30
40
50
60
70
80
less onemonth
1-2months
2-4months
5-6months 6monthsto 1 year
more thana year
77
23
0 0 0 0
Waiting Time for Alternate Source of Fertiliser Supply
0
10
20
30
40
50
60
local imported none
26
56
18
Level of Use of Local and Imported Fertilisers
41
8. Constraints to Competitiveness of
Fertiliser Markets in Ghana
Lack of Market Information and Poor Linkages
Information on sales, inventories, and warehouse conditions is either not available or
incomplete and poorly recorded. There is no systematic collection and dissemination of
local and international market information. Some importers and dealers are not willing
to give out information, while others would quote prices higher than the acquisition
prices.
To be effective, importers and distributors need information about demand, stocks,
supply sources, and prices in the domestic and international markets. The availability
and accessibility of timely market information improve decision-making and induce
greater private investment as transaction costs decline, resulting in net gain to input
suppliers and farmers. The absence of such information imposes on the traders
unwarranted search and transaction costs and often leads to importation of expensive
products.
Similarly, bankers need information about the creditworthiness of potential borrowers.
With limited information, bankers, importers, and distributors must invest in screening
out potential defaulters when extending credit to avoid the problem of adverse
selection, thereby increasing transaction costs. Finally, the lack of information on
requirements from neighbouring countries prevents regional collaboration and
consolidation through major ports to achieve economies of scale and on-shore bagging
of bulk fertilisers (Debrah, 2000).
Limited Marketing Skills of Potential Dealers
Years after the liberalisation of fertiliser marketing, the number of dealers and retail
outlets in the rural areas still remain severely inadequate. Consequently, many farmers
have to travel long distances to obtain supplies. Potential dealers lack the knowledge of
how to effectively reach out to the farmers to sell their products and how to bring
finance into the business through their own arrangements.
They also lack the knowledge for planning and forecasting quantities, timing, and prices
according to the market situation and the needs of the farmers of the area.
Consequently, the rural markets in the business are still undeveloped. The independent
dealer in rural areas is an essential part of the fertiliser marketing and distribution
chain. If properly motivated and trained, this dealer can turn into a very effective agent
of change who can develop the market in the local area. Local fertiliser traders buy and
42
sell fertiliser within the same season or within the same month with limited investment
storage.
Currently, some banks and other financial institutions are showing interest in the
sector. Loan guarantee funds are being designed and implemented, insurance products
are being tested, warehouse receipt system is being developed, and more financial
institutions are becoming members of the credit registry bureau for increased
transparency and information sharing. All of these are steps in the right direction for the
development better financial services for the agriculture sector.
43
9. Conclusion and Recommendations
Conclusion
The findings of the study have indicated that the fertiliser import, marketing and/or
distribution have two systems: Open Market and Fertiliser Subsidy Programme. During
the period of the existence of the subsidy programme, the price to be sold per bag for all
farmers are to be the same across the country with all things being equal. The study,
however, found out that due to challenges faced in implementation of the programme
some farmers buy at higher prices slightly higher than the government approved price.
Among distributors and retailers the system is highly competitive but still developing.
There is real lack of investment capital among these groups.
Some transport unions are involved in price fixing when it comes to the fee to be
charged per bag for transported fertlisers. The unions fix price to be charged per bag of
fertiliser for a particular distance for its members and members are obliged to respect
that. This is anticompetitive and has to be discouraged.
The registration, clearing and port handling procedures are complex and frosted with
many challenges, which make the distribution of fertiliser inefficient and it associated
high cost whether with the open market or the subsidised fertiliser. There are serious
challenges and bureaucratic bottlenecks associated with the clearing procedures, which
do not promote effective competition.
The registration, clearing and port handling procedures are complex and frosted with
many challenges, which increases delays and transaction cost at the port. These costs
are passed on to the cost of the fertiliser whether with the subsidised or the open
market one.
Recommendations
In order to improve the competitiveness of the fertiliser markets for both suppliers and
users there is the need for some fundamental improvements in policy with
considerations for better performance. Improvements in each of these areas will
contribute to improved profitability of fertiliser distribution by reducing input costs,
raising or stabilising producer prices and improving fertiliser use efficiency.
44
Policy Support
Policy Focus on Fertiliser Market at Retail and Farmer Level
Much as there are challenges in the importation of fertiliser, the major constraints in the
industry are at the retail level, which has direct impacts on the ability of the farmer who
is the end user to buy and utilise the product for the expected benefit. Therefore, there
must be policy focus on the individual farmer (either private land owner farmer or
tenant farmer) to address their specific fertiliser market needs. A much higher priority
for agriculture and rural development should be considered in relation to practical
methods of increasing long-term farm productivity, for example, through the
development of new local seed varieties, new higher value crops, improved cultivation
practices and increased and more effective use of fertilisers.
Reducing Bureaucracy and Discretionary Controls
There is the need to reduce the amount of bureaucracy at the import and distributive
stage, especially obtaining permission from the relevant administrative authority for
their operations, port clearing procedures etc. since these stifles active
entrepreneurship except by those businessmen who are well connected or who know
their way round the system.
The private sector is more likely to import and develop retail distribution networks if
government or donor distribution programmes to stimulate fertiliser use are designed
collaboratively with the private sector and in a manner that does not crowd out
existing commercial demand.
The risks of providing credit to retailers should be shared (for example, credit
guarantees) and incentives should be given to domestic companies to import fertiliser
and expand their distribution network closer to the farmers.
Access to credit to retail businesses, should be provided by enacting policies and
programmes in support of micro financial institutions to serve the rural sector in
support of local trade and as an incentive to expand retail businesses and fertiliser
demand in the rural areas.
Macro-Economic Stability
One of the pre-conditions to the successful development of agriculture and the fertiliser
market is general economic stability – steady economic growth, low inflation, stable
foreign exchange rate and there is need for the Government to ensure the attainment of
these factors.

45
The following components are critical:
1. There is need for the Government to provide alternative subsidies and/or investing in
sector like credit subsidy and also consider options to guarantee loans to dealers to
incentivise the use of fertilisers and other inputs
2. The Government should also provide incentives to domestic companies to import
fertilisers and develop private fertilisers distribution systems and
3. The Government should establish supporting policy environments to attract
investments into the local fertiliser production and distribution sectors of the
countries.
Increased Access to Credit and Capital
1. The Government should provide access to credit to retail businesses, and to
producers by enacting policies and programmes in support of micro-financial
institutions to serve the rural sector in support of local trade and as an incentive to
expand retail businesses and fertiliser demand in the remote rural areas.
2. The Government should encourage and extend prudent banking services to rural
areas.
3. Special focus should be on credit for small scale fertiliser retail businesses and small
scale farmers. Credit availability largely dictates the marketing of fertilisers. Most
governments have initiated various programmes and assisted cooperative credit
systems to help meet this need. They have, however, tended to serve the large and
medium-scale farmers, because of the nature of credit procedures and eligibility
requirements. In this way, they have been able to reach only a small proportion of
the small-scale farmers, whose only source of credit would normally be traders or
moneylenders. Evidence from many of these institutions is that loan repayment
rates of as low as 40 percent are quite common.
4. Incentive to savings by the farming population should be provided through
innovative financial instruments (i.e. indexed crop insurance) that will protect their
lending portfolios at the same time that will protect farmers from the main perils
(i.e. drought or excessive rain) adverse effects by credit institutions.
5. Promotion of areas for improvement in provision of agricultural finance services,
which do not necessarily require regulatory changes given as following::
Encouragement of banks and other financial institutions to accept agricultural
equipment and other farm assets as collateral against which loans can be
made. Development of collateral registries is one way to facilitate this
practice.
Development of credit reference bureaus to provide banks with more
information about lending risks. Ideally, such bureaus should be in the private
sector.
Putting in place legal and regulatory frameworks to encourage use of
collateral-based lending and warehouse receipt programmes.
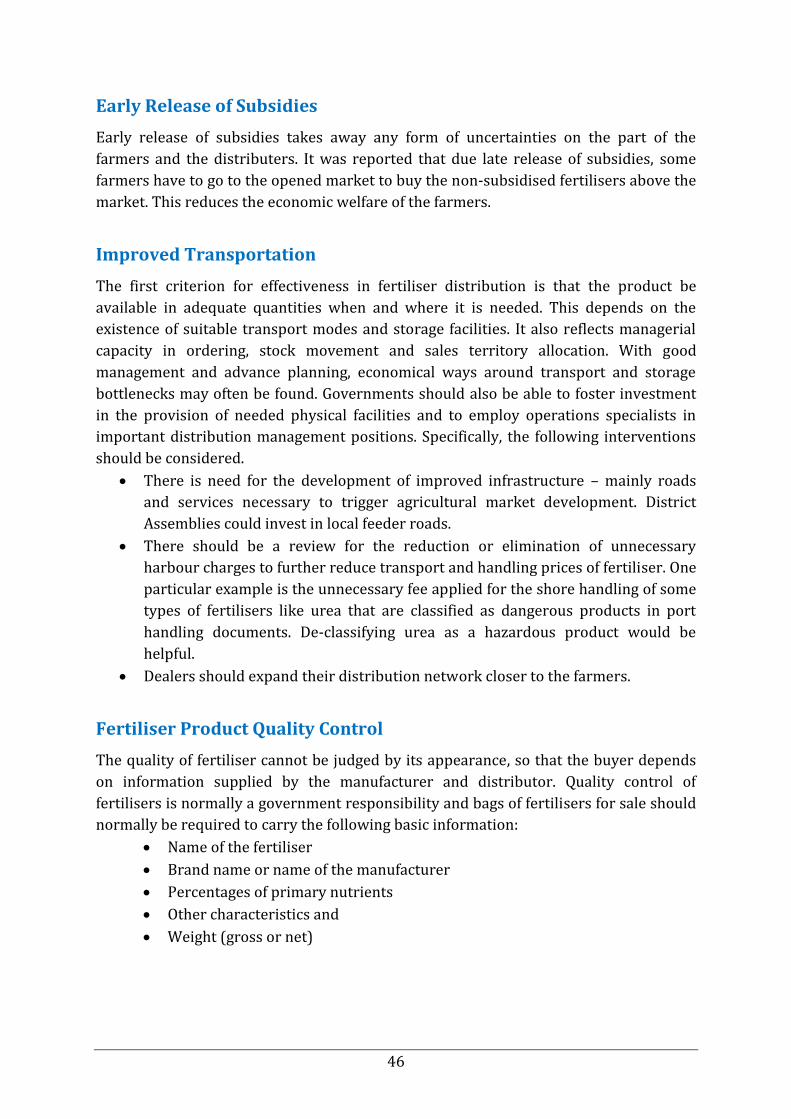
46
Early Release of Subsidies
Early release of subsidies takes away any form of uncertainties on the part of the
farmers and the distributers. It was reported that due late release of subsidies, some
farmers have to go to the opened market to buy the non-subsidised fertilisers above the
market. This reduces the economic welfare of the farmers.
Improved Transportation
The first criterion for effectiveness in fertiliser distribution is that the product be
available in adequate quantities when and where it is needed. This depends on the
existence of suitable transport modes and storage facilities. It also reflects managerial
capacity in ordering, stock movement and sales territory allocation. With good
management and advance planning, economical ways around transport and storage
bottlenecks may often be found. Governments should also be able to foster investment
in the provision of needed physical facilities and to employ operations specialists in
important distribution management positions. Specifically, the following interventions
should be considered.
There is need for the development of improved infrastructure – mainly roads
and services necessary to trigger agricultural market development. District
Assemblies could invest in local feeder roads.
There should be a review for the reduction or elimination of unnecessary
harbour charges to further reduce transport and handling prices of fertiliser. One
particular example is the unnecessary fee applied for the shore handling of some
types of fertilisers like urea that are classified as dangerous products in port
handling documents. De-classifying urea as a hazardous product would be
helpful.
Dealers should expand their distribution network closer to the farmers.
Fertiliser Product Quality Control
The quality of fertiliser cannot be judged by its appearance, so that the buyer depends
on information supplied by the manufacturer and distributor. Quality control of
fertilisers is normally a government responsibility and bags of fertilisers for sale should
normally be required to carry the following basic information:
Name of the fertiliser
Brand name or name of the manufacturer
Percentages of primary nutrients
Other characteristics and
Weight (gross or net)
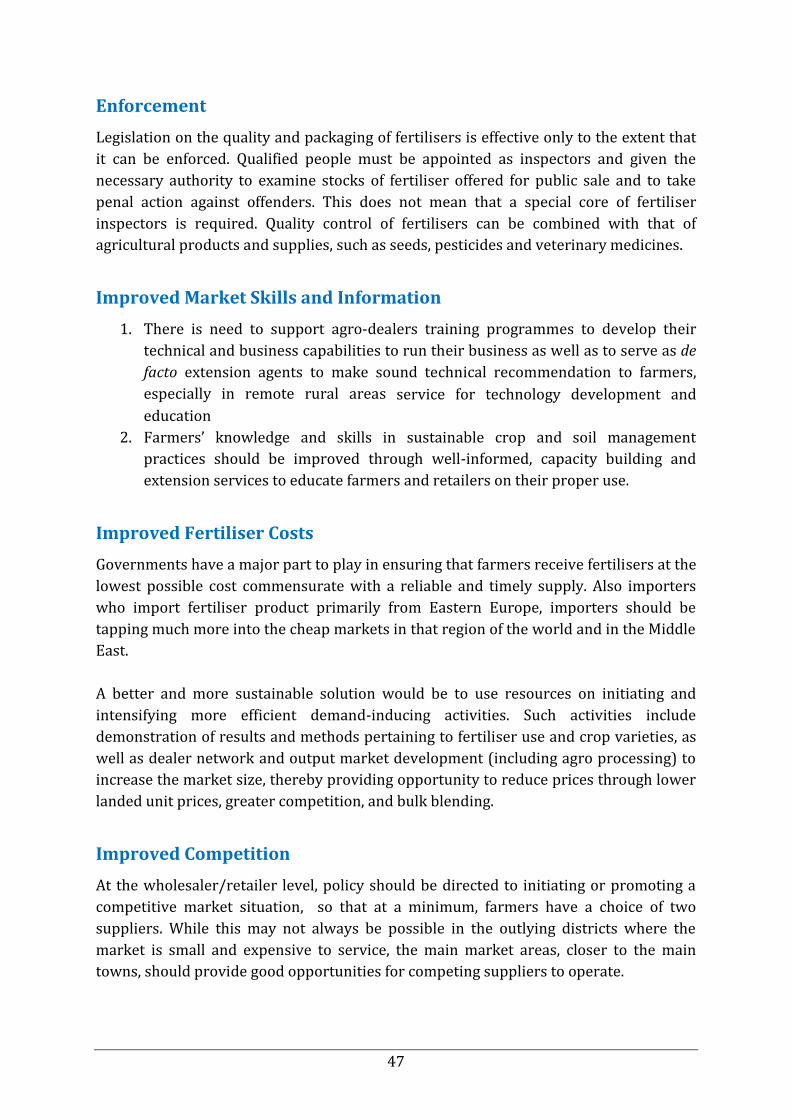
47
Enforcement
Legislation on the quality and packaging of fertilisers is effective only to the extent that
it can be enforced. Qualified people must be appointed as inspectors and given the
necessary authority to examine stocks of fertiliser offered for public sale and to take
penal action against offenders. This does not mean that a special core of fertiliser
inspectors is required. Quality control of fertilisers can be combined with that of
agricultural products and supplies, such as seeds, pesticides and veterinary medicines.
Improved Market Skills and Information
1. There is need to support agro-dealers training programmes to develop their
technical and business capabilities to run their business as well as to serve as de
facto extension agents to make sound technical recommendation to farmers,
especially in remote rural areas service for technology development and
education
2. Farmers’ knowledge and skills in sustainable crop and soil management
practices should be improved through well-informed, capacity building and
extension services to educate farmers and retailers on their proper use.
Improved Fertiliser Costs
Governments have a major part to play in ensuring that farmers receive fertilisers at the
lowest possible cost commensurate with a reliable and timely supply. Also importers
who import fertiliser product primarily from Eastern Europe, importers should be
tapping much more into the cheap markets in that region of the world and in the Middle
East.
A better and more sustainable solution would be to use resources on initiating and
intensifying more efficient demand-inducing activities. Such activities include
demonstration of results and methods pertaining to fertiliser use and crop varieties, as
well as dealer network and output market development (including agro processing) to
increase the market size, thereby providing opportunity to reduce prices through lower
landed unit prices, greater competition, and bulk blending.
Improved Competition
At the wholesaler/retailer level, policy should be directed to initiating or promoting a
competitive market situation, so that at a minimum, farmers have a choice of two
suppliers. While this may not always be possible in the outlying districts where the
market is small and expensive to service, the main market areas, closer to the main
towns, should provide good opportunities for competing suppliers to operate.

48
In order to promote this level of competition, the MoFA can provide a useful service by
gathering and publishing reliable market prices for agricultural commodities and
livestock at various locations around the country. Weekly prices of the main fertilisers
and other inputs should also be published. This information can be circulated by
farmers’ cooperatives and also by radio and television. There should be regular early
morning radio programmes covering topical farming issues and giving the latest market
prices. The following are proposed to address the issues identified in the fertiliser
industry:
Regarding outreach, with the current market size, bulk and joint procurements
offer opportunities for significant reduction in freight costs. In addition, a better
use of existing depots distributed throughout the country can also improve the
development of the retail network. Currently, this valuable infrastructure is not
fully utilised.
Regarding opportunities for the profitability, refining the obsolete fertiliser
recommendations, which for the most part date as far back as 1973, and using
more cost-effective products as discussed earlier are required.
Improving the efficacy of fertiliser use also implies critical improvement in
farmers’ technologies, including greater use of improved seed and integrated soil
fertility management strategies as discussed in the national soil fertility action
plan. In other words, significant research efforts need to be supported at the Soil
Research Institute (SRI), the Crops Research Institute (CRI) and the universities.

49
Table 9.1: Location-wise Unit Cost of Fertilisers
Importer Afcott Yara Chemico Louis Dreyfus
Location Tema Tema Tema Tema
Unit Cost of the following GH¢ GH¢ GH¢ GH¢ Average Price
Minimum Maximum
NPK: 23:10:15/50 kg 100.00 100.00 106.00 97.00 100.75 97.00 106.00
NPK: 15:15:15/50 kg 98.00 94.00 98.00 96.00 96.50 94.00 98.00
Urea/50 Kg 91.00 85.00 88.00 90.00 88.50 85.00 91.00
Sulphate of Amonnia/25 kg 75.00 63.00 75.00 66.00 69.75 63.00 75.00
Potassium Nitrate/25 kg 142.00 140.00 145.00 145.00 143.00 140.00 145.00
Sulphate of Potash/25 kg 100.00 100.00 102.00 100.00 100.50 100.00 102.00
Wholesaler Aglow Agric
Pure and Perfect
Ventures
Greenshield Agrochemicals
OKLE Farms
NAPFARM
Location Accra Tema Ho Ashaiman Somanya Road
Unit cost of the following GH¢ GH¢ GH¢ GH¢ GH¢ Average Price
Minimum Maximum
NPK: 23:10:15/50 kg 111.00 110.00 112.00 110.00 111.00 110.80 110.00 112.00
NPK: 15:15:15/50 kg 111.00 110.00 112.00 110.00 111.00 110.80 110.00 112.00
Urea/50 kg 104.00 105.00 105.00 102.00 103.00 103.80 102.00 105.00
Sulphate of Amonnia/50 kg 87.00 86.00 90.00 90.00 85.00 87.60 85.00 90.00
Potassium Nitrate/25 kg 160.00 160.00 163.00 161.00 162.00 161.20 160.00 163.00
Sulphate of Potash/25 kg 112.00 110.00 111.00 110.00 112.00 111.00 110.00 112.00
Similarly, the practice of soil testing for site-specific recommendations needs to be
promoted. The need for such initiatives was clearly recognised in Medium Term
Agricultural Development Programme (MTADP) and Accelerated Agricultural Growth
and Development Strategy (AAGDS) that have guided government policies and
programmes for triggering a demand-led growth of the agricultural sector since the
structural adjustment programme was launched. The national soil fertility management
action plan that has specific activities to tackle soil-related problems is yet to be
implemented.
Improved Fertiliser Crop Price Ratios
There is need for farmers and input dealers for better use of fertiliser as a productive
resource through agricultural research, particularly into new, more productive seed
varieties and more productive cultivation practices given local conditions.
Invest in Upgrading Public Infrastructure
The will include improvement in physical facilities, such as improved port facilities.
Government should invest in port improvement facilities to reduce further the port cost
by making them more agile and efficient.
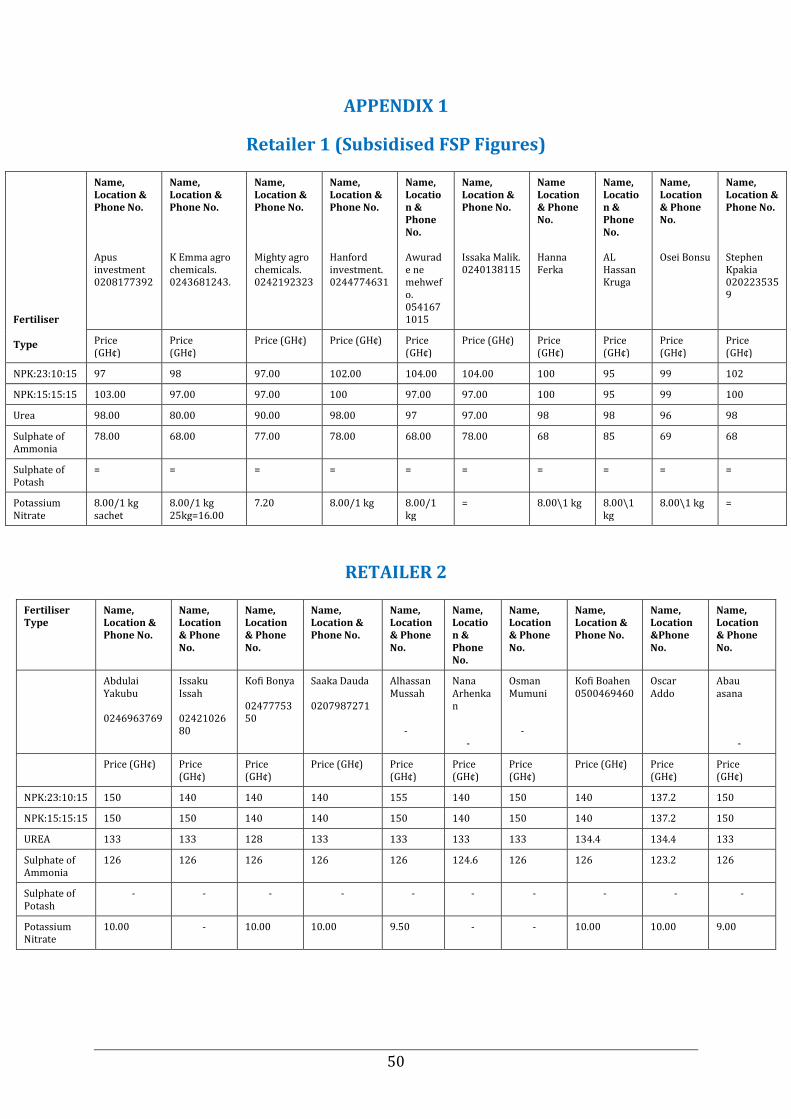
50
APPENDIX 1
Retailer 1 (Subsidised FSP Figures)
Fertiliser Type
Name, Location & Phone No. Apus investment 0208177392
Name, Location & Phone No. K Emma agro chemicals. 0243681243.
Name, Location & Phone No. Mighty agro chemicals. 0242192323
Name, Location & Phone No. Hanford investment. 0244774631
Name, Location & Phone No. Awurade ne mehwefo. 0541671015
Name, Location & Phone No. Issaka Malik. 0240138115
Name Location & Phone No. Hanna Ferka
Name, Location & Phone No. AL Hassan Kruga
Name, Location & Phone No. Osei Bonsu
Name, Location & Phone No. Stephen Kpakia 0202235359
Price (GH¢)
Price (GH¢)
Price (GH¢) Price (GH¢) Price (GH¢)
Price (GH¢) Price (GH¢)
Price (GH¢)
Price (GH¢)
Price (GH¢)
NPK:23:10:15 97 98 97.00 102.00 104.00 104.00 100 95 99 102
NPK:15:15:15 103.00 97.00 97.00 100 97.00 97.00 100 95 99 100
Urea 98.00 80.00 90.00 98.00 97 97.00 98 98 96 98
Sulphate of Ammonia
78.00 68.00 77.00 78.00 68.00 78.00 68 85 69 68
Sulphate of Potash
= = = = = = = = = =
Potassium Nitrate
8.00/1 kg sachet
8.00/1 kg 25kg=16.00
7.20 8.00/1 kg 8.00/1 kg
= 8.00\1 kg 8.00\1 kg
8.00\1 kg =
RETAILER 2
Fertiliser Type
Name, Location & Phone No.
Name, Location & Phone No.
Name, Location & Phone No.
Name, Location & Phone No.
Name, Location & Phone No.
Name, Location & Phone No.
Name, Location & Phone No.
Name, Location & Phone No.
Name, Location &Phone No.
Name, Location & Phone No.
Abdulai Yakubu 0246963769
Issaku Issah 0242102680
Kofi Bonya 0247775350
Saaka Dauda 0207987271
Alhassan Mussah -
Nana Arhenkan -
Osman Mumuni -
Kofi Boahen 0500469460
Oscar Addo
Abau asana -
Price (GH¢) Price (GH¢)
Price (GH¢)
Price (GH¢) Price (GH¢)
Price (GH¢)
Price (GH¢)
Price (GH¢) Price (GH¢)
Price (GH¢)
NPK:23:10:15 150 140 140 140 155 140 150 140 137.2 150
NPK:15:15:15 150 150 140 140 150 140 150 140 137.2 150
UREA 133 133 128 133 133 133 133 134.4 134.4 133
Sulphate of Ammonia
126 126 126 126 126 124.6 126 126 123.2 126
Sulphate of Potash
- - - - - - - - - -
Potassium Nitrate
10.00 - 10.00 10.00 9.50 - - 10.00 10.00 9.00

51