Embed Size (px)
Citation preview
American International Journal of Contemporary Research Vol. 2 No. 8; August 2012
69
Exploring Technical Knowledge, Perceived Risk and the Innovative Characteristics
in the Adoption of Mobile Marketing
Geoffrey Harvey Tanakinjal
Labuan School of International Business and Finance
Universiti Malaysia Sabah, Labuan International Campus
Malaysia
Abstract
Understanding the adoption process of an innovation is very important for acceptance of the new idea. This paper
explores the relationship between technical knowledge, perceived risk and the innovation characteristics for the
adoption of mobile marketing. Data from 444 respondents collected through self-administered questionnaire were
used to test the proposed model using SEM. Based on the results, technical knowledge was found to not influence
perceived risk. However, perceived risk is significant to all innovation characteristics. A key finding in this
research is that not all innovation characteristics (i.e. relative advantage and complexity) can be used to form a
favourable or unfavourable attitude towards the innovation.
Keywords: Mobile marketing, perceived risk, technical knowledge, innovation characteristics, adoption process.
1. Introduction
The evolution of electronic commerce (e-commerce) also has brought with it a new marketing channel known as
mobile marketing (m-marketing). According to Leppäniemi (2006, p.10), “mobile marketing is the use of the
mobile medium as a means of marketing communications”. Companies are constantly looking for ways and
means to expand or maintain their market share. According to Pousttchi (2006), marketing experts consider the
mobile device as an extremely promising marketing tool to overcome major challenges in getting time and
attention from consumers. It also provides opportunities to target messages at customers in much better ways than
the present mass media (Barwise & Strong, 2002). The importance of mobile phones to end user has certainly
been recognised by marketers who view this as a communication channel with huge potential (Kavassalis et al.,
2003; Norris, 2007; Nysveen, Pedersen, & Thorbjørnsen, 2005).
Although high mobile phone penetration rates do not necessarily mean high mobile marketing use, the potential of
communicating marketing messages through mobile phones does exist. For example, in Malaysia, although the
penetration rate of mobile phones in 2008 was 93.9 per cent (26,126,000 users) (MCMC, 2008), only 7 per cent of
mobile phone subscribers registered for mobile banking services and 13.7 per cent accessed the Internet through
their mobile phones (MCMC, 2007). According to Marriott (2007), based on a research by the Mobile Marketing
Association (MMA) in December 2006, the overall consumer attitudes toward mobile marketing trended down
with 21 per cent reporting consumers are highly or moderately interested in mobile marketing as compared to 25
per cent in 2005. The major contribution of this paper provides discussion for the innovation-diffusion theory
(IDT) and acknowledges the innovative characteristics deemed important in diffusion research. The innovative
characteristics in Rogers’ (2003) Diffusion of Innovation (DoI) Theory have been used extensively to explain
adoption intention and acceptance of mobile marketing in previous studies, but this paper looks at the adoption
process from the perspective of technical knowledge, perceived risk and the innovative characteristics in forming
favourable or unfavourable attitude towards mobile marketing in the decision stage.
2. Literature review
Statistically, the mobile marketing industry grew from US$4 billion to US$16 billion from 2003 to 2005, serving
over 500 million users world-wide (Carroll, Barnes, Scornavacca, & and Fletcher, 2007). The downside of this
high mobile phone penetration rate is accompanied by high unwanted text messaging or unsolicited Short
Message Service (SMS) growing by 21.3 per cent per year in the European Union (_, 2008) alone.
© Centre for Promoting Ideas, USA www.aijcrnet.com
70
In Malaysia, a total of 51.3 per cent of mobile phone users received unsolicited SMS with 6.4 per cent of users
receiving more than 10 SMSes in a week, while 44.9 per cent receiving between one to ten per week in 2007
(MCMC, 2007). However, despite the increasing number of companies investing in mobile marketing
campaigns, there is, as yet, little academic research on mobile marketing and the implications of using this
channel for marketing purposes are not understood fully (H. H. Bauer, Reichardt, Barnes, & Neumann, 2005).
Mobile spam (i.e. unsolicited SMS messages) raises privacy concern related to the utilisation of the personal and
location data used to personalise mobile marketing messages (Leppäniemi et al., 2006). Consumers may be
reluctant to trust the innovation as a marketing communication channel because they perceived risk regarding the
safety of their personal data and privacy.
Privacy issues are particularly sensitive with respect to mobile marketing due to the intimate nature of mobile
devices (Brown, 2006). Besides worries of intrusion into one’s private space, mobile spam raises privacy
concerns related to the utilisation of the personal and location data used to personalise mobile marketing messages
(Leppäniemi et al., 2006). Banerjjee (2008) also reported that mobile phones are poised to develop relationship-
marketing in consumers’ lives, offering mass produced products and services on a customised level. However,
studies that look at the use of mobile marketing tend to ignore the adoption process of mobile marketing.
Researchers have investigated the adoption of innovation process in a variety of context for over four decades.
One model used to explain adoption of technology was Rogers’ (1983) innovation-decision process model. But
researchers have tended to focus on some aspects of the full model (e.g. perceived innovation characteristics in
the persuasion stage). The persuasion stage is based on the perceived characteristics of the innovator (i.e. relative
advantage, compatibility, complexity, trialability and observability). Past research only concentrated on the
innovation characteristics stage of the Rogers’ modal (Nysveen et al., 2005; Wu & Wang, 2005) which may lead
to the intention to adopt mobile marketing. However, to date the Rogers’ (1983) full innovation-decision process
model has not been used to understand the adoption process of mobile marketing. Adoption process is defined as
“the mental process through which an individual passes from first learning about an innovation to final adoption”
(Amstrong & Kotler, 2009, p.148).
3. Research model and hypotheses
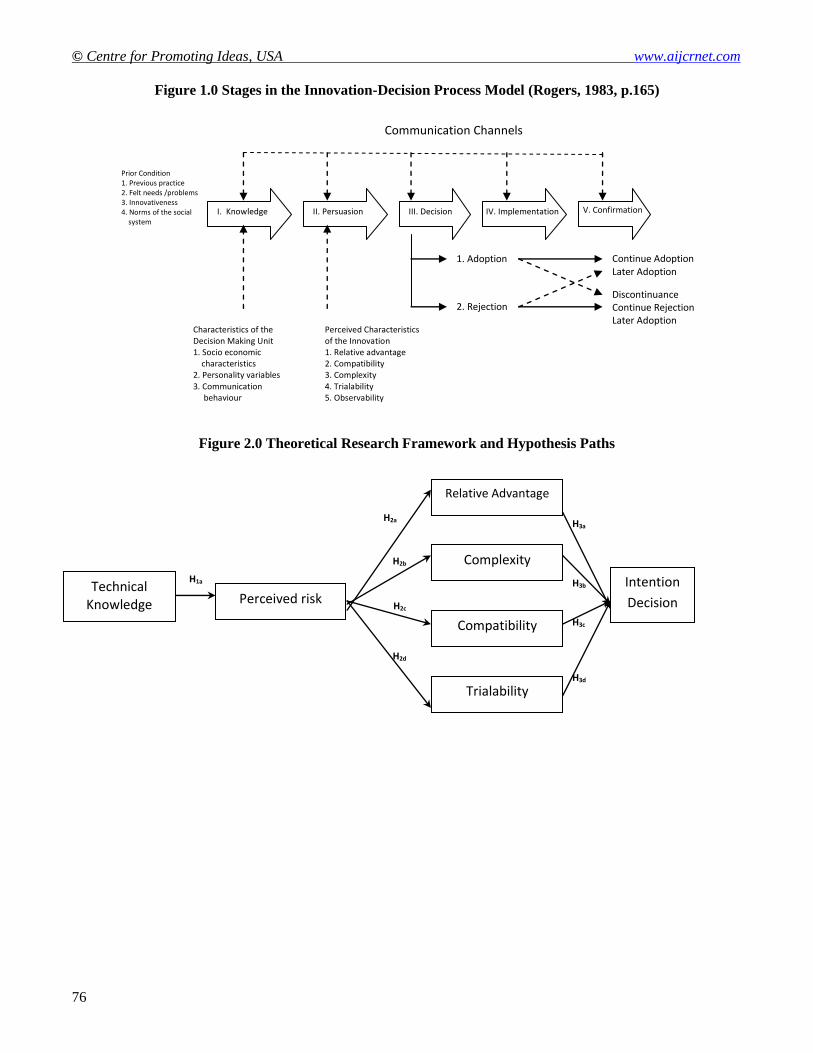
The seminal model used to understand the adoption process is the innovation-decision process model (Rogers,
1983). The innovation-decision process model is a hierarchy of effects type model posited by Rogers (1983) to
explain the stages that consumers go through when adopting an innovation (see Figure 1.0). Knowledge occurs
when an individual is exposed to the innovation’s existence and gains some understanding of how it functions.
Persuasion occurs when an individual forms a favourable or unfavourable attitude towards the innovation.
Decision occurs when an individual engages in the activities that lead to a choice to adopt or reject the innovation.
Implementation occurs when an individual puts an innovation into use and Confirmation occurs when an
individual seeks reinforcement of an innovation-decision already made, but he or she may reverse this previous
decision if exposed to conflicting messages about the innovation.
However, there are some weaknesses in the Rogers (1983) innovation-decision process model, though. In
particular, it does not include privacy, and security issues which may be crucial in the adoption process of mobile
marketing contexts. Mobile marketing is well suited to enhancing time and place benefits in customers’ service
experiences. If customers can also be encouraged to co-create value, then the third dimension of marketing value
– possession – could also be enhanced. However, the diffusion of mobile marketing innovations will be stymied
unless concerns about privacy and security are assuaged. Hence, there is a need to conduct further research into
the role of consumers’ perceived risk in influencing the formation of favourable or unfavourable attitude toward
the innovation. This paper will only look at the innovation-decision process model from the knowledge stage –
perceived risk – persuasion stage and decision stage (see Figure 2.0).
3.1 Technical knowledge
Knowledge will be represented by existing technical knowledge the consumer has regarding mobile phones
experience which determines his ability to understand the features and usage the innovation (mobile marketing
services).
American International Journal of Contemporary Research Vol. 2 No. 8; August 2012
71
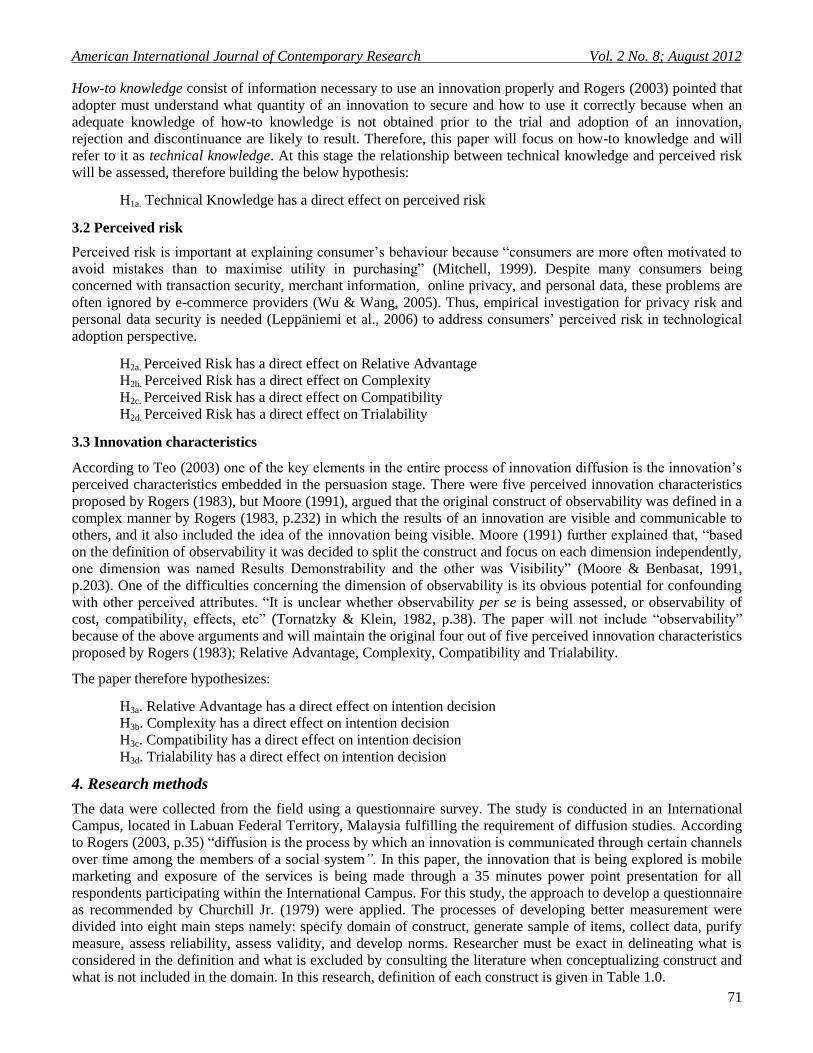
How-to knowledge consist of information necessary to use an innovation properly and Rogers (2003) pointed that
adopter must understand what quantity of an innovation to secure and how to use it correctly because when an
adequate knowledge of how-to knowledge is not obtained prior to the trial and adoption of an innovation,
rejection and discontinuance are likely to result. Therefore, this paper will focus on how-to knowledge and will
refer to it as technical knowledge. At this stage the relationship between technical knowledge and perceived risk
will be assessed, therefore building the below hypothesis:
H1a. Technical Knowledge has a direct effect on perceived risk
3.2 Perceived risk
Perceived risk is important at explaining consumer’s behaviour because “consumers are more often motivated to
avoid mistakes than to maximise utility in purchasing” (Mitchell, 1999). Despite many consumers being
concerned with transaction security, merchant information, online privacy, and personal data, these problems are
often ignored by e-commerce providers (Wu & Wang, 2005). Thus, empirical investigation for privacy risk and
personal data security is needed (Leppäniemi et al., 2006) to address consumers’ perceived risk in technological
adoption perspective.
H2a. Perceived Risk has a direct effect on Relative Advantage
H2b. Perceived Risk has a direct effect on Complexity
H2c. Perceived Risk has a direct effect on Compatibility
H2d. Perceived Risk has a direct effect on Trialability
3.3 Innovation characteristics
According to Teo (2003) one of the key elements in the entire process of innovation diffusion is the innovation’s
perceived characteristics embedded in the persuasion stage. There were five perceived innovation characteristics
proposed by Rogers (1983), but Moore (1991), argued that the original construct of observability was defined in a
complex manner by Rogers (1983, p.232) in which the results of an innovation are visible and communicable to
others, and it also included the idea of the innovation being visible. Moore (1991) further explained that, “based
on the definition of observability it was decided to split the construct and focus on each dimension independently,
one dimension was named Results Demonstrability and the other was Visibility” (Moore & Benbasat, 1991,
p.203). One of the difficulties concerning the dimension of observability is its obvious potential for confounding
with other perceived attributes. “It is unclear whether observability per se is being assessed, or observability of
cost, compatibility, effects, etc” (Tornatzky & Klein, 1982, p.38). The paper will not include “observability”
because of the above arguments and will maintain the original four out of five perceived innovation characteristics
proposed by Rogers (1983); Relative Advantage, Complexity, Compatibility and Trialability.
The paper therefore hypothesizes:
H3a. Relative Advantage has a direct effect on intention decision
H3b. Complexity has a direct effect on intention decision
H3c. Compatibility has a direct effect on intention decision
H3d. Trialability has a direct effect on intention decision
4. Research methods
The data were collected from the field using a questionnaire survey. The study is conducted in an International
Campus, located in Labuan Federal Territory, Malaysia fulfilling the requirement of diffusion studies. According
to Rogers (2003, p.35) “diffusion is the process by which an innovation is communicated through certain channels
over time among the members of a social system”. In this paper, the innovation that is being explored is mobile
marketing and exposure of the services is being made through a 35 minutes power point presentation for all
respondents participating within the International Campus. For this study, the approach to develop a questionnaire
as recommended by Churchill Jr. (1979) were applied. The processes of developing better measurement were
divided into eight main steps namely: specify domain of construct, generate sample of items, collect data, purify
measure, assess reliability, assess validity, and develop norms. Researcher must be exact in delineating what is
considered in the definition and what is excluded by consulting the literature when conceptualizing construct and
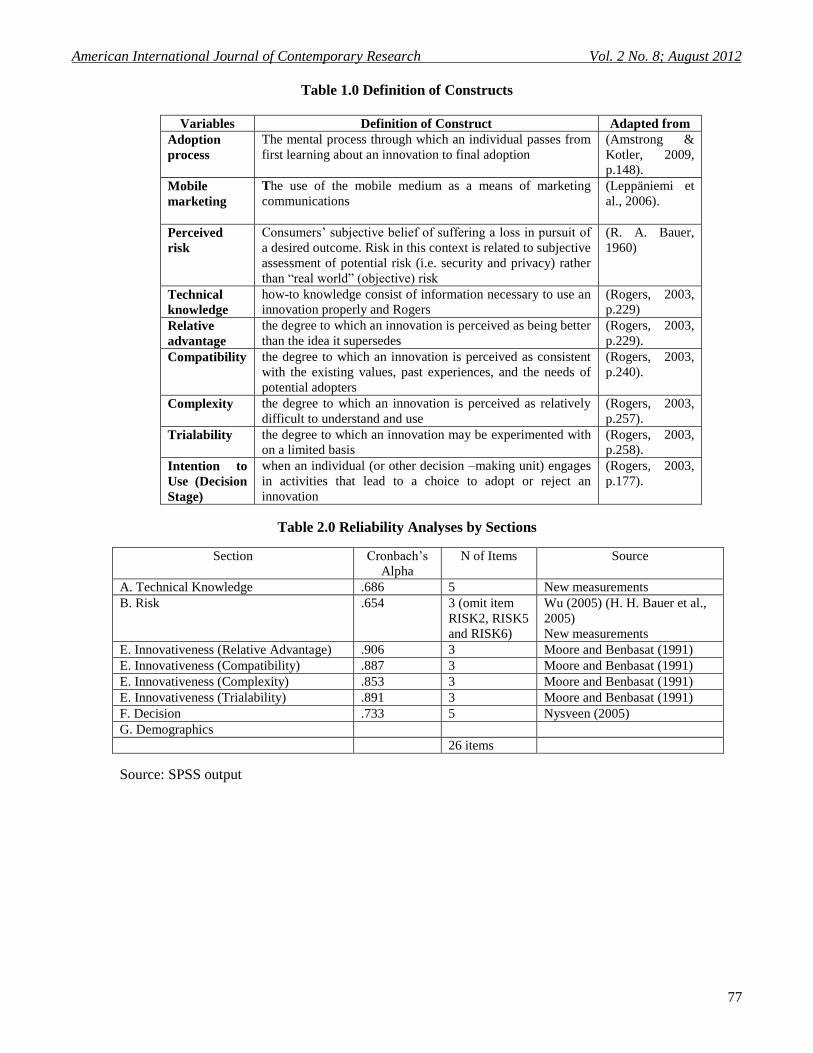
what is not included in the domain. In this research, definition of each construct is given in Table 1.0.
© Centre for Promoting Ideas, USA www.aijcrnet.com
72
4.1 Generate sample of items
To generate sample items for the questionnaire, five main articles were used to complement the present study
namely Nysveen (2005) (Decision Intention), Wu (2005) (Perceived Risk), Karahanna (1999) and Moore and
Benbasat (1991) (Relative Advantage, Compatibility, Complexity and Trialability). New item measures based on
previous literature (Technical Knowledge and Perceived risk) were also incorporated in the research to fulfil the
research requirements of the model. The questionnaire was later pre-tested using Malaysian post-graduate
candidates throughout New Zealand, United Kingdom and Malaysia. Participants were asked to comment on the
language used, translation and the relevance of the questions in the questionnaire apart from filling the
questionnaire. Based on their feedback some changes were made on the translation and in relation to using simple
instruction in each of the sub-headings to help respondents to easily understand the requirements of the
questionnaire.
4.2 Pilot Testing
Following Churchill Jr’s (1979) recommendation, to further test the questionnaire empirically, a pilot test was
conducted within the targeted population (Labuan International Campus). A total of 87 respondents participated in
the pilot testing and 61 questionnaires were returned but only 58 questionnaires were usable for the pilot testing.
Based on the pilot testing several items were removed from the questionnaire to improve the reliability score. For
early stages of basic research, Nunnally (1967) suggests reliabilities of .50 to .60 would be suffice and that
increasing reliabilities beyond .80 is probably wasteful. The reliability for each construct ranging between
Cronbach’s Alpha value of .633 to .906 fulfilling the recommendation from Nunnally (1967) reliabilities of .50
to .60 would be suffice (refer to Table 2.0) for basic research.
4.3 Data Collection
A total of 785 questionnaires were distributed and 500 questionnaires were returned, but only 444 questionnaires
were usable. For potential respondents who want to undergo the trial for mobile marketing, a token of RM 5.00
was given to each respondent via a class representative. A trial period of one-week was given to all potential
adopters and completed questionnaire were collected after the trial period.
4.4 Statistical analysis
All data analysis was conducted using SPSS v.15 and AMOS 7. A descriptive analysis will be used to portray a
general picture of the survey respondents. Two main type of statistical analysis used in this research were Factor
Analysis Method and Structural Equation Modelling (SEM). There are two discrete classes of factor analysis:
exploratory factor analysis (EFA) and confirmatory factor analysis (CFA) (Gorsuch, 1983). To explore data
patterns, an Exploratory Factor Analysis (EFA) is used to reveal patterns among the inter-relationships of the
items. Exploratory factor analysis (EFA) begins with no explicit model (Hoyle, 1995). In EFA researcher may not
have any specific expectations regarding the number or the nature of underlying constructs or factors (Thompson,
2004). The major goal of an EFA is to extract the minimum number of factors needed to reproduce the variation
present in a set of observed variables (Heck, 1998). According to Coughlin (2007) statistician advocates for a
different extraction method for EFA other than Principle Component (PC) method and suggested Principle Axis
Factoring (PAF) as the appropriate method of extraction using Exploratory Factor Analysis.
According to Thompson (2004, p.6) “confirmatory factor analysis requires researcher to have specific
expectations regarding (a) the number of factors, (b) which variables reflect given factors, and (c) whether the
factors are correlated”. This means that CFA explicitly and directly tests the fit of factor models. Heck (1998) also
mentioned that CFA begins with the researcher specifying the set of relationships in the model such as the number
of common factors, the factors which the observed variables are to be associated, the relationship among unique
factors and observe variables. The exercise of model specification is central in SEM and no analysis can take
place until the researcher has specified a model of the relations among the variable to be analyzed (Hoyle, 1995).
CFA requires a proposed theoretical model that the researcher must specify prior to actually testing it with the
data (Heck, 1998). The most common model-fitting procedure is maximum likelihood estimation and if the data
seriously lack multivariate normality, asymptotically distribution free estimation is recommended (Coughlin &
Knight, 2007).
American International Journal of Contemporary Research Vol. 2 No. 8; August 2012
73
5. Results
Majority of the respondent were in the 18 – 23 age group (81.5%) and 66.7 percent (296 respondents) were
female as compared to 33.3 percent (148 respondents) male respondents. 348 respondents (78.4%) indicated their
monthly budget for mobile phone bills were between RM 50 – RM 100. A total of 185 respondents (41.7%)
indicated they would be willing to accept mobile marketing messages in exchange of free mobile phone calls and
the three highest ranked reasons for having a mobile phone were; Convenient Device, Keeping in Touch and
Basic Needs. Majority of the respondent (71.6%) stated the average use of SMS/MMS per day were less than 50
and 431 respondents (97.1%) needs SMS/MMS features in their mobile phone. In terms of communication
channels that influence respondents’ opinion about mobile phone technology, 28.4 percent (126 respondents)
indicated their friends as the main influence, and 23.9 percent respectively for influence coming from the Internet
and Television.
5.1 Exploratory Factor Analysis (EFA)
Kaiser-Meyer-Olkin (KMO) measure of sampling adequacy generally indicates whether the variables can be
grouped into a smaller set of underlying factors. High values (close to 1.0) generally indicate that a factor analysis
may be useful for the data. If the value is less than .50, the results of the factor analysis probably will not be
useful (Coughlin & Knight, 2007). For this paper the KMO measure of sampling adequacy was .889, indicating
the data clearly support the use of factor analysis and suggest that the data may be grouped into a smaller set of
underlying factors. Six major factors were identified representing 60.817 % of total variance explained.
5.2 Confirmatory Factor Analysis (CFA)
In CFA, Thompson (2004, p.6) stated “confirmatory factor analysis requires researcher to have specific
expectations regarding (a) the number of factors, (b) which variables reflect given factors, and (c) whether the
factors are correlated”. This means that CFA explicitly and directly tests the fit of factor models. At this stage, the
number of factors will be fixed as seven, and based on the pervious literature review, “Relative Advantage” and
“Compatibility” will be correlated in the model. Seven factors were identified representing 67.243 % of total
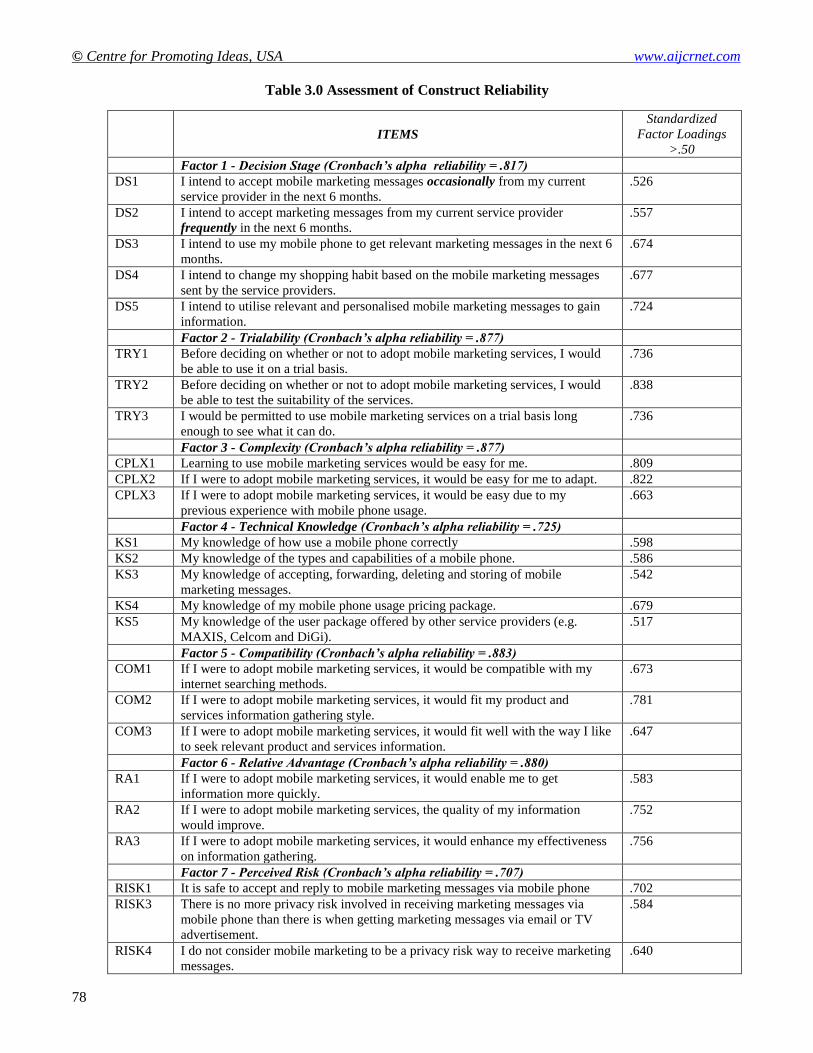
variance explained. The composite reliability evaluates the internal consistency of the measurement model. The
Cronbach alpha measures included in the model ranged from 0.707 to 0.883 (see Table 3.0). All values were
greater than the benchmark of .60 as recommended by Bagozzi (1988). This shows that all constructs had strong
and adequate reliability and discriminate validity.
5.3 Structural Equation Modelling (SEM)
The structural equation modelling (SEM) is to consider the rational and significant relationship between technical
knowledge, perceived risk and innovative characteristics in the innovation decision-process model. “The primary
interest in structural equation modelling is the extent to which a hypothesized model “fits” or, in other words,
adequately describes the sample data” (Byrne, 2001, p.75), which focus on the adequacy of (a) the parameter
estimates and (b) the model as a whole. In the fit of individual parameters in the model, three aspects are
important: (a) the feasibility of the parameter estimates, (b) the appropriateness of standard of errors, and (c) the
statistical significant of the parameter estimates (Byrne, 2001). The test statistic for statistical significance of
parameter estimates is the critical ratio (c.r), which represent the parameter estimate divided by its standard error.
5.4 Goodness-of Fit Statistics
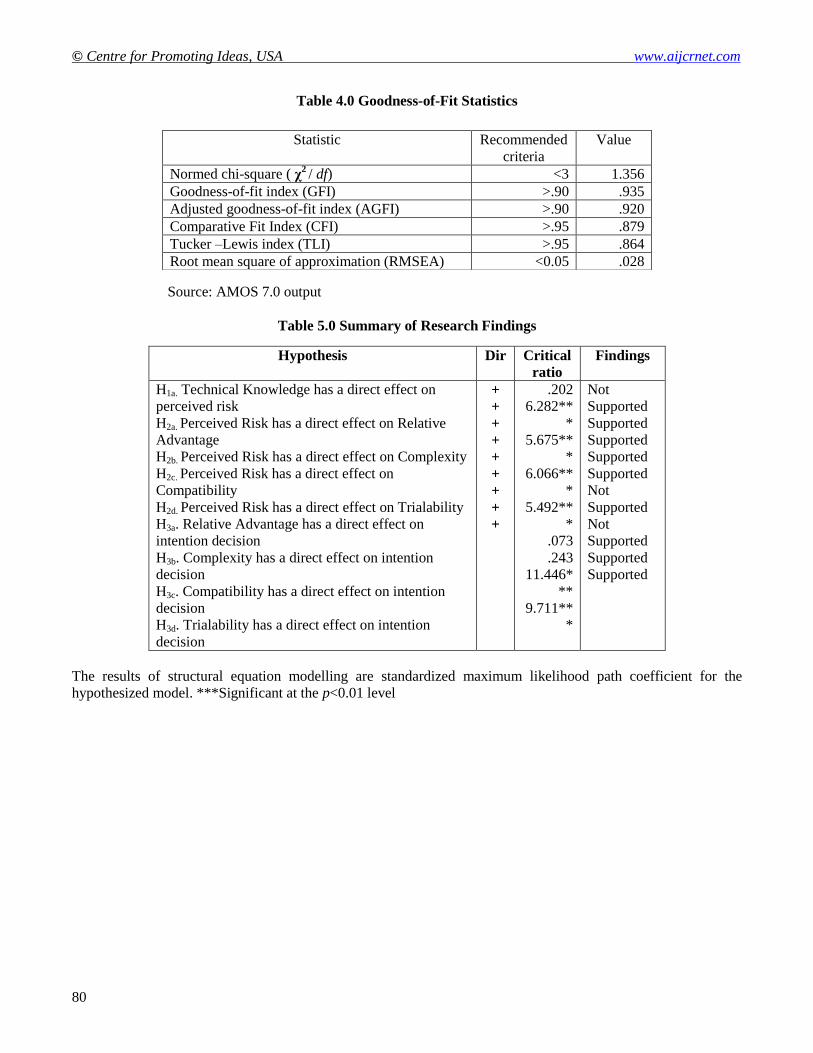
The CFA model provided the above Goodness-of-fit indexes (Table 4.0). Although the RMSEA, GFI and AGFI is
above the cut-off point, two indexes (CFI and TLI) were below the recommended criteria. At best this model may
not fit with the data collected. However, some lessons may be learned from this model. Jöreskog (1993, p.297)
stated, “every correlation between error terms must be justified and interpreted substantively” and Byrne (2001,
p.134) further emphasize, “the decision to reparameterize a model on the basis of MI information must make
sound substantive sense; error covariances are no exception to this edict.” This would mean that it is not
recommended to change a model only based on high correlation value proposed by the MI, leading to over fitting
a model, but a justification of that relationship needs to be upheld. For this paper, the decision to not
reparameterize the model was made because the purpose of this paper is to explore the relationship between
technical knowledge, perceived risk, compatibility, complexity, trialability, relative advantage and decision
intention in the context of mobile marketing.
© Centre for Promoting Ideas, USA www.aijcrnet.com
74
6.0 Discussion
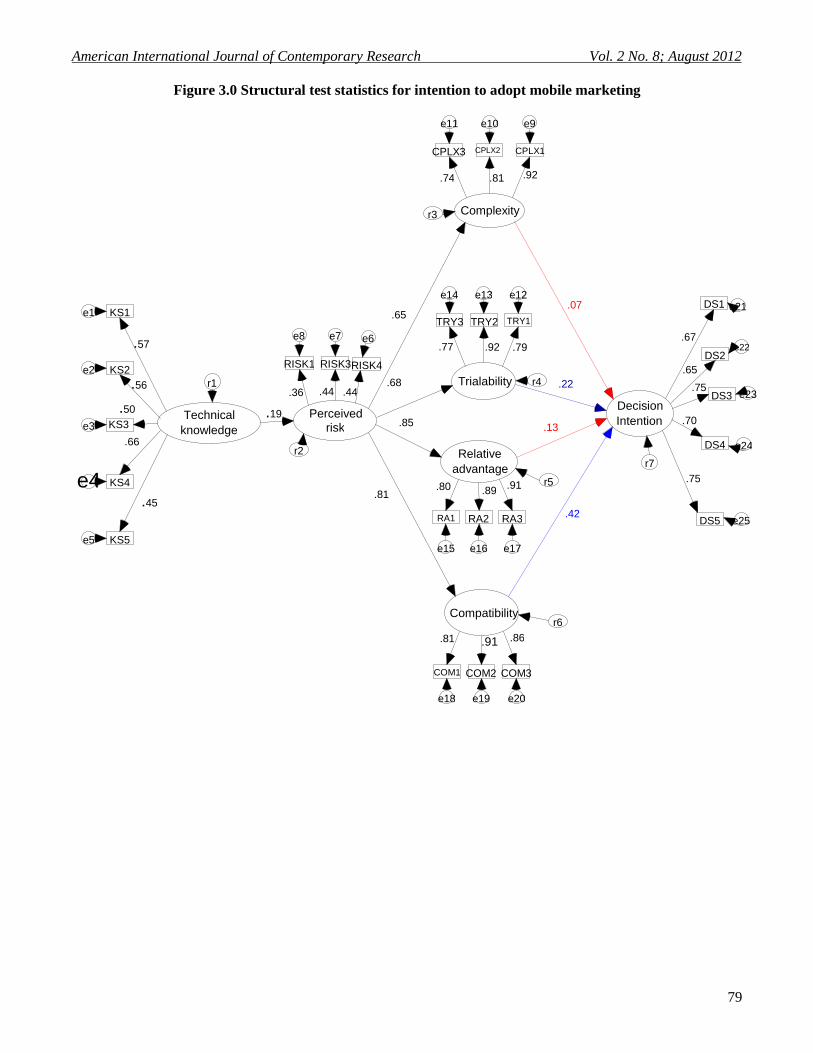
Technical knowledge do not have a significant relationship towards perceived risk (c.r. = .202) therefore do not
supports the first hypothesis H1a. This finding is inconsistent with Wu (2005, p.727) who implied that “consumers
are more aware of the existence of potential risk because they use mobile commerce more and have better
understanding of the mobile commerce context”. The ability to understand and apply complex technical
knowledge is needed to cope with a high degree of uncertainty about an innovation (Rogers, 2003). Perceived risk
in this paper was based on the security and privacy issues from the consumers’ perspective surrounding mobile
marketing. Perceived risk have a positive significant relationship with relative advantage (regression weight =
.85), complexity (regression weight = .65), compatibility (regression weight =.80) and trialability (regression
weight =.68). These results supports hypothesis H2a, H2b, H2c and H2d (Refer to Table 5.0).
The findings were consistent with to Im (2007) who noted that users who perceived a higher risk about adopting
the technology will be affected by how easy it can be used. Although, the risks of discouraging complexity of
innovation are not presence when dealing with psychological measure, the mind can always and easily process
this kind of information (Ulivieri, 2004) through trial of the innovation. Relative advantage and complexity did
not generate significant effect towards decision intention (regression weight of .13 and .07 respectively) hence the
results do not support H3a and H3b. However, compatibility and trialability indicated significant relationship
towards decision intention (regression weight .42 and .22, respectively). The findings supports Rogers’ (2003)
perceived characteristics of innovation attributes where the above two constructs can be used to form a favourable
or unfavourable attitude toward the innovation.
6.1 Conclusion and Recommendation
The paper has led to a discussion of the innovative characteristics in the innovation-decision process model to
understand the adoption process of mobile marketing. The finding thus introduce a cautionary note, that although
the seminal innovation-decision process model by Rogers (2003) can be used in general to understand adoption
process of any innovation in general, the proposed model in this paper only focuses on a single innovation
(mobile marketing) based on a single social society. This paper only looks at the adoption process from technical
knowledge to the decision stage.
The present research was developed to explore m-marketing adoption process and the study only looks into
technical knowledge (how-to-knowledge) and does not include the awareness-knowledge (awareness about the
existence of the innovation) and principle knowledge (information dealing with the functioning principles
underlying how an innovation works) which combined originally represent the knowledge stage in Rogers’ (1983)
Innovation Decision Process Model. Although users of mobile phones are aware of m-marketing through
unsolicited messages received through their mobile phones and it is usually possible to adopt an innovation
without principle–knowledge, but the danger of misusing a new idea is greater and discontinuance may result
(Rogers, 2003). Future research may be conducted by using all three components of the knowledge stage to test
the relationship between the stages in the Innovation Decision Process Model. Future research may also include
mobile devices such as the tablets and mobile gadgets. Second, future research should also include principle-
knowledge and awareness-knowledge in order to explore the ‘knowledge stage’ in an in-depth matter. Awareness
about the innovation (awareness-knowledge) can be seen as a very important component of knowledge is the new
mobile devices are examined in future research. Issues of trust and consumers’ permission in mobile marketing
should also be included for future research.
References
_. (2008). Security risks rise as phones become smarter (Publication. Retrieved 10/02/2009, from AirWide Solution:
http://www.airwidesolutions.com/nov2508.html
Amstrong, G., & Kotler, P. (2009). Marketing: An Introduction (9th ed.). New Jersey: Prentice Hall.
Bagozzi, R., & Yi, Y. (1988). On the evaluation of structural equation models. Journal of the Academy of Marketing Science,
16(1), 74-94.
Banerjjee, S. (2008). Marketing through mobile phone (Publication. Retrieved 12/02/2009, from domain-b.com:
http://www.domain-b.com/brand_dossier/marketing/20080522_mobile_phones.html
Barwise, P., & Strong, C. (2002). Permission-based mobile advertising. Journal of Interactive Marketing, 16(1), 14-24.
American International Journal of Contemporary Research Vol. 2 No. 8; August 2012
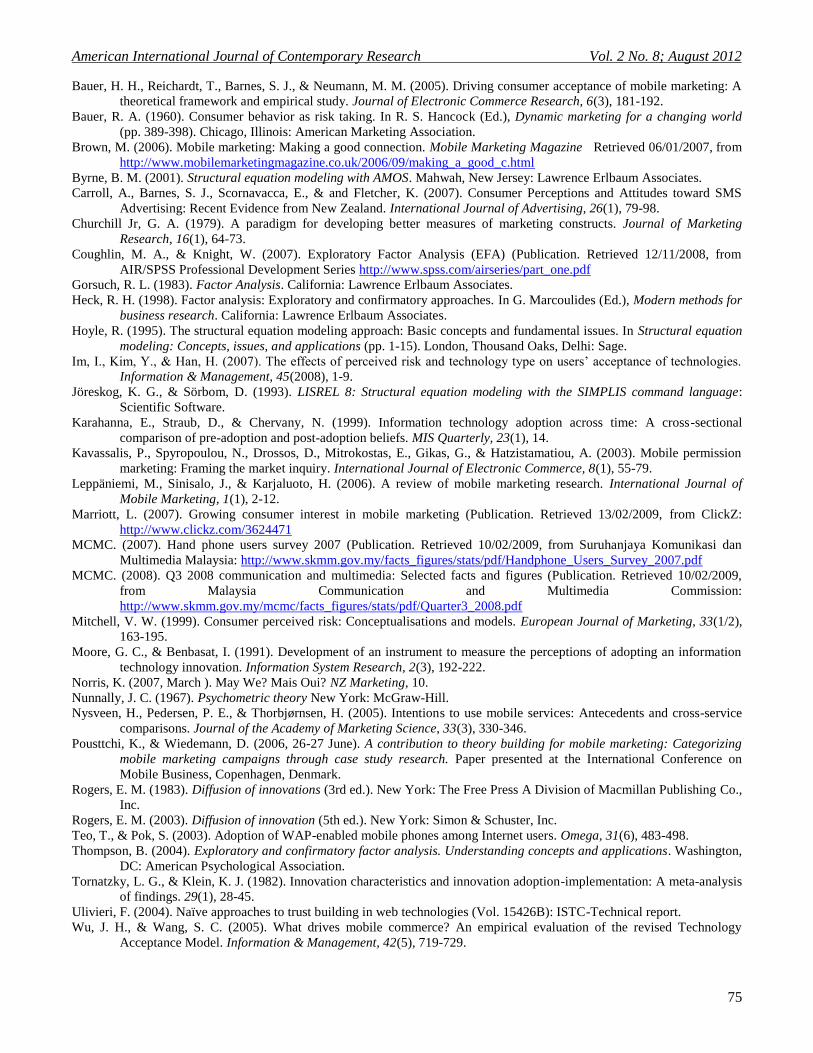
75
Bauer, H. H., Reichardt, T., Barnes, S. J., & Neumann, M. M. (2005). Driving consumer acceptance of mobile marketing: A
theoretical framework and empirical study. Journal of Electronic Commerce Research, 6(3), 181-192.
Bauer, R. A. (1960). Consumer behavior as risk taking. In R. S. Hancock (Ed.), Dynamic marketing for a changing world
(pp. 389-398). Chicago, Illinois: American Marketing Association.
Brown, M. (2006). Mobile marketing: Making a good connection. Mobile Marketing Magazine Retrieved 06/01/2007, from
http://www.mobilemarketingmagazine.co.uk/2006/09/making_a_good_c.html
Byrne, B. M. (2001). Structural equation modeling with AMOS. Mahwah, New Jersey: Lawrence Erlbaum Associates.
Carroll, A., Barnes, S. J., Scornavacca, E., & and Fletcher, K. (2007). Consumer Perceptions and Attitudes toward SMS
Advertising: Recent Evidence from New Zealand. International Journal of Advertising, 26(1), 79-98.
Churchill Jr, G. A. (1979). A paradigm for developing better measures of marketing constructs. Journal of Marketing
Research, 16(1), 64-73.
Coughlin, M. A., & Knight, W. (2007). Exploratory Factor Analysis (EFA) (Publication. Retrieved 12/11/2008, from
AIR/SPSS Professional Development Series http://www.spss.com/airseries/part_one.pdf
Gorsuch, R. L. (1983). Factor Analysis. California: Lawrence Erlbaum Associates.
Heck, R. H. (1998). Factor analysis: Exploratory and confirmatory approaches. In G. Marcoulides (Ed.), Modern methods for
business research. California: Lawrence Erlbaum Associates.
Hoyle, R. (1995). The structural equation modeling approach: Basic concepts and fundamental issues. In Structural equation
modeling: Concepts, issues, and applications (pp. 1-15). London, Thousand Oaks, Delhi: Sage.
Im, I., Kim, Y., & Han, H. (2007). The effects of perceived risk and technology type on users’ acceptance of technologies.
Information & Management, 45(2008), 1-9.
Jöreskog, K. G., & Sörbom, D. (1993). LISREL 8: Structural equation modeling with the SIMPLIS command language:
Scientific Software.
Karahanna, E., Straub, D., & Chervany, N. (1999). Information technology adoption across time: A cross-sectional
comparison of pre-adoption and post-adoption beliefs. MIS Quarterly, 23(1), 14.
Kavassalis, P., Spyropoulou, N., Drossos, D., Mitrokostas, E., Gikas, G., & Hatzistamatiou, A. (2003). Mobile permission
marketing: Framing the market inquiry. International Journal of Electronic Commerce, 8(1), 55-79.
Leppäniemi, M., Sinisalo, J., & Karjaluoto, H. (2006). A review of mobile marketing research. International Journal of
Mobile Marketing, 1(1), 2-12.
Marriott, L. (2007). Growing consumer interest in mobile marketing (Publication. Retrieved 13/02/2009, from ClickZ:
http://www.clickz.com/3624471
MCMC. (2007). Hand phone users survey 2007 (Publication. Retrieved 10/02/2009, from Suruhanjaya Komunikasi dan
Multimedia Malaysia: http://www.skmm.gov.my/facts_figures/stats/pdf/Handphone_Users_Survey_2007.pdf
MCMC. (2008). Q3 2008 communication and multimedia: Selected facts and figures (Publication. Retrieved 10/02/2009,
from Malaysia Communication and Multimedia Commission:
http://www.skmm.gov.my/mcmc/facts_figures/stats/pdf/Quarter3_2008.pdf
Mitchell, V. W. (1999). Consumer perceived risk: Conceptualisations and models. European Journal of Marketing, 33(1/2),
163-195.
Moore, G. C., & Benbasat, I. (1991). Development of an instrument to measure the perceptions of adopting an information
technology innovation. Information System Research, 2(3), 192-222.
Norris, K. (2007, March ). May We? Mais Oui? NZ Marketing, 10.
Nunnally, J. C. (1967). Psychometric theory New York: McGraw-Hill.
Nysveen, H., Pedersen, P. E., & Thorbjørnsen, H. (2005). Intentions to use mobile services: Antecedents and cross-service
comparisons. Journal of the Academy of Marketing Science, 33(3), 330-346.
Pousttchi, K., & Wiedemann, D. (2006, 26-27 June). A contribution to theory building for mobile marketing: Categorizing
mobile marketing campaigns through case study research. Paper presented at the International Conference on
Mobile Business, Copenhagen, Denmark.
Rogers, E. M. (1983). Diffusion of innovations (3rd ed.). New York: The Free Press A Division of Macmillan Publishing Co.,
Inc.
Rogers, E. M. (2003). Diffusion of innovation (5th ed.). New York: Simon & Schuster, Inc.
Teo, T., & Pok, S. (2003). Adoption of WAP-enabled mobile phones among Internet users. Omega, 31(6), 483-498.
Thompson, B. (2004). Exploratory and confirmatory factor analysis. Understanding concepts and applications. Washington,
DC: American Psychological Association.
Tornatzky, L. G., & Klein, K. J. (1982). Innovation characteristics and innovation adoption-implementation: A meta-analysis
of findings. 29(1), 28-45.
Ulivieri, F. (2004). Naïve approaches to trust building in web technologies (Vol. 15426B): ISTC-Technical report.
Wu, J. H., & Wang, S. C. (2005). What drives mobile commerce? An empirical evaluation of the revised Technology
Acceptance Model. Information & Management, 42(5), 719-729.
© Centre for Promoting Ideas, USA www.aijcrnet.com
76
Figure 1.0 Stages in the Innovation-Decision Process Model (Rogers, 1983, p.165)
Figure 2.0 Theoretical Research Framework and Hypothesis Paths
Discontinuance Continue Rejection Later Adoption
I. Knowledge II. Persuasion III. Decision IV. Implementation V. Confirmation
Communication Channels
Prior Condition 1. Previous practice 2. Felt needs /problems 3. Innovativeness 4. Norms of the social system
Characteristics of the Decision Making Unit 1. Socio economic characteristics 2. Personality variables 3. Communication behaviour
Perceived Characteristics of the Innovation 1. Relative advantage 2. Compatibility 3. Complexity 4. Trialability 5. Observability
1. Adoption
2. Rejection
Continue Adoption Later Adoption
Technical Knowledge Perceived risk
Intention
Decision
Relative Advantage
Complexity
Compatibility
Trialability
H2a
H2b
H2c
H3a
H3b
H3c
H3d
H2d
H1a
American International Journal of Contemporary Research Vol. 2 No. 8; August 2012
77
Table 1.0 Definition of Constructs
Variables Definition of Construct Adapted from
Adoption
process
The mental process through which an individual passes from
first learning about an innovation to final adoption
(Amstrong &
Kotler, 2009,
p.148).
Mobile
marketing
The use of the mobile medium as a means of marketing
communications
(Leppäniemi et
al., 2006).
Perceived
risk
Consumers’ subjective belief of suffering a loss in pursuit of
a desired outcome. Risk in this context is related to subjective
assessment of potential risk (i.e. security and privacy) rather
than “real world” (objective) risk
(R. A. Bauer,
1960)
Technical
knowledge
how-to knowledge consist of information necessary to use an
innovation properly and Rogers
(Rogers, 2003,
p.229)
Relative
advantage
the degree to which an innovation is perceived as being better
than the idea it supersedes
(Rogers, 2003,
p.229).
Compatibility the degree to which an innovation is perceived as consistent
with the existing values, past experiences, and the needs of
potential adopters
(Rogers, 2003,
p.240).
Complexity the degree to which an innovation is perceived as relatively
difficult to understand and use
(Rogers, 2003,
p.257).
Trialability the degree to which an innovation may be experimented with
on a limited basis
(Rogers, 2003,
p.258).
Intention to
Use (Decision
Stage)
when an individual (or other decision –making unit) engages
in activities that lead to a choice to adopt or reject an
innovation
(Rogers, 2003,
p.177).
Table 2.0 Reliability Analyses by Sections
Section Cronbach’s
Alpha
N of Items Source
A. Technical Knowledge .686 5 New measurements
B. Risk .654 3 (omit item
RISK2, RISK5
and RISK6)
Wu (2005) (H. H. Bauer et al.,
2005)
New measurements
E. Innovativeness (Relative Advantage) .906 3 Moore and Benbasat (1991)
E. Innovativeness (Compatibility) .887 3 Moore and Benbasat (1991)
E. Innovativeness (Complexity) .853 3 Moore and Benbasat (1991)
E. Innovativeness (Trialability) .891 3 Moore and Benbasat (1991)
F. Decision .733 5 Nysveen (2005)
G. Demographics
26 items
Source: SPSS output
© Centre for Promoting Ideas, USA www.aijcrnet.com
78
Table 3.0 Assessment of Construct Reliability
ITEMS
Standardized
Factor Loadings
>.50
Factor 1 - Decision Stage (Cronbach’s alpha reliability = .817)
DS1 I intend to accept mobile marketing messages occasionally from my current
service provider in the next 6 months.
.526
DS2 I intend to accept marketing messages from my current service provider
frequently in the next 6 months.
.557
DS3 I intend to use my mobile phone to get relevant marketing messages in the next 6
months.
.674
DS4 I intend to change my shopping habit based on the mobile marketing messages
sent by the service providers.
.677
DS5 I intend to utilise relevant and personalised mobile marketing messages to gain
information.
.724
Factor 2 - Trialability (Cronbach’s alpha reliability = .877)
TRY1 Before deciding on whether or not to adopt mobile marketing services, I would
be able to use it on a trial basis.
.736
TRY2 Before deciding on whether or not to adopt mobile marketing services, I would
be able to test the suitability of the services.
.838
TRY3 I would be permitted to use mobile marketing services on a trial basis long
enough to see what it can do.
.736
Factor 3 - Complexity (Cronbach’s alpha reliability = .877)
CPLX1 Learning to use mobile marketing services would be easy for me. .809
CPLX2 If I were to adopt mobile marketing services, it would be easy for me to adapt. .822
CPLX3 If I were to adopt mobile marketing services, it would be easy due to my
previous experience with mobile phone usage.
.663
Factor 4 - Technical Knowledge (Cronbach’s alpha reliability = .725)
KS1 My knowledge of how use a mobile phone correctly .598
KS2 My knowledge of the types and capabilities of a mobile phone. .586
KS3 My knowledge of accepting, forwarding, deleting and storing of mobile
marketing messages.
.542
KS4 My knowledge of my mobile phone usage pricing package. .679
KS5 My knowledge of the user package offered by other service providers (e.g.
MAXIS, Celcom and DiGi).
.517
Factor 5 - Compatibility (Cronbach’s alpha reliability = .883)
COM1 If I were to adopt mobile marketing services, it would be compatible with my
internet searching methods.
.673
COM2 If I were to adopt mobile marketing services, it would fit my product and
services information gathering style.
.781
COM3 If I were to adopt mobile marketing services, it would fit well with the way I like
to seek relevant product and services information.
.647
Factor 6 - Relative Advantage (Cronbach’s alpha reliability = .880)
RA1 If I were to adopt mobile marketing services, it would enable me to get
information more quickly.
.583
RA2 If I were to adopt mobile marketing services, the quality of my information
would improve.
.752
RA3 If I were to adopt mobile marketing services, it would enhance my effectiveness
on information gathering.
.756
Factor 7 - Perceived Risk (Cronbach’s alpha reliability = .707)
RISK1 It is safe to accept and reply to mobile marketing messages via mobile phone .702
RISK3 There is no more privacy risk involved in receiving marketing messages via
mobile phone than there is when getting marketing messages via email or TV
advertisement.
.584
RISK4 I do not consider mobile marketing to be a privacy risk way to receive marketing
messages.
.640
American International Journal of Contemporary Research Vol. 2 No. 8; August 2012
79
Figure 3.0 Structural test statistics for intention to adopt mobile marketing
Technical knowledge
KS5 e5
.45
KS4 e4
.66
KS3 e3 .50
KS2 e2 .56
KS1 e1
.57
Complexity
CPLX3
e11
.74
CPLX2
e10
.92
CPLX1
e9
.81
Perceived risk
RISK1
e8
.36
RISK3
e7
.44
RISK4
e6
r1
r2
r3
.19
Relative advantage
RA3
e17
RA2
e16
RA1
e15
r5 .91 .89 .80
Trialability
TRY3
e14
TRY2
e13
TRY1
e12
r4
.77 .92 .79
Compatibility
COM3
e20
COM2
e19
COM1
e18
r6 .86 .91 .81
.85
Decision Intention
DS1 e21
DS2 e22
DS3 e23
r7
.67
.65
.75
.81
.07
.22 .68
.13
.42
DS4 e24
DS5 e25
.70
.75
.44
.65
© Centre for Promoting Ideas, USA www.aijcrnet.com
80
Table 4.0 Goodness-of-Fit Statistics
Source: AMOS 7.0 output
Table 5.0 Summary of Research Findings
Hypothesis Dir Critical
ratio
Findings
H1a. Technical Knowledge has a direct effect on
perceived risk
H2a. Perceived Risk has a direct effect on Relative
Advantage
H2b. Perceived Risk has a direct effect on Complexity
H2c. Perceived Risk has a direct effect on
Compatibility
H2d. Perceived Risk has a direct effect on Trialability
H3a. Relative Advantage has a direct effect on
intention decision
H3b. Complexity has a direct effect on intention
decision
H3c. Compatibility has a direct effect on intention
decision
H3d. Trialability has a direct effect on intention
decision
+
+
+
+
+
+
+
+
+
.202
6.282**
*
5.675**
*
6.066**
*
5.492**
*
.073
.243
11.446*
**
9.711**
*
Not
Supported
Supported
Supported
Supported
Supported
Not
Supported
Not
Supported
Supported
Supported
The results of structural equation modelling are standardized maximum likelihood path coefficient for the
hypothesized model. ***Significant at the p<0.01 level
Statistic Recommended
criteria
Value
Normed chi-square ( χ2 / df) <3 1.356
Goodness-of-fit index (GFI) >.90 .935
Adjusted goodness-of-fit index (AGFI) >.90 .920
Comparative Fit Index (CFI) >.95 .879
Tucker –Lewis index (TLI) >.95 .864
Root mean square of approximation (RMSEA) <0.05 .028