Embed Size (px)
Citation preview
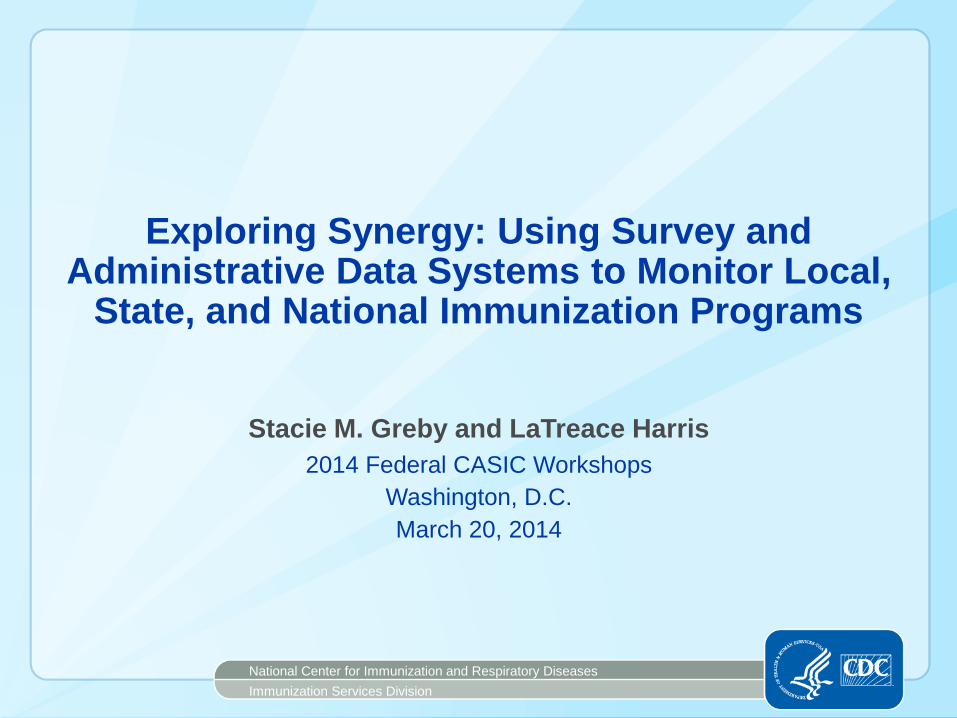
Exploring Synergy: Using Survey and Administrative Data Systems to Monitor Local,
State, and National Immunization Programs
Stacie M. Greby and LaTreace Harris
2014 Federal CASIC Workshops
Washington, D.C.
March 20, 2014
National Center for Immunization and Respiratory Diseases
Immunization Services Division
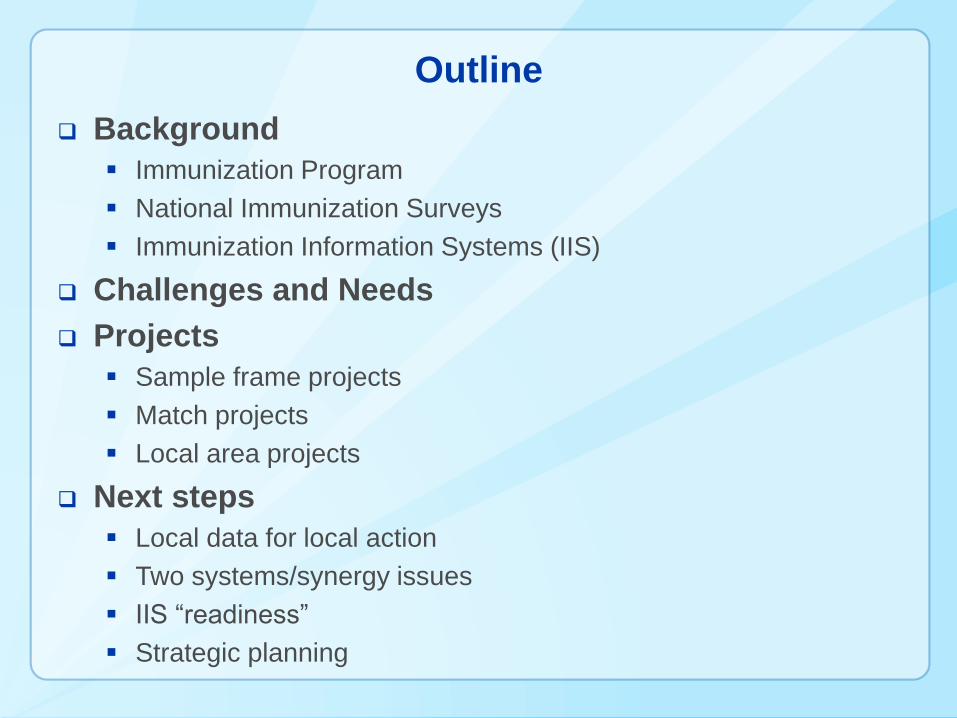
Outline
Background
Immunization Program
National Immunization Surveys
Immunization Information Systems (IIS)
Challenges and Needs
Projects
Sample frame projects
Match projects
Local area projects
Next steps
Local data for local action
Two systems/synergy issues
IIS “readiness”
Strategic planning
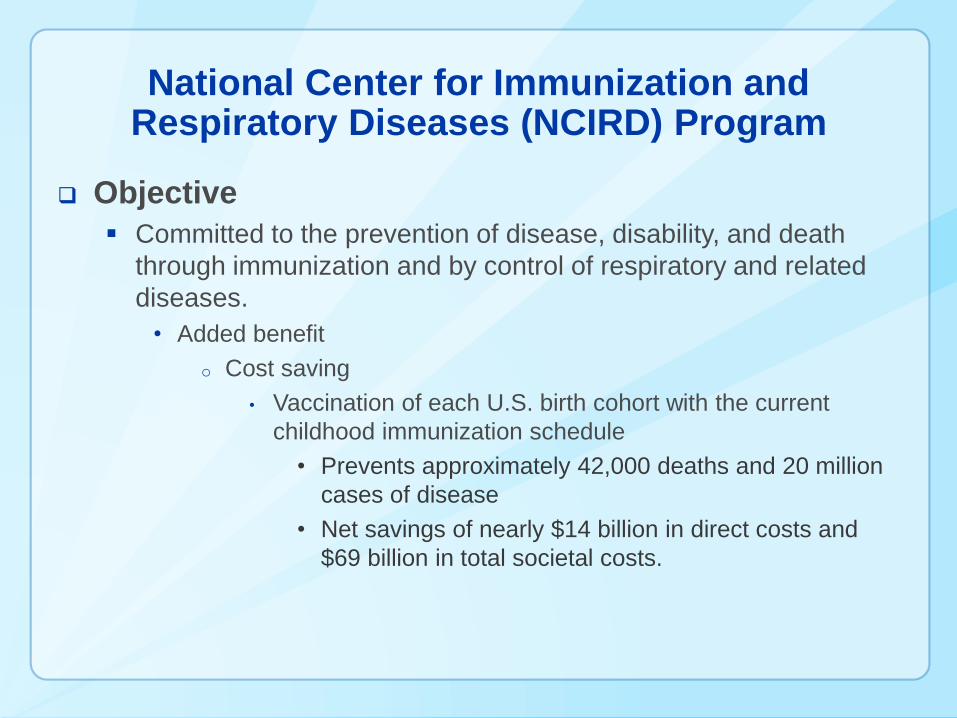
National Center for Immunization and Respiratory Diseases (NCIRD) Program
Objective
Committed to the prevention of disease, disability, and death
through immunization and by control of respiratory and related
diseases.
• Added benefit
o Cost saving
• Vaccination of each U.S. birth cohort with the current
childhood immunization schedule
• Prevents approximately 42,000 deaths and 20 million
cases of disease
• Net savings of nearly $14 billion in direct costs and
$69 billion in total societal costs.
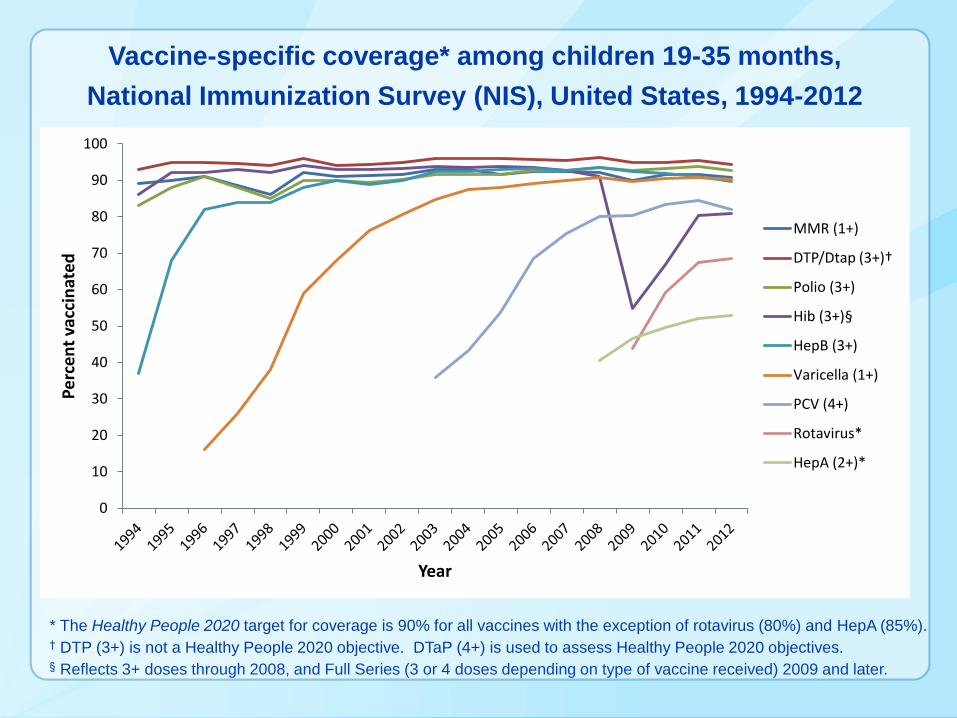
Vaccine-specific coverage* among children 19-35 months,
National Immunization Survey (NIS), United States, 1994-2012
* The Healthy People 2020 target for coverage is 90% for all vaccines with the exception of rotavirus (80%) and HepA (85%).† DTP (3+) is not a Healthy People 2020 objective. DTaP (4+) is used to assess Healthy People 2020 objectives.§ Reflects 3+ doses through 2008, and Full Series (3 or 4 doses depending on type of vaccine received) 2009 and later.
0
10
20
30
40
50
60
70
80
90
100
Pe
rce
nt
vacc
inat
ed
Year
MMR (1+)
DTP/Dtap (3+)†
Polio (3+)
Hib (3+)§
HepB (3+)
Varicella (1+)
PCV (4+)
Rotavirus*
HepA (2+)*
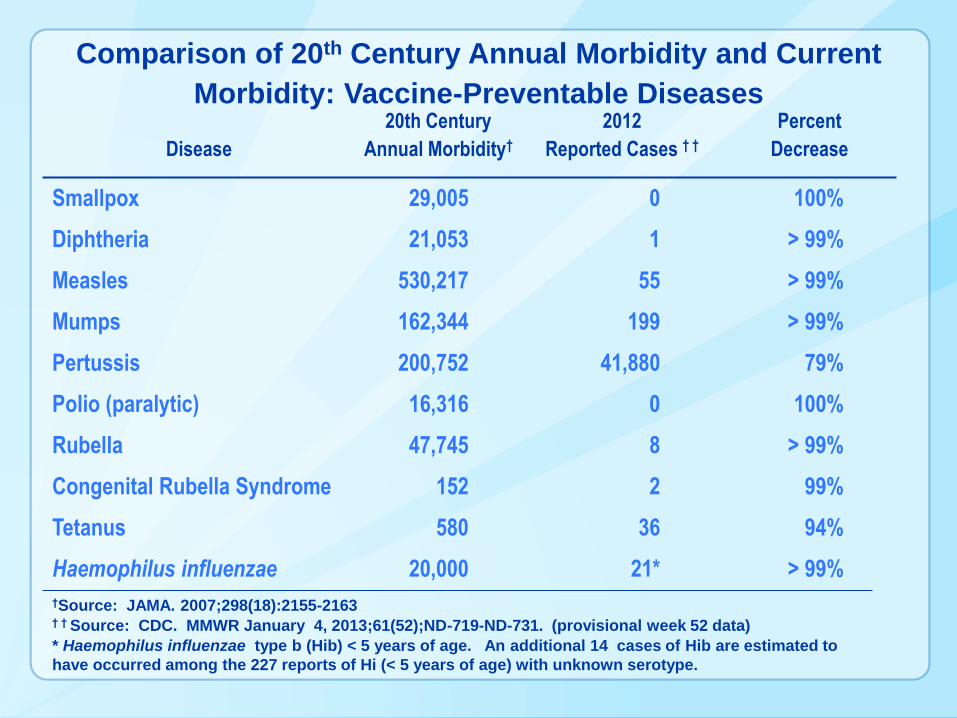
Comparison of 20th Century Annual Morbidity and Current
Morbidity: Vaccine-Preventable Diseases
Disease
20th Century
Annual Morbidity†
2012
Reported Cases † †
Percent
Decrease
Smallpox 29,005 0 100%
Diphtheria 21,053 1 > 99%
Measles 530,217 55 > 99%
Mumps 162,344 199 > 99%
Pertussis 200,752 41,880 79%
Polio (paralytic) 16,316 0 100%
Rubella 47,745 8 > 99%
Congenital Rubella Syndrome 152 2 99%
Tetanus 580 36 94%
Haemophilus influenzae 20,000 21* > 99%
†Source: JAMA. 2007;298(18):2155-2163† † Source: CDC. MMWR January 4, 2013;61(52);ND-719-ND-731. (provisional week 52 data)
* Haemophilus influenzae type b (Hib) < 5 years of age. An additional 14 cases of Hib are estimated to
have occurred among the 227 reports of Hi (< 5 years of age) with unknown serotype.
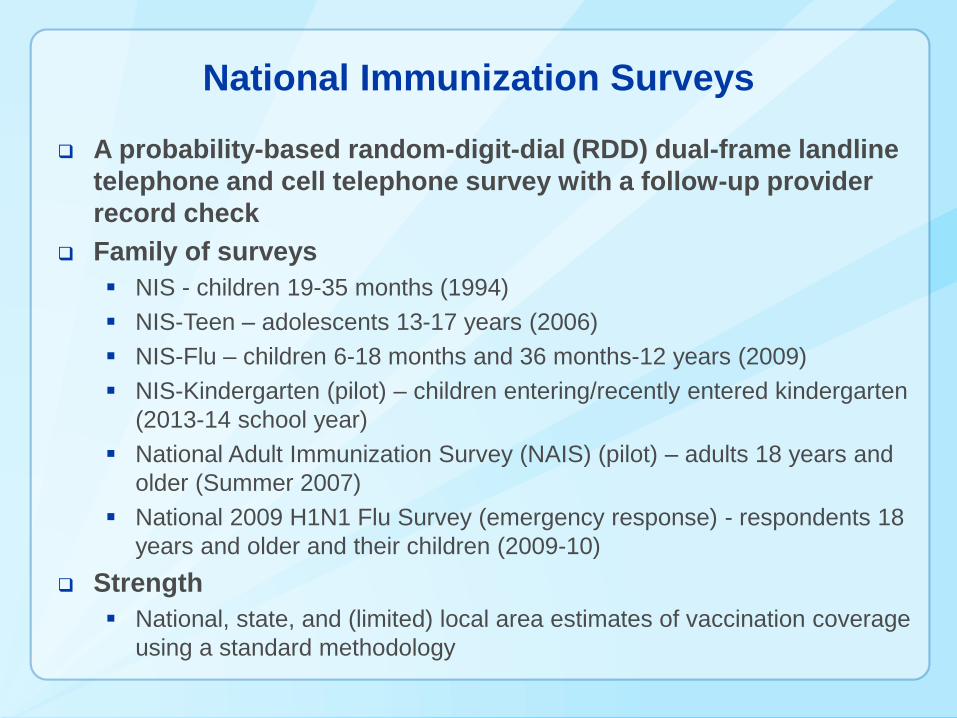
National Immunization Surveys
A probability-based random-digit-dial (RDD) dual-frame landline
telephone and cell telephone survey with a follow-up provider
record check
Family of surveys
NIS - children 19-35 months (1994)
NIS-Teen – adolescents 13-17 years (2006)
NIS-Flu – children 6-18 months and 36 months-12 years (2009)
NIS-Kindergarten (pilot) – children entering/recently entered kindergarten
(2013-14 school year)
National Adult Immunization Survey (NAIS) (pilot) – adults 18 years and
older (Summer 2007)
National 2009 H1N1 Flu Survey (emergency response) - respondents 18
years and older and their children (2009-10)
Strength
National, state, and (limited) local area estimates of vaccination coverage
using a standard methodology
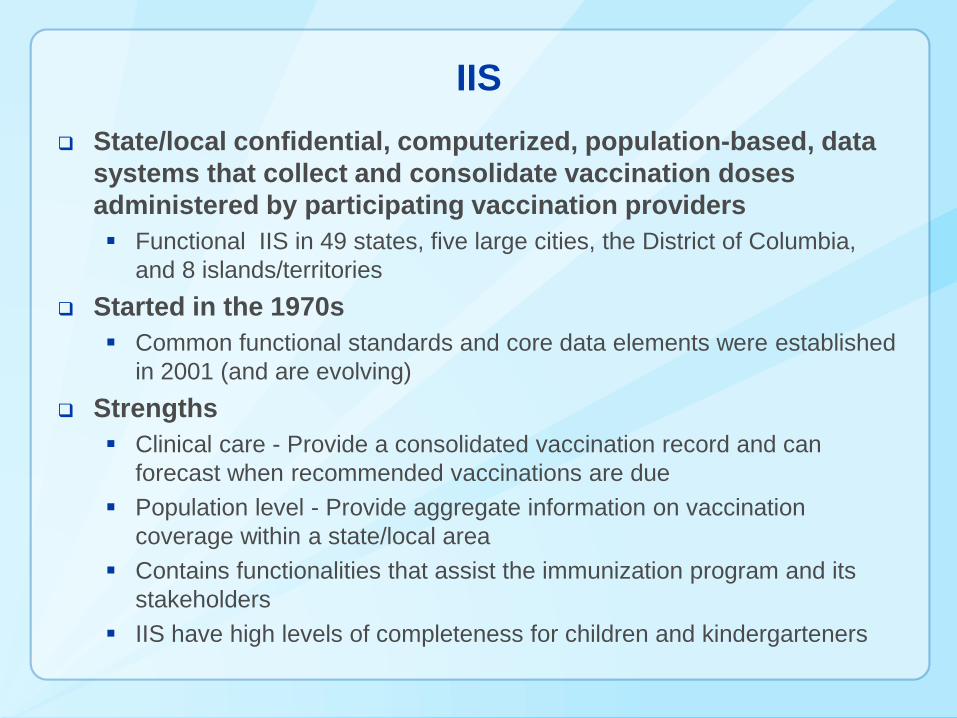
IIS
State/local confidential, computerized, population-based, data
systems that collect and consolidate vaccination doses
administered by participating vaccination providers
Functional IIS in 49 states, five large cities, the District of Columbia,
and 8 islands/territories
Started in the 1970s
Common functional standards and core data elements were established
in 2001 (and are evolving)
Strengths
Clinical care - Provide a consolidated vaccination record and can
forecast when recommended vaccinations are due
Population level - Provide aggregate information on vaccination
coverage within a state/local area
Contains functionalities that assist the immunization program and its
stakeholders
IIS have high levels of completeness for children and kindergarteners
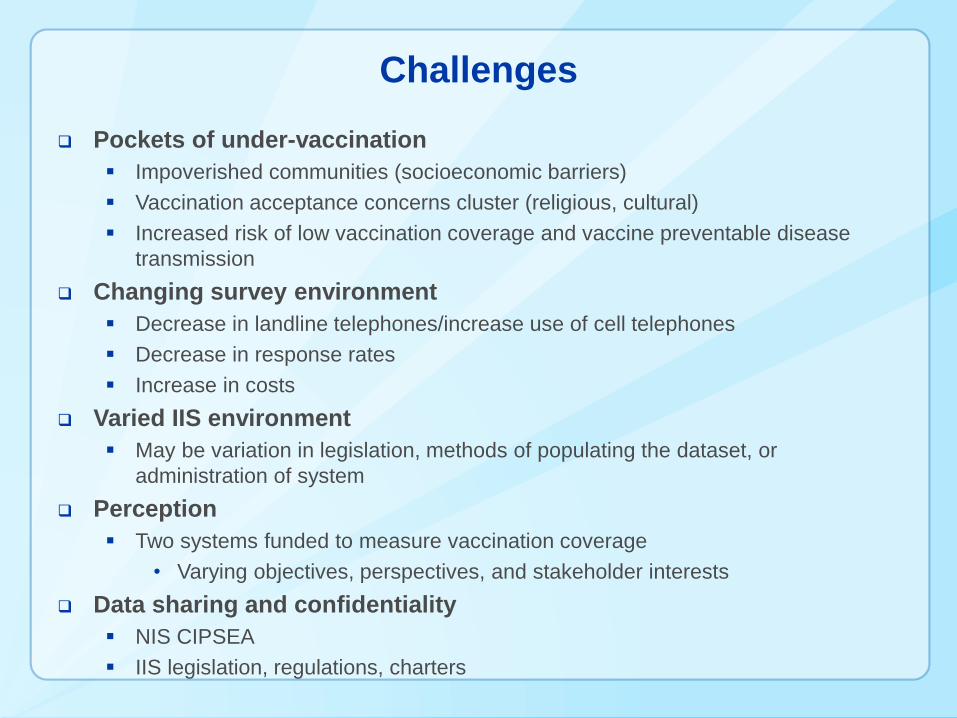
Challenges
Pockets of under-vaccination
Impoverished communities (socioeconomic barriers)
Vaccination acceptance concerns cluster (religious, cultural)
Increased risk of low vaccination coverage and vaccine preventable disease
transmission
Changing survey environment
Decrease in landline telephones/increase use of cell telephones
Decrease in response rates
Increase in costs
Varied IIS environment
May be variation in legislation, methods of populating the dataset, or
administration of system
Perception
Two systems funded to measure vaccination coverage
• Varying objectives, perspectives, and stakeholder interests
Data sharing and confidentiality
NIS CIPSEA
IIS legislation, regulations, charters
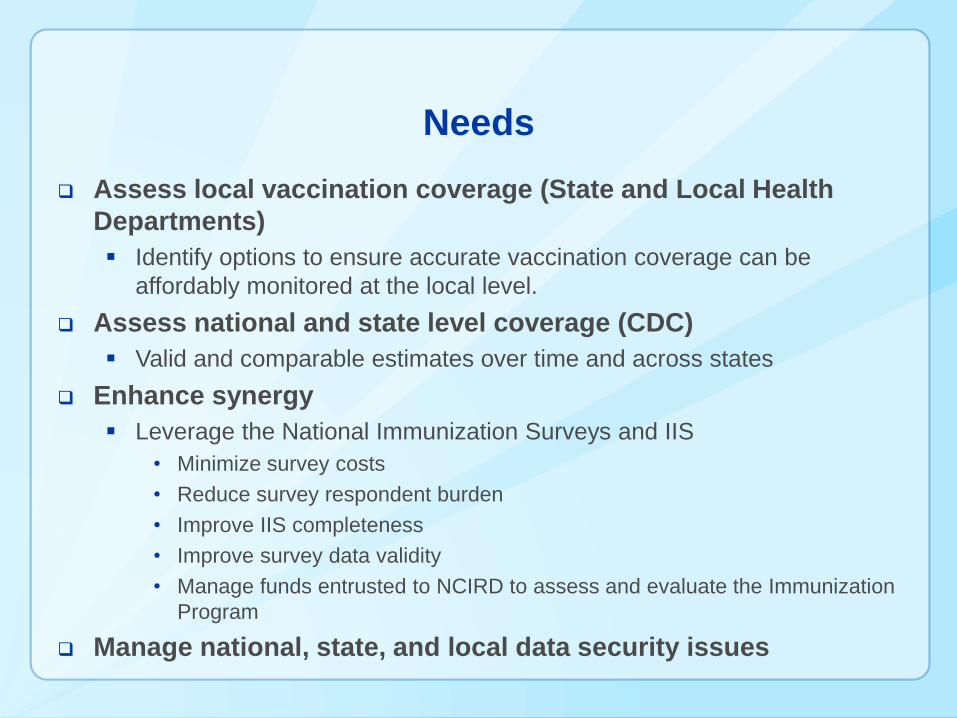
Needs
Assess local vaccination coverage (State and Local Health
Departments)
Identify options to ensure accurate vaccination coverage can be
affordably monitored at the local level.
Assess national and state level coverage (CDC)
Valid and comparable estimates over time and across states
Enhance synergy
Leverage the National Immunization Surveys and IIS
• Minimize survey costs
• Reduce survey respondent burden
• Improve IIS completeness
• Improve survey data validity
• Manage funds entrusted to NCIRD to assess and evaluate the Immunization
Program
Manage national, state, and local data security issues
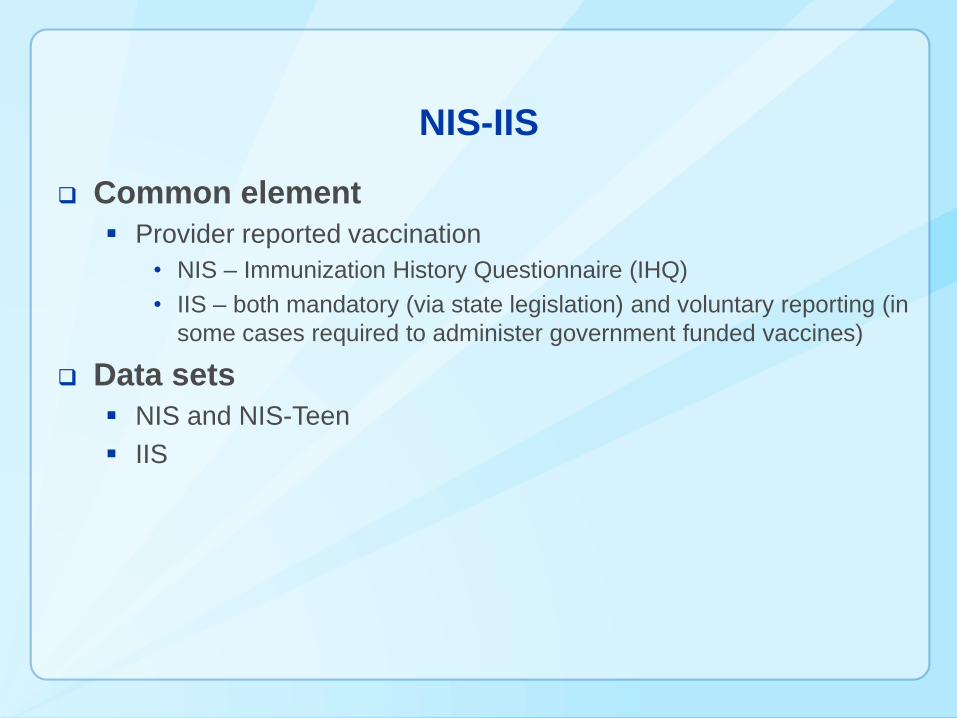
NIS-IIS
Common element
Provider reported vaccination
• NIS – Immunization History Questionnaire (IHQ)
• IIS – both mandatory (via state legislation) and voluntary reporting (in
some cases required to administer government funded vaccines)
Data sets
NIS and NIS-Teen
IIS
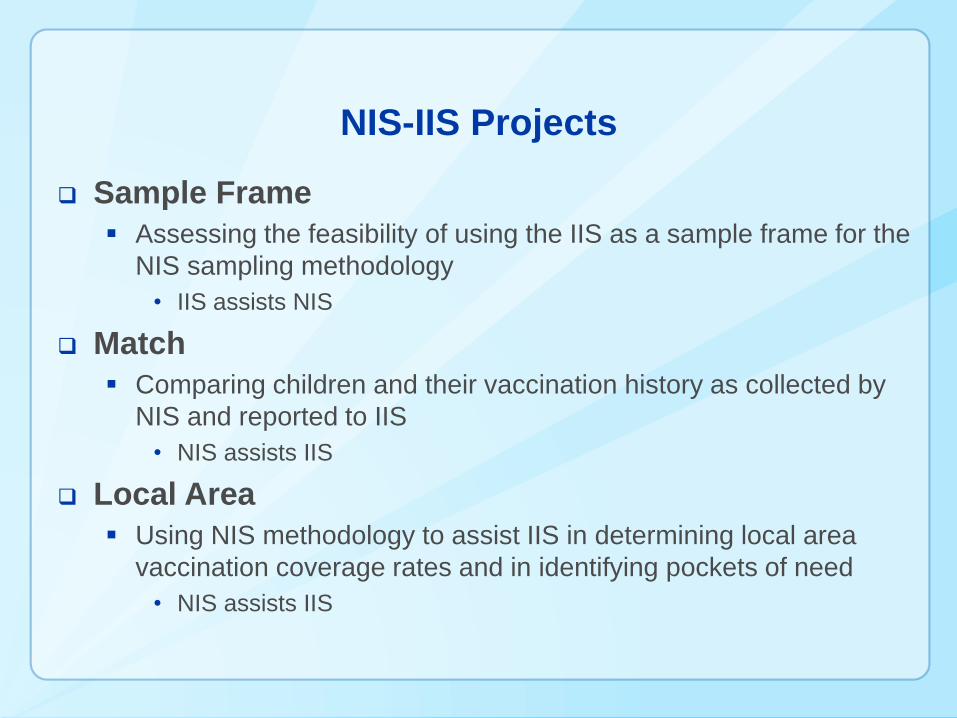
NIS-IIS Projects
Sample Frame
Assessing the feasibility of using the IIS as a sample frame for the
NIS sampling methodology
• IIS assists NIS
Match
Comparing children and their vaccination history as collected by
NIS and reported to IIS
• NIS assists IIS
Local Area
Using NIS methodology to assist IIS in determining local area
vaccination coverage rates and in identifying pockets of need
• NIS assists IIS
NIS-IIS SAMPLE FRAME PROJECT
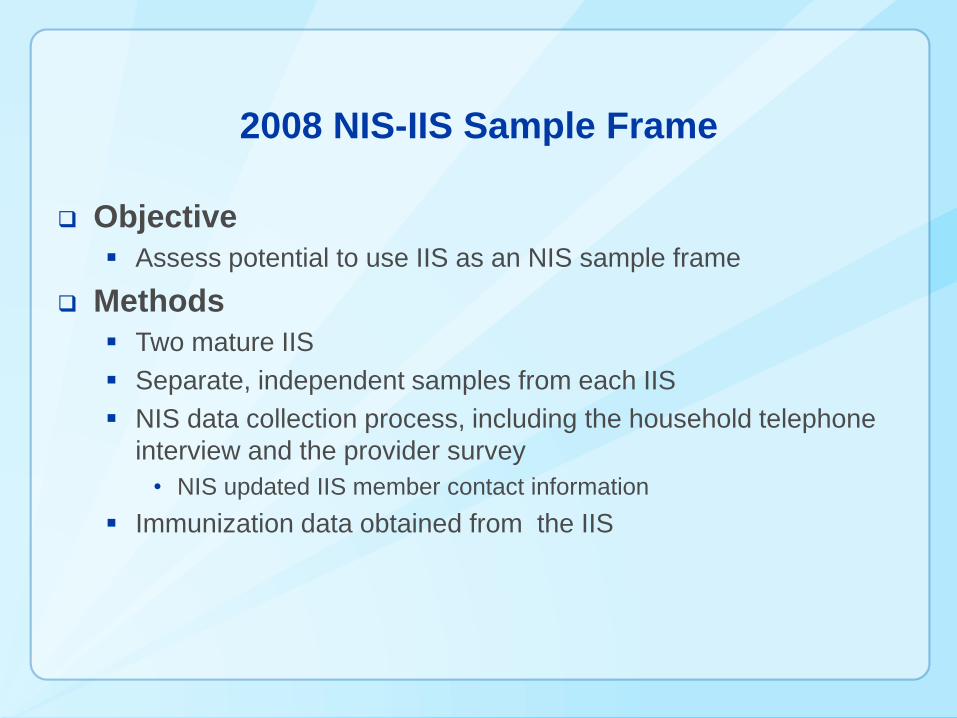
2008 NIS-IIS Sample Frame
Objective
Assess potential to use IIS as an NIS sample frame
Methods
Two mature IIS
Separate, independent samples from each IIS
NIS data collection process, including the household telephone
interview and the provider survey
• NIS updated IIS member contact information
Immunization data obtained from the IIS
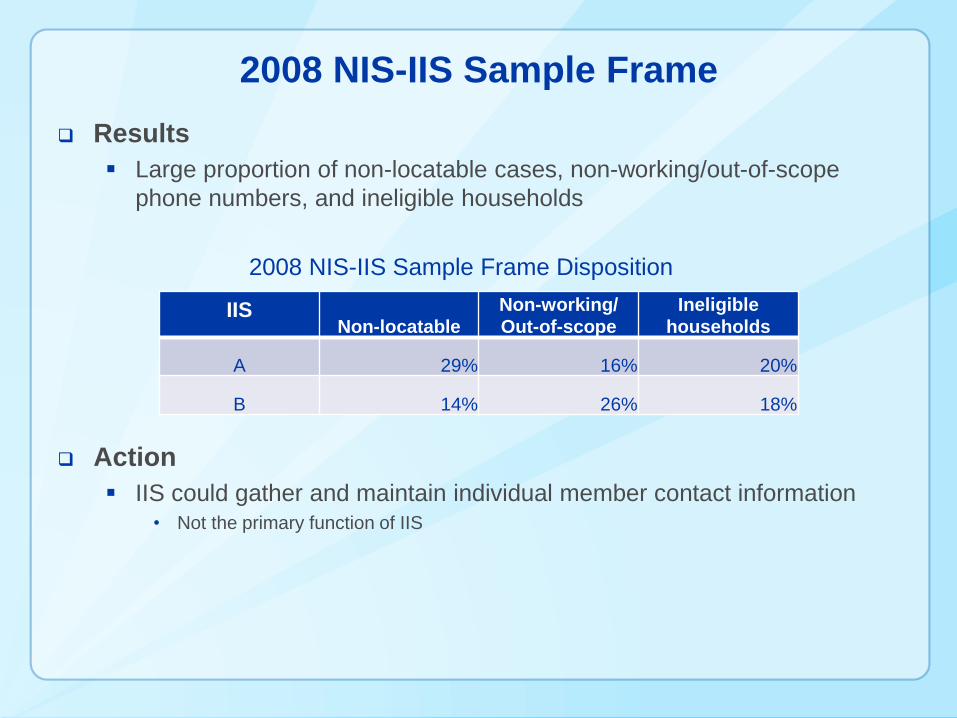
2008 NIS-IIS Sample Frame
Results
Large proportion of non-locatable cases, non-working/out-of-scope
phone numbers, and ineligible households
2008 NIS-IIS Sample Frame Disposition
Action
IIS could gather and maintain individual member contact information• Not the primary function of IIS
IISNon-locatable
Non-working/
Out-of-scope
Ineligible
households
A 29% 16% 20%
B 14% 26% 18%
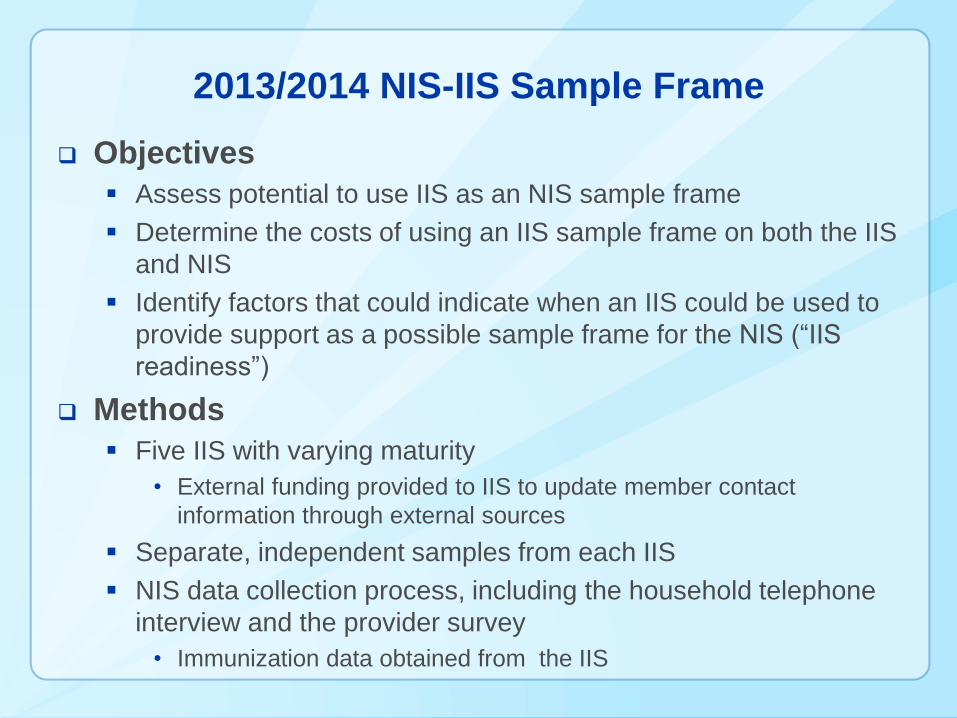
2013/2014 NIS-IIS Sample Frame
Objectives
Assess potential to use IIS as an NIS sample frame
Determine the costs of using an IIS sample frame on both the IIS
and NIS
Identify factors that could indicate when an IIS could be used to
provide support as a possible sample frame for the NIS (“IIS
readiness”)
Methods
Five IIS with varying maturity
• External funding provided to IIS to update member contact
information through external sources
Separate, independent samples from each IIS
NIS data collection process, including the household telephone
interview and the provider survey
• Immunization data obtained from the IIS
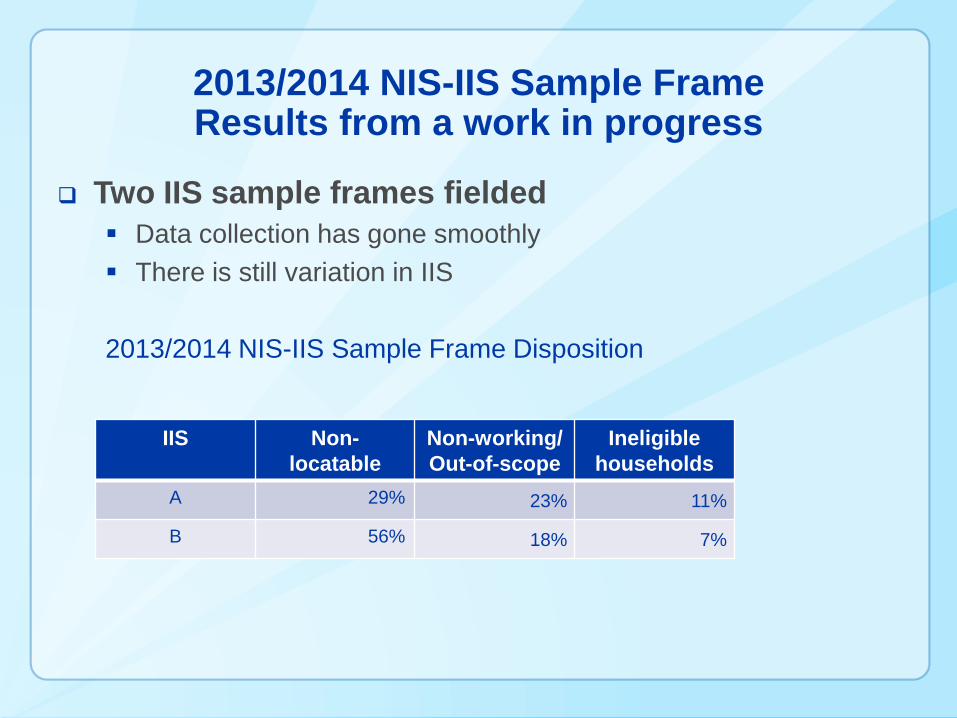
2013/2014 NIS-IIS Sample FrameResults from a work in progress
Two IIS sample frames fielded
Data collection has gone smoothly
There is still variation in IIS
2013/2014 NIS-IIS Sample Frame Disposition
IIS Non-
locatable
Non-working/
Out-of-scope
Ineligible
households
A 29% 23% 11%
B 56% 18% 7%
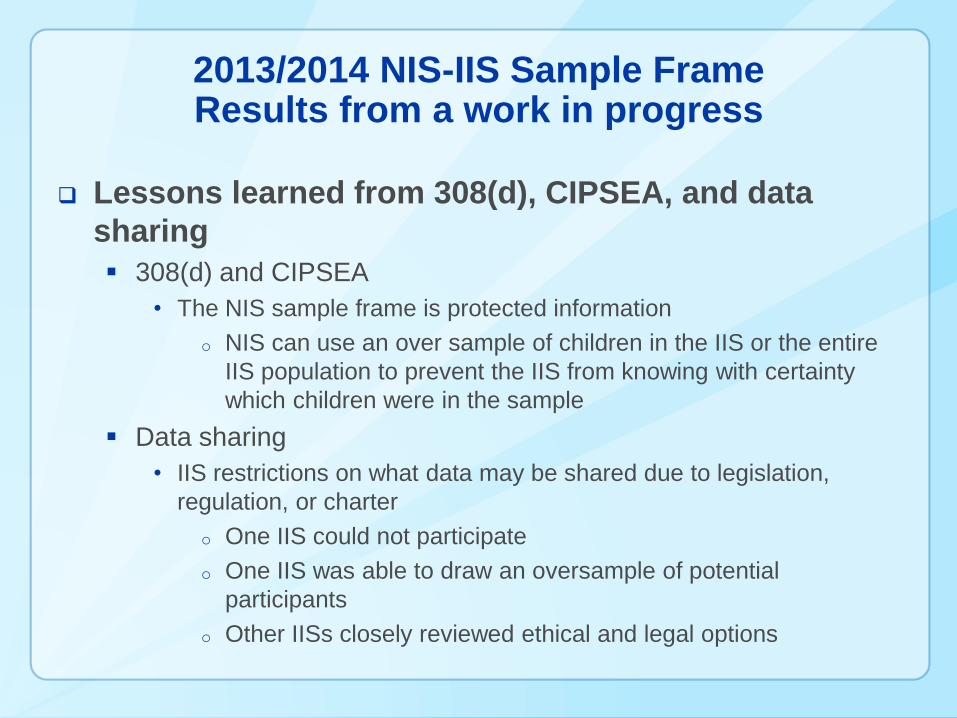
2013/2014 NIS-IIS Sample FrameResults from a work in progress
Lessons learned from 308(d), CIPSEA, and data
sharing
308(d) and CIPSEA
• The NIS sample frame is protected information
o NIS can use an over sample of children in the IIS or the entire
IIS population to prevent the IIS from knowing with certainty
which children were in the sample
Data sharing
• IIS restrictions on what data may be shared due to legislation,
regulation, or charter
o One IIS could not participate
o One IIS was able to draw an oversample of potential
participants
o Other IISs closely reviewed ethical and legal options
NIS-IIS MATCH PROJECT
NIS-IIS Match
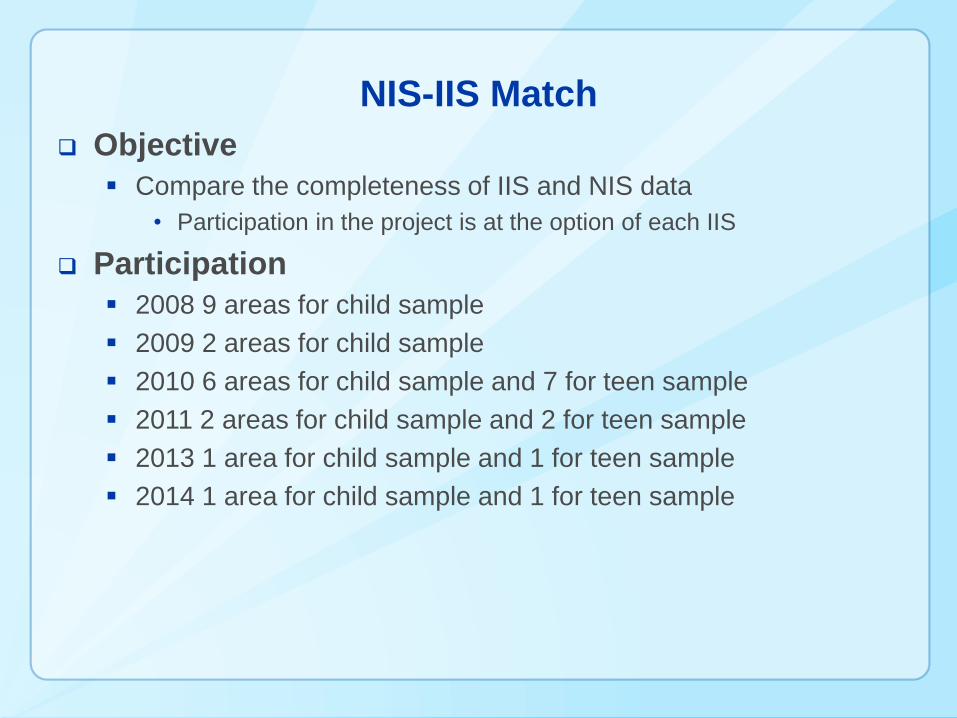
Objective
Compare the completeness of IIS and NIS data
• Participation in the project is at the option of each IIS
Participation
2008 9 areas for child sample
2009 2 areas for child sample
2010 6 areas for child sample and 7 for teen sample
2011 2 areas for child sample and 2 for teen sample
2013 1 area for child sample and 1 for teen sample
2014 1 area for child sample and 1 for teen sample
NIS-IIS Match Methods
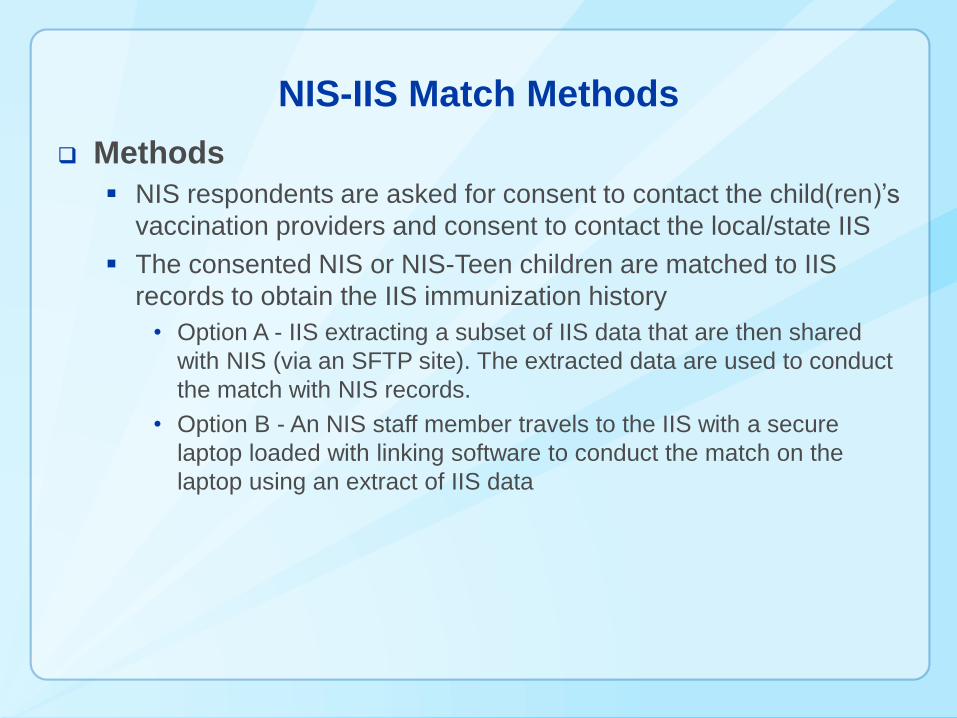
Methods
NIS respondents are asked for consent to contact the child(ren)’s
vaccination providers and consent to contact the local/state IIS
The consented NIS or NIS-Teen children are matched to IIS
records to obtain the IIS immunization history
• Option A - IIS extracting a subset of IIS data that are then shared
with NIS (via an SFTP site). The extracted data are used to conduct
the match with NIS records.
• Option B - An NIS staff member travels to the IIS with a secure
laptop loaded with linking software to conduct the match on the
laptop using an extract of IIS data
NIS-IIS Match Process
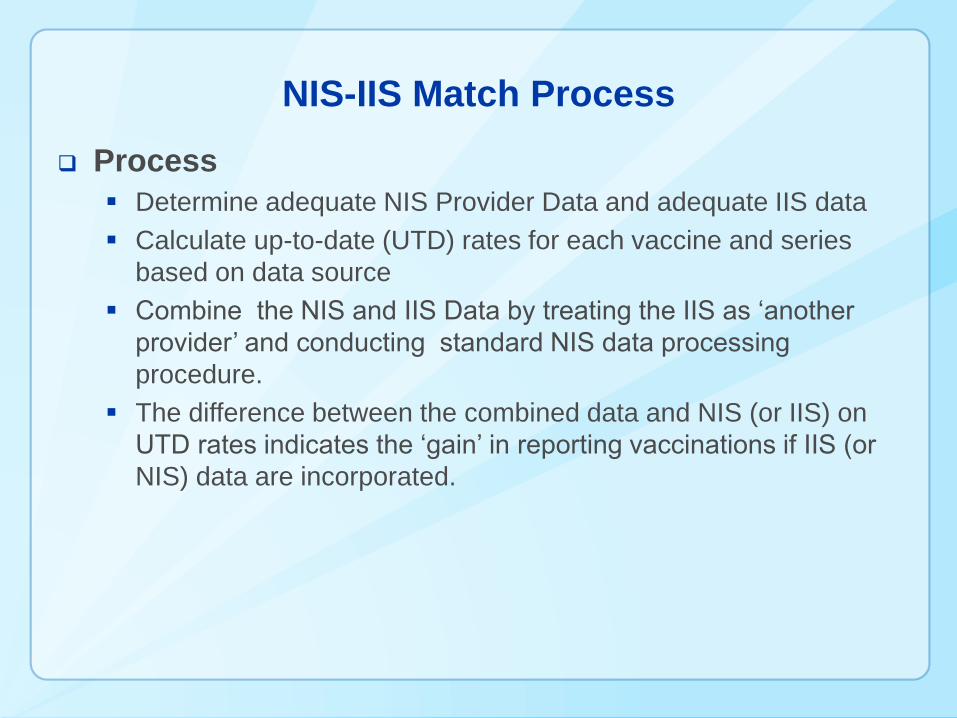
Process
Determine adequate NIS Provider Data and adequate IIS data
Calculate up-to-date (UTD) rates for each vaccine and series
based on data source
Combine the NIS and IIS Data by treating the IIS as ‘another
provider’ and conducting standard NIS data processing
procedure.
The difference between the combined data and NIS (or IIS) on
UTD rates indicates the ‘gain’ in reporting vaccinations if IIS (or
NIS) data are incorporated.
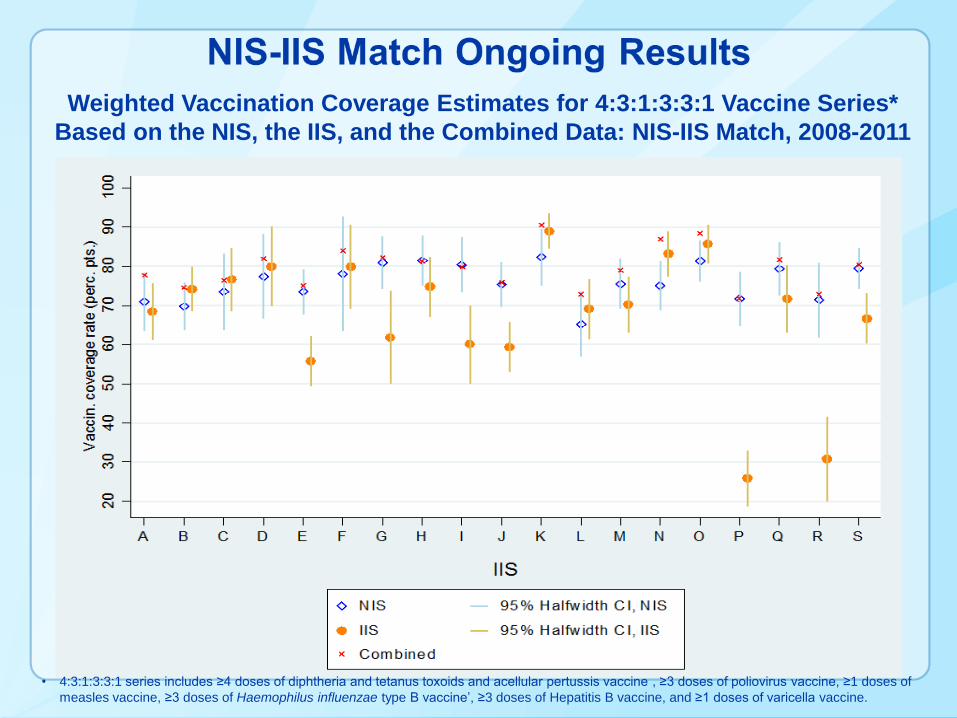
Weighted Vaccination Coverage Estimates for 4:3:1:3:3:1 Vaccine Series*
Based on the NIS, the IIS, and the Combined Data: NIS-IIS Match, 2008-2011
• 4:3:1:3:3:1 series includes ≥4 doses of diphtheria and tetanus toxoids and acellular pertussis vaccine , ≥3 doses of poliovirus vaccine, ≥1 doses of
measles vaccine, ≥3 doses of Haemophilus influenzae type B vaccine’, ≥3 doses of Hepatitis B vaccine, and ≥1 doses of varicella vaccine.
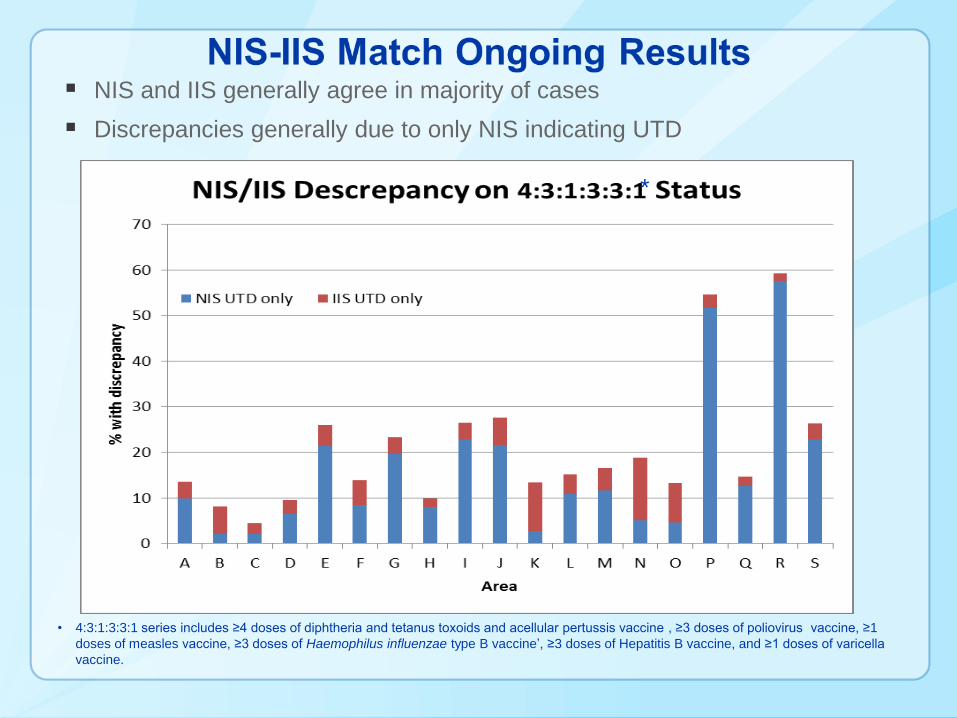
NIS and IIS generally agree in majority of cases
Discrepancies generally due to only NIS indicating UTD
*
• 4:3:1:3:3:1 series includes ≥4 doses of diphtheria and tetanus toxoids and acellular pertussis vaccine , ≥3 doses of poliovirus vaccine, ≥1
doses of measles vaccine, ≥3 doses of Haemophilus influenzae type B vaccine’, ≥3 doses of Hepatitis B vaccine, and ≥1 doses of varicella
vaccine.
NIS-IIS Match Ongoing Results
NIS vs. IIS UTD Status Disagrees by Child/Household
Characteristics
Based on 15 delivered reports (13 areas) from 2008 to 2010
More discrepancies are found among children who:
• moved from another area
• had 2+ providers
Fewer discrepancies are found among children who:
• lived in poverty
• had only public providers
NIS-IIS Match Ongoing Findings
IIS
Results show diversity of vaccination data completeness across IISs
Vaccination coverage estimates determined by IISs could be more
accurate if NIS data were added
• However, federal restrictions on sharing data from the NIS prevent data
sharing
Data sharing
• One IIS had to withdraw from the match
o In some jurisdictions, IIS legislation prohibits access to data by
researchers or other entities
NIS
The NIS would benefit from adding additional vaccination data from the
IISs.
• However , comparability of NIS estimates across states may be affected
Next steps
Continue as an option for interested IIS
NIS-IIS LOCAL AREA PROJECT
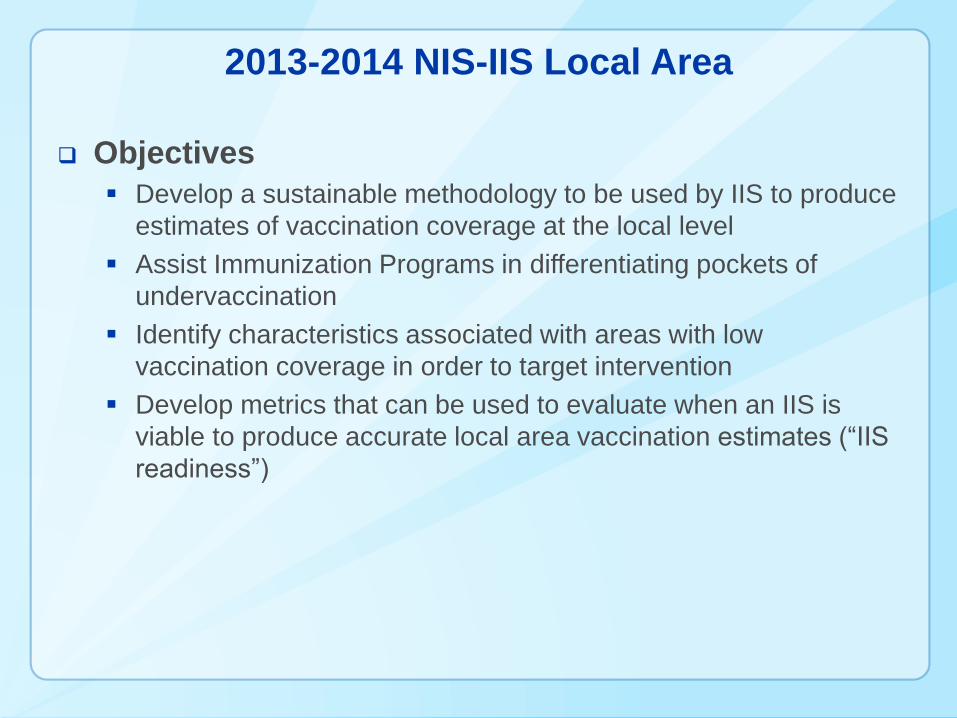
2013-2014 NIS-IIS Local Area
Objectives
Develop a sustainable methodology to be used by IIS to produce
estimates of vaccination coverage at the local level
Assist Immunization Programs in differentiating pockets of
undervaccination
Identify characteristics associated with areas with low
vaccination coverage in order to target intervention
Develop metrics that can be used to evaluate when an IIS is
viable to produce accurate local area vaccination estimates (“IIS
readiness”)
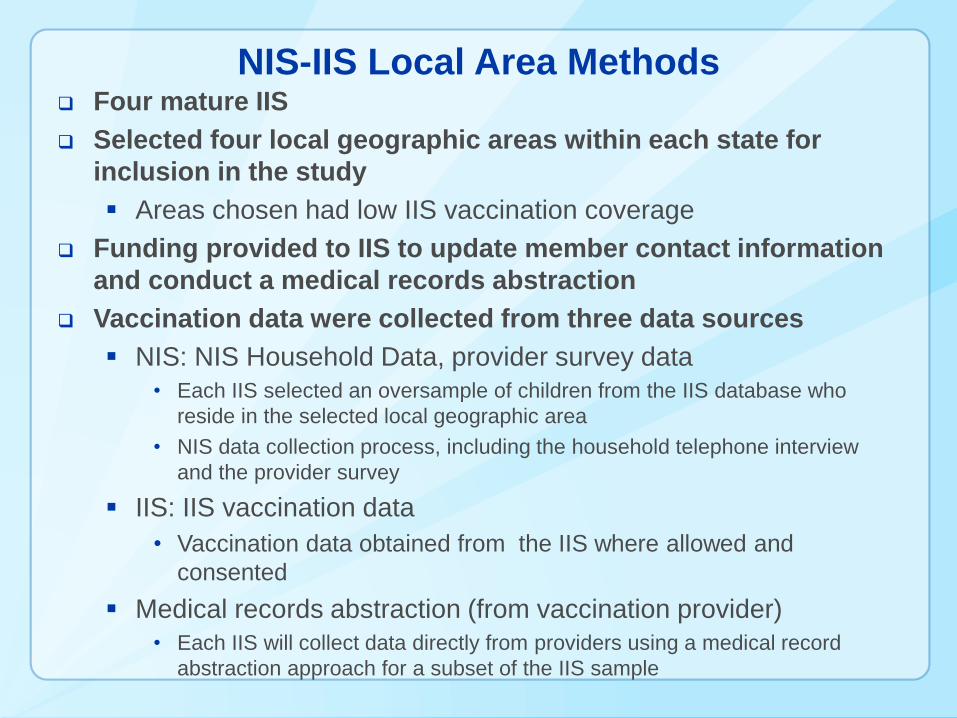
NIS-IIS Local Area Methods Four mature IIS
Selected four local geographic areas within each state for
inclusion in the study
Areas chosen had low IIS vaccination coverage
Funding provided to IIS to update member contact information
and conduct a medical records abstraction
Vaccination data were collected from three data sources
NIS: NIS Household Data, provider survey data
• Each IIS selected an oversample of children from the IIS database who
reside in the selected local geographic area
• NIS data collection process, including the household telephone interview
and the provider survey
IIS: IIS vaccination data
• Vaccination data obtained from the IIS where allowed and
consented
Medical records abstraction (from vaccination provider)
• Each IIS will collect data directly from providers using a medical record
abstraction approach for a subset of the IIS sample
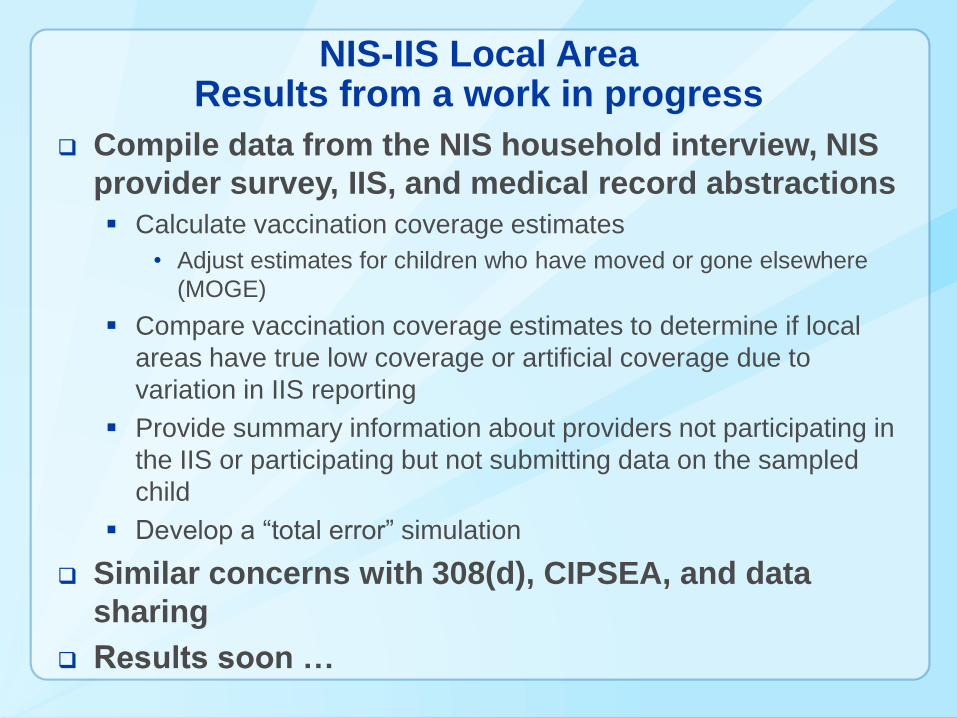
NIS-IIS Local AreaResults from a work in progress
Compile data from the NIS household interview, NIS
provider survey, IIS, and medical record abstractions
Calculate vaccination coverage estimates
• Adjust estimates for children who have moved or gone elsewhere
(MOGE)
Compare vaccination coverage estimates to determine if local
areas have true low coverage or artificial coverage due to
variation in IIS reporting
Provide summary information about providers not participating in
the IIS or participating but not submitting data on the sampled
child
Develop a “total error” simulation
Similar concerns with 308(d), CIPSEA, and data
sharing
Results soon …
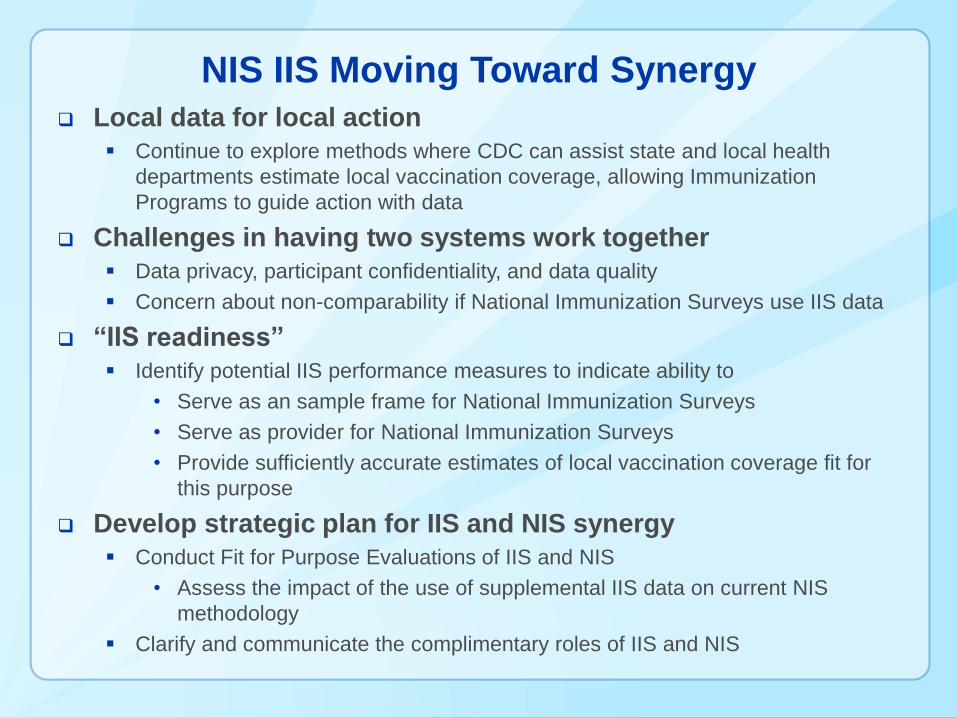
NIS IIS Moving Toward Synergy
Local data for local action
Continue to explore methods where CDC can assist state and local health
departments estimate local vaccination coverage, allowing Immunization
Programs to guide action with data
Challenges in having two systems work together
Data privacy, participant confidentiality, and data quality
Concern about non-comparability if National Immunization Surveys use IIS data
“IIS readiness”
Identify potential IIS performance measures to indicate ability to
• Serve as an sample frame for National Immunization Surveys
• Serve as provider for National Immunization Surveys
• Provide sufficiently accurate estimates of local vaccination coverage fit for
this purpose
Develop strategic plan for IIS and NIS synergy
Conduct Fit for Purpose Evaluations of IIS and NIS
• Assess the impact of the use of supplemental IIS data on current NIS
methodology
Clarify and communicate the complimentary roles of IIS and NIS
Acknowledgements
CDC
Laura Pabst
James A. Singleton
NORC at the University of Chicago
Vicki Pineau
Margrethe Montgomery