Embed Size (px)
Citation preview
Exploring Students’ Learning Behaviour inMOOCs using Process Mining Techniques
Patrick Mukala, Joos Buijs, Maikel Leemans, and Wil van der Aalst
Department of Mathematics and Computer ScienceEindhoven University of Technology, Eindhoven, The Netherlands
{m.p.mukala,j.c.a.m.buijs,m.leemans,w.m.p.v.d.aalst}@tue.nl
Abstract. Massive Open Online Courses (MOOCs) provide increasingopportunities for skills acquisition. Their widespread use can be justifiedby a number of critical motivating factors such as the possibility of freecourses, the flexibility of the learning process as well as the reputationof some of the world most prestigious universities offering these courses.This level of popularity has created the need for a deep understandingof learning in MOOCs. This has been so far achieved through LearningAnalytics (LA) using data mining techniques. Nevetheless, it is difficultto perform a sytematic analysis of learning processes based on students’behaviour using these techniques alone. Therefore, we propose to applyprocess mining since it provides important techniques for understandinglearning processes based on students’activities trails from MOOC plat-forms logs. In this paper, we analyze a Coursera MOOC dataset usingseveral process mining techniques and provide some indications in termsof useful insights and guidance that could inspire intervention measuresto improve both the quality and delivery of MOOCs.
Keywords: Learning Analytics, Mooc, Coursera, Educational Data Min-ing, Process Mining,Online Learning
1 Introduction
There has been a surge in interests for Massive Open Online Courses (MOOCs)in recent years. More people find in MOOCs a cheap means to acquire new skillsand improve their imployability [5]. In the same way, many institutions offerfree courses online as MOOCs as part of their marketing strategy. The aura andpublicity generated by the use of MOOCs raise critical interests for LearningAnalytics (LA) [7,8].
A number of LA studies have attempted to explore MOOCs in general. In[10], a systematic survey of the literature is conducted to give a broad pic-ture in terms of research on MOOCs. It emerges that a number of aspects inMOOCs are investigated including individual case studies, educational theory inMOOCs, technology used as part of teaching and learning, MOOCs participantsand MOOCs providers [10]. This study highlights that many MOOC participantsdo not or keep a very limited participation to forums for diverse reasons. Some
of these reasons include background and cultural differences. Such participantsthen seek support through external communication channels [9]. Furthermore,in studying the identity of and motivation behind MOOC participants, Chris-tensen et al. [5] argue that MOOCs population tends to be young, well educated,and employed. The main reasons for partaking in MOOCs are primarily careerpromotion and curiosity [5]. Other similar studies investigate MOOC popularityand potential [8] and funnel of participation [6].
Moreover, current literature on LA indicates that the focus has mosltly beenon prediction, classification and other classical data mining techniques for stu-dents’ retention, students’ dropout risk modeling etc., almost entirely using at-tributes such as students’ age, previous grades, residency, race, academic quali-fications etc. [3,4,7]. Beyond this type of analysis, process mining techniques [1]add a new perspective based on the actual behaviour exhibited by students asthey learn.
The need to improve both the contents of MOOCs and their delivery calls fora careful consideration of students’ direct behaviour. Therefore, Process miningtechniques can be used in exploring students’ footprints as they interact with thematerials. In this paper, we present some of these techniques and the advantagesthey provide. We make use of a Coursera MOOC as a case study to demonstratetheir applicability and usefulness.
The remainder of this paper is structured as follows. We start with a briefintroduction to process mining in section 2. This is followed by a description ofour case study section 3. In section 4, we give an overview of the Coursera datastructure and a discussion on how the input data can be converted to the processmining format in section 5. In section 6, we discuss the application of processmining techniques to MOOC data and discuss the results. Section 7 concludesthis paper and discusses possible future directions.
2 Process Mining
Process mining is an emerging discipline providing comprehensive sets of toolsto provide fact-based insights and to support process improvements [1]. Processmining can discover a process model that describes the process as contained inthe event log(s) [1,11].. Process models can provide critical insights and doc-ument procedures [1]. A global overview and positioning of process mining ispresented in 1. These process models describe how ‘the world’, in our case theMOOC students, interact with the information system, in our case the Courseraplatform.
Next to the fully automatic discovery of process models, process mining alsoprovides techniques to check the conformance of event log data to a given processmodel. Additionally, given process models can be enhanced using the event logdata. Examples of extension include the projection of time information on theprocess model, or repairing the process model using the event log data. Byusing the historical data as recorded by the MOOC platform, process miningtechniques are able to analyse the underlying process.
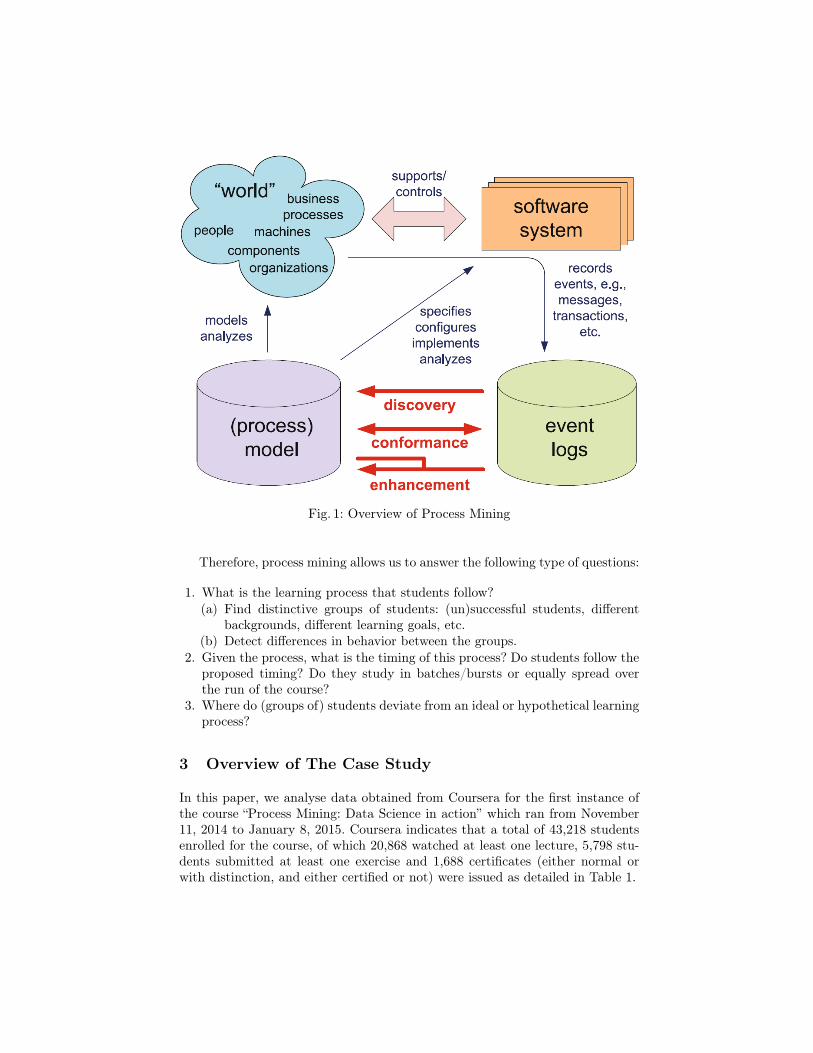
Fig. 1: Overview of Process Mining
Therefore, process mining allows us to answer the following type of questions:
1. What is the learning process that students follow?(a) Find distinctive groups of students: (un)successful students, different
backgrounds, different learning goals, etc.(b) Detect differences in behavior between the groups.
2. Given the process, what is the timing of this process? Do students follow theproposed timing? Do they study in batches/bursts or equally spread overthe run of the course?
3. Where do (groups of) students deviate from an ideal or hypothetical learningprocess?
3 Overview of The Case Study
In this paper, we analyse data obtained from Coursera for the first instance ofthe course “Process Mining: Data Science in action” which ran from November11, 2014 to January 8, 2015. Coursera indicates that a total of 43,218 studentsenrolled for the course, of which 20,868 watched at least one lecture, 5,798 stu-dents submitted at least one exercise and 1,688 certificates (either normal orwith distinction, and either certified or not) were issued as detailed in Table 1.
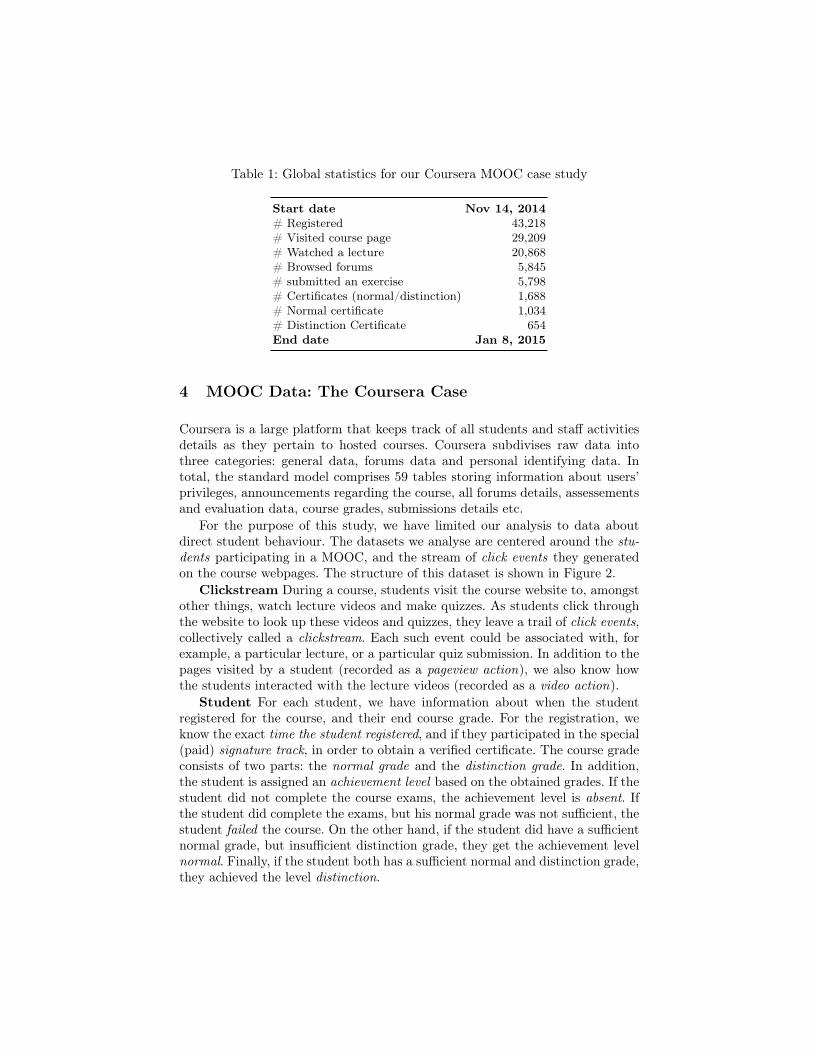
Table 1: Global statistics for our Coursera MOOC case study
Start date Nov 14, 2014# Registered 43,218# Visited course page 29,209# Watched a lecture 20,868# Browsed forums 5,845# submitted an exercise 5,798# Certificates (normal/distinction) 1,688# Normal certificate 1,034# Distinction Certificate 654End date Jan 8, 2015
4 MOOC Data: The Coursera Case
Coursera is a large platform that keeps track of all students and staff activitiesdetails as they pertain to hosted courses. Coursera subdivises raw data intothree categories: general data, forums data and personal identifying data. Intotal, the standard model comprises 59 tables storing information about users’privileges, announcements regarding the course, all forums details, assessementsand evaluation data, course grades, submissions details etc.
For the purpose of this study, we have limited our analysis to data aboutdirect student behaviour. The datasets we analyse are centered around the stu-dents participating in a MOOC, and the stream of click events they generatedon the course webpages. The structure of this dataset is shown in Figure 2.
Clickstream During a course, students visit the course website to, amongstother things, watch lecture videos and make quizzes. As students click throughthe website to look up these videos and quizzes, they leave a trail of click events,collectively called a clickstream. Each such event could be associated with, forexample, a particular lecture, or a particular quiz submission. In addition to thepages visited by a student (recorded as a pageview action), we also know howthe students interacted with the lecture videos (recorded as a video action).
Student For each student, we have information about when the studentregistered for the course, and their end course grade. For the registration, weknow the exact time the student registered, and if they participated in the special(paid) signature track, in order to obtain a verified certificate. The course gradeconsists of two parts: the normal grade and the distinction grade. In addition,the student is assigned an achievement level based on the obtained grades. If thestudent did not complete the course exams, the achievement level is absent. Ifthe student did complete the exams, but his normal grade was not sufficient, thestudent failed the course. On the other hand, if the student did have a sufficientnormal grade, but insufficient distinction grade, they get the achievement levelnormal. Finally, if the student both has a sufficient normal and distinction grade,they achieved the level distinction.
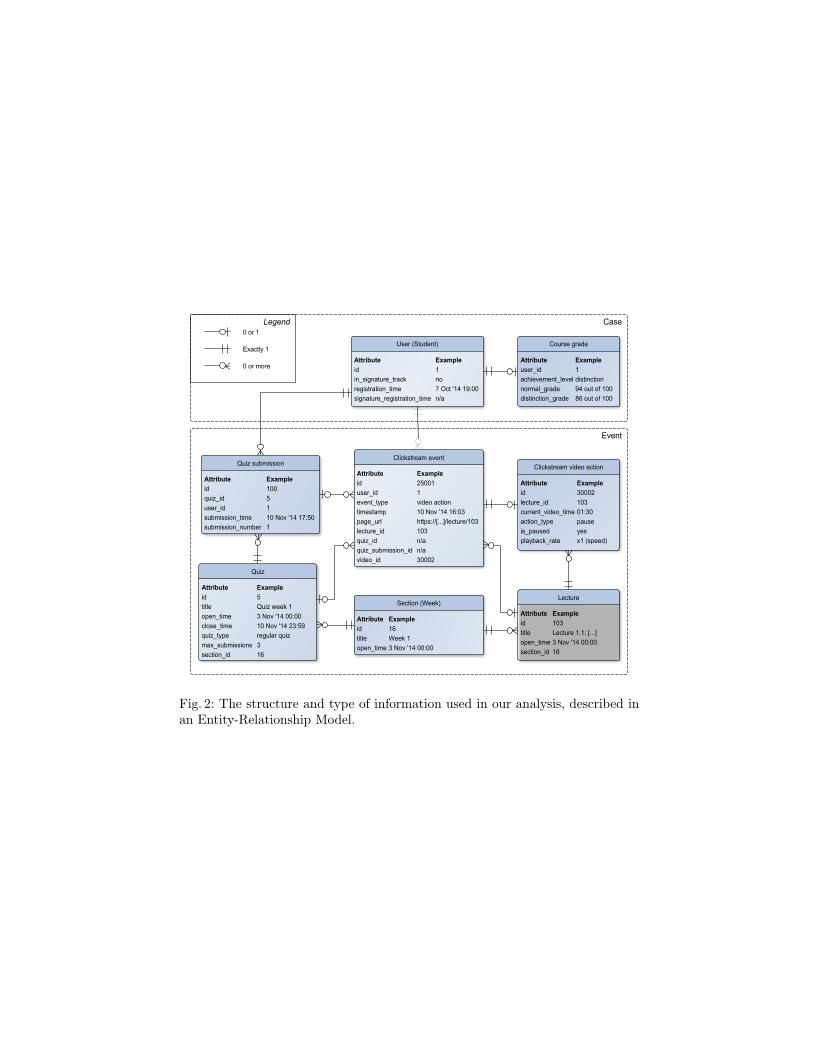
Fig. 2: The structure and type of information used in our analysis, described inan Entity-Relationship Model.
Course structure Lastly, in a Coursera MOOC, lectures and quizzes aregrouped into sections, (typically weeks). Each section is visible to the studentsat a predetermined time (the open time), in order to give structure to the course.Within a section, lectures and quizzes may have their own open time, to furtherguide students to follow a particular study rhythm. Finally, quizzes an also havedeadlines (the close time), and quizzes can be attempted multiple times by thestudent, up to a certain submission maximum.
5 Generating Event Logs from MOOC Data
In this case study we are interested in analysing students’ behaviours based onthe trails of click events they generated. Before we can use process mining toanalyze this behavior, we first need to map the MOOC data to an event log.There are two things we must specify for this mapping: what constitutes anevent, and what makes a case (i.e., a sequence of events).
As we are focussing on the behavior of students, we will consider each studentas an individual case. The clickstream a student generated will be the basis forthe events in this trace. This separation between case and event is also displayedin Figure 2. For this analysis, we will primarily focus on events with the typepageview action.
As an example, consider the MOOC data in Table 2. The resulting eventlog is shown in Table 3. Each student in Table 2 becomes one case in Table 3.For each case, we store the data available about the student, including theircourse grade data. For each clickstream event, we create an event belonging tothe corresponding case (based on the student user_id). In this example, we willonly consider lecture pageview actions. That is, we filtered the MOOC data toget a view of the lecture watching behavior of students. For each clickstreamevent, we store the click event data, including the referenced lecture as eventname.
Based on different data attributes we can determine several students groups.First of all, we can group students that failed (F) the course or successfully(S) obtained a certificate, which can be split into a normal (N) certificate orcertificate with distinction (D). The second attribute on which we can split iswhether a student enrolled in the signature track (T) or not (F). Thirdly we canconsider for which weeks events were recorded, e.g. for week one only (1), weeksone and two (2), weeks one, two and three (3), or all.
6 Applying Process Mining to MOOC Data
As part of our exploration, we make use of process mining to model and profilestudents’ behaviour throughout the duration of the course. Before we decide onany process mining techniques appropriate for our analysis, we consider threecritical elements as basic dimensions from which we conduct this exploratoryanalysis. These include the general lecture videos viewing behaviour, quiz sub-mission behaviour as well as a combination of both. The key objective is to
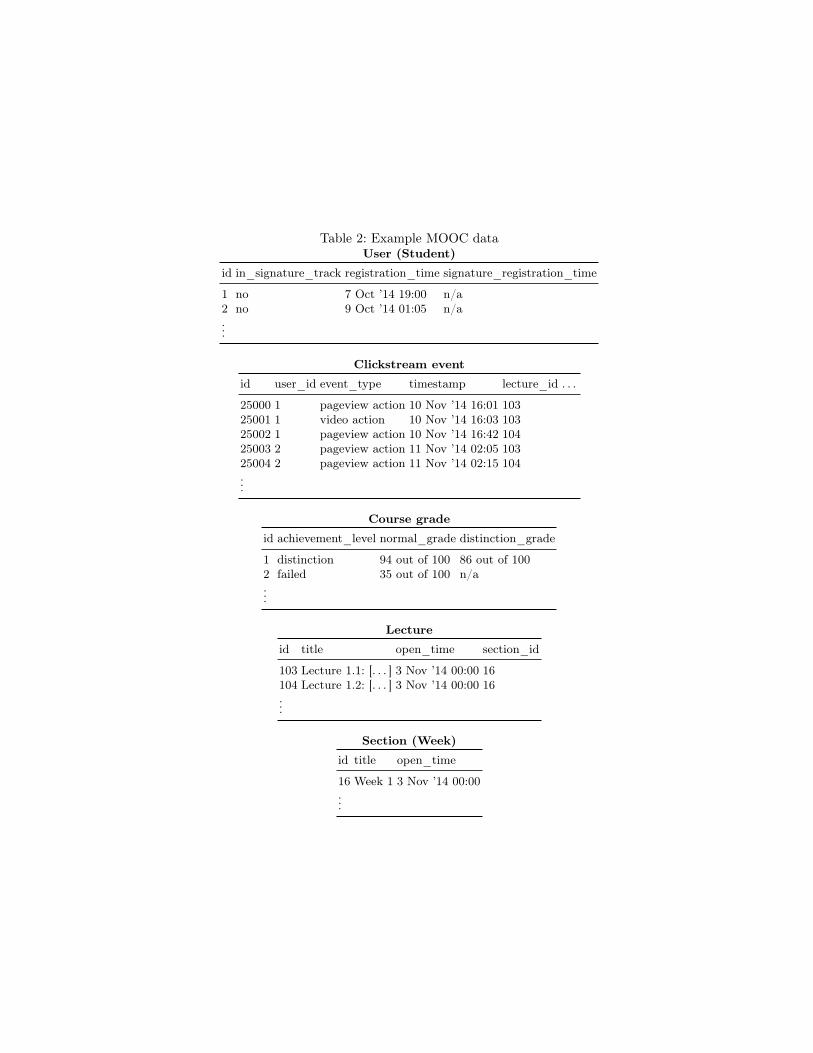
Table 2: Example MOOC dataUser (Student)
id in_signature_track registration_time signature_registration_time
1 no 7 Oct ’14 19:00 n/a2 no 9 Oct ’14 01:05 n/a...
Clickstream event
id user_id event_type timestamp lecture_id . . .
25000 1 pageview action 10 Nov ’14 16:01 10325001 1 video action 10 Nov ’14 16:03 10325002 1 pageview action 10 Nov ’14 16:42 10425003 2 pageview action 11 Nov ’14 02:05 10325004 2 pageview action 11 Nov ’14 02:15 104...
Course grade
id achievement_level normal_grade distinction_grade
1 distinction 94 out of 100 86 out of 1002 failed 35 out of 100 n/a...
Lecture
id title open_time section_id
103 Lecture 1.1: [. . . ] 3 Nov ’14 00:00 16104 Lecture 1.2: [. . . ] 3 Nov ’14 00:00 16...
Section (Week)
id title open_time
16 Week 1 3 Nov ’14 00:00...
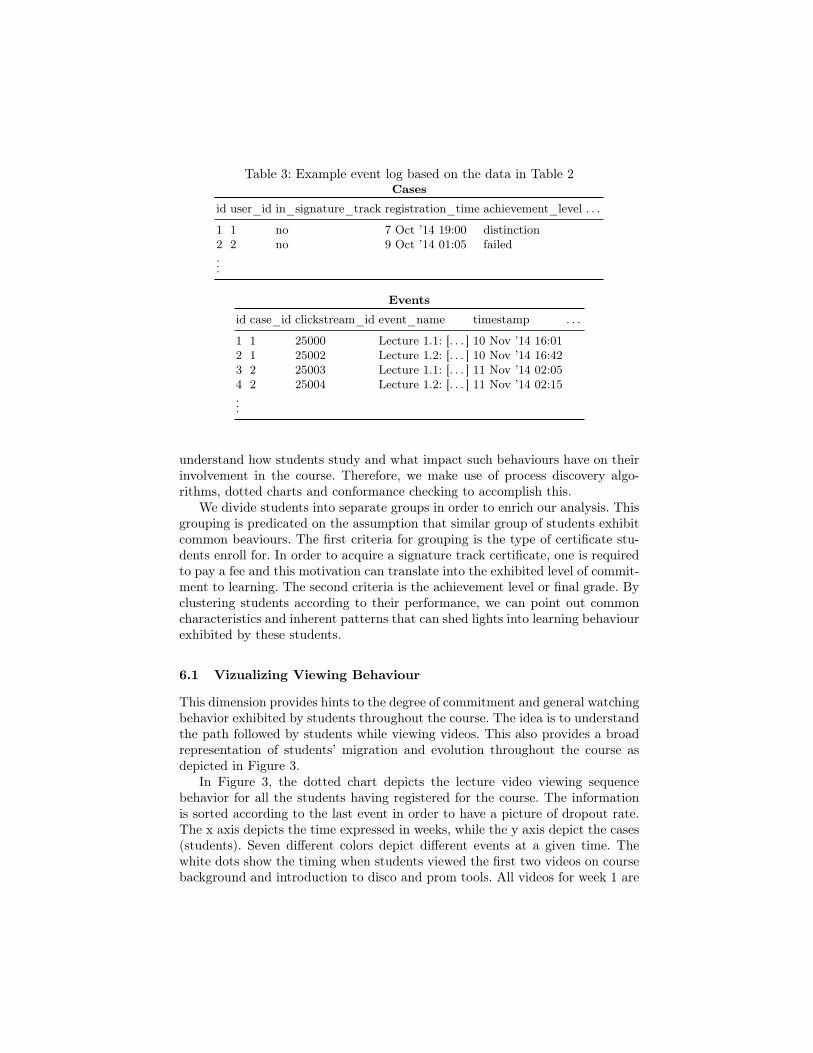
Table 3: Example event log based on the data in Table 2Cases
id user_id in_signature_track registration_time achievement_level . . .
1 1 no 7 Oct ’14 19:00 distinction2 2 no 9 Oct ’14 01:05 failed...
Events
id case_id clickstream_id event_name timestamp . . .
1 1 25000 Lecture 1.1: [. . . ] 10 Nov ’14 16:012 1 25002 Lecture 1.2: [. . . ] 10 Nov ’14 16:423 2 25003 Lecture 1.1: [. . . ] 11 Nov ’14 02:054 2 25004 Lecture 1.2: [. . . ] 11 Nov ’14 02:15...
understand how students study and what impact such behaviours have on theirinvolvement in the course. Therefore, we make use of process discovery algo-rithms, dotted charts and conformance checking to accomplish this.
We divide students into separate groups in order to enrich our analysis. Thisgrouping is predicated on the assumption that similar group of students exhibitcommon beaviours. The first criteria for grouping is the type of certificate stu-dents enroll for. In order to acquire a signature track certificate, one is requiredto pay a fee and this motivation can translate into the exhibited level of commit-ment to learning. The second criteria is the achievement level or final grade. Byclustering students according to their performance, we can point out commoncharacteristics and inherent patterns that can shed lights into learning behaviourexhibited by these students.
6.1 Vizualizing Viewing Behaviour
This dimension provides hints to the degree of commitment and general watchingbehavior exhibited by students throughout the course. The idea is to understandthe path followed by students while viewing videos. This also provides a broadrepresentation of students’ migration and evolution throughout the course asdepicted in Figure 3.
In Figure 3, the dotted chart depicts the lecture video viewing sequencebehavior for all the students having registered for the course. The informationis sorted according to the last event in order to have a picture of dropout rate.The x axis depicts the time expressed in weeks, while the y axis depict the cases(students). Seven different colors depict different events at a given time. Thewhite dots show the timing when students viewed the first two videos on coursebackground and introduction to disco and prom tools. All videos for week 1 are
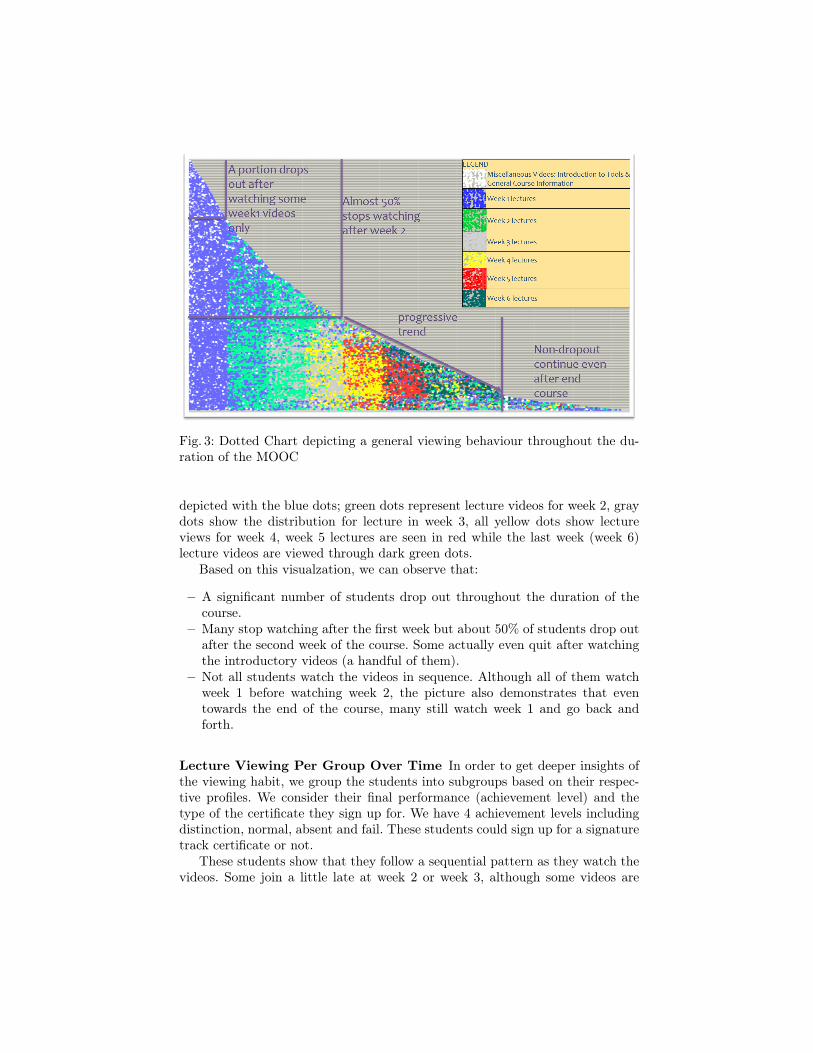
Fig. 3: Dotted Chart depicting a general viewing behaviour throughout the du-ration of the MOOC
depicted with the blue dots; green dots represent lecture videos for week 2, graydots show the distribution for lecture in week 3, all yellow dots show lectureviews for week 4, week 5 lectures are seen in red while the last week (week 6)lecture videos are viewed through dark green dots.
Based on this visualzation, we can observe that:
– A significant number of students drop out throughout the duration of thecourse.
– Many stop watching after the first week but about 50% of students drop outafter the second week of the course. Some actually even quit after watchingthe introductory videos (a handful of them).
– Not all students watch the videos in sequence. Although all of them watchweek 1 before watching week 2, the picture also demonstrates that eventowards the end of the course, many still watch week 1 and go back andforth.
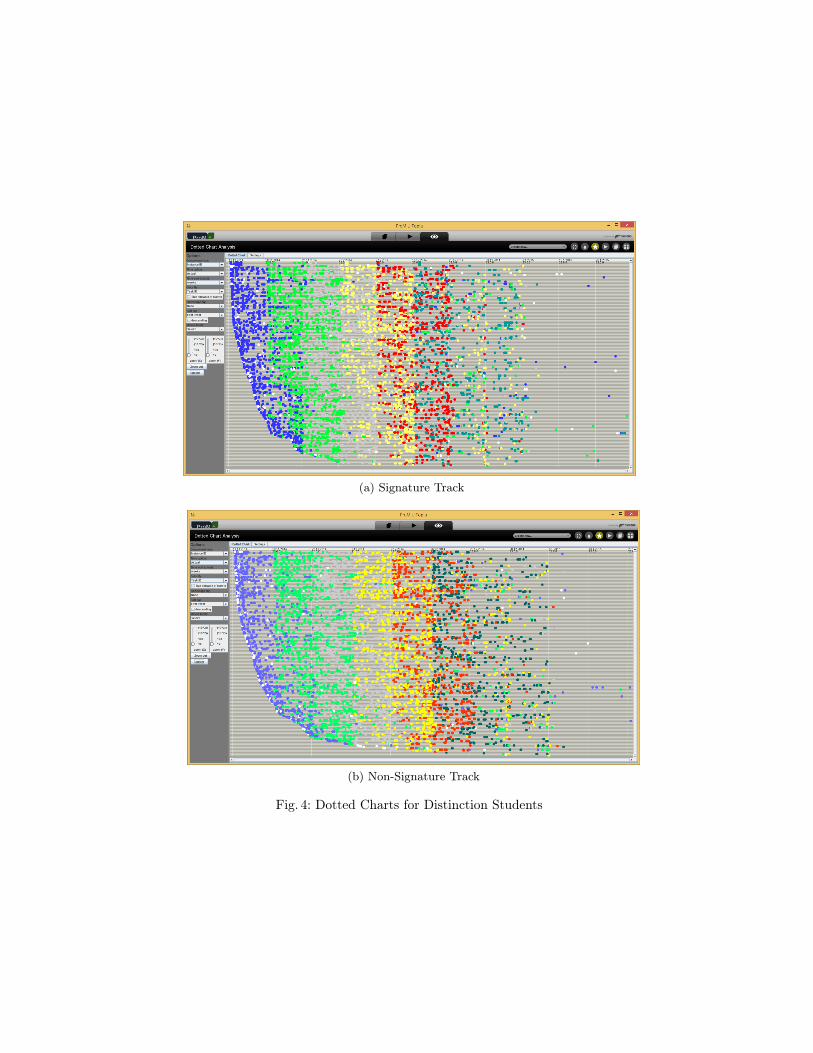
Lecture Viewing Per Group Over Time In order to get deeper insights ofthe viewing habit, we group the students into subgroups based on their respec-tive profiles. We consider their final performance (achievement level) and thetype of the certificate they sign up for. We have 4 achievement levels includingdistinction, normal, absent and fail. These students could sign up for a signaturetrack certificate or not.
These students show that they follow a sequential pattern as they watch thevideos. Some join a little late at week 2 or week 3, although some videos are
(a) Signature Track
(b) Non-Signature Track
Fig. 4: Dotted Charts for Distinction Students
rewatched in weeks later but the general trend remains that most of them watchvideossequentially as they are made available. This can be seen by looking atthe demarcation imposed by respective lecture videos colors.
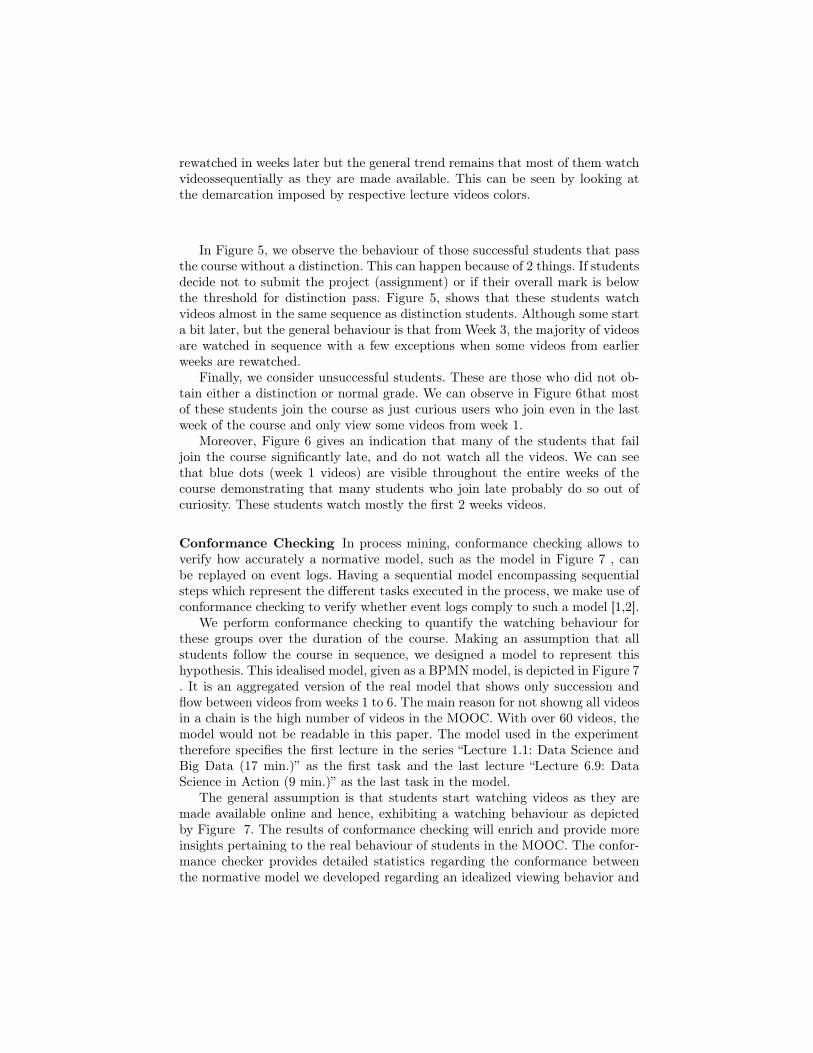
In Figure 5, we observe the behaviour of those successful students that passthe course without a distinction. This can happen because of 2 things. If studentsdecide not to submit the project (assignment) or if their overall mark is belowthe threshold for distinction pass. Figure 5, shows that these students watchvideos almost in the same sequence as distinction students. Although some starta bit later, but the general behaviour is that from Week 3, the majority of videosare watched in sequence with a few exceptions when some videos from earlierweeks are rewatched.
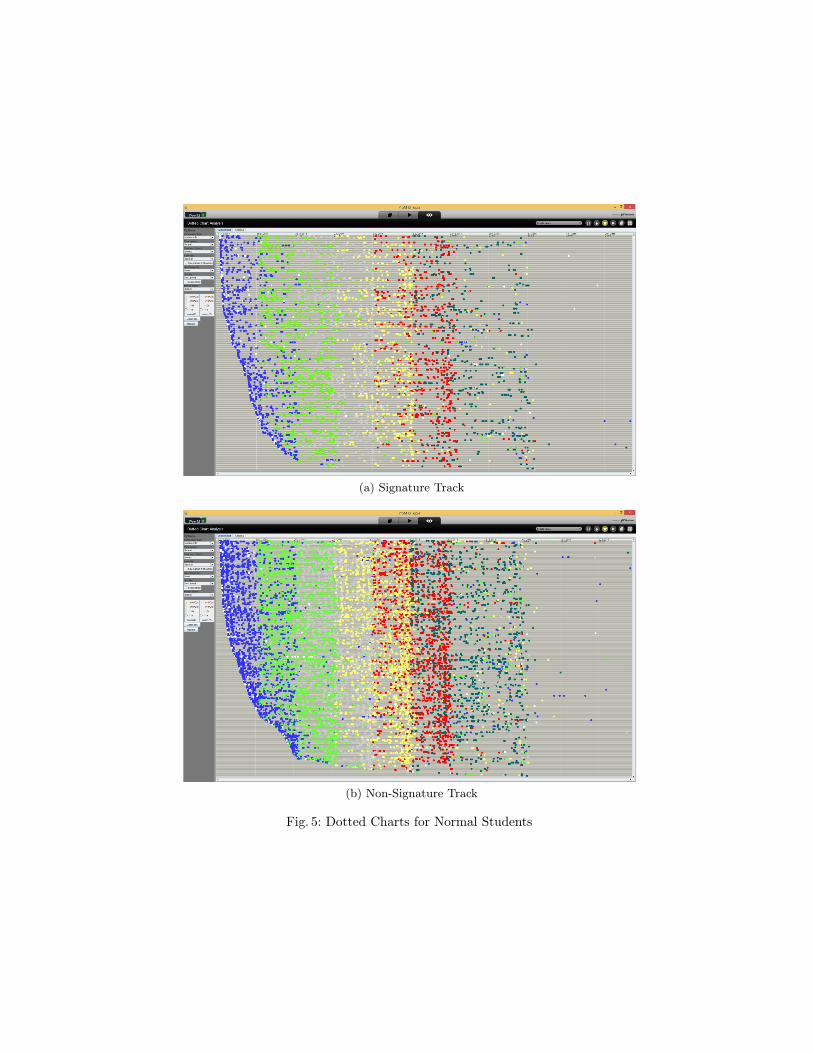
Finally, we consider unsuccessful students. These are those who did not ob-tain either a distinction or normal grade. We can observe in Figure 6that mostof these students join the course as just curious users who join even in the lastweek of the course and only view some videos from week 1.
Moreover, Figure 6 gives an indication that many of the students that failjoin the course significantly late, and do not watch all the videos. We can seethat blue dots (week 1 videos) are visible throughout the entire weeks of thecourse demonstrating that many students who join late probably do so out ofcuriosity. These students watch mostly the first 2 weeks videos.
Conformance Checking In process mining, conformance checking allows toverify how accurately a normative model, such as the model in Figure 7 , canbe replayed on event logs. Having a sequential model encompassing sequentialsteps which represent the different tasks executed in the process, we make use ofconformance checking to verify whether event logs comply to such a model [1,2].
We perform conformance checking to quantify the watching behaviour forthese groups over the duration of the course. Making an assumption that allstudents follow the course in sequence, we designed a model to represent thishypothesis. This idealised model, given as a BPMNmodel, is depicted in Figure 7. It is an aggregated version of the real model that shows only succession andflow between videos from weeks 1 to 6. The main reason for not showng all videosin a chain is the high number of videos in the MOOC. With over 60 videos, themodel would not be readable in this paper. The model used in the experimenttherefore specifies the first lecture in the series “Lecture 1.1: Data Science andBig Data (17 min.)” as the first task and the last lecture “Lecture 6.9: DataScience in Action (9 min.)” as the last task in the model.
The general assumption is that students start watching videos as they aremade available online and hence, exhibiting a watching behaviour as depictedby Figure 7. The results of conformance checking will enrich and provide moreinsights pertaining to the real behaviour of students in the MOOC. The confor-mance checker provides detailed statistics regarding the conformance betweenthe normative model we developed regarding an idealized viewing behavior and
(a) Signature Track
(b) Non-Signature Track
Fig. 5: Dotted Charts for Normal Students
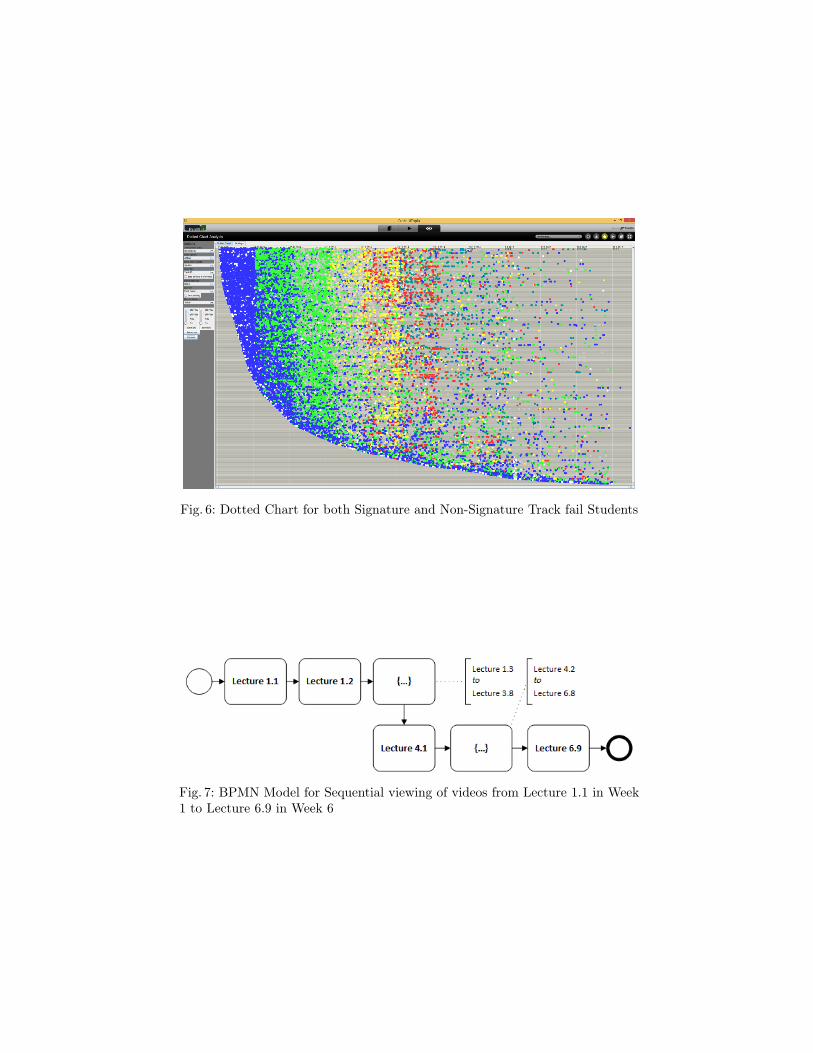
Fig. 6: Dotted Chart for both Signature and Non-Signature Track fail Students
Fig. 7: BPMN Model for Sequential viewing of videos from Lecture 1.1 in Week1 to Lecture 6.9 in Week 6
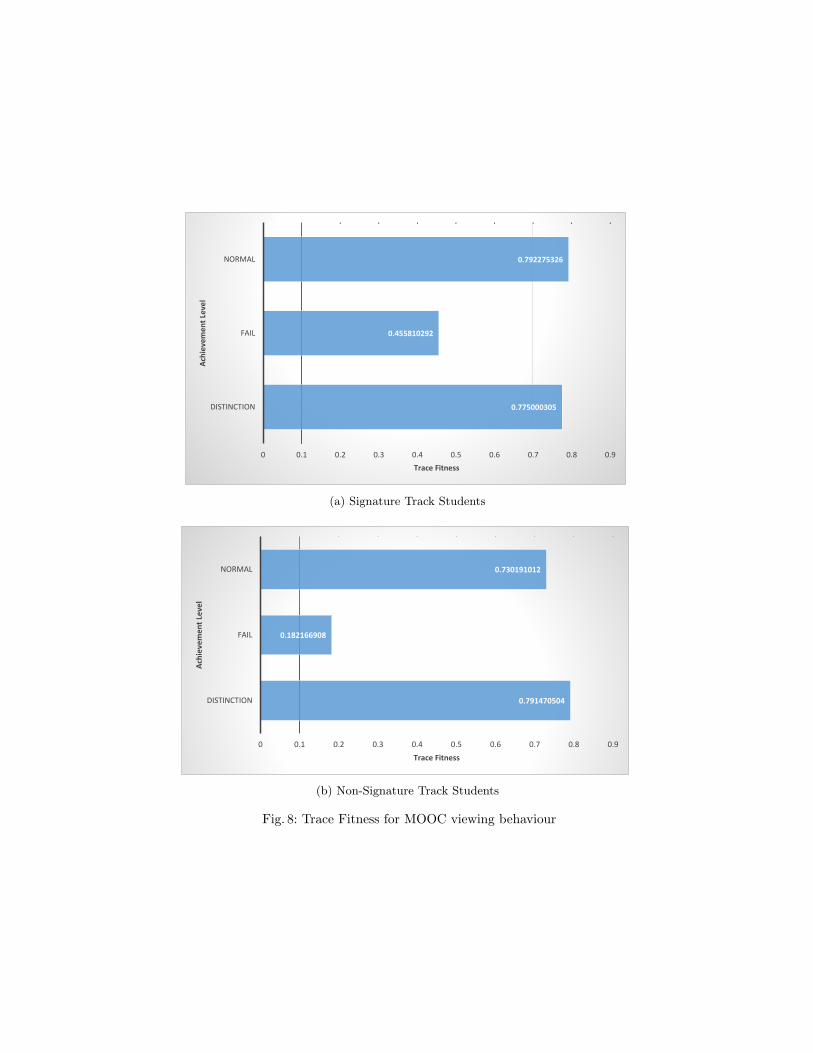
the event log. Primarily, we consider the trace fitness. This is a measurementexpressed between 0 and 1 to determine the level of conformance.
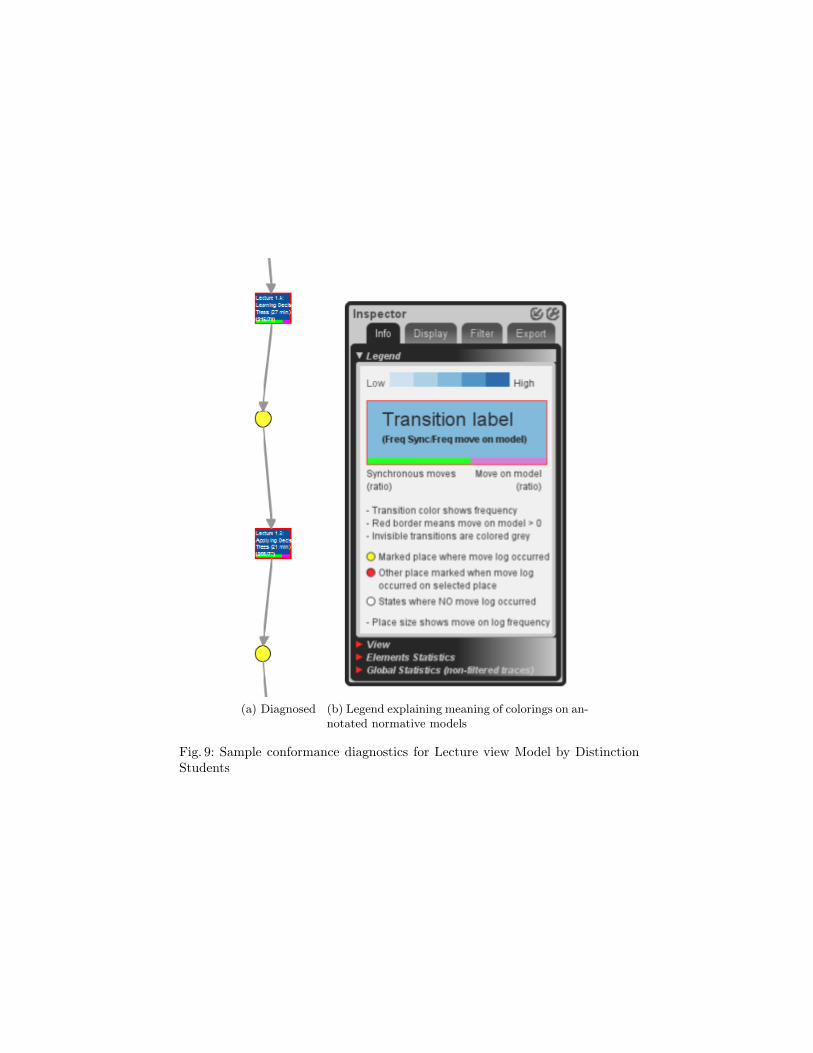
Figure 8 shows that sucessful students (distinction and normal) are morelikely to study sequentially than unsuccessful students(fail and absent). Thisseems like an obvious observation but a confirmation with conformance check-ing can help provide even more diagnostic details. Such details provide insightsand/or identify deviations between tasks (activities) that were thought to occur(as per model specification) but did not occur as specified based on the evidencefrom the log and vice versa. We include a part of the normative model annotatedwith diagnostic information for illustrative purposes.
In Figure 9, we illustrate a part of the normative model representation dis-tinction students’ behaviour as well as the corresponding legend depicting sllthe meanings to the corresponding colors as found in the model. The model isannotated with diagnostic information depicting possible deviations as a resultof conformance checking.
Process Discovery Process discovery entails learning a process model fromthe event log. In section 5, we explained how the event log is generated from theMOOC dataset. This log can be used as an input to a number of process miningalgorithms in order to visualize and eanact the real behaviour of students. Weconsider the fuzzy miner to mine our dataset. While we could mine all of oursubgroups and their corresponding logs, we consider for illustrative purposes 2extremes: the distinction students on signature track and failing students not onsignature track.The resulting models are displayed in Figure 10.
Figure 10 supports the findings observed in Sections 6.1.1 & 6.1.2 (dottedchart and conformance checker). The models indicate that distinction studentstend to have a more structured learning process in contrast with the studentswho failed. The failing students follow a very unstructured learning process thatexemplifies the volatitlity and unpredictability of the majority of participants.
6.2 Quiz Submissions
In order to enrich the exploration of students’ behaviour, one can also look at theway they submit their quizzes. Some participants can register and even watchvideos consistentely without taking the assessment. Some might not watch allvideos in any particular order but take the quizzes and perform well. Therefore,it is helpful to also focus on quizzes separately and observe how these groups ofstudents behave.
We can follow the same steps as in the previous analyses using process mining.However, we only mine the process model using the fuzzy model and considerthe dotted chart visualisation.
Figure 11 shows that students who passed follow a structured process insubmitting their weekly quizzes until the final quiz. With the exception of quizzes
Track
0.775000305
0.455810292
0.792275326
0 0.1 0.2 0.3 0.4 0.5 0.6 0.7 0.8 0.9
DISTINCTION
FAIL
NORMAL
Trace Fitness
Ach
ieve
me
nt
Leve
l
0.791470504
0.182166908
0.730191012
0 0.1 0.2 0.3 0.4 0.5 0.6 0.7 0.8 0.9
DISTINCTION
FAIL
NORMAL
Trace Fitness
Ach
ieve
me
nt
Leve
l
(a) Signature Track Students
Track
0.775000305
0.455810292
0.792275326
0 0.1 0.2 0.3 0.4 0.5 0.6 0.7 0.8 0.9
DISTINCTION
FAIL
NORMAL
Trace Fitness
Ach
ieve
me
nt
Leve
l
0.791470504
0.182166908
0.730191012
0 0.1 0.2 0.3 0.4 0.5 0.6 0.7 0.8 0.9
DISTINCTION
FAIL
NORMAL
Trace Fitness
Ach
ieve
me
nt
Leve
l
(b) Non-Signature Track Students
Fig. 8: Trace Fitness for MOOC viewing behaviour
(a) Diagnosed (b) Legend explaining meaning of colorings on an-notated normative models
Fig. 9: Sample conformance diagnostics for Lecture view Model by DistinctionStudents
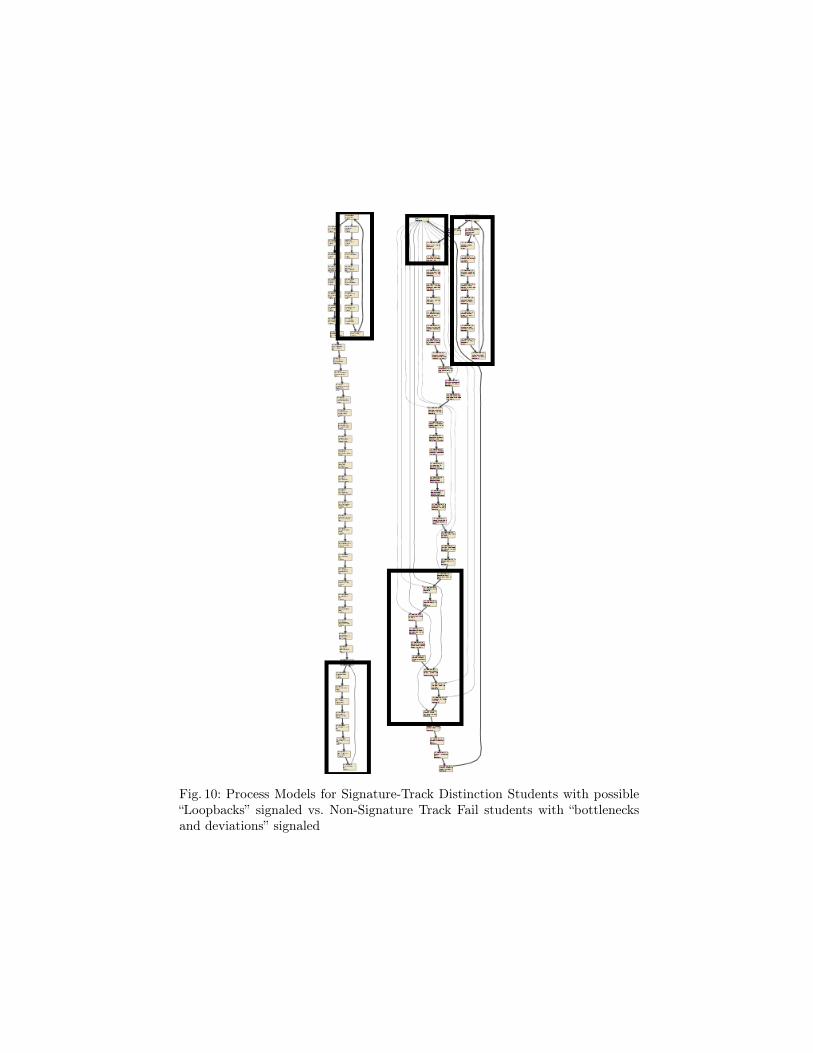
Fig. 10: Process Models for Signature-Track Distinction Students with possible“Loopbacks” signaled vs. Non-Signature Track Fail students with “bottlenecksand deviations” signaled
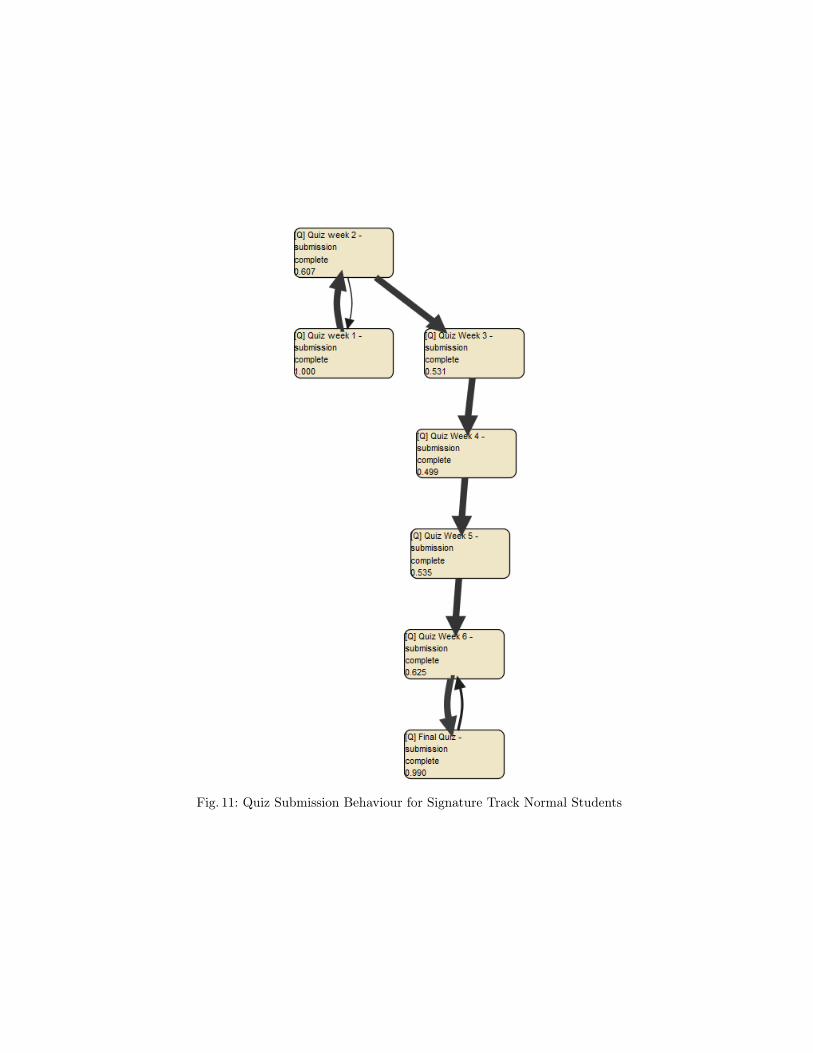
Fig. 11: Quiz Submission Behaviour for Signature Track Normal Students
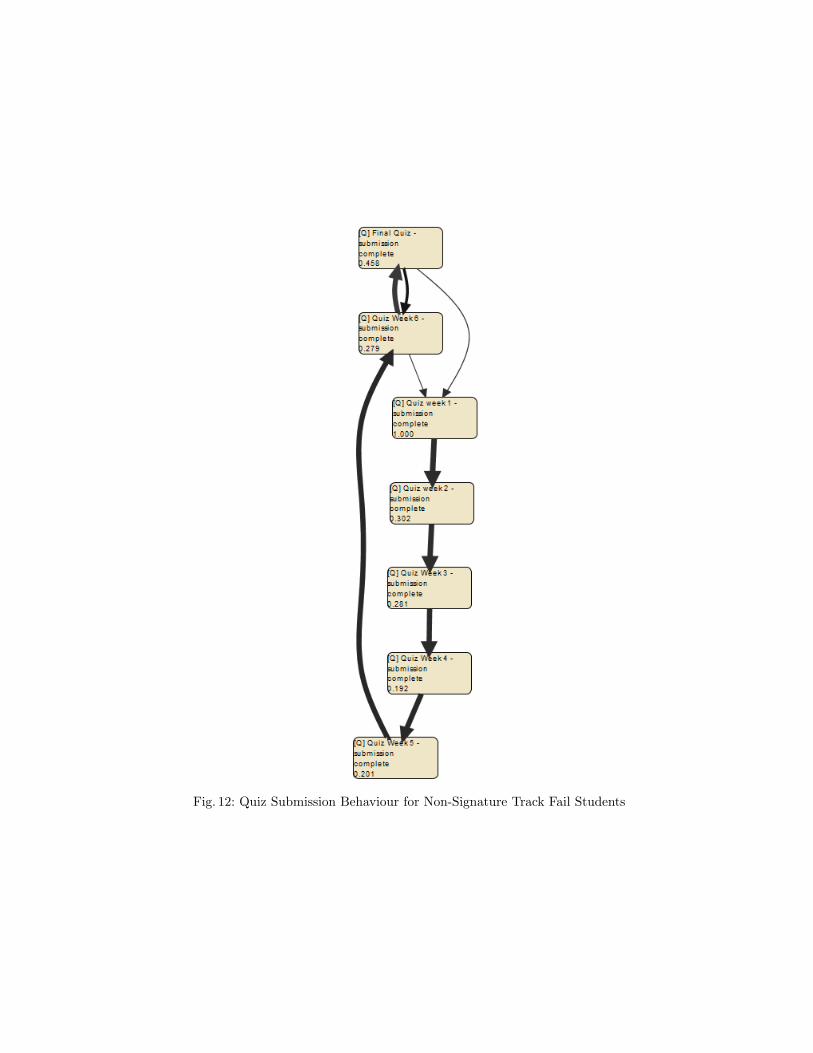
Fig. 12: Quiz Submission Behaviour for Non-Signature Track Fail Students
1 and 2, a small number of students do any of them in no particular order.The same happens with quiz 6 and the final quiz. However, some of the failingstudents take even quiz 1 after taking quiz 6 and final quiz as seen in Figure 12.Although both groups maintain mostly the same process, the completion ratesdiffer. To visualize these relative proportional differences, we make use of thedotted chart for all the subgroups as seen in Figures 14, 15 and 16. Figure 13provides detailed explanations of all the elements (dots) representing quizzes aswell as the relative deadlines.
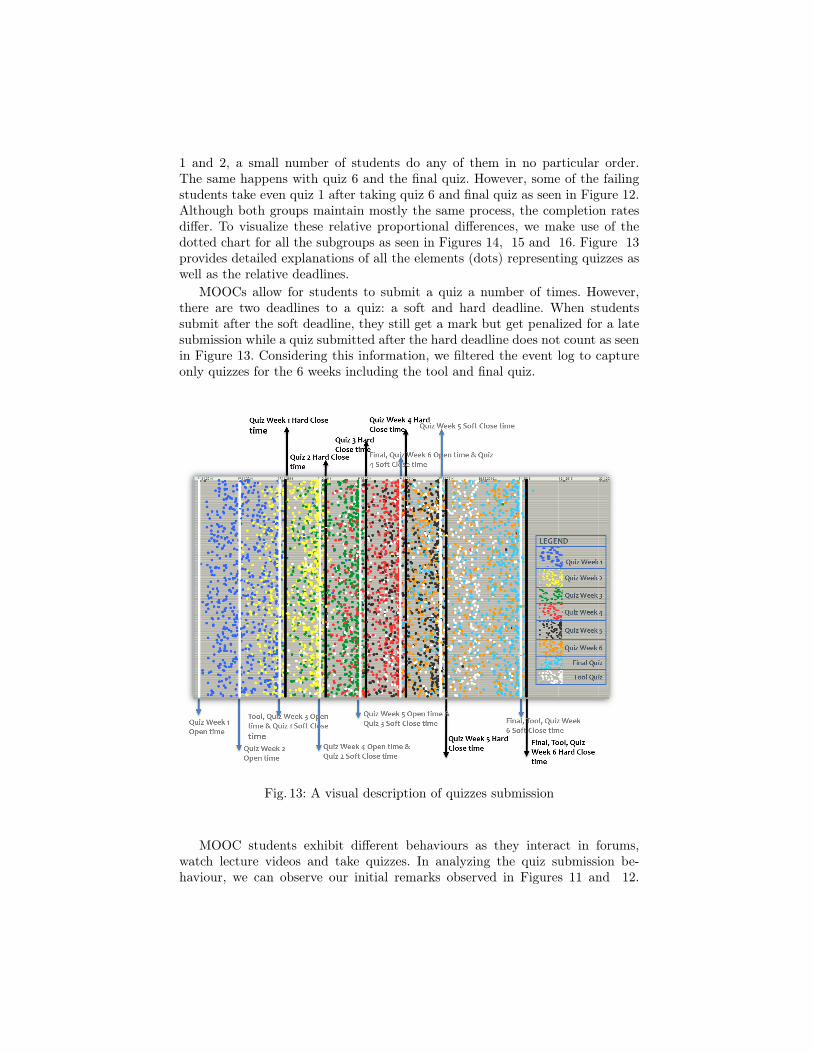
MOOCs allow for students to submit a quiz a number of times. However,there are two deadlines to a quiz: a soft and hard deadline. When studentssubmit after the soft deadline, they still get a mark but get penalized for a latesubmission while a quiz submitted after the hard deadline does not count as seenin Figure 13. Considering this information, we filtered the event log to captureonly quizzes for the 6 weeks including the tool and final quiz.
Fig. 13: A visual description of quizzes submission
MOOC students exhibit different behaviours as they interact in forums,watch lecture videos and take quizzes. In analyzing the quiz submission be-haviour, we can observe our initial remarks observed in Figures 11 and 12.
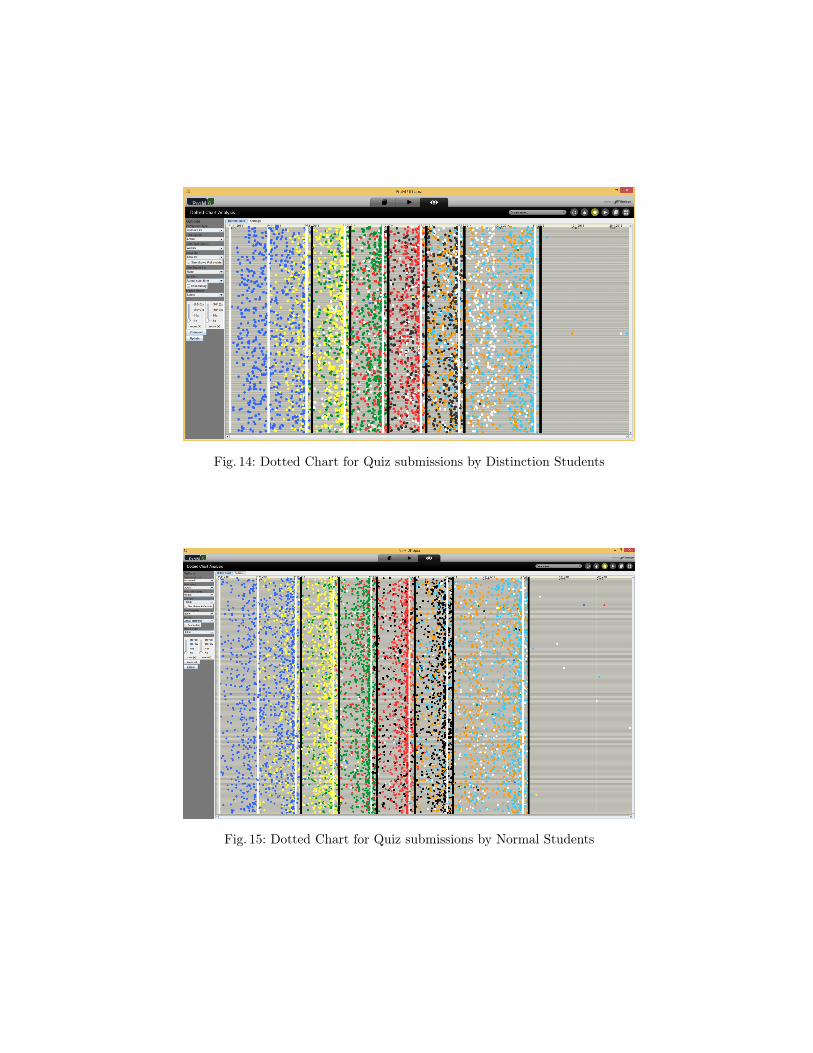
Fig. 14: Dotted Chart for Quiz submissions by Distinction Students
Fig. 15: Dotted Chart for Quiz submissions by Normal Students
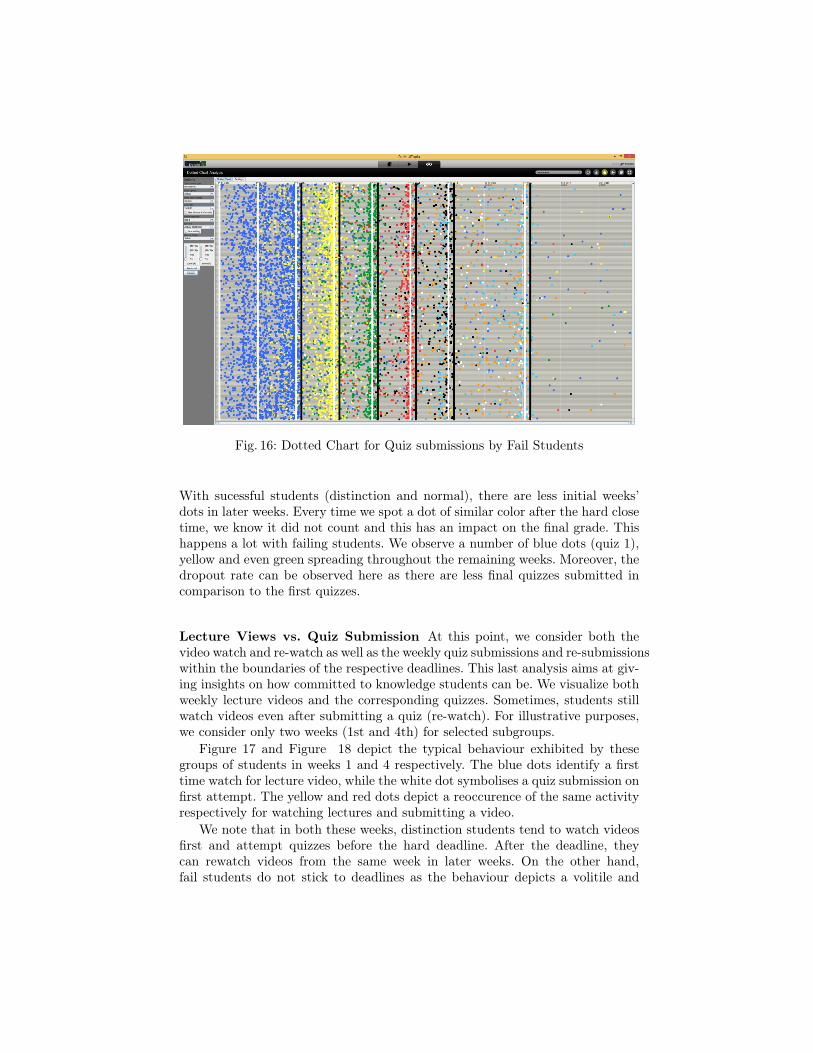
Fig. 16: Dotted Chart for Quiz submissions by Fail Students
With sucessful students (distinction and normal), there are less initial weeks’dots in later weeks. Every time we spot a dot of similar color after the hard closetime, we know it did not count and this has an impact on the final grade. Thishappens a lot with failing students. We observe a number of blue dots (quiz 1),yellow and even green spreading throughout the remaining weeks. Moreover, thedropout rate can be observed here as there are less final quizzes submitted incomparison to the first quizzes.
Lecture Views vs. Quiz Submission At this point, we consider both thevideo watch and re-watch as well as the weekly quiz submissions and re-submissionswithin the boundaries of the respective deadlines. This last analysis aims at giv-ing insights on how committed to knowledge students can be. We visualize bothweekly lecture videos and the corresponding quizzes. Sometimes, students stillwatch videos even after submitting a quiz (re-watch). For illustrative purposes,we consider only two weeks (1st and 4th) for selected subgroups.
Figure 17 and Figure 18 depict the typical behaviour exhibited by thesegroups of students in weeks 1 and 4 respectively. The blue dots identify a firsttime watch for lecture video, while the white dot symbolises a quiz submission onfirst attempt. The yellow and red dots depict a reoccurence of the same activityrespectively for watching lectures and submitting a video.
We note that in both these weeks, distinction students tend to watch videosfirst and attempt quizzes before the hard deadline. After the deadline, theycan rewatch videos from the same week in later weeks. On the other hand,fail students do not stick to deadlines as the behaviour depicts a volitile and
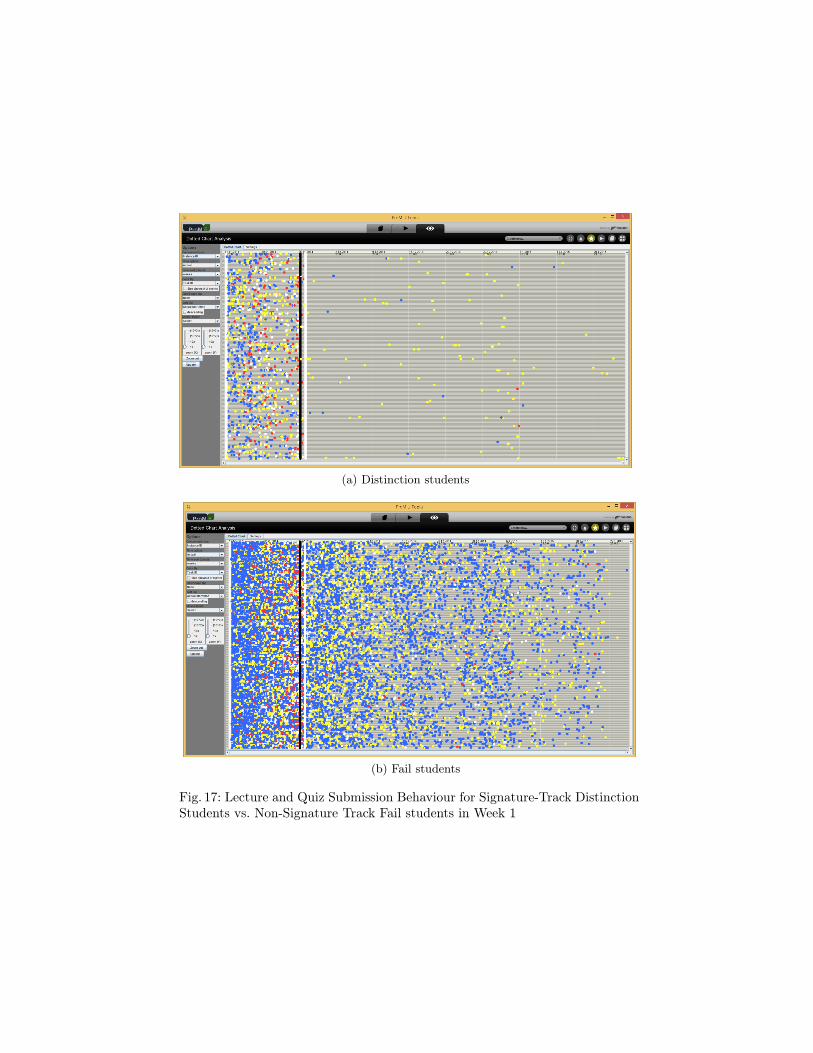
(a) Distinction students
(b) Fail students
Fig. 17: Lecture and Quiz Submission Behaviour for Signature-Track DistinctionStudents vs. Non-Signature Track Fail students in Week 1
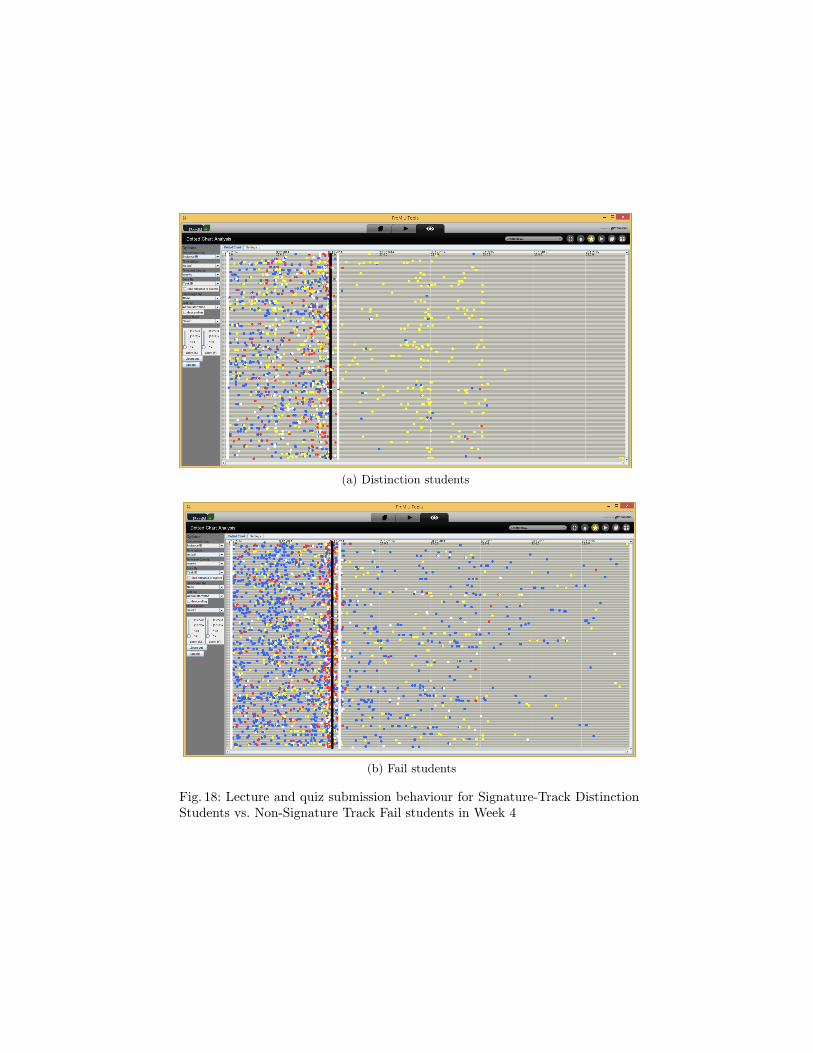
(a) Distinction students
(b) Fail students
Fig. 18: Lecture and quiz submission behaviour for Signature-Track DistinctionStudents vs. Non-Signature Track Fail students in Week 4
unpredictable behaviour. They watch videos even after the related quiz is closed(many blue dots after the white line) suggesting that there probabaly is nointerest in getting any results.
7 Conclusion
In this paper, we modeled and analyzed MOOC students’ learning behaviourusing a case study from TU/e. Given the popularity of MOOCs, issues of contentquality and delivery mode ought to be carefully studied.
While there is a plethora of individual and collective factors influencing stu-dents’ performance, by focusing on what is observable, one can forge an opinionof students’ study patterns and trigger appropriate actions. Process mining helpsreplay and visualize students’ footprints as they interact with the MOOC portalsthrough watching lecture videos and submitting quizzes.
We demonstrated that using the dotted chart, process discovery and con-formance checking, we can locate and categorize behavioural differences amongdifferent groups of students. Our observations indicate that succesful (distinctionand normal) students perform better because they follow the videos and submitquizzes in a more structured way than unsuccessful (fail) students. Knowing thatthe way students follow videos can have a direct impact on their final perfor-mance is paramount to organizing the course contents and the overall structure.
Furthermore, dotted charts provide a glipmse of watching behaviour thatcan be tracked. One can study the most interesting parts of the course or eventhe most skipped or most repeated videos in the series simply by looking atthe spread on the dashboard. Consequently, appropriate actions can be taken oreven further studies triggered in order to enhance behavioural studies.
References
1. van der Aalst, W.M.P.: Process Mining - Discovery, Conformance and Enhance-ment of Business Processes. Springer (2011)
2. Adriansyah, A., Munoz-Gama, J., Carmona, J., van Dongen, B.F., van der Aalst,W.M.: Alignment based precision checking. In: Business Process ManagementWorkshops. pp. 137–149. Springer (2013)
3. Arnold, K.E., Pistilli, M.D.: Course signals at purdue: using learning analytics toincrease student success. In: Proceedings of the 2nd International Conference onLearning Analytics and Knowledge. pp. 267–270. ACM (2012)
4. Baker, R.S., Inventado, P.S.: Educational data mining and learning analytics. In:Learning Analytics, pp. 61–75. Springer (2014)
5. Christensen, G., Steinmetz, A., Alcorn, B., Bennett, A., Woods, D., Emanuel, E.J.:The mooc phenomenon: who takes massive open online courses and why? Availableat SSRN 2350964 (2013)
6. Clow, D.: Moocs and the funnel of participation. In: Proceedings of the ThirdInternational Conference on Learning Analytics and Knowledge. pp. 185–189. ACM(2013)
7. Ferguson, R.: Learning analytics: drivers, developments and challenges. Interna-tional Journal of Technology Enhanced Learning 4(5-6), 304–317 (2012)
8. Kay, J., Reimann, P., Diebold, E., Kummerfeld, B.: Moocs: So many learners, somuch potential... IEEE Intelligent Systems (3), 70–77 (2013)
9. Liyanagunawardena, T.R.: Information communication technologies and distanceeducation in Sri Lanka: A case study of two universities. Ph.D. thesis, Universityof Reading (2012)
10. Liyanagunawardena, T.R., Adams, A.A., Williams, S.A.: Moocs: A systematicstudy of the published literature 2008-2012. The International Review of Researchin Open and Distributed Learning 14(3), 202–227 (2013)
11. Verbeek, H.M.W., Buijs, J.C.A.M., van Dongen, B.F., van der Aalst, W.M.P.:ProM 6: The process mining toolkit. In: Proc. of BPM Demonstration Track2010. vol. 615, pp. 34–39. CEUR-WS.org (2010), http://ceur-ws.org/Vol-615/paper13.pdf