Embed Size (px)
Citation preview
EXPLORING STAKEHOLDER PARTICIPATION IN NONPROFIT COLLABORATION
BY
KATHERINE R. COOPER
DISSERTATION
Submitted in partial fulfillment of the requirements
for the degree of Doctor of Philosophy in Communication
in the Graduate College of the
University of Illinois at Urbana-Champaign, 2014
Urbana, Illinois
Doctoral Committee:
Associate Professor Michelle Shumate, Chair
Professor M. Scott Poole
Professor John C. Lammers
Professor Thomas A. Schwandt
ii
ABSTRACT
In the face of large-scale societal or “wicked” problems, organizations are encouraged to
engage in network approaches to achieve impacts at a systems level. Collective impact
initiatives present numerous challenges in the coordination of resources and activities across
organizations and sectors, not least of which is accounting for diverse stakeholder perspectives.
Although nonprofit collaborative networks convened for the purpose of combating a social
problem may tout the idea of stakeholder participation, little is known about how diverse
stakeholders engage in the network.
Stakeholder theory provides the grounding for this research. Although this framework is
popular in management and in organizational studies, a lack of empirical work, an overemphasis
on singular corporations as focal organizations, and an overreliance on internal stakeholder
perspectives have stalled theoretical development. A nonprofit collaborative network convened
to tackle a social problem provides a unique setting for stakeholder theory, as well as a diverse
population of stakeholders typically ignored in organizational research.
This study explores stakeholder participation in “Community Reach,” a large,
interorganizational network comprised of economic, educational, civic, and nonprofit institutions
for the purposes of improving educational outcomes across a 10-county region in the Midwest.
This mixed-method development design consisting of interviews and surveys reveals stakeholder
relationships within Community Reach, the stakes represented in the network, and participation
in Community Reach, as well as benefits, barriers, and outcomes of stakeholder participation.
The research suggests several implications for collaborative networks as well as for
stakeholder theory. Findings reveal the reproduction of organizational problems across a
iii
network level, the realities of multi-organizational collaboration in response to a “wicked”
problem, the reduced role of traditional nonprofit organizations in network efforts, and the
communicative impacts of stakeholder participation in a collaborative network. In addition,
these findings suggest several future directions for stakeholder theory, including the emphasis of
stakeholder engagement over stakeholder management, a greater consideration of stakeholder
power structures within and across collaboration, and the application of stakeholder theory to a
problem domain rather than a focal organization. A new model for stakeholder participation in
response to a wicked problem draws from the findings of this research and suggests further
directions for stakeholder research.
iv
ACKNOWLEDGMENTS
I am grateful to the leaders of StriveTogether and “Community Reach” as well as to the
individuals who participated in this research.
With great appreciation for their expertise and counsel, I thank my committee: Scott
Poole, John Lammers, and Tom Schwandt, and most of all, my advisor extraordinaire, Michelle
Shumate, for being truly generous with her time, energy, and interest.
For their friendship and advice, I thank my OCLE colleagues, past, present, and
honorary: Yannick Atouba, Andrew Pilny, Elizabeth Carlson, Macarena Peña-y-Lillo, Melissa
Dobosh, and Julius Riles.
With gratitude for their encouragement and wisdom, I thank my friends and family who
were abundantly present during this season: Elissa Cooper, Rose MacHarg, Benjamin Cooper,
Allison Scott, and Matt Mongeon.
Finally, in appreciation and in awe of her many gifts, I dedicate this to my first teacher,
Dr. Lynn Oeffling Cooper.
v
TABLE OF CONTENTS
CHAPTER 1: Introduction .....................................................................................................1
CHAPTER 2: Literature Review ...........................................................................................8
CHAPTER 3: Method ...........................................................................................................47
CHAPTER 4: Results ............................................................................................................64
Tables and Figures .....................................................................................................84
CHAPTER 5: Discussion and Conclusion .........................................................................106
REFERENCES .....................................................................................................................156
APPENDIX A: Study Materials .........................................................................................177
APPENDIX B: Measures ....................................................................................................182
Stakeholder Identification Pre-Survey .......................................................................182
Interview Questions ...................................................................................................185
Stakeholder Survey.....................................................................................................186
1
CHAPTER 1: Introduction
In determining the best ways to improve educational outcomes in a community,
individuals are likely to differ in their opinions about where the community’s energies should be
focused. On one hand, schools unarguably play a large role in one’s education, yet few would
say the problem rests with teachers and administrators alone. After all, funding – government
and otherwise – plays a significant role in what schools are able to provide for students, and a
number of institutional factors are evident in attempts to evaluate student or school successes.
Others might point to family as a primary influence in children’s educational outcomes, while
still others might argue for greater consideration of social, cultural, or economic factors.
Improving educational outcomes is but one of many social concerns that may be
construed as “wicked problems.” Rittel and Webber (1973) argued that, in contrast to “definable
and separable” problems in the natural sciences, problems in governmental, social, or policy
planning are difficult to define and inherently unsolvable (p. 159). The coining of the phrase
“wicked” problem refers not to an evil situation, but rather to indicate the aggressive nature of a
social problem as well as difficulty in addressing the problem. The authors suggested that
planning problems are wicked problems, and they cite multiple challenges – poverty, urban
renewal, and school curriculum design – as problems that fit this nature. More recently, wicked
problems have been described as unstructured (as indicated by difficulties in identifying causes
and effects and little consensus in identifying problem or solutions), cross-cutting (as indicated
by the presence of multiple, interdependent stakeholders and diverse perspectives), and relentless
(in that problems cannot be solved “once and for all”) (Weber & Khademiam, 2008).
Nonprofit organizations have emerged in response to such problems. In 2010, it was
estimated that 2.3 million organizations operated in the United States, and this number represents
2
a 24% increase since 2000 (Roeger, Blackwood, & Pettijohn, 2012). However, the fact that so
many social problems persist despite the prevalence of organizations leaves some to conclude
that rather than form new organizations, existing organizations must be reconfigured to work
differently.
Improving educational opportunities is a fairly complex matter that necessitates multiple
approaches and diverse partners, which can only be accomplished through organizational
collaboration or networks. For example, StriveTogether combines partners from across
nonprofits, corporations, schools, and community- and faith-based organizations to join forces in
its Cradle to Career program to improve educational outcomes from early childhood to college
and beyond. This alliance is just one of many networks created in response to educational needs;
although networks such as this one are common, researchers know relatively little about the
stakes present in these collaborations and how various actors or stakeholders participate. The
purpose of this research is to explore how different stakeholders participate in a nonprofit
collaborative network and the outcomes that result from these forms of participation. By
understanding the role of these stakeholders, researchers and practitioners can build a body of
knowledge that will help identify relevant stakeholders often excluded from organizational
research and utilize their contributions for individual, organizational, and system-level outcomes.
This dissertation responds to two trends among nonprofit organizations. The first is the
idea of partnering with other organizations to increase one’s efforts. Interorganizational
collaboration is defined as “the set of communicative processes in which individuals representing
multiple organizations or stakeholders engage when working interdependently to address
problems outside the spheres of individuals or organizations working in isolation” (Keyton, Ford,
& Smith, 2008, p. 381). Collaboration is on the rise in the social sector; for example, Scearce
3
(2011) contrasted “network approaches” – the creation of social ties for purposes of accessing
diverse perspectives and sharing and building knowledge, the creation of infrastructure for
widespread knowledge, and the coordination of resources and actions – with “traditional
approaches” that consist primarily of administering social services and organizational
campaigns. The emphasis on collaboration lends itself to collective impact models, with
collective impact referring to “the commitment of a group of important actors from different
sectors to a common agenda for solving a specific social problem” (Kania & Kramer, 2011, p.
36). In order to accomplish more and better outcomes, this line of reasoning contends,
organizations must work together.
The idea that organizational partnerships generate more knowledge is related to the
second trend in the social sector: the inclusion of multiple stakeholders in organizational work.
A stakeholder is defined as “any group or individual who can affect or is affected by
achievement of the organization’s objectives” (Freeman, 1984, p. 25). For nonprofits,
stakeholders may include employees, donors, volunteers, organizational partners, and clients or
beneficiaries. Practitioners and researchers champion stakeholder participation in organizational
activity or decision making, but there is no accepted understanding of stakeholder participation
(Green & Hunton-Clarke, 2003). However, a number of models exist to identify and classify
stakeholder participation for different organizational, policy, and development contexts (see
Arnstein, 1968; Lewis, 2011; Lynam et al., 2007; Pretty, 1995; Wandersman, 1979); such
models typically encourage more stakeholder involvement or engagement.
Although the idea of organizational partnerships for collective impact and the inclusion
of multiple stakeholders may sound like obvious solutions for organizations working towards
social change, these tactics suggest a number of challenges. Scearce (2011) acknowledged that
4
there are barriers to adopting network approaches and, although the idea of including nonprofit
stakeholders seems to be common sense, collecting beneficiary responses may be difficult,
expensive, and uncomfortable for the organization (Twersky, Buchanan, & Threlfel, 2013). But
the promise of these approaches – as well as the challenges of their implementation – suggests an
exciting and vital area for organizational research.
Most stakeholder research presupposes a corporate context, but a nonprofit setting invites
a number of possibilities for furthering stakeholder theory as well as better understanding how
organizational activities impact a broader community. For one, focus on a nonprofit context
frees the researcher from concerns that stakeholder theory is incompatible with business, as is
frequently argued in management literature. Although nonprofit organizations also rely on
transactions of financial resources, nonprofit stakeholders wield other resources that are
underrepresented in stakeholder research. Thus, further research is needed as to how the idea of
a corporate competitive advantage suggested by stakeholder theory may be represented in
nonprofit organizations. Additionally, the normative components of stakeholder theory that
have, in some opinions, overtaken the business literature do not seem as out of proportion in
nonprofit organizations whose mission is a social good. Perhaps most importantly, the
application of stakeholder theory to nonprofit collaboration provides an opportunity to explore
more complex stakeholder perspectives (such as volunteers and clients) than those that are
typically represented in stakeholder research (employees).
The research reported here explores stakeholder participation in “Community Reach,” a
nonprofit collaborative network affiliated with StriveTogether and designed to improve
educational outcomes from cradle to career. This collaboration consists of nearly 100
organizational partners, resulting in a myriad of network stakeholders from schools, nonprofit
5
organizations, government agencies, and local employers across 10 counties in a Midwestern
state. The dissertation explores, through interviews and surveys, how various stakeholders
participate in the collaboration, to what extent their participation varies by stakeholder role, how
stakeholders interact with one another, and whether outcomes result from stakeholder
participation in the collaboration.
Research questions, examined in this study, pertain to stakeholder perspectives in
nonprofit collaboration and fill several gaps in stakeholder and organizational research. The
inclusion of diverse stakeholders in underexplored organizational perspectives fills several gaps
by providing the non-employee perspective typically missing from organizational research, and
the nonprofit, collaborative context allows for a greater range of stakeholders and stakeholder
interaction than those previously considered in organizational research. The study also explores
new organizational forms present in a nonprofit network and illustrates the outcomes of various
forms of participation.
The research makes several contributions. First, several implications for collaborative
networks are suggested, including the reproduction of organizational challenges at a network
level, the realities of collaboration in response to a “wicked” problem, the reduced role of
nonprofit organizations and communicative impacts of stakeholder participation in this model.
Additionally, several future directions for stakeholder theory are discussed, including an
emphasis on stakeholder engagement over management, reconsideration of stakeholder power
relationships in collaboration, and the use of stakeholder theory to explore stakes exercised in a
problem domain.
This study examines nonprofit stakeholder participation in interorganizational
collaboration through a case study of a nonprofit, collaborative network dedicated to improving
6
educational outcomes. Chapter 2 reviews the literature on stakeholder theory and
interorganizational collaboration, with an emphasis on nonprofit organizations. The literature
includes an overview of Freeman’s (1984) stakeholder theory, key developments in stakeholder
theory, and criticisms of the theory. In addition, I include a brief review of stakeholder theory in
a communicative context and in a nonprofit context. The literature on collaboration includes
definitions and approaches to interorganizational collaboration, including forms of collaboration,
reasons for collaborations, outcomes of collaboration, and a review of stakeholders in
collaboration. This chapter concludes with research questions, followed by the research methods
in Chapter 3.
Chapter 3 introduces the dissertation as a mixed method development study (Greene,
2007) that consists of a pre-survey to identify stakeholders, interviews with a representative
sample of stakeholders, and a survey of Community Reach stakeholders. Measures, participants,
and procedures are explained in each phase of data collection. In addition, I provide an overview
of StriveTogether, the parent network of Community Reach, as well as Community Reach itself.
Chapter 4 provides an overview of the results. Results are organized by research
questions on stakeholder relationships, stakes represented in the collaboration, stakeholder
participation, stakeholder differences across participation, and stakeholder outcomes of
participation.
Discussion and conclusion follow in Chapter 5. In this chapter, I comment on the results,
using qualitative examples to further illustrate the quantitative findings detailed in the previous
chapter. I also highlight the implications of these findings and suggest contributions of the
study, with an emphasis on how these findings inform further developments in stakeholder

7
theory. A model of stakeholder participation in response to a wicked problem is suggested in
light of these findings, followed by limitations of this study and future directions for research.
8
CHAPTER 2: Literature Review
A review of literature for both stakeholder theory and organizational collaboration is
helpful in order to understand the complexities of stakeholder participation in nonprofit
collaboration. The first section explores the stakeholder concept, introduces stakeholder theory
as the theoretical orientation for this research, and suggests research questions pertaining to
stakeholder relationships. This section is followed by an overview of interorganizational
collaboration, with an emphasis on how stakeholders participate in and navigate such processes.
Research questions inquire as to what stakes are represented in the Community Reach
collaboration, how stakeholders participate in Community Reach, whether different stakeholders
participate in the collaboration differently, and what outcomes result from stakeholder
participation. Throughout, the nonprofit context is emphasized as a unique application for both
the stakeholder concept as well as stakeholder interaction in a collaborative setting.
Who is an Organizational Stakeholder?
The concept of “stakeholder” emerged in the 1960s at the Stanford Research Institute,
where it was used in place of the more limiting “stockholder” to describe other groups that an
organization was dependent on for survival. Freeman’s (1984) book is generally credited with
formalizing the approach to stakeholder management that gained traction in the 1980s and 90s.
A stakeholder is defined as “any group or individual who can affect or is affected by
achievement of the organization’s objectives” (Freeman, 1984, p. 25). This definition, used in
this study, is the most commonly cited definition of stakeholders, and it appears extensively
across disciplines including business, management, communication, environmental science, and
nonprofit studies.
9
Freeman’s (1984) definition of stakeholders allows for a number of different entities to
claim stakes in an organization, among them customers, suppliers, the financial community,
employees, consumer advocates, and environmentalists. Because of the variety of groups
covered in this definition, some argued that Freeman’s description on its own is too broad to be
helpful in identifying stakeholders (see Mitchell, Agle, & Wood, 1997). The same criticism
could be leveled against other stakeholder definitions; Lewis (2011) defined stakeholder simply
as those who “have a stake in an organization’s process and or outputs” (p. 4). This hardly
narrows down the number of people or entities that may be considered stakeholders, as Lewis
acknowledged that those stakes may be classified as financial, environmental, physical or
symbolic. Though the term “stakeholder” may appear to be a catch-all term, Freeman (1984)
thought it important for managers to consider all these groups as stakeholders, and in more recent
work, acknowledged that scholars were unlikely to agree on the same definition for stakeholder
(Freeman, Harrison, Wicks, Parmar, & DeColle, 2010).
Despite these relatively straightforward definitions, Freeman (1984) acknowledged that
the stakeholder view of the firm he suggests is “enormously oversimplified” (p. 25) because each
stakeholder group can be broken down, and all within each stakeholder category (for example,
employees) may have differences. Additionally, other scholars have sought to further develop
the definition by creating different classifications of stakeholders. For example, stakeholders
have been classified as either internal or external (see Lewis, 2001; Brickson, 2007). Eesley and
Lenox (2006) referred to Clarkson’s (1995) distinction between primary and secondary
stakeholders, or those who may not have formal, contractual, or legal ties to the firm. Other
distinctions abound; a review of stakeholder literature conducted by Laplume, Sonpar, and Litz
10
(2008) also cited work in which stakeholders were described as cooperative/competitive
(Freeman, 1984), and derivative/normative (Phillips, Freeman, & Wicks, 2003).
Although scholars may not have determined a more precise or limiting definition, an
ongoing consideration in the definition of stakeholder is the role of legitimacy. Freeman (1984)
claimed that anyone with a stake in the organization is legitimate in that they can affect the
organization, regardless of managerial considerations for the stakeholder; from a managerial
standpoint, managers should “give legitimacy” to stakeholders who can affect the group even if
managers think that stakeholder demands are “inappropriate” (p. 45). In Freeman’s view,
although there is such a thing as a non-stakeholder, there are also those stakeholders for whom
legitimacy may be suspect. Mitchell, Agle, and Wood (1997) further developed and explored the
concept of legitimacy in their frequently cited piece on stakeholder salience. Legitimacy is one
of three attributes (alongside power and urgency) that are used to identify stakeholders, and the
presence or absence of these attributes should in turn influence a manger’s response to the
stakeholder. Freeman continues to discuss and define legitimacy in recent work, suggesting that
the current view of legitimacy is rooted in a view that suggests managers have moral obligations
to go beyond organizational self-interest instead of earlier interpretations of legitimacy that were
limited to organizational self-interest (Freeman et al., 2010). Other scholars continue to develop
and explore the concept of legitimacy as described by Mitchell, Agle, and Wood (1997), seen in
Neville, Bell, and Whitewell’s (2011) argument for increased emphasis on the relevance of
legitimacy in identifying stakeholders or Sonpar, Pazzaglia, and Kornijenko’s (2009) exploration
of legitimacy and interpretations of legitimacy in a longitudinal study of Canadian healthcare
organizations’ responses to stakeholders.
11
The role of stakeholder legitimacy and indeed, the problem of stakeholder identification
prove to be challenges for the stakeholder approach. However, despite these considerations,
stakeholder theory continues to be popular among organizational scholars who often adapt the
stakeholder concept for various contexts. The next section summarizes key developments in
theory as well as criticisms of the stakeholder approach.
Stakeholder Theory: An Overview
Although some scholars have expressed concern that the stakeholder concept is too
broad, others argue that the breadth of the definition is in fact a strength of both the stakeholder
concept and stakeholder theory (see Phillips, Freeman, & Wicks, 2003). Stakeholder theory
emerged in opposition to stockholder theory (Laplume, Sonpar, & Litz, 2008), and, though
Freeman (1984) is commonly thought of as the creator of stakeholder theory, more substantial
theoretical advancements have been made by others. In particular, Donaldson and Preston (1995)
and Mitchell, Agle, and Wood (1997) have had perhaps the most influence on developments in
stakeholder theory (see Koschmann, 2007).
Donaldson and Preston (1995) described stakeholder theory as consisting of three distinct
theoretical components: descriptive (employing the use of stakeholder to describe organizational
operations), normative (for the purposes of developing moral guidelines to determine managerial
responses to stakeholders), or instrumental (to explore the connections – or lack thereof –
between stakeholder management and corporate objectives). Donaldson and Preston’s article
can be seen as an argument for descriptive stakeholder theory in terms of understanding factual
claims about what managers and companies do, for instrumental stakeholder theory in terms of
exploring outcomes of managerial action, and for normative stakeholder theory in that it asks
what managers or organizations should do (Freeman et al., 2010). Donaldson and Preston
12
(1995) are primarily concerned with the normative approach, referring to it as the “core” of
stakeholder theory, with descriptive and interpretive approaches being somewhat peripheral.
Additionally, the authors acknowledge that the three may be related, but each branch of theory is
distinctive in its own right. Other authors may see more combinations than were advocated by
Donaldson and Preston; Butterfield, Reed, and Lemak (2004) suggested that these approaches
are sometimes blended or overlap with one another, though they argued the descriptive direction
has been the least developed.
Mitchell, Agle, and Wood (1997) provided another oft-cited approach to stakeholders. In
their seminal work, the authors focused on criteria for identifying stakeholders in their theory of
stakeholder salience. The authors argued that the stakeholder concept is so broad that more work
on identification is needed to determine who is a stakeholder, who is not, and who warrants a
manager’s attention. They suggested that stakeholders can be identified by power to influence,
legitimacy of relationship, and urgency of the stakeholder’s claim. These three criteria are
combined with other variables and socially constructed stakeholder attributes to warrant a
managerial response; in the authors’ typologies, stakeholders may be classified as dominant,
dangerous, definitive, dependent, dormant, discretionary, or demanding.
In addition to these frequently cited variations on stakeholder theory, the theory has been
adapted into new variations or blended with existing theories to create a staggering number of
interpretations. Stakeholder theory has been mentioned alongside or combined with resource
dependence and transaction cost theories (Mitchell, Agle, & Wood, 1997), agency theory (Ryan
& Schneider, 2003; Mitchell, Agle, & Wood, 1997), theory of the firm (Bouckaert &
Vandenhove, 1998), theory of justice (Jenson & Sandström, 2011), globalization theory (Jenson
& Sandström, 2011), and principal agent theory (Van Puyvelde, Caers, Du Bois, & Jegers,
13
2011). The three theoretical directions originally suggested by Donaldson and Preston (1995)
have been further explored, including Jones’s (1995) development of instrumental theory,
additions to descriptive theory consisting of resource dependence theory, prospect theory,
organizational life cycles (Jawahar & McLaughlin, 2001), and the application of normative
frameworks including the common good and critical theory (see Laplume, Sonpar, & Litz,
2008). Stakeholder theory has been infused with social capital (Cots, 2011), used in
explanations of corporate social responsibility (Arenas, Lozano, & Albareda, 2009; Jamali,
2008), adapted to be “enlightened” (Jenson & Sandström, 2011), revised as convergent
stakeholder theory (Jones & Wicks, 1999), and developed into relationship marketing theory
(Knox & Gruar, 2007).
The fact that stakeholder theory is so easily blended with existing theories or
appropriated into new theories may account for some of its popularity; another advantage of
stakeholder theory is its practical value for organizational leaders. Stakeholder management
refers to the maintenance and improvement of relationships with stakeholders (Smudde &
Courtright, 2011), and stakeholder relationships have been linked to organizational effectiveness
(see Koschmann, 2007; Balser & McCluskey, 2005) and outcomes (see Freeman, 1984;
Laplume, Sonpar, & Litz, 2008). “Stakeholder” has become a buzzword of sorts, appearing not
just in academic research but in ethical debates and political circles; former Prime Minister Tony
Blair’s invocation of a “stakeholder economy” in Britain was cited as proof that the idea had
gone beyond academic circles (see Laplume, Sonpar, & Litz, 2008; Philips, Freeman, & Wicks,
2003). That stakeholder is a recognizable term across disciplines is also a sign of its growth; in
his 1984 book, Freeman argued for further exploration of the stakeholder concept in relation to
14
other fields such as organizational theory, economics, and political science in order to develop
the stakeholder approach into a full theory of management.
Although the many interpretations of stakeholder theory would seem to indicate the
theory’s popularity – and indeed, “stakeholder” is a commonly used term, particularly in
management – a number of criticisms persist. Some of the criticism comes from within
management or business. Although Freeman (1984) argued that minding stakeholders should
result in a competitive advantage (see also Jones, 1995), some researchers found stakeholder
theory to be at odds with business because it is impossible for a firm to please all stakeholders
(see Jensen & Sandström, 2011; Sternberg, 2002). Others took issue with the boundary
conditions of stakeholder theory (Jensen & Sandström, 2011), and a number of scholars
expressed concerns with the normative components of the theory, arguing that the ethical or
moral components of the theory have overtaken the strategic concerns within stakeholder
management (see Hasnas, 2012; Jensen & Sandström, 2011; Laplume, Sonpar, & Litz, 2008).
But the most significant criticism leveled against stakeholder theory is whether it is truly a theory
at all; some scholars within management – as well as communication – argue that it is not.
Among communication scholars, Lewis (2007) plainly stated that stakeholder theory is
“not a theory in the strictest sense” (p. 178). Koschmann (2007) attributed the “groundwork” of
stakeholder theory to Freeman (1984) but argued that no true theoretical developments were
made until Donaldson and Preston (1995); even then, many of the theoretical developments
borrowed from other theories as previously described. Scholars questioned whether an empirical
theory exists (see Tevino & Weaver, 1999, in Koschmann, 2007), and indeed, some scholars
seeking to do empirical work on the stakeholder concept sidestepped stakeholder theory
altogether (see Nowell, 2009). Jones (1995) was among the first to point out that many of
15
stakeholder theory’s propositions had not been empirically validated, and this was still the case
over a decade later when Laplume, Sonpar, and Litz (2008) conducted an extensive review of
179 articles that utilized Freeman’s stakeholder theory. Freeman (1984) seemed to anticipate
these concerns somewhat in that he acknowledged that practical theories are attacked for a lack
of rigor. He ultimately championed “conceptual rigor” over empirical development, concluding
that “it is not necessary for the theory to be empirically tested for it to be true. However, the
more empirical evidence there is for the propositions of the theory, the more confidence we have
in it” (p. 48). Some researchers, even those who rely on the term “stakeholder” as well as some
of the theoretical constructs, do not recognize it as a fully realized theory. Although these
concerns persist, the criticism has not lessened enthusiasm for stakeholder theory within
organizational research.
Although the interest in the stakeholder concept remains high, the lack of empirical
research may have slowed theoretical development. In recent years, researchers have sought to
clarify and summarize stakeholder theory, drawing different conclusions as to the theory’s
current status. At the conclusion of their extensive review, Laplume, Sonpar, and Litz (2008)
concluded that stakeholder theory has “plateaued.” Others see many areas of future
development; Freeman et al.’s (2010) book suggests a number of areas for future research to
advance the theory, including stakeholder interaction effects, stakeholder relationships over time,
and the development of stakeholder metrics. In particular, the call to study stakeholder
interaction and stakeholder relationships suggests potential for communication scholars to further
the development of stakeholder theory.
16
Stakeholder theory in a communicative context.
Current theoretical work on stakeholder theory tends to focus largely in management
literature, although some other disciplines, including communication, have referenced it.
However, stakeholder theory has received relatively little attention from communication
scholars. Communication research on stakeholder approaches have been emphasized throughout
this review, and this study seeks to highlight communicative implications of stakeholder
participation.
In the immediate years following Freeman’s (1984) publication, Deetz was one of the
communication scholars to focus on stakeholder engagement and the term “stakeholder” has
appeared in recent organizational communication research. Bruce and Shelley (2010) picked up
Deetz’s argument that stakeholder engagement is communication in their study of stakeholder
engagement best practices. More recently, Lewis’s (2011) book referred to organizations as
being socially constructed in communication between internal and external stakeholders. She
introduced a stakeholder communication model of change that builds on previous research in
stakeholder communication and organizational change.
Koschmann (2007) offered perhaps the most explicit call for further exploration of
communication in stakeholder research and claimed that this is an area in which organizational
communication scholars can contribute. He argued that most stakeholder research focuses
specifically on managerial strategy or business ethics, with only brief mentions of
communication included in recommendations to improve communication with stakeholders.
Such oversimplifications have downplayed the role of communication in stakeholder theory.
Within the discipline of communication, few studies include empirical work, thus representing
an opportunity for further research.
17
Communication has been present but peripheral in the bulk of stakeholder research.
Though previous studies have alluded to communication in the coordination of managerial
responses (Mitchell, Agle, & Wood, 1997), or in relationships between stakeholders (Rowley,
1997), this study places communication in a central role. In this paper, collaboration is
communication; the coordination of resources and efforts depends on the messages exchanged –
whether those messages are formal and official, or informal, unofficial, or even unintentional.
Heath (2007) made the argument that one of the contributions of communication scholarship is
in the understanding of collaborative stakeholders’ interdependence through the exploration of
power and democracy. Collaboration around a “wicked problem” suggests a complicated
network of stakeholders; as such, this setting provides an opportunity to explore who
stakeholders communicate with within the collaboration as well as the communicative activity
that constitutes participation in the network. The research questions described pertain to
stakeholder relationships, identification and participation in a collaborative setting, all of which
stem from communicative activity in the nonprofit network.
Stakeholders in the nonprofit context.
Freeman’s (1984) definition of stakeholders allows for a number of different entities to
claim stakes in an organization, among them customers, suppliers, employees, and consumer
advocates. These labels, however, reflect a corporate bias. Indeed, most of the literature on
stakeholders is within management and assumes a corporation as the theoretical firm; one of the
most frequently cited articles in stakeholder management suggests that stakeholder theory is a
theory of corporations (Donaldson & Preston, 1995). However, Freeman himself as well as
others have debunked this myth. Recently, scholars have sought to clarify that stakeholder
theory is more about “process and procedural justice” rather than the distribution of financial
18
outputs (Freeman et al., 2010) and suggested that nonprofit organizations represent a different
application of stakeholder theory (Philips, Freeman, & Wicks, 2003). The application of
stakeholder theory in the nonprofit world may also serve as a response to critics (such as Jenson
& Sandström, 2011, and Sternberg, 2002) who found stakeholder theory incompatible with
business. However, stakeholder theory is seldom used in nonprofit research. Nonprofit
organizations provide a unique context for studying diverse stakeholders and suggest a relatively
untapped area for stakeholder research.
In terms of studies that reference both nonprofits and stakeholder theory, nonprofit
organizations have often described as a stakeholder of corporations rather than entities having
stakeholders of their own (see Brickson, 2007; Eesley & Lenox, 2006). This is evident in
Freeman (1984), as the text assumed a corporate identity throughout and refers to nonprofit or
nongovernmental organizations (NGOs) as a possible stakeholder of the corporation. This is also
apparent in a number of case studies; Friedman and Miles’ (2002) Greenpeace case study
recognized nonprofit organizations as a stakeholder of other organizations, and a case study of
nuclear weapons sites depicted nonprofits as stakeholders in collaborative relationships with
other organizations (Butterfield, Reed, & Lemak, 2004). However, among those studies that
focus on a nonprofit focal organization, nonprofit stakeholders may include different identities
than those mentioned in studies that assume a corporate point of view. Thus, nonprofit
stakeholders may include funders, volunteers, clients, referral agencies, and government
officials, among others (Balser & McCluskey, 2005).
Within the nonprofit literature, “stakeholders” are largely thought of as people or entities
to whom nonprofits are accountable. For example, in Benjamin (2008), “key stakeholders”
included funders, beneficiaries, regulators, and organizational partners to whom nonprofits may
19
have to explain what they have or have not done. Nonprofits hold multiple accountabilities
(Najam, 1996), and ensuring the organization’s accountability is increasingly important as the
range of stakeholder groups expands (LeRoux & Wright, 2010). The communicative challenges
lie in engaging with board members, clients, volunteers or donors, and meeting these varied
stakeholder expectations. Nonprofit accountabilities have been classified as upward (referring to
funders), lateral (to staff members) or downward (to clients); each stakeholder group is said to
require its own distinct message (see Christensen & Ebrahim, 2006; Ebrahim, 2005; Edwards &
Hulme, 1996, in Hug, Meckel, & Jäger, 2011).
In addition to classifying stakeholders in terms of accountabilities, scholars have found
other ways to distinguish nonprofit stakeholder groups. Speckbacher (2008), for instance,
offered an “economic” definition of nonprofit stakeholders in which employees are not included.
However, most scholars use classification systems that distinguish between internal and external
stakeholders. These include Ben-Ner and van Hoomissen (1991), who conceptualized
stakeholders in terms of demand side (sponsors, donors, consumers) and supply side
(employers). Additionally, Van Puyvelde and colleagues (2012) used categories based on
Anheier (2005) in which employees are classified as internal stakeholders (along with managers
and volunteers), and external stakeholders are thought to include funders, beneficiaries,
suppliers/contractors, competitors, organizational partners and other media or community
groups; they also make the case for a third category of “interface” stakeholders that consists of
board members. Although Freeman’s (1984) definition of stakeholder – those groups or
individual who can affect or is affected by achievement of the organization’s objectives – is used
in this paper, the distinction of internal versus external stakeholders is helpful for dealing with
the complexities of nonprofit stakeholder relationships.
20
Nonprofit organizations must overcome various obstacles in achieving their goals for
social change, but also face challenges in communicating the outcomes of their efforts (see
Lewis, 2011). The difficulties in understanding stakeholder expectations as well as coordinating
stakeholder communication have been acknowledged (see Menz & Stahl, 2008, in Hug, Meckel,
& Jäger, 2011), but it remains particularly challenging to engage with stakeholders who do not
affect financial outcomes of the organization. The corporate social responsibility approach to
stakeholder theory emphasized the role of these stakeholders in a corporate context (see Lewis,
2011), but stakeholder groups who do not impact the organization’s bottom line may comprise a
large part of a nonprofit’s constituency. These stakeholder groups are often underrepresented in
nonprofit studies that focus on a focal organization or a social problem.
Researchers acknowledge that this diversity of stakeholders is a unique and complicating
factor in studying nonprofit organizations (see Lewis, Hamel, & Richardson, 2001) but have
tended to focus on only one stakeholder group in individual studies (Hug, Meckel, & Jäger,
2011). Employees – and particularly those employees in leadership positions – are typically the
most studied in nonprofit organizations (see Balser & McCluskey, 2005), and although some
studies feature board members (see Gazley, Chang, & Bingham, 2010), this also represents a
leadership bias. There are practical reasons for this; nonprofit employees or leaders would likely
be an easier research population to access than donors or volunteers because employees are
easier to identify. Additionally, some studies taking place in a nonprofit context may have been
modeled after other studies featuring employees in corporations, which could account for the
emphasis on employees in organizational research.
Studies of nonprofit employees have added to the body of organizational research.
However, for organizations dependent on public funds and, often, both paid and unpaid labor in
21
order to serve a social good, the inclusion of other stakeholder perspectives besides employees
would further organizational research as well as help practitioners determine how to steward
these resources more effectively.
Some studies do focus on other, less frequently represented nonprofit stakeholders, but
these studies tend to coalesce around common themes. For example, research on individual
nonprofit donors tends to focus primarily on fundraising strategies (see Frumkin, 2007;
Warwick, 2008), motivations for giving, or questions of donor identity (see Aaker & Akutsu,
2009). Research on nonprofit volunteers typically pertains to motivations of volunteers (see
Finkelstein, 2008; Rehberg, 2005; Clary & Snyder, 1999), as well as understanding or
conceptualizations of what constitutes “volunteer” (see Ganesh, 2009; Handy et al., 2000),
particularly regarding concerns in relation to paid employees (see Handy, Mook, & Quarter,
2007).
Studies on nonprofit donors make up a smaller body of research than that on nonprofit
employees and board members. Beneficiaries, sometimes referred to as clients although they do
not pay for services they receive, are the least-studied stakeholder group. Clients have been
studied in terms of how an organization talks about them in fundraising appeals (see Merchant,
Ford & Smith, 2010) and how clients perceive these nonprofit retellings of their stories (Breeze
& Dean, 2012). Others have emphasized the connection between how an organization responds
to clients and their interests, suggesting that nonprofits must mind client interests in order to
preserve organizational accountability and legitimacy (Kissane & Gingerich, 2004). However,
clients have little power compared to other stakeholders, particularly stakeholders such as donors
who help to provide nonprofit services (see Brown & Moore, 2001), and compared to paid staff,
board members and donors, clients receive fewer communications from the organization and are
22
viewed as having fewer resources to offer (Lewis, Richardson, & Hamel, 2003). In short,
nonprofits rarely see clients as a strategically important stakeholder group (Kilby, 2006).
Although it appears that few studies focus on non-employee stakeholders, another rarity is
for a study to focus on more than one type of stakeholder. LeRoux’s (2009) study of nonprofit
responses to stakeholders is unusual in that it combined empirical data with stakeholder theory,
and stakeholder theory with nonprofit perspectives. This article started from the premise that
nonprofits have to meet demands of varied stakeholder groups that may include the government,
philanthropic foundations, or individual donors, other organizations, and clients. Responding to
these varied groups is challenging, in part because nonprofits may have fewer staff than for-
profit or public organizations as well as smaller staff-to-workload ratios (Light, 2002). LeRoux
then asked whether nonprofits take an instrumental orientation in order to prioritize some
stakeholder interests, or whether these organizations operate under the assumptions of the
intrinsic commitment model. Her results suggested that, although most organizations do tend
towards an intrinsic commitment approach, some nonprofits – particularly those reliant on
corporate funding, and those whose board members are economic elites or racially “mismatched”
from the clientele they serve – prioritize funders or potential funder interests over those of the
client.
LeRoux’s findings are interesting not only because it is a rare example of nonprofit
research incorporating stakeholder concepts, but because her study demonstrated the practical
challenges that these organizations face in coordinating responses to stakeholders (see also
Lewis, Richardson, & Hamel, 2003). Due to resource limitations within the sector, nonprofit
organizations may find it difficult to allocate time and attention to each of these stakeholder
groups, and so these organizations may decide to prioritize one group over another.
23
Although LeRoux (2009) represented a rare study in that it looks at stakeholder
relationships, her study continued to take the perspective of internal stakeholders such as
employees. This is a commonality across stakeholder literature, whether in a nonprofit or for-
profit context. Several researchers working within stakeholder theory have argued that research
focuses too much on the organizational perspective rather than other stakeholder perspectives;
indeed, Freeman et al. (2010) noted that there is a need to “tell some interesting stories from the
company’s stakeholders’ point of view” (p. 287). Although much of the stakeholder literature
assumes a focal organization, a growing body of research points to the complexity of stakeholder
relationships with one another.
Both stakeholder and collaboration literatures traditionally depict networks or
partnerships that assume organizations at the center. Gray and Wood (1991) referred to
individual organizations as the “centerpiece of theorizing” in organizational literature (p. 6), and
while Butterfield, Reed, and Lemak (2004) were on target in saying that little is known about
stakeholders in collaboration, their view of collaboration referred to dealings with a “target”
organization.
However, this “hub and spoke” conceptualization depicted by Freeman (1984) has been
questioned by others. Rowley (1997) argued that stakeholders may be aware of – and have
relationships with – each other, not just with a focal organization. Interaction between
stakeholders represents another area of future research as indicated in models of stakeholder
communication (see Lewis, 2011; Lewis, 2007) and nonprofit managers have been urged to
adopt a network perspective on accountability to various stakeholder groups (see Hug, Meckel,
& Jäger, 2011). Consideration of relationships between stakeholders in addition to relationships
between stakeholders and the organization undoubtedly complicates stakeholder management;
24
however, consideration of interaction between stakeholders is essential in questions of
stakeholder participation and engagement.
The suggestion of a network approach to stakeholder management is hinted at early on;
Freeman (1984) acknowledged that stakeholders may have relationships to each other and even
mentions the idea of stakeholder coalitions. Rowley (1997) further developed this idea by
suggesting propositions about stakeholder relationships. The idea of stakeholder partnerships
raises questions as to what extent stakeholders are aware of each other, relate to or work with one
another, and are interdependent (see Lewis, 2011), though relationships between stakeholders
seldom discussed (Antonacopoulou & Meric, 2005). Network terms have been used by a
number of authors (see Brickson, 2007; Frooman & Murrell, 2005; Rowley & Moldeneau,
2003); however, it appears that, despite frequent invocation of these terms, networks are actually
used very little in stakeholder research (Cots, 2011). This study presents the opportunity to learn
more about stakeholder interaction in collaboration:
RQ1: Who do stakeholders talk to about education in a nonprofit collaborative network?
RQ2: Who do stakeholders talk to in the context of Community Reach?
In sum, stakeholder theory is a popular approach to organizational research, but the
previous body of research reveals some gaps. Specifically, a lack of empirical development has
limited the theory’s influence. Additionally, an overreliance on the employee perspective has
kept scholars from a fuller understanding of organizational outcomes. Finally, scholars have
done relatively little work on stakeholder relationships. A nonprofit context provides ample
opportunities for studying diverse stakeholders, and collaboration among such organizational
partners allows for the study of stakeholder interaction.
25
What is Interorganizational Collaboration?
Although collaboration is a commonly addressed topic in organizational research, most
research has tended to focus on organizational motivations (e.g., Gray & Wood, 1991; Huxham
& Vangen, 2000) and structures of collaborative relationships (e.g., Hardy, Philips, & Lawrence,
2003; Monge & Contractor, 2003; Barringer & Harrison, 2000). This has resulted in a substantial
amount of literature on these topics; however, many areas of interorganizational collaboration
remain under-explored, particularly in terms of the representation of diverse stakeholders. The
next section provides an overview of interorganizational collaboration research, describing
definitions and forms of collaboration, as well as motivations for partnering with other
organizations.
A number of collaboration definitions exist, many of them stemming from the
collaboration literature that emerged in the 1980s (e.g., Galaskiewicz, 1985; Gray, 1985; Trist,
1983). Currently, there is little synthesis in collaboration literature; collaboration is frequently
defined in terms of action and process among generally equal parties, though definitions diverge
from one another as to whether the collaboration is bounded by time, whether parties are starting
from points of difference, and to what extent individual versus group goals are recognized
(Lewis, 2006). For the purposes of this research, interorganizational collaboration is defined as
“the set of communicative processes in which individuals representing multiple organizations or
stakeholders engage when working interdependently to address problems outside the spheres of
individuals or organizations working in isolation” (Keyton, Ford, & Smith, 2008, p. 381).
Keyton, Ford and Smith (2008) defined collaboration in a communicative frame, as well
as identified discursive interactions that affect communicative processes. Although collaboration
is a popular topic across organizational research, several communication scholars have made the
26
claim that collaboration is initiated and sustained through communicative activity. Heath (2007)
suggested that most studies on preconditions for collaboration take communication for granted,
and she argues for greater attention to the role of communication. Lewis’s (2006) review of
collaboration research prompted the author to draw several themes that point to the centrality of
communication in collaboration, including the construction of self and others through
collaborative communication, collaborative communication as mutual exchange, collaborative
communication as skill, and communicative alternatives to collaboration. More recently,
Koschmann, Kuhn, and Pfarrer (2012) argued for communicative practices that increase the
value of cross-sector partnerships, such as meaningful participation, managing centripetal and
centrifugal forces, and creating a distinct and stable identity among other communicative
practices. While arguing that communication plays a central role in organizational collaboration,
communication researchers agree with other scholars that collaboration takes place in a variety
of structural forms, some of which may be difficult to distinguish from one another.
Forms of collaboration.
Interorganizational collaboration exists in many forms (Hardy, Philips, & Lawrence,
2003). Barringer and Harrison (2000) provided descriptions for some of these relationships,
including joint ventures, network structures, consortia, alliances, and trade associations, among
others. Collaboration is also discussed in the form of networks, or multiplex systems of
relationships (Borgatti & Foster, 2003; Monge & Contractor, 2003). The discussion of networks
in Barringer and Harrison (2000) borrowed heavily from Atler and Hage (1993), and Jones,
Hesterly, and Borgatti (1997) in talking about networks as a “constellations of businesses that
organize through the establishment of social, rather than legally binding, contracts” (p. 387).
This distinction between social and legal contracts points to another area of concern within
27
interorganizational collaboration research; namely, that collaborative relationships may vary in
terms of formality and interdependence. The different forms of collaboration have been
described on a continuum of interdependence from information sharing to organizational
mergers (Murray, 1998, in Guo & Acar, 2005, p. 343).
Just as collaboration may refer to a number of different structures, collaboration may also
include a variety of organizations or groups. Guo and Acar (2005) defined nonprofit
collaboration as a particular kind of relationship that “occurs when different nonprofit
organizations work together to address problems through joint effort resources and decision
making and share ownership of the final product or service” (p. 342-3). Although this definition
emphasizes partnerships between nonprofit organizations, collaboration may also take place
across sectors. Cross-sector partnerships are a particular area of interest in nonprofit research, as
nonprofits may partner with other nonprofits or engage in partnerships with government or
businesses (see Austin, 2000; Babiak & Thibault, 2009; Cairns & Harris, 2011; Gazley, 2010;
O’Regan & Oster, 2000). Cross-sector partnerships are defined in their own right (see Oppen,
Sack, & Wegener, 2005) though these partnerships might may take the form of those
relationships previously discussed, including joint ventures, collaborations, sponsorships,
cooperation, and alliances (Babiak & Thibault, 2009). The terminology – which covers all these
organizational partnerships – is admittedly confusing; a term commonly used to describe these
partnerships is collaborative governance, or “governance structures that involve people in
working relationships with those in other organizations” (Huxham, 2000, p. 339). Such
relationships refer to decision-making and the coordination of resources and work across several
organizations.
28
The complicated and dynamic relationships within collaborative governance pose a
messy challenge for researchers. Scholars acknowledge the difficulties in exploring these
relationships while pointing out that the collaborative trends in the public sector warrant further
attention, as do the role of individual stakeholders in collaborative governance. Ansell and Gash
(2007) described collaborative governance as “a governing arrangement where one or more
public agencies directly engage non-state stakeholders in a collective decision-making process
that is formal, consensus-oriented, and deliberative and that aims to make or implement public
policy or manage programs or assets” (p. 2). Their definition deviates from some other common
understandings of collaborative governance in terms of inter-agency organization with the
inclusion and involvement of “non-state” stakeholders. Although stakeholder participation is
sometimes thought of as an ideological component of collaborative governance (see Huxham,
2000), the fact remains that it is difficult to predict and evaluate any involvement on an
individual or agency level. Huxham (2000) suggested that collaborative governance may vary in
form and scope according to interrelated dimensions of structural complexity. Ansell and Gash
(2007) developed a “contingency” approach to collaborative governance based on 137 case
studies; the authors’ core contingencies are time, trust, and interdependence, though their model
includes other variables such as prior history, stakeholder incentives, power and resources
imbalances, leadership, and institutional design. Despite the growing body of research,
collaborative governance is a difficult feat to pull off and one that cannot be successful unless
carefully managed – and often, even with the presence of resources and oversight, collaborative
governance fails to deliver anticipated benefits or solve the intended problem (Huxham, 2000).
29
Reasons for collaboration.
Collaboration – within or across sectors, in nonprofit or other settings – is generally
referred to as a strategy for combating a significant problem. The term “meta-problem” has been
used to describe multi-faceted problems that cannot be handled by any single organization
(Chevalier, 1966, as cited in Trist, 1983); Selsky and Parker (2005) also rely on the concept of a
meta-problem to explain cross-sector partnerships. The meta-problem is a useful construct in
that it provides the basis for organizational partnership; however, this term does not fully
encapsulate all the challenges inherent in a complicated social problem that Rittel and Webber
(1973) referred to as a “wicked” problem.
Wicked problems cannot be solved, argued Rittel and Webber (1973), because “the
information needed to understand the problem depends upon one’s idea for solving it. That is to
say: in order to describe a wicked-problem in sufficient detail, one has to develop an exhaustive
inventory of all conceivable solutions ahead of time” (p. 161). Wicked problems are further
identified by 10 characteristics: 1) A lack of definitive formulation, 2) No stopping rule that
determines when a solution has been found, 3) Good or bad solutions rather than true or false
solutions, 4) Lack of immediate and ultimate tests of solutions, 5) Solutions are “one-shot”
operations rather than trial and error, 6) Lack of criteria that indicate all solutions have been
identified, 7) The uniqueness of every wicked problem, 8) Any wicked problem could be viewed
as a symptom of another problem, 9) Any discrepancies in wicked problem can be explained in
multiple ways, and 10) Planners have no right to be wrong in that they are responsible for
outcomes that result from the actions they take. This list is shortened somewhat by Weber and
Khademiam’s (2008) depiction of wicked problems as unstructured, cross-cutting, and relentless,
though these attributes still highlight the presence of many interconnected stakeholders and
30
difficulties in resolving the problem. Due to their complexity – as well as the potential for
outcomes to affect diverse stakeholders – wicked problems provide a unique context for
collaborating organizations.
The presence of such a problem in an organizational environment may spur organizations
to unite in the hopes of achieving some sort of outcome; Gray and Wood (1991) referred to
collaboration as a strategy for coping with such an environment, and the term “collaborative
advantage” is used to refer to outcomes that could not be achieved by individual organizations
(Huxham & Macdonald, 1992; Huxham & Vangen, 2000). In addition to collaborating in
response to a meta-problem, nonprofits may collaborate to scale up efforts or increase the
influence of any one organization (Eade, 1997), to get more information in an uncertain
nonprofit environment (Taylor & Doerfel, 2005), to increase resources (Cairns & Harris, 2011),
to serve more clients (Miller et al., 1995), to compensate for organizational weaknesses
(O’Reagan & Oster, 2000), to work towards outcomes that individual organizations could not
accomplish (Provan & Kenis, 2008), or as part of an industry culture that encourages nonprofit
collaboration (Henri, Mohan, & Yanacopulos, 2004).
Individual organizations may have their own reasons for partnering, but the promise of
collective impact also necessitates collaboration. Collective impact is described as “the
commitment of a group of important actors from different sectors to a common agenda for
solving a specific social problem” (Kania & Kramer, 2011, p. 36). The authors further
distinguished collective impact projects from collaborations by emphasizing the importance of
infrastructure, staff, and a “structured process that leads to a common agenda, shared
measurement, continuous communication, and mutually reinforcing activities among all
participants” (p. 38). All too often, said Kania and Kramer (2011), nonprofits rely on “isolated
31
impacts,” or independent efforts that may be counterproductive to other agency initiatives or use
resources inefficiently. But because of the coordination involved, the conditions have to be right
for collective impact initiatives. Hanleybrown, Kania, and Kramer (2012) argued that an
influential champion and adequate financial resources are needed to sustain the project for 2-3
years – and that partners must sense the urgency for change in order to try these new initiatives.
Collective impact holds much promise for organizations focused on a social good;
however, these efforts are may be helped or hindered by the environment in which they occur.
The bona fide network perspective introduced by Cooper and Shumate (2012) emphasized that a)
network boundaries are fuzzy and membership is dynamic, b) interorganizational networks are
embedded in a complex environment that enables some configurations and constrains others, c)
interorganizational networks are multiplex and different types of relations are mutually
influential, d) these networks are dynamically restructured over time, and e) outcomes of
networks occur at the individual and whole network levels. Bona fide networks were then
expanded by Cooper (2013) to describe a collective approach to combating wicked problems;
this approach further argues for the role of stakeholders in sustaining collaborative activity
through the coordination of sub-networks. These studies suggest that, although the literature
champions collective approaches, such aspirations are challenged by the scope of the problem
and the realities of the environment in which collaboration occurs.
As this literature establishes, it is common for organizations to collaborate with others to
achieve certain outcomes. However, when dealing with relationships across organizations, the
difficulty of identifying – and accounting for – all stakeholders increases. The next sections
explore how possible stakeholders in interorganizational collaboration may be identified and
participate in collaborative activity.
32
Who are Possible Stakeholders in Interorganizational Collaboration?
Several definitions of collaborations refer to stakeholders (Keyton, Ford, & Smith, 2008;
Guo & Acar, 2005; Wood & Gray, 1991). Barringer and Harrison (2000) also utilized Freeman’s
(1984) definition of stakeholders to identify stakeholders in collaboration. The authors described
the firm as a “nexus of contracts” (Jensen & Meckling, 1976) beyond the organization and
stakeholders in relationships that can be formal or informal (Jones, 1995). However, few studies
have focused on the stakeholder perspective, so scholars know little about why stakeholders form
collaborative alliances or what they think about these collaborations (Butterfield, Reed, &
Lemak, 2004). One explanation as to why scholars know little about these stakeholder
perspectives may be in part because of the difficulty in identifying stakeholders.
In her study of a community collaboration consisting of nonprofit, organizational, and
citizen stakeholders, Heath (2007) found that the stakeholders tended to be influential
community members and organizational decision makers. Another study mentioned power and
legitimacy as criteria important to stakeholders in collaboration (Hardy & Phillips, 1998),
reminiscent of Mitchell, Agle, and Wood’s (1997) theory of stakeholder identification and
salience. Although power and legitimacy may be thought of as characteristics stakeholders
should possess, it remains difficult to ascertain which stakeholders actually have these attributes.
Stakeholder identification is cited as the first step in a study of public/community sector
collaboration, but identifying stakeholders is a challenge for collaborating partners (Huxham &
Vangen, 2000). The authors characterized collaboration membership structures as ambiguous,
complex and dynamic, but note that this is an unavoidable scenario given the complexities of
collaboration. Among the ambiguities in collaboration membership, Huxham and Vangen
(2000) found that members had differing perceptions as to who the other members were, who
33
had what status in the collaboration, and to what extent to stakeholders were representing an
organization or an individual. Adding to the confusion were dynamic changes in membership,
including the closing or changing of organizations represented in the collaboration, as well as
changes to individuals’ roles within their respective organizations. This confusion over
stakeholder identification and membership resulted in challenges in determining goal agreement
and partnership accountability, which kept organizations from reaching the collaborative
advantage sought in the first place (Huxham & Vangen, 2000).
Other scholars have found, just as Huxham and Vangen (2000) did, that determining
individual versus organizational representation in collaboration is difficult to sort out. Heath and
Frey (2004) noted that multiple stakeholders from one organization may be present in
collaboration; this same study made the case that individuals, not organizations, collaborate. The
relationship – or lack of relationship – between stakeholders takes a smaller role in both
stakeholder and collaboration literature. Keyton, Ford, and Smith (2008) also noted that,
according to their meso-level model of collaboration, it is possible that not all stakeholders in the
collaboration are familiar with one another. Assuming one can, however, sort out who all the
relevant stakeholders are, the next challenge is to determine whether all stakeholders should have
input into the collaboration.
The early collaboration literature presupposes that different kinds of input and sources of
information are needed in order to define the problem and solution. Gray (1985) suggested
several propositions for stakeholder input, among them that “the stakeholder set needs to reflect
the complexity of the problem under consideration if collaboration is to occur” with its corollary
proposition that “from an information standpoint, the more stakeholders who participate in
problem solving, the more effective the collaboration will be” (p. 919). Gray (1985) also noted
34
that stakeholders may not be readily identifiable or concerned with the problem; another
proposition states that “efforts to convene all stakeholders simultaneously will likely be
thwarted by changing dynamics of the domain. Therefore, inclusion of stakeholders should be
viewed as a process of continual adaptation.” (p. 920). Later developments from Wood and
Gray (1991) suggested that not all stakeholders have to be involved, though who participates
and who does not may have consequences for collaboration outcomes. Collaborations may thus
rely on the following forms of stakeholder representation: 1) the most interested stakeholders
(stakeholders could be interested in the problem or interested in the collaboration); 2) the most
powerful stakeholders combined with stakeholders who are interested in a solution regardless of
what power they have; 3) the inclusion of the majority of stakeholders in a problem domain in
order to create social norms that result in pressure for other stakeholders to participate; and 4)
the inclusion of organized stakeholder networks in the problem domain so that they can pressure
nonparticipants. Wood and Gray (1991) also noted that some collaborating groups tried to solve
problems related to inclusion by creating first-order and then second-order alliances that varied
in number of participants as well as diversity of stakeholders in order to facilitate multiple
conversations pertaining to a problem.
In addition to Wood and Gray’s typology, other scholars have weighed in on which
stakeholders should have input in the collaboration. Keyton, Ford, and Smith (2008) criticized
the assumption that collaboration should be open to anyone influenced by attempts to solve the
problem; the authors claimed that this is unrealistic because the group of stakeholders would be
too large and too difficult to get the participation of all these stakeholders. Barringer and
Harrison (2000) previously noted the limitations with stakeholder inclusion due to the sheer
number of stakeholders and difficulty of agreeing on goals. They also questioned whether
35
managers can appropriately respond to diverse stakeholder interests and pointed out that much
of these guidelines for stakeholder input are based on a sort of moral high ground that
stakeholder theory purportedly has.
Despite stakeholder theory’s supposed emphasis on representation, power does play a
role in who participates. In fact, there is concern that relevant stakeholders may not be able to
participate due to power differentials inherent in stakeholder relationships. Some suggest that
the collaborative domain is socially constructed, thus, those who have a stake in the issue can
construct the domain as to their advantage (Hardy & Phillips, 2008). Barringer and Harrison
(2000) noted that not all stakeholders are equal and that stakeholder involvement often starts by
determining which stakeholders are deemed “important” (Harrison & St. John, 1996). In a
further exploration of power within collaborative decision-making, Watson and Foster-Fishman
(2012) pointed to the importance of “disadvantaged” participants’ ability to engage in the
decision-making process. Such participants must be aware of – and able to – articulate the
resources they bring to the collaboration, but success of participant involvement also depends on
the willingness of “more privileged” stakeholders to accept resources contributed by others
(Watson & Foster-Fishman, 2012).
There is some suggestion that stakeholders with greater power in terms of resources are
more likely to get a positive response from the organization, although stakeholder power is
moderated by organizational power (Eesley & Lenox, 2006). Heath (2007) described a
“resource-focused” community collaboration that resembles the economic stakeholder model
she ascribed to Deetz (1995), in which “pay-to-play stakeholder membership” determines which
stakeholders bring what to the partnership and how they participate. Such characterizations of
stakeholders suggest a power imbalance that may be present in terms of collaboration
36
participation. These are particularly evident in cross-sector organizational partnerships. For
example, Selsky and Parker’s (2005) review of cross-sector partnerships revealed some
concerns within regard to whom has power and control, particularly in government-nonprofit
relationships. Purdy’s (2012) study relied on Hardy and Phillips’s (1998) discussion of power in
interorganizational relationships to determine authority, resources and discursive legitimacy
shaped the collaboration. Within collaboration, the relationships vary; for example, government
or funders have authority over organizations, while organizations have authority over clients.
Purdy noted that different organizations in collaboration - as well as donors who support the
collaboration - have resource-based power, while nonprofit organizations or government
typically have discursive power, or the ability to speak to an issue in the public sphere. Clients
represented in the collaboration have none of these kinds of power unless their information on
the issue is thought of as a resource, which it typically is not (Purdy, 2012). One of the main
conclusions drawn from Purdy’s study is that how organizations define power may depend on
the sector to which they belong. She noted that governments, who hold legal power, may
recognize legal authority then as power, whereas businesses may think about power in terms of
resources, and nongovernmental organizations in collaboration tend to recognize values or
discursive legitimacy (Purdy, 2012).
Although the research suggested some confusion in determining which stakeholders
should speak to the collaboration, these studies indicate that power is an ongoing factor in which
stakeholders can and do have input in interorganizational collaboration. However, power is one
of several resources that stakeholders may have, and other participants might represent different
resources or interests depending on their relationship to the collaboration.
37
However, although stakeholder attributes – such as power – may be invoked in the
literature, the research tends to focus on stakeholders rather than their stakes, or the interests that
these individuals represent. Freeman (1984) spends more time talking about stakeholders than
the stakes themselves, and this appears to be the trend in subsequent studies. Laplume, Sonpar,
and Litz (2008) conducted an exhaustive review of stakeholder theory from 1984-2007 and
identified five themes across the literature: stakeholder definition and salience, stakeholder
action and responses, firm action and responses, firm performance, and theory debates. In later
years, Lewis (2011) touched briefly on types of stakes; she allows that stakes come in a variety
of forms and that these may vary by stakeholder. According to Lewis, stakes may be – but are
not limited to – financial, physical, environmental, or symbolic interests in the problem. Across
stakeholder literature, it appears that more attention is given to the classification of individuals
representing stakeholders rather than the interests or claims they represent. In the presence of a
wicked problem, less is known about the interests – or stakes – represented by individuals. This
prompts a third research question to ask what claims or interests are represented by individuals:
RQ3: What are the stakes in this nonprofit collaboration?
For this study, a modified version of Wood and Gray’s (1991) typology is used,
classifying stakeholders as most interested in improving educational outcomes, most interested in
working with others, most powerful, and most organized. Wood and Gray’s typology serves as a
template for several reasons. First, in this typology, it is a given that not all stakeholders
participate in the collaboration. Second, this allows for the representation of various resources –
power being one, though interest and personal networks are others. Third, this typology
emphasizes outcomes. In particular, Wood and Gray emphasizes that the inclusion of different
38
stakeholders leads to different outcomes. Different stakes in the collaboration may in turn shape
the ways in which various people participate in collaboration.
Stakeholder Participation in Nonprofit Collaboration
Stakeholder participation as a term remains somewhat ambiguous. It is used in a context
similar to citizen participation, which has been defined in a number of ways, including
“involvement in any organized activity in which the individual participates without pay in order
to achieve a common goal” (see Zimmerman & Rappaport, 1988) or as “a process in which
individuals take part in decision making in the institutions, programs and environments that
affect them” (Heller, Price, Reinharz, Riger, & Wandersman, 1984, p. 339). These various
understandings of stakeholder participation often emphasize a communicative component; Lewis
(2011) noted that stakeholder participation may also be referred to as soliciting input,
participation in decision-making, empowerment, positive climate, feedback, upward
communication, and voice.
Stakeholder participation may be measured or evaluated in a number of ways. For
example, Arnstein (1968) described participation as a ladder consisting of “rungs” moving from
nonparticipation to tokenism to citizen power. Arnstein’s ideas have been adapted by a number
of researchers in developmental and environment contexts, including Pretty (1995) and Lynam et
al. (2007). Wandersman (1979) suggested a conceptual framework of user participation in
planning environments consisting of five parameters of participation: setting and scale, stage of
design process, participant types, participation type, and participation techniques.
Wandersman’s framework also allows for outcomes, as he noted that participation can have a
number of effects across attitudes and behavior. Lewis (2011) also suggested a framework of
stakeholder participation that places stakeholders on a scale of select to diverse, as well as from
39
symbol to resource. The presence of so many models suggests the difficulty in facilitating or
soliciting stakeholder input; such difficulties are exacerbated in a nonprofit context due to
diversity of stakeholders.
Although Purdy (2012) suggested that client experience typically is not thought of as a
resource, there has at least been some indication that researchers recognize the importance of
soliciting the input of others since Gray’s (1985) assertion that more information on the problem
is helpful in collaboration. Heath (2007) described a community collaboration stakeholder model
in which “stakeholders are chosen for their ability to think differently than, contest, and disagree
with other stakeholders regarding particular subject matters. Practically speaking, stakeholders
with diverse perspectives would be not only invited but sought after” (p. 165). Although inviting
underrepresented stakeholders to participate has a number of advantages, it also is difficult to
integrate these perspectives because of perceived irrelevance and, sometimes, communication
differences or difficulties among stakeholders (Medved et al., 2001). Of course, there are
collaborations in which stakeholders do not choose each other for diversity or resources; some
collaborative relationships may be mandated by an outside convener.
Although much of the research takes a normative bent in terms of which stakeholders
should have input into a collaborative partnership, even stakeholders that are given a role in the
collaboration may exercise their right not to participate. For example, Leach, Pelkey, and
Sabatier (2002) suggested that not all invited stakeholders participated in collaboration. Their
sample of watershed partnerships consisted of state/federal officials, representatives of local
government and opposing interests, selected for the sake of capturing stakeholder diversity.
Meetings of these groups were generally open to the public, but not all invited stakeholders came
to meetings. Purdy’s (2012) exploration of power and legitimacy in collaboration suggested that
40
stakeholder participation in collaboration may depend in part on perceptions of those attributes.
For example, she noted that nonprofits had little power except in terms of discursive legitimacy;
that is, the nonprofits in her study were limited to just representing an issue. Some nonprofit
participants were meant to represent several nonprofits at the same time, although a different
type of participant might be sent to convey different messages. Purdy (2012) also noted that
nonprofits typically sent fewer people to meetings with collaborative partners than businesses
did, though business could typically send multiple people to meetings because their jobs required
it. Other studies suggest that there is a distinction between participating in name or presence
only and actively engaging in the collaboration; Koschmann’s (2008) study of stakeholder
participation in collaborative relationships suggested that collaborative partners often assumed
being present was synonymous with participating, and Watson and Foster-Fishman (2012)
argued for a framework in which disadvantaged stakeholders are empowered to participate in
collaborative decision-making instead of simply being present.
Given that no one understanding of stakeholder participation exists (Green & Hunton-
Clarke, 2003), particularly in a nonprofit, collaborative context, there is a need for understanding
participation in nonprofit collaboration from both an employee and non-employee perspective.
This research seeks to build general knowledge as to how these participatory processes occur:
RQ4: How do stakeholders participate in nonprofit collaboration?
Researchers acknowledge that this diversity of stakeholders is a unique and complicating
factor in studying nonprofit organizations (see Lewis, Hamel, & Richardson, 2001) but tend to
focus on only one stakeholder group in individual studies (Hug, Meckel, & Jäger, 2011). That
group is typically employees, though scholars recognize the need for stakeholder perspectives
other than those of organizational insiders (see Friedman & Miles, 2002). The difficulties in
41
understanding stakeholder expectations as well as coordinating stakeholder communication have
also been acknowledged (see Menz & Stahl, 2008, in Hug, Meckel, & Jäger, 2011). Thus,
exploring participation in and perceptions of nonprofit collaboration from the point of view of
varied stakeholders – including donors, employees, and volunteers – provides diverse
perspectives typically underexplored in stakeholder research:
RQ5: Do different stakeholders participate in the collaboration in different ways?
RQ6: How do different stakeholders perceive nonprofit collaboration?
As seen in these examples, most researchers continue to call for more stakeholder
participation, despite the many challenges in identifying and including stakeholders in nonprofit
collaboration. Stakeholder participation is thought of as an “ideological” component of
collaboration (Huxham, 2000), but less is known about the outcomes of their efforts – and in
fact, it is often difficult to identify outcomes of collaboration at any level, organizational or
individual.
Outcomes of collaboration: Benefits and challenges.
Many models have been developed to study interorganizational or group collaboration in
response to large-scale problems (see Gray, 1985; Heath & Frey, 2004; Keyton, Ford, & Smith,
2008; Trotter, Briody, Sengire, & Meerwarth, 2008; Stohl & Walker, 2002; Lewis, 2006).
However, determining outcomes of these efforts prove challenging. Researchers point to reasons
for collaborating but also uncover challenges that keep partners from reaching their intended
goals. For example, research on networks suggests that existing interorganizational relationships
constrain organizational action (Borgatti & Foster, 2003). Organizations may also find it difficult
to collaborate due to competition between organizations (Heath & Sias, 1999; Browning, Beyer,
& Shetler, 1995), and a number of additional barriers to collaboration have been identified, such
42
as mistrust between partners, lack of experience or interest in collaboration, and resources to
maintain collaboration (see Lewis, Scott, D’Urso, & Davis, 2008).
Organizations often engage in collaboration in the hopes of receiving various benefits.
Possible outcomes of collaboration in early literature include whether problems were solved,
whose problems were solved, whether shared norms were achieved, and whether the alliance
survived (Gray & Wood, 1991). However, most collaboration studies emphasize outcomes at the
organizational or community level; this includes studies within a nonprofit context (see Sowa,
2009). Outcomes of business-nonprofit collaboration have been observed at three levels,
including impact on issue and stakeholders, impact on capacity or capital to draw new resources,
and influence on policy or system change (Selsky & Parker, 2005). Studies of specific
collaborations also suggest outcomes for a collaborative organizational network and the local
community in the case of a community health initiative in Arizona (Provan et al., 2003), and an
organizational network mobilized to fight gender-based violence in Zambia resulted in tangible
benefits for nonprofit clients in terms of services provided, organizational benefits such prestige
or resource sharing, and outcomes on a community level in terms of having a greater capacity to
combat a social problem (see Cooper & Shumate, 2012). Less is known about collaboration
outcomes on the level of the stakeholder, though stakeholder relationships may inform outcomes
on the stakeholder level.
The relationships between stakeholders, previously discussed in terms of stakeholder
influence on organizations, also may have some implications for collaboration outcomes. For
example, Gray (1985) stated that stakeholders who realize their interdependence may perceive
positive benefits of the collaboration, thus overriding stakeholder concerns about threats to
resources in the collaboration. Managers are advised to be aware of “interaction effects,” in that
43
stakeholder groups with the proper salience criteria could impact an organization if they
coordinate their efforts (Neville & Menguc, 2006). In a rare empirical study of stakeholder
relationships and outcomes, Nowell (2009) used social network analysis to indicate that although
stakeholder relationships appear to be positively related to coordination effectiveness, they are
only one factor that impacts the success of collaboration. Essentially, stakeholder relationships
should be regarded as a type of capacity that can impact the collaboration (Nowell, 2009).
Still, little is known about stakeholders’ interpretations of collaboration as well as
outcomes of those collaborations (Butterfield, Reed, & Lemak, 2004). Relationships with other
stakeholders is described as a possible outcome, for example, in a study of watershed
partnerships, participants were asked whether they had friendships or professional relationships
with other stakeholders, understood stakeholder interests better, or the issues better (Leach,
Pelkey, & Sabatier, 2002). Other studies found that groups consisting of multiple types of
stakeholders had different perceptions of the collaboration. Collaborative groups consisting of
equal numbers of agency personnel and citizens were more likely to say that the creation of a
management plan was an accomplishment, mixed and citizen-based groups were more likely to
recognize increased public awareness as an outcome, whereas mixed and agency groups
mentioned group development/sustainability as collaboration accomplishment (Moore & Koontz,
2010).
Regardless of which outcomes are sought, however, we need new ways of exploring
stakeholder outcomes. Researchers have suggested, for example, surveying individual
stakeholders to operationalize commitment and other behavioral variables (Ansell & Gash,
2007), but it remains difficult to capture and measure outcomes of stakeholder interaction or
interorganizational collaboration (Nowell, 2009).
44
The outcomes of participation used in this study come from public relations literature; in
particular, Hallahan’s (2008) article pointed to measures of relationship quality that have been
previously validated and commonly measured. These measures of relationship quality,
according to Hallahan (2008) include commitment, described as “an enduring and demonstrated
desire to maintain a valued relationship with another party” (p. 50), control mutuality, which
refers to “determining among the parties who shall set relationship goals, who shall specify how
interactions will occur, and who shall exercise power to influence the other” (p. 50),
communality, or “the degree to which parties in a relationship share mutual concerns, values, and
identities” (p. 51), trust, “defined as whether one partner in a relationship believes that the other
partner will behave as expected…or as promised” (p. 51), and satisfaction, or “one party’s
overall assessment of the performance of the other party in light of one’s expectations” (p. 51).
Hallahan further describes each of these elements and suggests “reliable index measures” that
could result from these particular items.
Several of these concepts – and additional constructs – were tested by Huang (2001) in the
development of the Organizational-Public Relationship Assessment (OPRA). Huang (2001)
operationalizes the relationship between an organization and the public, previously described by
Huang (1997) as consisting of a relationship between a corporate person and another corporate
person or relationships between a corporate person and a group of seemingly unrelated
individuals” (Huang, 2001, p. 65). Huang (2001) further noted that an organization-public
relationship was “subjective experience rather than objective quality” and typically consisted of
resource exchange at both interpersonal and interorganizational levels (p. 65). Huang’s measure
includes dimensions of trust, control mutuality, relationship satisfaction and relationship
commitment. Huang (2001) argued that trust and satisfaction capture both cognitive and
45
affective components of relationships, and that commitment encompasses degree of resource
exchange, thus capturing the behavioral component of interorganizational relationships.
Hallahan (2008) further advocated for the need to capture affective, cognitive, and behavioral
outcomes as a result of communication with the organization, and the inclusion of trust,
satisfaction, and commitment in this survey capture those outcomes.
Control mutuality was not included in the measure used in this study. Although this
concept does capture power asymmetry in relationships between organizations and the public
(Huang, 2001), items as worded by Huang as well as Hallahan (2008) did not lend themselves
well to the complex web of relationships present in this study. Given that stakeholders in this
study may participate in Community Reach activities because of an organizational partnership or
as an individual without an organizational affiliation, control mutuality proved to be a difficult
construct that added length to the survey. Instead, items pertaining to communality were
included to assess common values between Community Reach and stakeholders.
Given the diversity of nonprofit stakeholders and forms of participation present in this
study, it is likely that participants in the collaboration experience different outcomes. The
particular outcomes in this study include commitment, trust, common values, and satisfaction
with the collaboration, theorizing that such outcomes may be related to how stakeholders.
RQ7: What are the outcomes of stakeholder participation in nonprofit collaboration?
The literature review revealed the many challenges associated with stakeholder
identification and participation in interorganizational collaboration; although this review made an
effort to emphasize communication pieces on stakeholder involvement, much of the work on
stakeholder theory has developed in other disciplines. This research suggests an opportunity to
add to our understanding of who are stakeholders in collaboration and how they interact with the

46
collaboration and with each other. The next chapter describes in detail the collection and analysis
of data in response to these research questions.
47
CHAPTER 3: Method
To better understand diverse stakeholder participation in nonprofit collaboration, this
research consists of a mixed method study comprised of interviews and surveys at a particular
nonprofit network emphasizing educational outcomes. This chapter describes the study,
including the design and research context, as well as the participants, procedure, measures, and
data analysis detailed in each of the three phases of data collection.
Mixed Method Design
The study uses a mixed method approach to understanding stakeholder participation in
nonprofit collaboration. Although several studies of collaboration or stakeholders combine
methods, few researchers indicate the extent to which they mixed methods, whether some
methods took precedence over others, or justification for mixing. From these studies, readers
may infer that the phenomena being studied is complex enough to warrant multiple approaches
to collecting data, but readers are largely left to draw their own conclusions as to why the
researchers took this approach. Such uncertainties can be reduced by stating a mixed method
design and purpose.
Mixing methods suggests some promising directions for organizational communication
scholars (Miller et al., 2011). Mixed method research is described as “research in which the
investigator collects and analyzes data, integrates the findings, and draws inferences using both
qualitative and quantitative approaches or methods in a single study or program of inquiry”
(Tashakkori & Creswell, 2007, p. 4), and may be particularly helpful for scholars exploring
under-researched phenomena, such as stakeholder involvement in a nonprofit collaborative
context.
48
Given that organizational research bemoans the lack of stakeholder input but also calls
for quantitative measures, this study aims to capture both qualitative and quantitative data for
purposes of methodological or instrumental development. Development refers to the application
of multiple methods to study a set of constructs or phenomena in which the results of one method
are then used to shape the development of another method (see Greene, 2007). Greene (2007)
further noted that this is not an uncommon approach within mixed methods or social science, as
researchers commonly collect qualitative data for the purposes of learning about a context before
developing a survey or questionnaire based on this input. Although this is the most common use
of development, this still allows the researcher quite a bit of freedom in terms of the extent to
which data is mixed.
Scholars have previously suggested a number of factors that could influence how mixed
method studies are shaped, including the extent to which different methods are implemented
within same or different paradigms, whether qualitative and quantitative methods are used to
evaluate different or the same phenomenon, the similarity or difference of the methods
themselves, the status of the methods, the independence of methods, the timing of their
implementation, and whether the findings are revealed in one study or more than one study (see
Greene et al., 1989, Greene 2007; see also Creswell, Teddlie, & Tashakkori, 2003). While this
list may be appear somewhat daunting – and, indeed, it offers a number of possibilities for mixed
method designs – a number of templates exist. Mixing methods for purposes of development,
for example, lends itself to an integrated design called iteration, in which methods can be of
equal or unequal weight but are implemented sequentially (Greene, 2007). This design forms the
basis for this study of stakeholder participation in nonprofit collaboration.
49
The research takes place in three parts: first, a survey was conducted to identify
organizational stakeholders. Interviews were then conducted with a representative sample of 20
stakeholders, and these interview responses then informed the development of a survey deployed
to the entire stakeholder list. Both interviews and surveys have been used in previous research to
capture stakeholder perspectives.
Interviews are commonly used in collaboration research (see Babiak & Thibault, 2009;
Eweje & Palakshappa, 2009; Heath 2007; Leach, Pelkey, & Sabatier, 2002; Medved et al., 2001)
and stakeholder research (see Arenas, Lozano, & Albareda, 2009; Bouckaert & Vandenhove,
1998; Bruce & Shelley, 2010; Burchell & Cook, 2008; Cotton & Devine-Wright, 2012; Jamali,
2008;). Questionnaires are also common in collaboration research (see Arya & Lin, 2007;
Eweje & Palakshappa, 2009; Foster & Meinhard, 2002; Guo & Acar, 2005; Leach, Pelkey, &
Sabatier, 2002; and Medved et al., 2001), though much less so in stakeholder research (see
LeRoux, 2009; Podnar & Jancic, 2006). Additionally, these measures allow for collection of
network data, which is again common in collaboration research (see Cooper & Shumate, 2012).
Network ideas are common in stakeholder research (see Brickson, 2007; Frooman & Murrell,
2005; Rowley, 1997; Rowley & Moldeneau, 2003), though seldom used in stakeholder research
(Cots, 2011; for an exception, see Nowell’s (2009) study of stakeholder relationships’ impact on
collaboration effectiveness).
Research Context
The data for this study comes from “Community Reach,” the pseudonym for a nonprofit
network dedicated to improving educational outcomes. Education accounts for 18.2% of all
public charities in the United States, second only to human service organizations (see Roeger,
Blackwood, & Pettijohn, 2012), and in recent years, a number of nonprofit networks have
50
emerged in with the goal of boosting educational outcomes across a community. One of these
organizations, StriveTogether, is a national organization that advocates for network approaches
to improving educational outcomes from early childhood to career preparation and provides the
framework for Community Reach, the network featured in this research. Although many
nonprofit networks champion both stakeholder involvement and outcome measurement,
StriveTogether and its particular sites – including Community Reach – typically have some kind
of initiative intended to ensure stakeholder representation and improved outcomes, which make
these ideal projects for study. Both StriveTogether and Community Reach are described below.
StriveTogether.
StriveTogether was launched in 2006 in Cincinnati and Northern Kentucky with the
intention of encouraging cross-sector leadership to build systemic responses to problems in
education. By building an organizational network across the region, StriveTogether boasts an
improvement in educational statistics across the Cincinnati area over the first five years of the
network’s efforts.
The values of the network are described as follows: “StriveTogether connects, supports,
and facilitates a growing network of communities that are committed to building the civic
infrastructure necessary to support the success of every child from cradle to career. The approach
requires communities to come together to hold themselves collectively accountable for student
success and to continuously improve their support to children by letting data drive action and
decision-making. StriveTogether’s mission is to build the capacity of communities to
dramatically improve educational outcomes for every child from cradle to career by providing
strategic assistance, network connections and high-quality resources” (P. Kothari, personal
communication, January 9, 2014). StriveTogether’s emphasis on “cradle to career” includes
51
kindergarten readiness, accomplishment of various milestones throughout grade school as well as
vocational training and/or college preparation, relying on a system approach to meet students and
families at a variety of critical points.
The national presence of StriveTogether provides many sites for study, but additionally,
StriveTogether’s emphasis on outcomes and data-driven decision-making lends itself to research.
StriveTogether’s four pillars – shared community vision, evidence-based decision-making,
collaborative action, investment and sustainability (www.strivetogether.org) – provide the
perfect context for exploring how diverse stakeholders participate in a nonprofit collaboration, as
well as outcomes of that participation. With this in mind, I contacted StriveTogether to inquire
as to whether they would have any sites from their Cradle to Career Network that would be
interested in participating in this study.
The Cradle to Career program pioneered by StriveTogether has been replicated in 37
states, and in 2011 the Cradle to Career Network was initiated in order to share curriculums and
lessons learned. StriveTogether describes Cradle to Career communities as those who “[1]
commit to work toward achieving quality benchmarks for building and sustaining cradle to
career civic infrastructure and [2] actively participate in a community of learning and practice
with their peers in which knowledge is shared and created” (www.strivetogether.org).
Community Reach is one such community.
Community Reach.
“Community Reach,” a pseudonym, has been a member of the StriveTogether network
since 2012. Community Reach is located in the Midwest and is comprised of a 10-county
region that includes both urban and rural communities. As part of the StriveTogether model,
Community Reach retains the same values of a shared community vision, data-driven decision
52
making, and cross-sector partnership. But, as also in the case of StriveTogether model, the
network is encouraged to set its own goals. Community Reach’s primary goal is to increase the
number of higher degree or credential-holding residents to 60% by the year 2025. This is a fairly
ambitious goal; the targeted 60% far exceeds the state’s present number of college graduates,
which is closer to 30%.
To accomplish this goal, Community Reach has a staff of 12, though only two full-time
employees are devoted wholly to Community Reach. Other staff members provide a portion of
their time to Community Reach initiatives in conjunction with their positions with Community
Reach partners and other network affiliates. The annual budget for Community Reach is
$485,000.
As part of the “cradle to career” emphasis and cross-sector leadership, the Community
Reach network includes representatives from numerous organizations and backgrounds. Partners
come from a variety of organizations representing early childhood learning, K-12 education,
adult education, nonprofit and community services, local government, businesses, philanthropic
organizations, and economic development. Nearly 100 organizations, though the participation in
Community Reach is so dynamic that it is difficult to calculate the exact number of participating
organizational partners. Individuals from various organizations serve on teams or councils within
the broader Community Reach network to help achieve its specific goals. The presence of so
many varied individuals provides a rich context for exploring stakeholder participation and
interaction within a nonprofit collaborative network.
One of the concerns in stakeholder and collaboration research is that studies typically
include perspectives from one type of stakeholder, commonly an organizational insider. Studies
of collaboration typically rely on self-report data from only one stakeholder perspective (Lewis,
53
2006). Additionally, it has been acknowledged that studies of stakeholders typically rely on the
organizational perspective (Friedman & Miles, 2002), and researchers know little about how
other stakeholders experience collaboration (Butterfield, Reed, & Lemak, 2006). Even the
occasional study that focuses on nonprofit stakeholders in collaboration rarely distinguishes
between stakeholders or emphasizes the role of leaders instead of underrepresented stakeholders
(see Koschmann, 2008). This research includes the perspectives of diverse stakeholders,
including those frequently studied (leaders within the Community Reach network) and those
rarely represented (those who support Community Reach financially or benefit from its services).
Because recruiting various stakeholders for this study was a multi-step process, data collection
and analysis were conducted in three phases. The first phase consisted of stakeholder
identification, the second phase included the collection of interviews and development of survey
categories, and the third phase consisted of survey implementation. Each of these phases is
described below, including participants, procedures, measures and analysis, and IRB materials,
including recruiting letters and consent forms, may be found in Appendix A.
Phase 1: Stakeholder Identification
Participants.
Participants in this stage were those identified by Community Reach as stakeholders.
The director of Community Reach provided the names of 99 stakeholders. This group included
various leaders in the community, particularly nonprofit leaders, educators at every level from
early childhood to university, and representatives from community foundations, government
organizations, and local businesses.
54
Procedure.
After securing a letter of commitment from the Community Reach director, I asked the
director to provide me with a list of organizational stakeholders, using Freeman’s 1984
definition. The director provided me with the names and contact information for 99 people
identified by Community Reach as having the ability to affect or be affected by the network’s
activities. After the director of Community Reach introduced me via e-mail to these 99
stakeholders and explained the purpose of my study, I then contacted each of the 99
stakeholders. Participants received an introductory e-mail that further explained the study with
the pre-survey attached as a Word document. Participants were asked each of them to generate
names of additional Community Reach stakeholders and return the pre-survey via e-mail.
Stakeholders were told that they may be asked to participate in a follow-up interview and/or a
survey.
Measure.
The pre-survey consisted of a Word document in which I used Freeman’s (1984)
definition to describe a stakeholder as “any group or individual who can affect or is affected by
achievement of Community Reach’s objectives.” I then asked the respondents to list the
person’s name, e-mail address, and their stake in Community Reach, which referred to the ways
in which the person affects or is affected by the activities of Community Reach.
I used Wood and Gray (1991)’s framework in which they refer to collaboration as
happening around a problem domain (in this case, improving educational outcomes) and
stakeholders of the collaboration (as opposed to stakeholders of an organization). According to
Wood and Gray, collaboration may rely on the following forms of stakeholder representation: 1)
the most interested stakeholders (may be interested in problem or collaboration); 2) the most
55
powerful stakeholders; 3) the inclusion of majority of stakeholders in a problem domain to create
social norms that result in pressure to participate; and 4) the inclusion of organized stakeholder
networks in problem domain. The problem domain refers to a group of organizations linked to a
particular problem (see Emery & Trist, 1965; Trist, 1983) and has been suggested as a more
appropriate fit for theorizing than individual organizations (see Gray & Wood, 1991). Wood and
Gray suggest that the outcomes of collaboration may be different depending on which types of
stakeholders are included; to capture a wide variety of stakeholders, participants filling out the
questionnaire were asked to identify those stakeholders most interested in improving educational
outcomes, those stakeholders most interested in working with others in Community Reach, the
most powerful stakeholders in that they had the ability to affect Community Reach, and the most
organized stakeholders in that they know, participate, or coordinate activities with other
stakeholders (see Appendix B).
Analysis.
Of the 99 stakeholders I initially contacted via e-mail, 18 people returned the survey
(18.2 %). Two additional respondents affiliated with local schools considered parents part of the
school organization; these individuals sent a recruiting letter to parents and allowed parents to
contact me directly as stakeholders who were interested in educational outcomes. These efforts
resulted in a list of 541 names, though the list contained some duplicates.
To analyze the stakeholder lists, I relied both on the Wood and Gray (1991) classification
as well as the stakes provided by Community Reach on their website that indicated groupings of
educators, business leaders, government, and nonprofit representatives. The stakes listed varied
in their specificity; some were very concise and neatly echoed Community Reach’s own
classification – for example, “interested in early childhood education” is easily understood as
56
early childhood learning, whereas a principal of a local school at the K-12 level is classified as
school systems. However, other stakes were more difficult to sort out, as some of the
descriptions listed were very general (for example, “interested in education”). To better place
these stakeholders, I looked to other cues alongside their listed stake; for example, “.org” listed
in an e-mail address generally indicated a nonprofit organization, while “.edu” in an e-mail
address suggested a university affiliation. Some stakeholder names were preceded by titles (for
example, Mayor or Senator). These titles – as well as other organizational affiliations listed in
either the stakes or the contact information – could typically be verified by a Google search.
Some individuals could not be properly identified because the individuals couldn’t be found, in
which case I listed them as “couldn’t be classified” alongside their stakeholder roles.
There are undoubtedly some categories that overlap; for example, many universities are
nonprofits, but the stakeholder’s affiliation with a university represented a stake clearly
identified by Community Reach as “colleges/universities.” Additionally, community
foundations are nonprofits but are recognized as a separate entity according to Community
Reach’s classification, so the nonprofit representatives classification used throughout this paper
refers to social service organizations.
In addition to the stakes listed by Community Reach, I added “Parents” as a separate
stake after two of Community Reach’s identified stakeholders suggested that parents were
stakeholders in Community Reach. Both individuals acknowledged that the definition of
“stakeholder” provided would likely include parents, but that they felt uncomfortable giving out
this information – and of course, that there were logistical challenges in identifying all these
stakeholders. They invited me to write a letter explaining the project and asking interested
parties to contact me to participate, which they in turn sent home with children at the school.
57
Any parents interested in participating were then classified as “most interested in improving
educational outcomes.” Using this method, I had several parents contact me and indicate they
were interested in participating. I created a category for “Parents” without any additional
affiliation, recognizing that some of the people listed as stakeholders were likely to be parents
themselves, although their being parents was not identified as being their “stake” in Community
Reach. The other change I made to Community Reach’s classification was to change the
“Government” stake to “Civic.” In addition to elected leaders, several individuals listed
representatives from the judicial system or government agencies such as libraries, which are now
included in the civic category.
I maintained the list of 541 stakeholders (Community Reach’s 99 stakeholders as well as
the 442 identified through the pre-survey) to explore frequencies and relationships among stakes,
but I also needed a pared down list to serve as a pool for interview subjects. When duplicate
names were removed, the new list totaled 264 stakeholders. With the goal of conducting
interviews with 20 stakeholders, I contacted 32 stakeholders, or eight stakeholders from each of
the four categories (most interested in education, most interested in working with others, most
powerful, most organized). I generated these lists by creating a spreadsheet of the list of
participants, and randomly selecting a number of participants using randomizer.org. After
generating a list of participants, I checked the list to remove duplicate names (as some
stakeholders were described, for example, as being both “most powerful” and “most organized”
and thus could appear on multiple lists), to ensure that the participants I contacted were
recommended by a variety of people, and that diverse stakes were represented. I continued to
refine these lists using randomizer.org until I had a sample representative of the different stakes
and different recommenders as provided in the original lists.
58
Phase 2: Interviews and Categorization
Participants.
All interview participants were adults, ranging in age from approximately late 20s to
approximately early 60s; 8 of the interview participants were male, and 12 interview participants
were female. Interview participants represented six of the 10 counties that participate in
Community Reach. Interviewees included nonprofit representatives, funders, parents, elected
officials, and educators (superintendents, principals, and teachers ranging from early childhood
to adult education). Interviewees had varying levels of awareness of Community Reach; most
had heard of Community Reach but participated to varying degrees, and others had never heard
of Community Reach (n =5). Of the 20 interview participants, 3 had been identified as “first-
order” stakeholders by Community Reach in addition to being identified, either by themselves or
by other first-order stakeholders, in the pre-survey according to the Wood and Gray (1991)
categories. Seventeen of the 20 interview participants were “second-order” stakeholders
identified by the first-order stakeholders.
The interviewees fit within the Wood and Gray (1991) categories that served as the
template for my study. Because of many of the stakeholders were classified in multiple
categories, it was possible for an interview participant to be labeled as both “most powerful” and
“most organized,” for example. Nine of the 20 interview participants were identified as most
interested in educational outcomes, six interview participants were labeled as most interested in
working with others, and seven participants were identified as most organized and most powerful
stakeholders, respectively.
59
Procedure.
I conducted 20 interviews in the fall of 2013. Seven of these interviews were conducted in
person; Community Reach provided me with a private office in which I could conduct interviews
with those participants who could attend in person. An additional 13 interviews were conducted
over the phone with those who live and work across Community Reach’s region but not
necessarily in the town where Community Reach is located. All interviews were recorded and
transcribed verbatim, with transcripts sent back to participants for any additional corrections or
clarifications. The interviews generated over 270 pages of text. Interviews ranged from
approximately 10 minutes to 45 minutes, and participants were offered $10 in compensation for
their time.
Measure.
Interviewees were asked 13 open-ended questions about their knowledge and opinions of
Community Reach, as well as how they participated in Community Reach, and whether there
were barriers to or benefits of their participation in the network (See Interview Protocol,
Appendix B).
Analysis.
Interviews were analyzed in two parts and for different purposes as described here. First,
interviews were coded and analyzed for the purpose of developing categories for the survey.
After the implementation of the survey, I then returned to the interviews for additional analysis.
Each analysis is described in turn.
First, I then read through each interview response to look for themes that pertained to five
categories that would be measured through the survey: 1) interviewees’ ways of getting
information about Community Reach, 2) how the interviewees participated in Community
60
Reach, 3) perceived barriers to participation, 4) perceived benefits of participation, and 5)
different stakeholder types. With these categories in mind, I went back to all 20 interviews to
look for coherence across these five groups. I then set up a codebook of these themes and loaded
them into Atlas.ti. I coded a sample and then talked through the codebook with a research
assistant. This researcher and I coded 20% of the data, or approximately 54 pages of transcripts.
I then exported the results of our coding and hand-matched the codes from myself and the other
researcher to look for discrepancies. The researcher and I then consulted on these discrepancies
and the codes themselves, making slight changes to the wording or consolidating similar codes.
These codes were then modified to serve as response categories for five questions on the survey.
Second, I returned to the interview data for further analysis in Atlas ti, following the
grounded theory protocol in which the researcher continues to collect data while analyzing
earlier-collected data (see Charmaz, 2006) in order to arrive at a set of descriptive themes. I
created an initial list of themes during the first round of open coding. Next, I looked for patterns
across these themes, consolidating codes and “free writing” about emerging themes, talking
through these themes with the research assistant. Through focused coding, I arrived at a list of
several code “families,” including stakeholder roles, wicked problems, part-whole competition,
organization versus network experiences, and participation. Having identified these themes, I
then returned to the interview data to look for any inconsistencies with these themes as well as to
develop an overall theme through axial coding.
Phase 3: Survey Implementation
Participants.
The sample for the survey included both the first-order stakeholders (the 99 stakeholders
originally identified by Community Reach) and the second-order stakeholders (the total list of
61
names generated by the first-order stakeholders). Of the 264 participants who received the
questionnaire, 15 e-mails bounced back. As a result, the survey went out to 249 people, and
participants received e-mail reminders, and 116 completed the questionnaire (46.6%). As was
the case for the previous rounds of data collection, participants represented a variety of
educational “stakes,” stakeholder roles included nonprofit representatives, funders, parents,
elected officials, superintendents, school board representatives, principals, librarians, and
educators at several levels, including early childhood, K-12th
grades, university and adult
education.
Of the participants who noted their gender on the questionnaire, 49.1% were female and
44% of respondents were male. The majority of respondents were at least in their mid-40s; 44%
reported their age as being between 55 and 64, 14.7% in the 45-54 range, and 12.1% of
respondents were over the age of 65. Participants also identified overwhelmingly as white/non-
Hispanic (90.5%), wealthy (38.8% of participants reported a combined household income of
over $110,000), and educated, with 65.5% of participants reporting that they had earned a
postgraduate degree or certificate and approximately 6% of survey respondents who indicated
they had not finished college. All 10 counties named in the Community Reach region were
represented. Other than the stakes they were named to represent, less is known about the racial,
ethnic, educational or economic demographics of non-respondents.
Procedure.
The survey was deployed online for 4 weeks in January and February 2014. The
questionnaire was built in Qualtrics and e-mailed to 249 participants. Participants filled out the
questionnaire online; data collection was completed in February 2014. Survey participants were
compensated in the form of a lottery; 1 out of every 10 participants was awarded $20.
62
Measure.
The questionnaire consisted of 19 questions. Participants were asked whether they were
familiar with Community Reach. Those that indicated they had heard of Community Reach
filled out the complete survey, which asked participants how they got information about
Community Reach, how they participated in Community Reach, perceived barriers to
participation, and perceived benefits of their participation in Community Reach, in order to
answer RQs 4-6. This cluster of survey questions used response categories gleaned from the
interviews. In addition, the survey included 20 outcome measures pertaining to organizational
commitment, common values, trust, and satisfaction developed from Hallahan (2008) and Huang
(2001) for RQ 7. Each of these outcomes were measured by 5 scale items and reported in terms
of Cronbach’s alpha; reliabilities for these items were as follows: commitment (α = .86),
common values (α =.73), trust (α =.85), and satisfaction (α = .91)
Participants were also asked with whom they communicated about educational issues and
specifically about Community Reach; these questions listed stakeholder categories distilled from
the interview responses (RQs 1-2). Participants who said they had not heard of Community
Reach were only asked with whom they communicated about educational issues and how they
identified themselves based on stakeholder categories distilled from the interview responses. All
participants were asked for standard demographic information, including age, gender,
race/ethnicity, education attained, income level, and in which counties the participants lived and
worked.
Analysis.
Data was collected through Qualtrics and entered into SPSS. Of the 116 people that
completed the questionnaire, 92.2% of the respondents had heard of Community Reach. Of
63
these 54.3% said that they were “very familiar” with the goals of Community Reach, and 33.6%
indicated they were “somewhat familiar” with the network’s goals. Only 4.3% of survey
participants indicated that they were “not familiar at all” with Community Reach’s goals. Only
those who indicated they had heard of Community Reach were asked every question, ensuring
that those who had not heard of Community Reach did not respond to questions regarding
participation or outcomes.
64
CHAPTER 4: Results
The research questions posed in this study pertain to stakeholder relationships, stakes
represented in the collaboration, stakeholder participation, stakeholder differences in
participation, and stakeholder outcomes. This section previews how each research question was
answered, followed by the findings for each question.
To answer RQ1 (Who do stakeholders talk to about education in a nonprofit
collaborative network?), I analyze the survey responses in which stakeholders identified
themselves (Q11) and indicated who they talked with about education in general (Q10). For
RQ2 (Who do stakeholders talk to in the context of Community Reach?), I use the self-
identification data and survey data in which stakeholders indicated whom they spoke with about
Community Reach (Q9). Because these questions pertained to stakeholder relationships, I use a
network analysis approach to explore relationships between stakeholders. I report stakeholder
ties for each RQ and calculate average out-degree centrality and in-degree centrality that indicate
to what extent the stake groups interact with other stakes.
For RQ3 (What are the stakes in this nonprofit collaboration?), I use the initial list of
stakeholders provided to me by Community Reach, as well as the pre-survey that identified
additional Community Reach stakeholders to determine the stakes represented according to those
listed on the Community Reach website. I explain each stake, give the frequency for how often
each stake was reported in each stage of data collection, and calculate a chi-square to determine
whether Wood and Gray’s (1991) categories for stakeholder classification (most interested in the
issue, most interested in others, most powerful, and most organized) are related to stakes named
by Community Reach stakeholders.
65
RQ4 (How do stakeholders participate in nonprofit collaboration?) is determined by the
survey data. I use survey responses to report the frequencies of stakeholder participation (Q3)
and frequencies of the various types of stakeholder participation as developed by the interview
data (Q5).
RQ5 asks about stakeholder differences according to participation (Do different
stakeholders participate in the collaboration in different ways?). To answer this question, I
consolidate the self-identification data from the survey (Q11) into stakes. I do a chi-square test
to determine whether individuals representing different stakes are more likely to participate (Q5)
in specific forms.
Following this research question, RQ6 also pertains to stakeholder differences (How do
different stakeholders perceive nonprofit collaboration?). As with the previous question, I use
the self-identification data from the survey and run chi-square tests on benefits of participating in
Community Reach (Q6) and barriers to participating in Community Reach (Q7) to see if
stakeholders with different stakes perceive different benefits or barriers in Community Reach.
Finally, to answer RQ7 (What are the outcomes of stakeholder participation in nonprofit
collaboration?), I use the survey data to calculate mean outcome measures of stakeholder
commitment, common values, trust, and satisfaction (Q8). I then create regression equations that
indicate whether these outcomes can be predicted by various forms of participation (Q5), and use
ANOVAs to explore whether the different stakeholders report any significant differences in
outcomes. The results for each research question are further explored in turn.
RQs 1 and 2
The first two questions pertained to stakeholder relationships by asking what
relationships exist among stakeholders in a nonprofit network as well as specifically within
66
Community Reach. Survey participants (n = 116) were asked to identify themselves from a list
of stakeholder roles, as well as indicate whom they talked to about general issues in education.
Given that some of these stakeholder roles were very specific (i.e., librarian, school social
worker, etc.), these roles were then consolidated into stakes to reflect Community Reach’s self-
described network of businesses, early childhood learning, school systems, colleges/universities,
adult workforce and economic development, foundations, nonprofit organizations, and
government.
Ten different stakes were identified: 1) Early Childhood education (pre-kindergarten
educators), 2) School Systems (comprised of K-12 educators and administrators), 3) University
level educators, 4) Nonprofit organizations (social service organizations), 5) Civic organizations,
6) Economic Development (representing local business leaders), 7) Funders who support
Community Reach financially, 8) Volunteers in Community Reach, 9) Parents of children under
24 years of age, and 10) Membership in one of the three regional networks that supports
Community Reach1. Stakes are not mutually exclusive; that is, an individual could be a local
business owner (Economic Development) and support Community Reach financially (Funding),
as well as have a child in the local school system (Parent). Thus, the total number of stakes
represented (n = 250) is higher than the number of survey participants (n = 116). Frequencies for
each of the stakes are included in Table 1, with reported ties between stakeholders in Table 2.
Using UCINet (Borgatti, Everett, & Freeman, 2002), degree centrality was calculated to
determine who stakeholders talked to about educational issues. An actor’s degree centrality is
described as the numbers of ties to other actors in the network; centrality indicates an actor’s
connection to other actors and therefore access to information and resources (Rowley, 1997).
1 Stakes are capitalized throughout the paper when referring to groups of individuals representing the
stake.
67
Network centrality was calculated, and then average out-degree centrality was calculated by
dividing the out-degree statistic for each stake by the number of people representing that stake to
complete the survey. Table 3 indicates the averages for out-degree centrality (M = 5.79, SD =
.48) and in-degree centrality (M = 144.800, SD =29.580).
Out-degree centrality refers to who stakeholders indicated they talk to, and survey
participants largely communicated with Economic Development professionals, Network
members and Volunteers. Early Childhood educators record a high average out-degree centrality
as only 4 people representing these stakes filed out this survey, but their overall presence in the
tables representing the block model indicate that they are seldom sought out. School systems
stakeholders report a lower out-degree centrality score but the highest in-degree centrality,
indicating they are talked to about educational issues.
These figures do not represent a “closed” network; that is, Community Reach is not
comprised solely of the 116 individuals surveyed here. Additionally, in answering this question,
some individual stakeholders are also likely referring to other Community Reach stakeholders
who did not fill out the survey. As such, it is important to note that, for RQs 1 and 2, rather than
reflecting individual stakeholder relationships in a two-mode network, these figures represent
consolidated stakes. These stakes are reflective of how Community Reach publicly describes the
network on its website and, given the size and scope of this network, stakes provide a useful
representation of individuals representing various interests as opposed to individual relationships
between named stakeholders. The degree centrality measures are highly dependent on which
individuals are talking to each other about education or about Community Reach; such data can
also be represented visually. Figure 1 depicts how the 10 different stakes communicate with
each other about education.
68
In Figure 1, the size of each node represents the extent to which those within each stake
talk to each other. The larger nodes for Economic Development, Network Membership, and
School Systems reflect not only the number of people within each stake who filled out the
survey, but that individuals within each respective stake are likely to talk to each other about
educational issues. As seen in Table 2, 13.9% of Network members’ communication with other
stakeholders occurs with other network members. The majority of School Systems’ interactions
about education take place with other School Systems stakeholders (14.4%), and largest number
of Economic Development stakeholders’ interactions about education occurs with other
Economic Development stakeholders (13.5%). The strength of ties between each node depicted
in Figure 1 also indicate particularly strong connections between Economic Development
stakeholders and a number of other stakeholders; this is also seen in Table 2 in which Economic
Development stakeholders report the greatest number of ties overall (312), and also reveals
rather tenuous ties with other groups, such as Early Childhood Educators (7).
The second research question pertained to stakeholder communication about Community
Reach. Reported ties between stakeholders are listed in Table 4, with degree centrality statistics
are reported for stakeholder conversation pertaining specifically to the network included in Table
5.
Overall, fewer connections were reported (out-degree centrality M = 3.95, SD = .725) and
in-degree centrality (M = 101.300, SD =31.610). Such findings are unsurprising given that they
reflect communication specifically about Community Reach rather than more generally about
education. There are some similarities across the two groups; for example, stakeholders report
more communication with those representing Economic Development stakes, Network
membership, and Volunteer stakes, while Parents, representatives of Civic groups, and Early
69
Childhood Educators (Pre-K) are seldom sought out in communicating both about education in
general as well as specifically about Community Reach. There are also a few notable
differences. More stakeholders reported talking to Nonprofit representatives about educational
issues than about Community Reach. The network visualization further shows the relationships
between these groups.
Although Network members and Economic Development stakes are again the most
central players in this network, the node size also indicates that those representing these stakes
are more likely to talk to each other about Community Reach. Network members report that
16.5% of their relationships pertaining to Community Reach occurs with other Network
members, while Economic Development stakeholders indicate that 14.8% of their partnerships
are with those representing Economic Development. University educators, while slightly less
central than School Systems, report the most relationships with other University educators in
regards to Community Reach (18.0%), and even report more ties to Network members (15.1%)
than to stakeholders representing School Systems (12.9%).
In exploring stakeholder communication about educational issues as well as about
Community Reach specifically, Economic Development and Network membership were found
to play a large role. The next section further explores these groups, as well as other stakes
represented in Community Reach.
RQ3
In answering the third research question (What are the stakes in this nonprofit
collaboration?), I started with the list of stakeholders provided to me by Community Reach, as
well as the pre-survey that identified additional stakeholders. These stakeholders were organized
by their stake in the collaboration and classification according to Wood and Gray’s (1991) order
70
of most interested in improving educational outcomes, most interested in working with others,
most powerful, or most organized. Eighteen of 99 stakeholders (18.2%) returned the survey,
which, when combined with the original 99 names, resulted in 541 total named stakeholders.
The StriveTogether model is one that encourages cross-sector collaboration, and
Community Reach’s website echoes this by describing their own network as one that combines
leaders from businesses, early childhood learning, school systems, colleges/universities, adult
workforce and economic development, foundations, nonprofit organizations, and government.
This description was used to classify the stakeholder names provided by Community Reach as
well as those names provided by other stakeholders.
In reflecting on the stakes listed, it is worth noting the overall stakeholder list contains
duplicate names. The pre-surveys generated over 500 names which, with duplicates removed,
totaled 263 individuals. The 263 stakeholders provided the pool for the survey, but I used all
541 names to get a sense of what stakes were represented. For example, 40 stakeholders
representing Early Childhood education were named in the pre-survey. These are not necessarily
40 different Early Childhood educators; this instead serves as a record that Early Childhood
Educators were named as stakeholders 40 times on the pre-surveys. Tables listed at the end of
the chapter reflect the original stakeholder list (n = 99) provided to me by the director of
Community Reach (Table 6), as well as the classifications of stakeholders provided by the
Community Reach-identified stakeholders (Table 7).
There are differences between the frequencies of stakeholders identified by Community
Reach and stakeholders identified by other stakeholders. For the stakeholders identified by
Community Reach, several individuals represented a religious affiliation or organization or a
regional network, but neither of these appeared as stakes in the pre-survey named by other
71
stakeholders. No parental affiliation appeared on the list provided by Community Reach, though
several parents were identified in the second round of stakeholder identification.
Additionally, there are differences between the two groups. The largest number of
Community Reach-identified stakeholders fell into the Nonprofit category (approximately 21%).
However, nonprofit representatives were named less frequently in the pre-survey, constituting
just 8.6% of the overall sample. The Economic Development group, constituting 15% of
Community Reach-identified stakeholders, also grew slightly when referred to by other
stakeholders, representing 20.1% of the sample identified by other stakeholders. School Systems
was another area of difference, representing just 12% of the stakeholders identified by
Community Reach but the largest sample – approximately 24% - identified by other
stakeholders.
Organizing the stakeholders according to Wood and Gray’s (1991) categories also proved
interesting. For example, Community Foundations comprise a small number of named
stakeholders (less than 10%) but are more heavily represented in groups of organized and
powerful stakeholders. Those representing Civic stakes are also a smaller group but seen by
others as more powerful, and nonprofit representatives, despite their smaller presence on this list,
tended to be named as most interested in working with others. Using the frequencies reported
for each category (as described in Table 7), an 8x4 contingency table was used to calculate the
association between the stakes and Wood and Gray classification (see Table 8). The resulting
statistic (χ2 (21) = 80.875, p <.001) indicates that classification as “most interested in education,”
“most interested in working with others,” “most powerful,” or “most organized” is highly
dependent on stake.
72
In addition to classifying individuals according to “stake,” interviews allowed for further
development of stakeholder roles. While Community Reach’s language indicates particular
stakes – for example, School Systems or Economic Development – and that provides a useful
framework for organizing this data, the “stakes” listed on the pre-survey were also at a nuanced
level. For example, although School Systems might be one’s stake, individuals could be a school
board member, a teacher, or a principal, among other roles – and there are differences between
the groups. In the “most powerful” category, for example, nearly a quarter of those named
would be grouped as “School Systems” using Community Reach’s description. However, only
one named individual in this category was a K-12 Educator; all the others named “most
powerful” were school board members or superintendents. Likewise, although School Systems
accounted for 25% of stakeholders named “most organized” in that they knew other
stakeholders, these individuals were all school board members or superintendents – not a single
teacher or principal was named.
In addition to the roles named in the pre-survey, interviews revealed a number of
stakeholder roles that comprise each of these categories – and interview participants often
indicated that they played more than one role by being, for example, a local business leader as
well as a school board member. Interviewees talked about the importance of economic
development as a stake, but referred to a number of different individual roles, such as local
business owners or employers, or members of a local chamber of commerce. For the survey
deployed to all stakeholders, participants were asked to check all the stakeholder roles they
would use to describe themselves (see Table 9). The numbers for individual stakeholder roles
were then tallied to illustrate the number of survey participants representing stakes (see Table
10).
73
In terms of stakes represented, the largest group is Economic Development, which
comprised 40.5% of the survey sample – this is a higher percentage than represented in the
Community Reach stakeholder list and pre-survey. Educational groups, including School
Systems (comprised of K-12 educators, principals, superintendents, and board members), and
University/adult education were represented in the survey sample as well, although educational
stakes were represented to a lesser extent than economic stakes. Stakeholders representing Early
Childhood education turned out to be a smaller group in this survey than were named by
Community Reach or by other stakeholders.
Regional Network membership accounted for nearly a third of survey participants. In the
original list provided by Community Reach, several stakeholders were mentioned as affiliated
with local, regional networks. This was expanded on in interviews, in which participants
referred to a number of other regional networks that were instrumental in developing and
sustaining Community Reach. Three distinct networks were named: “Umbrella Network,”
“Project Network,” and “Convener Network,” all of which are pseudonyms for these initiatives.
Community Reach is convened and sustained through a partnership of three regional
networks. “Umbrella Network” is an economic development group that aims to attract
businesses to the area. One of Umbrella Network’s initiatives is “Project Network,” another
regional program created for the purpose of economic growth. Community Reach emerged out
of the goals developed in Project Network. Finally, “Convener Network” is a program of
Umbrella Network, and one of its roles is bringing together organizations and individuals to
comprise Community Reach. As seen in the above tables, members of these networks make up a
substantial number of survey participants; approximately 30% of survey participants reported
membership in at least one of these networks. Given the network roles in the development of
74
Community Reach, I created the variable “Network membership” to represent these groups and
their unique stake in Community Reach. Although there was one open-ended item that allowed
people to indicate that they were members of another educational network and list that network,
several of the listed networks were not, in fact, networks, but other individual organizations or
individual people noted by stakeholders. Because not all people that checked this category
listed a network, and some of the named networks were not actual networks, this category was
not included in the “Network membership” category.
Another new stakeholder role to appear on the survey is that of “Volunteer.” Although
no respondents to the pre-survey listed “volunteer” explicitly as a stake, a few interview
participants described volunteer activities in Community Reach. Based on these responses in the
interviews, the Volunteer category was added to the stakeholder roles on the survey. Out of 116
survey participants, 32 indicated that they identified as volunteers within Community Reach,
though these individuals who identified as Volunteers were also more likely to identify as
members of one of the regional Networks (χ2 (1) = 17.887, p < .001).
RQ4
The fourth research question asked how people participated in Community Reach.
Survey participants (n = 116) were asked how frequently they participated in Community Reach,
as well as to indicate all the ways in which they participated (see Table 11). Stakeholders
typically participated on a monthly (28.4%) or quarterly (28.4%) basis, with nearly equal
numbers of participants indicating that they participated only yearly (16.4%) or never (13.8%)
(see Table 12).
In terms of how stakeholders participate, the most common response was supporting
Community Reach’s mission of improving educational outcomes (77.6%). Just over half of the
75
survey participants indicated that they attend meetings hosted by Community Reach (55.2%),
with other common ways of participating being participating in decision-making by providing
feedback to Community Reach (45.7%), encouraging others to learn about Community Reach
activities (44.0%), or participating in actual Community Reach activities or programs (41.4%).
After this, there is a substantial dip in the ways that people participate, with inviting Community
Reach representatives to their community, having a child in the local school system, and
providing financial support being less common ways of participating. Only 10.3% of survey
participants indicate that they do not participate in Community Reach, and although the most
common way of participating in Community Reach was the rather nonspecific idea of
“supporting its mission” championed in interviews, only 11 respondents (9.5%) indicated that
that was their only form of participation in Community Reach. In other words, the most
stakeholders participate in more than one way.
RQs 5 and 6
Research questions 5 and 6 asked about the differences in participation based on
stakeholder type. Stakes were not mutually exclusive; that is, stakeholders could participate in
several ways as well as perceive multiple benefits or barriers of participation in Community
Reach. For example, in Table 11 reports the frequencies of stakeholder forms of participation.
Although 116 stakeholders filled out this survey, the total number of responses totals 364, which
indicates that many stakeholders noted multiple ways of participating. In order to look at
differences for RQ5, I did a chi-square analysis that generated 2 x 2 matrices for each
participation type and stake.
RQ5 asked whether different stakeholders participate in different ways, and in fact,
stakeholders do report differences in the ways they participate (see Table 13). Of the various
76
stakeholder roles, membership in at least one of the regional networks indicated that these
stakeholders were more likely to participate. Using Network membership as a stake, individuals
reporting network membership were more likely than those representing other stakes to support
Community Reach’s mission (χ2 (1) = 8.038, p < .01), participate in decision making by
providing feedback, (χ2 (1) = 5.953, p < .05), participate in specific Community Reach activities
(χ2 (1) = 7.165, p < .01), and encourage others to learn about Community Reach (χ2 (1) = 5.231, p
< .05). Of the individual networks, members of the Convener Network were more likely to
participate in decision making by providing feedback to Community Reach (χ2 (1) = 13.075, p <
.001), and Convener Network members were also more likely to participate in Community
Reach programs or activities (χ2 (1) = 16.276, p < .001) and to encourage others to learn more
about Community Reach (χ2 (1) = 10.473, p = .001).
Volunteers in Community Reach were also more likely to support Community Reach’s
mission (χ2 (1) = 6.639, p =.01), participate in decision making (χ2 (1) = 22.520, p < .001), attend
Community Reach meetings (χ2 (1) = 15.237, p < .001), participate in specific Community Reach
activities or programs (χ2 (1) = 20.592, p < .001), encourage others to learn about Community
Reach (χ2 (1) = 11.018, p =.001), and invite Community Reach representatives to their
communities (χ2 (1) = 4.339, p < .05). Although the “volunteer” stake consists of representatives
from different groups, the high number of volunteers who also identified as members of the local
regional networks likely accounts for some of these figures.
Although Volunteers and Network members indicated a greater likelihood of
participation, other stakes were represented. For example, inviting Community Reach
representatives to one’s community – a less common way of participating, as only 19% of survey
participants had selected this option – was slightly more common among those representing
77
Economic Development stakes (χ2 (1) = 3.886, p < .05). At the stakeholder role level – an
individual classification rather than the “Economic Development” grouping – business owners
and employers were more likely to indicate that they participated in Community Reach by
attending meetings (χ2 (1) = 6.465, p < .05).
The other main finding in RQ5 is the role of university educators. University educators
were more likely to indicate their participation through attending Community Reach meetings (χ2
(1) = 5.084, p < .05) and encouraging others to learn about Community Reach (χ2 (1) = 9.959, p
=.01).
The findings for RQ5 indicate that stakeholders do participate in different ways, and the
findings for RQ6 (How do different stakeholders perceive nonprofit collaboration?) also indicate
differences among stakeholders. Survey participants were asked to indicate all the benefits of
their participation in Community Reach, as reported in Table 14.
Among these perceived benefits, however, there were differences within both stake and
stakeholder type. The two groups more likely to participate – Network members and Volunteers
– also tended to report more benefits of the collaboration than other stakeholders. In particular,
Network members were more likely to say that educational outcomes are improving in their
community (χ2 (1) = 16.049, p < .001), that their organization was better known in the
community as a result of partnering with Community Reach (χ2 (1) = 22.246, p < .001), that they
felt they had the support of a larger group (χ2 (1) = 19.648, p < .001), that they received data or
metrics on education (χ2 (1) = 9.206, p < .01), that they meet more people interested in education
(χ2 (1) = 6.180, p < .05), that they felt good about their participation in Community Reach (χ2 (1)
= 8.47, p < .01), that they were more aware of issues in education χ2 (1) = 12.318, p < .001), and
that people in their community valued education more as a result of Community Reach (χ2 (1) =
78
13.833, p < .001). The latter is particularly interesting given that only 30.2% of overall survey
participants indicated that people in their community valued education more as a result of
Community Reach.
Following Network members, Volunteers in Community Reach were more likely to
perceive benefits of participating in Community Reach. Volunteers were more likely to indicate
that they meet more people interested in education (χ2 (1) = 16.876, p < .001), that they felt good
about their participation in Community Reach (χ2 (1) =16.987, p < .001), that they received data
or metrics on education (χ2 (1) = 6.214, p < .05), and that they were more aware of issues in
education (χ2 (1) = 6.162, p < .05).
Although only half of the sample (51.7%) reported that educational outcomes were
improving in the community as a result of Community Reach, several stakeholder groups were
more likely to list this as a benefit. In addition to Network members and Volunteers, those
stakeholder groups more likely to perceive this benefit include members of social services
Nonprofits (χ2 (1) = 13.062, p < .001), University educators (χ2 (1) = 9.566, p < .01), and Funders
(χ2 (1) = 5.243, p < .05).
Additionally, although only 23.3% of survey respondents indicated that their organization
is better known in the community as a result of partnering with Community Reach, University
educators (χ2 (1) = 8.830, p < .01) were more likely to perceive this as a benefit alongside
volunteers and network members. University educators also were more likely to indicate that
they feel the support of a larger group (χ2 (1) = 9.886, p < .01), and that they meet more people
interested in education (χ2 (1) =6.257, p < .05).
Stakeholders representing Economic Development were more likely to indicate they were
more aware of issues in education (χ2 (1) = 10.090, p =.001), as were Funders (χ2 (1) = 4.340, p <
79
.05). Among the groups representing economic development stakes, members of local chambers
of commerce stand out as being more likely to cite an increased awareness in education as a
benefit (χ2 (1) = 6.162, p < .05), and local business owners or employers were slightly more
likely to indicate that people in the community valued education more as a result of Community
Reach (χ2 (1) = 3.976, p < .05).
Stakeholders representing School Systems were less likely to indicate benefits of
participating in Community Reach. Despite the fact that stakeholders representing school
systems comprise 26.7% of the survey population, this group was no more likely to perceive
benefits of Community Reach than any other stake. Parents and Civic stakes also were no more
likely to perceive benefits of participating in Community Reach, although these stakes
represented small groups (11.2% and 9.2% of the total survey population, respectively). (See
Table 15).
The survey also asked stakeholders to comment on perceived barriers to collaboration.
Overall, survey participants reported few barriers to participating in Community Reach, and none
of the differences between stakeholder roles or across stakes were found to be significant. Table
16 reports these frequencies across stakeholders.
Although there were no significant differences among stakeholder groups, a full quarter
of all survey participants indicated that they were unclear as to what Community Reach is doing
to reach its goals. Other barriers to participation in Community Reach were participation in
similar networks (17.2%) and lack of time (16.4%), but these were the only barriers that recorded
numbers in double digits. Outside of these three, survey participants report few barriers to
participation (see Table 17).
80
RQ7
The final research question asked what outcomes resulted from stakeholder participation
in Community Reach. The four outcome measures were commitment to Community Reach,
common values with the network, trust in the network, and satisfaction with Community Reach.
Overall, stakeholders were generally positive about their experience with Community Reach.
Using a Likert scale in which 1 = “Strongly Disagree” and 5 = “Strongly Agree,” stakeholders
noted that they were committed to Community Reach (M = 4.13, SD =.74), that they shared
common values with Community Reach (M = 4.29, SD =.49), that they trusted Community
Reach (M = 3.87, SD =.67), and that they were satisfied with Community Reach (M = 3.84, SD
=.77).
Of the various forms of participation, attending meetings, participating in decision-
making by providing feedback to Community Reach, and encouraging others to learn about
Community Reach were more likely to result in stakeholder outcomes. Regression equations for
each of the four outcome measures are reported below.
Regression analysis indicated that the model (seen in Table 18) significantly predicted
stakeholder commitment, F (9, 93) = 16.384, p < .001. R for the model = .788, while R2 = .621,
and the adjusted R2 = .583. Table 18 indicates the unstandardized regression coefficients (B),
intercept, and standardized regression coefficients (Beta) for the variables. In particular,
participating in the forms of decision making (t = 2.412, p < .05), attending meetings (t = 2.940,
p < .01), and encouraging others to learn about Community Reach (t = 2.208, p < .05) prompted
stakeholders to report they were more committed to the network, with meeting attendance having
the biggest impact. Indicating that they did not participate in Community Reach, unsurprisingly,
81
predicted whether stakeholders were less likely to indicate their commitment to the network (t =
-2.973, p < .01).
Regression analysis indicated that the model significantly predicted stakeholder common
values, F (9, 94) = 5.158, p < .001. However, the effect was less substantial than the model
reported for commitment. In terms of common values, R for the model = .575, while R2
= .331,
and the adjusted R2
= .267. Attending meetings (t = 2.355, p < .05), and encouraging others to
learn about Community Reach (t = 2.119, p <.05) prompted stakeholders to report they felt more
common values with the network. Table 19 displays the unstandardized regression coefficients
(B), intercept, and standardized regression coefficients (Beta) for the variables.
As was the case with common values, the F-value for stakeholder trust in Community
Reach is not very large, though it is significant F (9, 93) = 7.523, p < .001. R for the model =
.649, R2 = .421, and the adjusted R2 = .365. The regression equation indicated that the only forms
of participation is significant in impacting trust; Table 20 indicates that those who encourage
others to learn about Community Reach are significantly more likely to trust the network (t =
2.539, p < .05), and that those who provide financial support were also more likely to trust
Community Reach (t = 2.088, p < .05) (see Table 20).
The final outcome is satisfaction with Community Reach (see Table 21). A regression
model predicted stakeholder satisfaction, F (9, 95) =7.729, p < .001. R for the model = .650, R2
= .423, and the adjusted R2 = .368. Averages for the outcomes indicate that stakeholders
experience slightly less satisfaction than they do other outcomes, and as is the case in reporting
common values, stakeholders who attend meetings (t = 2.169, p < .05) and encourage others to
learn about Community Reach (t = 3.509, p = .001) report more satisfaction with the network. In
particular, the latter is a significant impact, with a more substantial B-value than seen in the other
82
equations and highly significant at p = .001. However, another form of participation surfaces in
this equation: providing financial support. Stakeholders providing financial support are
significantly more likely to report improved satisfaction scores (t = 2.689, p < .01), suggesting
that stakeholders at least feel as though they are getting their money’s worth out of the network.
These results suggest a link between various forms of participation and specific
outcomes. In addition, these outcomes appear to be linked to stake. Of the 10 stakes represented
(Network membership, Economic Development, Civic, Nonprofit, Early Childhood Education,
School Systems, University Educators, Funders, Volunteers, and Parents), only those
representing Network membership or Volunteers (which, as previously mentioned, is heavily
comprised of network members) reported higher levels of commitment, common values, trust,
and satisfaction with Community Reach. Independent t-tests indicated that those with a regional
network stake felt more committed to Community Reach (M = 4.44, SD = .63) than those who
were not network members (M = 3.98, SD = .75), t (98) = -3.050, p < .01. Additionally, network
members were more likely to share common values with Community Reach (M = 4.44, SD =
.42) than non-network members (M = 4.22, SD = .51), t (102) = -2.192, p < .05. More network
members reported that they trusted Community Reach (M = 4.08, SD = .60), compared to non-
network members (M = 3.76, SD = .67), t (101) = -2.337, p < .05, and network members also
reported higher levels of satisfaction (M = 4.12, SD = .68), than non-network members (M =
3.71, SD = .77), t (103) = -2.615, p < .01.
Volunteers also reported greater commitment, common values, trust, and satisfaction than
those who did not identify as volunteers, and these differences were more pronounced than those
between network and non-network membership. Volunteers felt more committed (M = 4.66, SD
= .45), than non-volunteers (M = 3.93, SD = .73), t (98) = -4.970, p < .001, shared common

83
values (M = 4.48, SD = .43), than non-volunteers (M = 4.21, SD = .50), t (102) = -2.571, p < .05,
more trust (M = 4.17, SD = .68) compared to non-volunteers (M = 3.75, SD = .63), t (101) = -
3.024, p < .01, and volunteers indicated greater satisfaction (M = 4.24, SD = .68) than those who
did not identify themselves as volunteers (M = 3.66, SD = .74), t (103) = -3.618, p < .001.
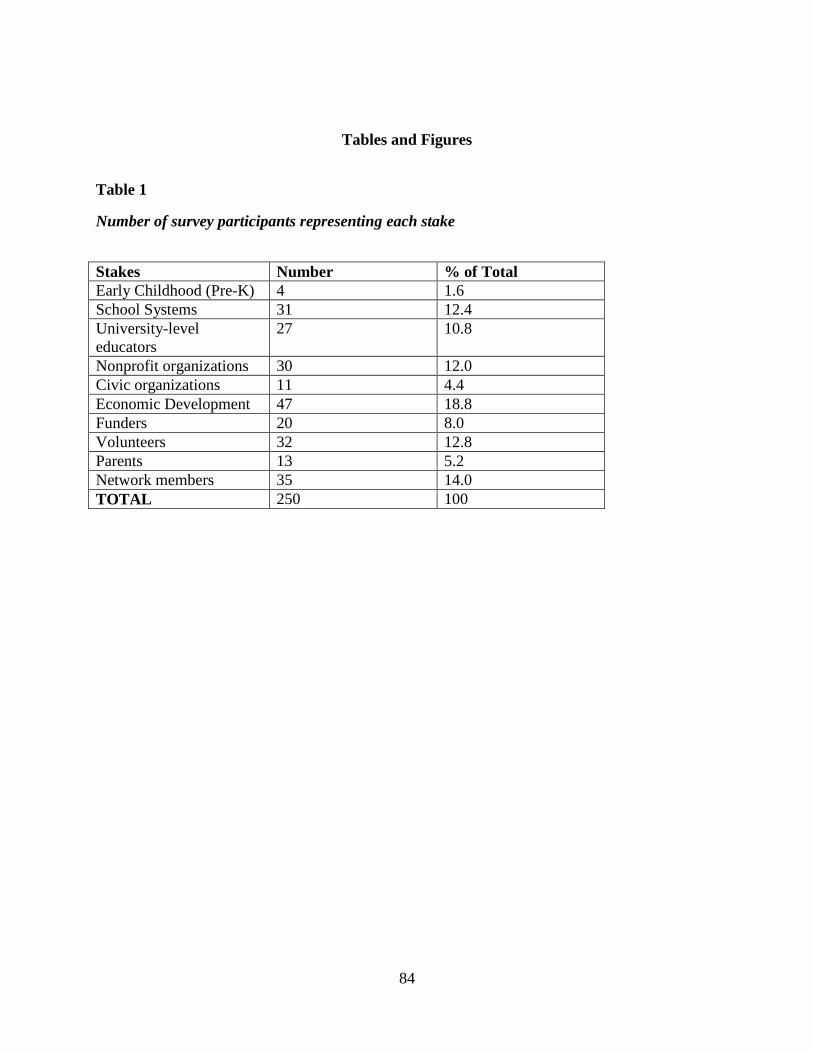
84
Tables and Figures
Table 1
Number of survey participants representing each stake
Stakes Number % of Total
Early Childhood (Pre-K) 4 1.6
School Systems 31 12.4
University-level
educators
27 10.8
Nonprofit organizations 30 12.0
Civic organizations 11 4.4
Economic Development 47 18.8
Funders 20 8.0
Volunteers 32 12.8
Parents 13 5.2
Network members 35 14.0
TOTAL 250 100
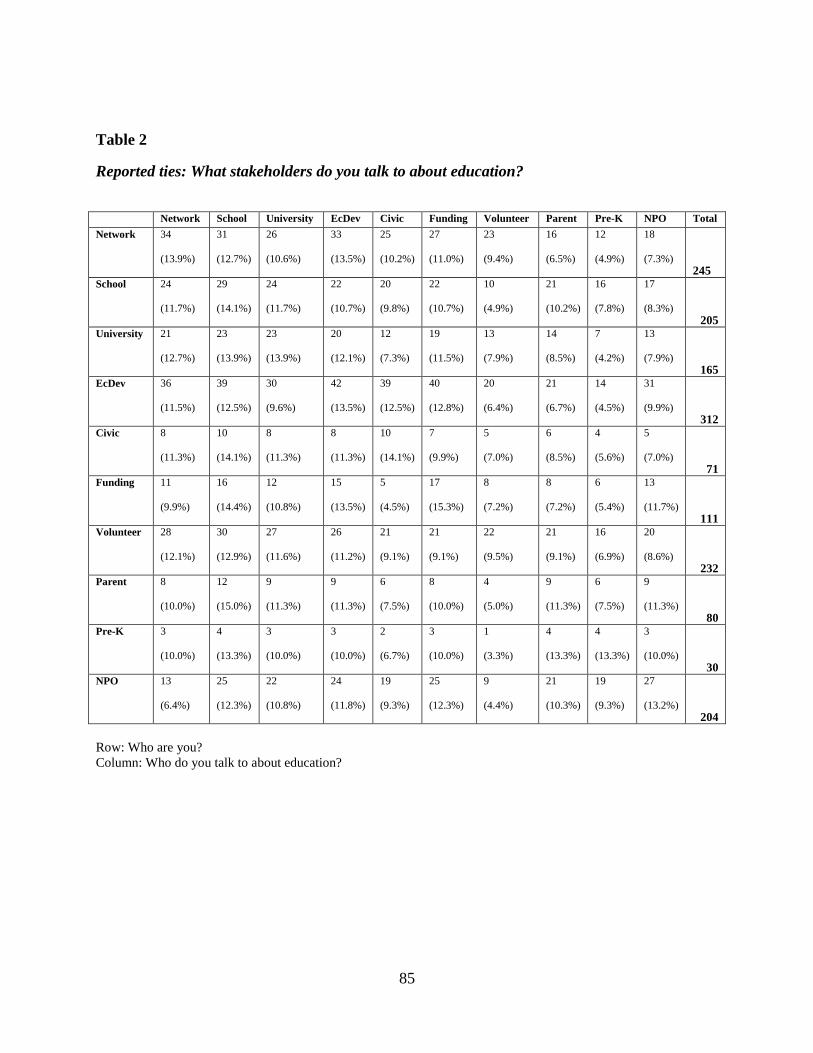
85
Table 2
Reported ties: What stakeholders do you talk to about education?
Network School University EcDev Civic Funding Volunteer Parent Pre-K NPO Total
Network 34
(13.9%)
31
(12.7%)
26
(10.6%)
33
(13.5%)
25
(10.2%)
27
(11.0%)
23
(9.4%)
16
(6.5%)
12
(4.9%)
18
(7.3%)
245 School 24
(11.7%)
29
(14.1%)
24
(11.7%)
22
(10.7%)
20
(9.8%)
22
(10.7%)
10
(4.9%)
21
(10.2%)
16
(7.8%)
17
(8.3%)
205 University 21
(12.7%)
23
(13.9%)
23
(13.9%)
20
(12.1%)
12
(7.3%)
19
(11.5%)
13
(7.9%)
14
(8.5%)
7
(4.2%)
13
(7.9%)
165 EcDev 36
(11.5%)
39
(12.5%)
30
(9.6%)
42
(13.5%)
39
(12.5%)
40
(12.8%)
20
(6.4%)
21
(6.7%)
14
(4.5%)
31
(9.9%)
312 Civic 8
(11.3%)
10
(14.1%)
8
(11.3%)
8
(11.3%)
10
(14.1%)
7
(9.9%)
5
(7.0%)
6
(8.5%)
4
(5.6%)
5
(7.0%)
71 Funding 11
(9.9%)
16
(14.4%)
12
(10.8%)
15
(13.5%)
5
(4.5%)
17
(15.3%)
8
(7.2%)
8
(7.2%)
6
(5.4%)
13
(11.7%)
111 Volunteer 28
(12.1%)
30
(12.9%)
27
(11.6%)
26
(11.2%)
21
(9.1%)
21
(9.1%)
22
(9.5%)
21
(9.1%)
16
(6.9%)
20
(8.6%)
232 Parent 8
(10.0%)
12
(15.0%)
9
(11.3%)
9
(11.3%)
6
(7.5%)
8
(10.0%)
4
(5.0%)
9
(11.3%)
6
(7.5%)
9
(11.3%)
80 Pre-K 3
(10.0%)
4
(13.3%)
3
(10.0%)
3
(10.0%)
2
(6.7%)
3
(10.0%)
1
(3.3%)
4
(13.3%)
4
(13.3%)
3
(10.0%)
30 NPO 13
(6.4%)
25
(12.3%)
22
(10.8%)
24
(11.8%)
19
(9.3%)
25
(12.3%)
9
(4.4%)
21
(10.3%)
19
(9.3%)
27
(13.2%)
204
Row: Who are you?
Column: Who do you talk to about education?
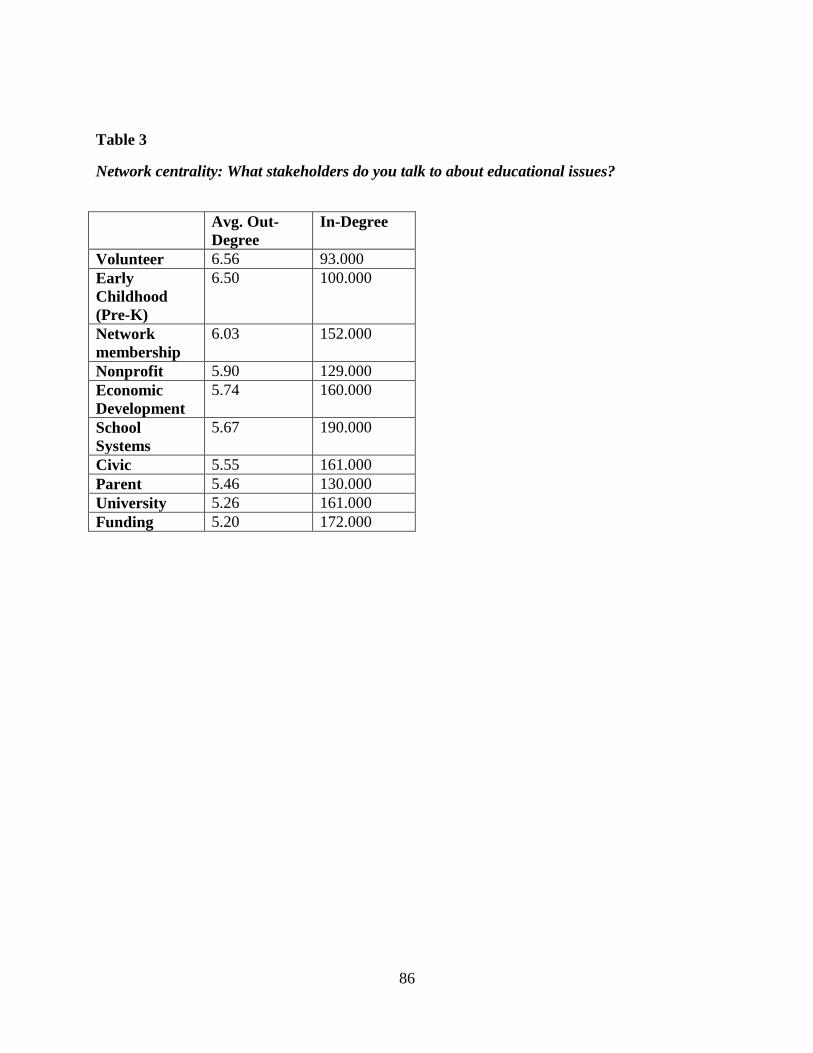
86
Table 3
Network centrality: What stakeholders do you talk to about educational issues?
Avg. Out-
Degree
In-Degree
Volunteer 6.56 93.000
Early
Childhood
(Pre-K)
6.50 100.000
Network
membership
6.03 152.000
Nonprofit 5.90 129.000
Economic
Development
5.74 160.000
School
Systems
5.67 190.000
Civic 5.55 161.000
Parent 5.46 130.000
University 5.26 161.000
Funding 5.20 172.000
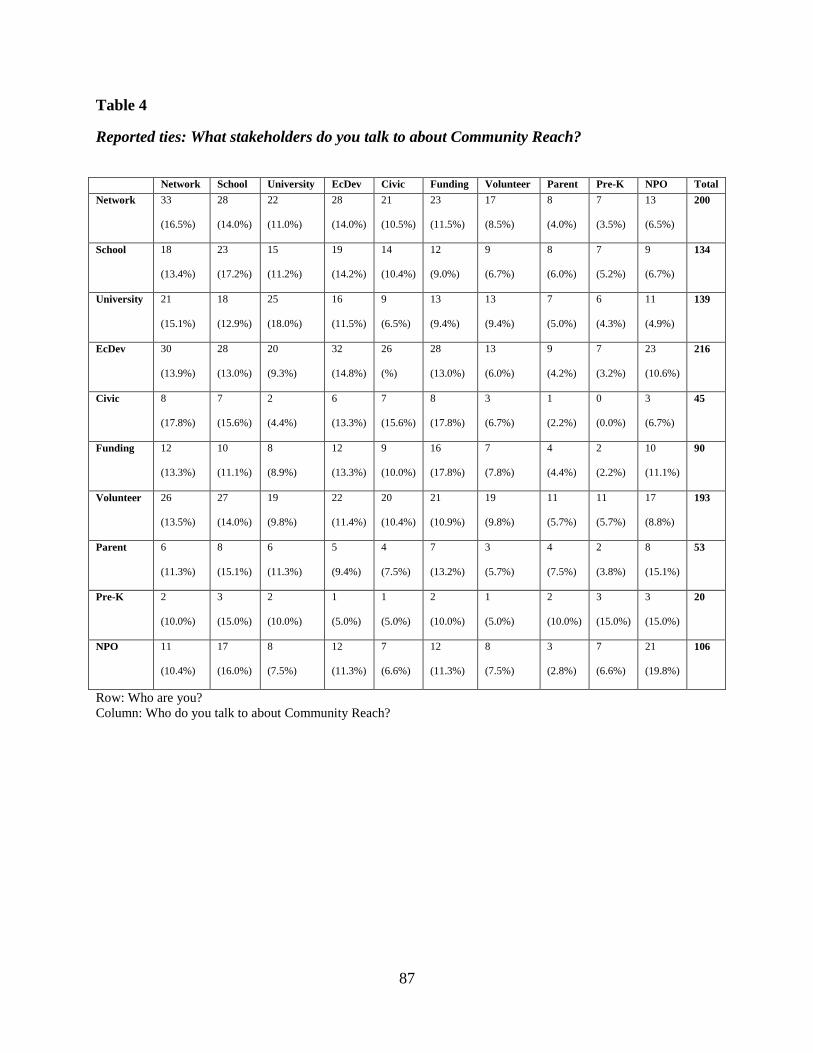
87
Table 4
Reported ties: What stakeholders do you talk to about Community Reach?
Network School University EcDev Civic Funding Volunteer Parent Pre-K NPO Total
Network 33
(16.5%)
28
(14.0%)
22
(11.0%)
28
(14.0%)
21
(10.5%)
23
(11.5%)
17
(8.5%)
8
(4.0%)
7
(3.5%)
13
(6.5%)
200
School 18
(13.4%)
23
(17.2%)
15
(11.2%)
19
(14.2%)
14
(10.4%)
12
(9.0%)
9
(6.7%)
8
(6.0%)
7
(5.2%)
9
(6.7%)
134
University 21
(15.1%)
18
(12.9%)
25
(18.0%)
16
(11.5%)
9
(6.5%)
13
(9.4%)
13
(9.4%)
7
(5.0%)
6
(4.3%)
11
(4.9%)
139
EcDev 30
(13.9%)
28
(13.0%)
20
(9.3%)
32
(14.8%)
26
(%)
28
(13.0%)
13
(6.0%)
9
(4.2%)
7
(3.2%)
23
(10.6%)
216
Civic 8
(17.8%)
7
(15.6%)
2
(4.4%)
6
(13.3%)
7
(15.6%)
8
(17.8%)
3
(6.7%)
1
(2.2%)
0
(0.0%)
3
(6.7%)
45
Funding 12
(13.3%)
10
(11.1%)
8
(8.9%)
12
(13.3%)
9
(10.0%)
16
(17.8%)
7
(7.8%)
4
(4.4%)
2
(2.2%)
10
(11.1%)
90
Volunteer 26
(13.5%)
27
(14.0%)
19
(9.8%)
22
(11.4%)
20
(10.4%)
21
(10.9%)
19
(9.8%)
11
(5.7%)
11
(5.7%)
17
(8.8%)
193
Parent 6
(11.3%)
8
(15.1%)
6
(11.3%)
5
(9.4%)
4
(7.5%)
7
(13.2%)
3
(5.7%)
4
(7.5%)
2
(3.8%)
8
(15.1%)
53
Pre-K 2
(10.0%)
3
(15.0%)
2
(10.0%)
1
(5.0%)
1
(5.0%)
2
(10.0%)
1
(5.0%)
2
(10.0%)
3
(15.0%)
3
(15.0%)
20
NPO 11
(10.4%)
17
(16.0%)
8
(7.5%)
12
(11.3%)
7
(6.6%)
12
(11.3%)
8
(7.5%)
3
(2.8%)
7
(6.6%)
21
(19.8%)
106
Row: Who are you?
Column: Who do you talk to about Community Reach?
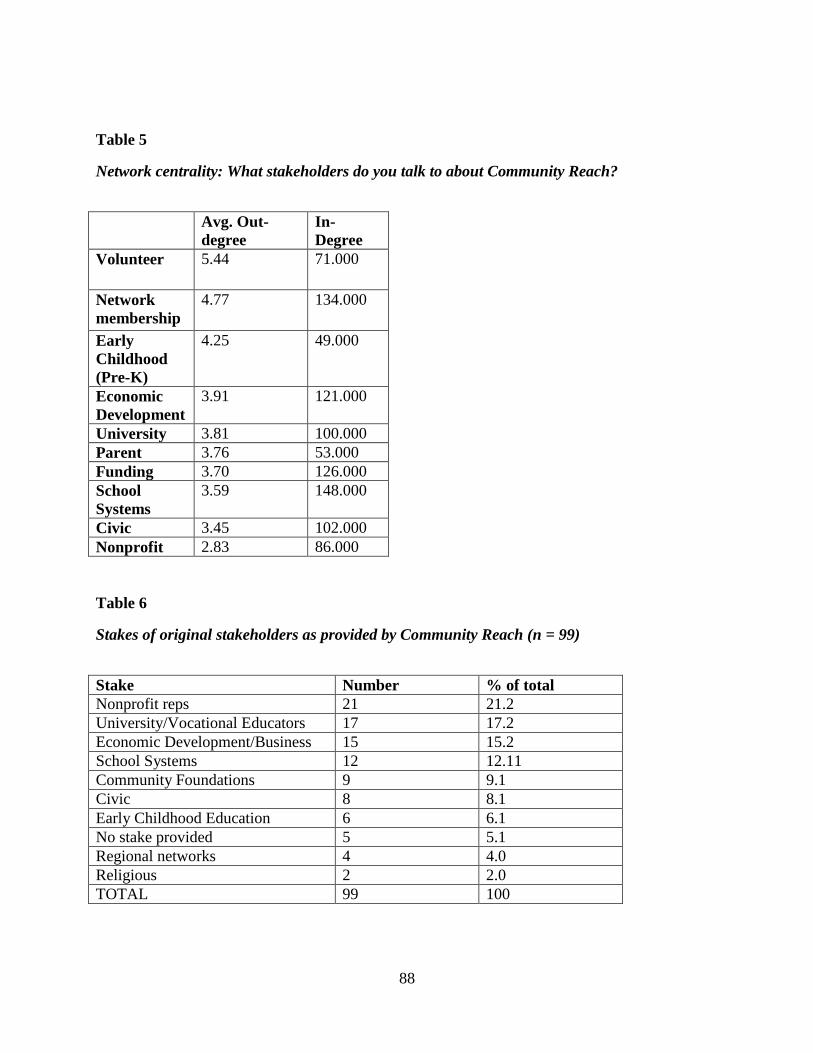
88
Table 5
Network centrality: What stakeholders do you talk to about Community Reach?
Avg. Out-
degree
In-
Degree
Volunteer 5.44 71.000
Network
membership
4.77 134.000
Early
Childhood
(Pre-K)
4.25 49.000
Economic
Development
3.91 121.000
University 3.81 100.000
Parent 3.76 53.000
Funding 3.70 126.000
School
Systems
3.59 148.000
Civic 3.45 102.000
Nonprofit 2.83 86.000
Table 6
Stakes of original stakeholders as provided by Community Reach (n = 99)
Stake Number % of total
Nonprofit reps 21 21.2
University/Vocational Educators 17 17.2
Economic Development/Business 15 15.2
School Systems 12 12.11
Community Foundations 9 9.1
Civic 8 8.1
Early Childhood Education 6 6.1
No stake provided 5 5.1
Regional networks 4 4.0
Religious 2 2.0
TOTAL 99 100
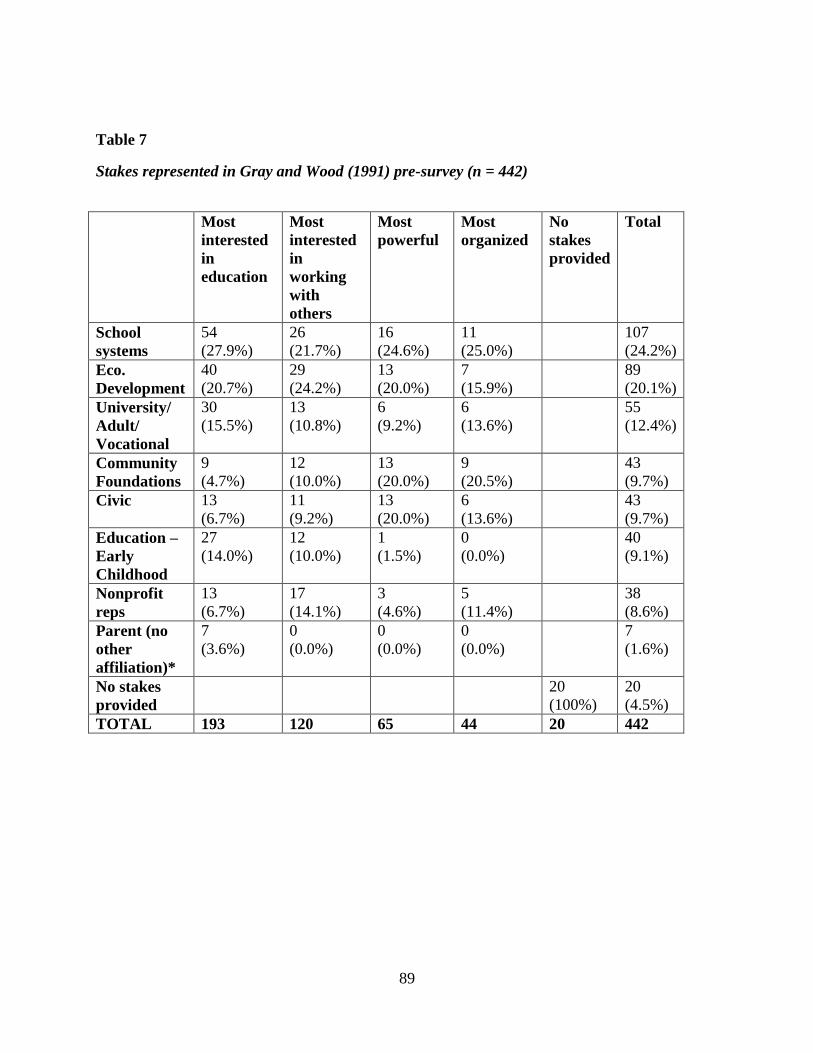
89
Table 7
Stakes represented in Gray and Wood (1991) pre-survey (n = 442)
Most
interested
in
education
Most
interested
in
working
with
others
Most
powerful
Most
organized
No
stakes
provided
Total
School
systems
54
(27.9%)
26
(21.7%)
16
(24.6%)
11
(25.0%)
107
(24.2%)
Eco.
Development
40
(20.7%)
29
(24.2%)
13
(20.0%)
7
(15.9%)
89
(20.1%)
University/
Adult/
Vocational
30
(15.5%)
13
(10.8%)
6
(9.2%)
6
(13.6%)
55
(12.4%)
Community
Foundations
9
(4.7%)
12
(10.0%)
13
(20.0%)
9
(20.5%)
43
(9.7%)
Civic 13
(6.7%)
11
(9.2%)
13
(20.0%)
6
(13.6%)
43
(9.7%)
Education –
Early
Childhood
27
(14.0%)
12
(10.0%)
1
(1.5%)
0
(0.0%)
40
(9.1%)
Nonprofit
reps
13
(6.7%)
17
(14.1%)
3
(4.6%)
5
(11.4%)
38
(8.6%)
Parent (no
other
affiliation)*
7
(3.6%)
0
(0.0%)
0
(0.0%)
0
(0.0%)
7
(1.6%)
No stakes
provided
20
(100%)
20
(4.5%)
TOTAL 193 120 65 44 20 442
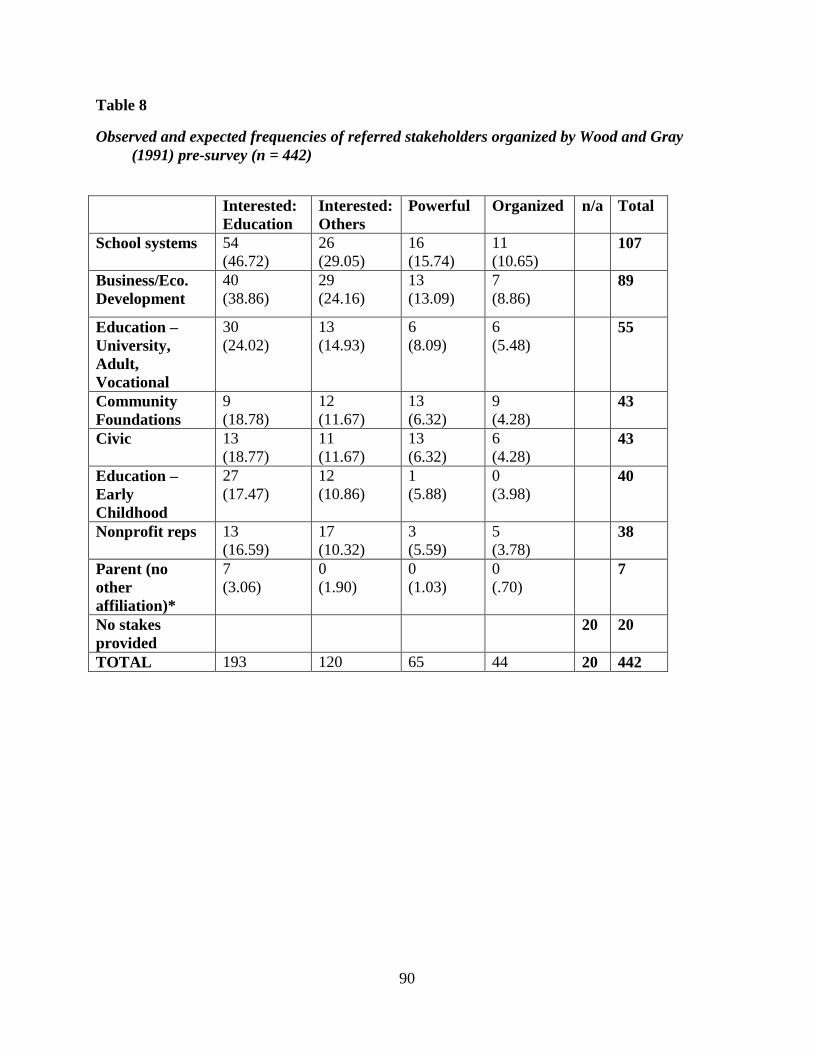
90
Table 8
Observed and expected frequencies of referred stakeholders organized by Wood and Gray
(1991) pre-survey (n = 442)
Interested:
Education
Interested:
Others
Powerful Organized n/a Total
School systems 54
(46.72)
26
(29.05)
16
(15.74)
11
(10.65) 107
Business/Eco.
Development
40
(38.86)
29
(24.16)
13
(13.09)
7
(8.86) 89
Education –
University,
Adult,
Vocational
30
(24.02)
13
(14.93)
6
(8.09)
6
(5.48) 55
Community
Foundations
9
(18.78)
12
(11.67)
13
(6.32)
9
(4.28) 43
Civic 13
(18.77)
11
(11.67)
13
(6.32)
6
(4.28) 43
Education –
Early
Childhood
27
(17.47)
12
(10.86)
1
(5.88)
0
(3.98) 40
Nonprofit reps 13
(16.59)
17
(10.32)
3
(5.59)
5
(3.78) 38
Parent (no
other
affiliation)*
7
(3.06)
0
(1.90)
0
(1.03)
0
(.70) 7
No stakes
provided
20 20
TOTAL 193 120 65 44 20 442
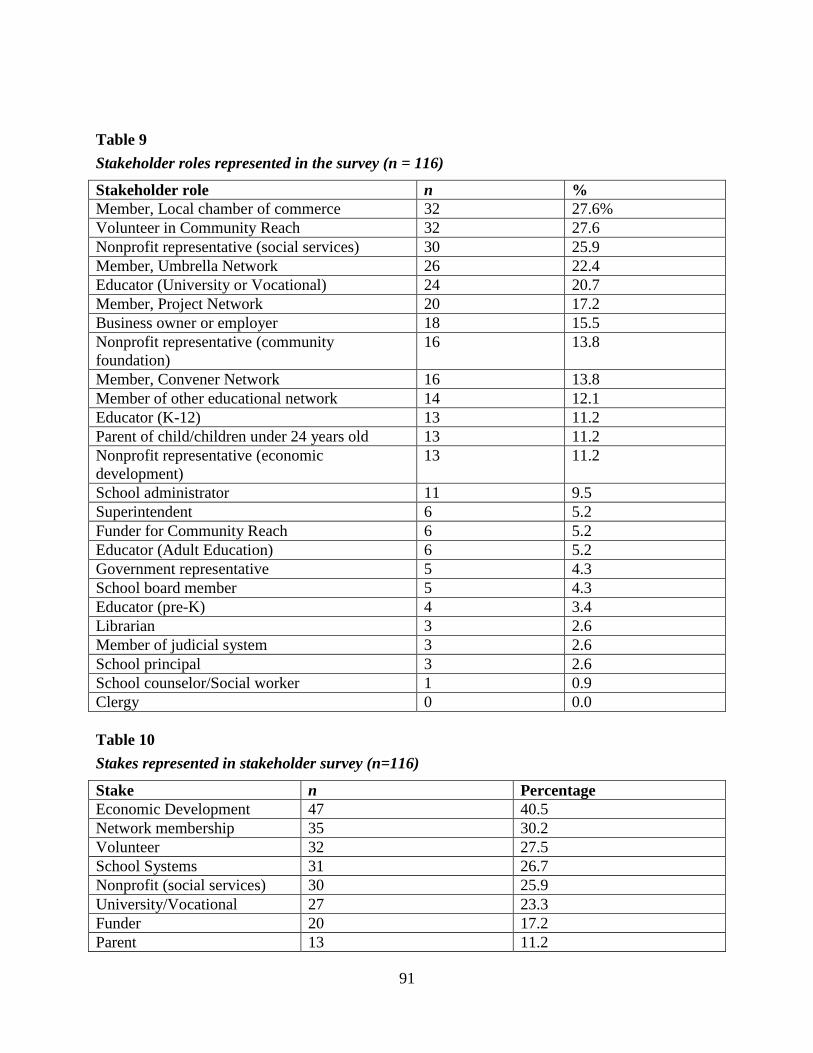
91
Table 9
Stakeholder roles represented in the survey (n = 116)
Stakeholder role n %
Member, Local chamber of commerce 32 27.6%
Volunteer in Community Reach 32 27.6
Nonprofit representative (social services) 30 25.9
Member, Umbrella Network 26 22.4
Educator (University or Vocational) 24 20.7
Member, Project Network 20 17.2
Business owner or employer 18 15.5
Nonprofit representative (community
foundation)
16 13.8
Member, Convener Network 16 13.8
Member of other educational network 14 12.1
Educator (K-12) 13 11.2
Parent of child/children under 24 years old 13 11.2
Nonprofit representative (economic
development)
13 11.2
School administrator 11 9.5
Superintendent 6 5.2
Funder for Community Reach 6 5.2
Educator (Adult Education) 6 5.2
Government representative 5 4.3
School board member 5 4.3
Educator (pre-K) 4 3.4
Librarian 3 2.6
Member of judicial system 3 2.6
School principal 3 2.6
School counselor/Social worker 1 0.9
Clergy 0 0.0
Table 10
Stakes represented in stakeholder survey (n=116)
Stake n Percentage
Economic Development 47 40.5
Network membership 35 30.2
Volunteer 32 27.5
School Systems 31 26.7
Nonprofit (social services) 30 25.9
University/Vocational 27 23.3
Funder 20 17.2
Parent 13 11.2
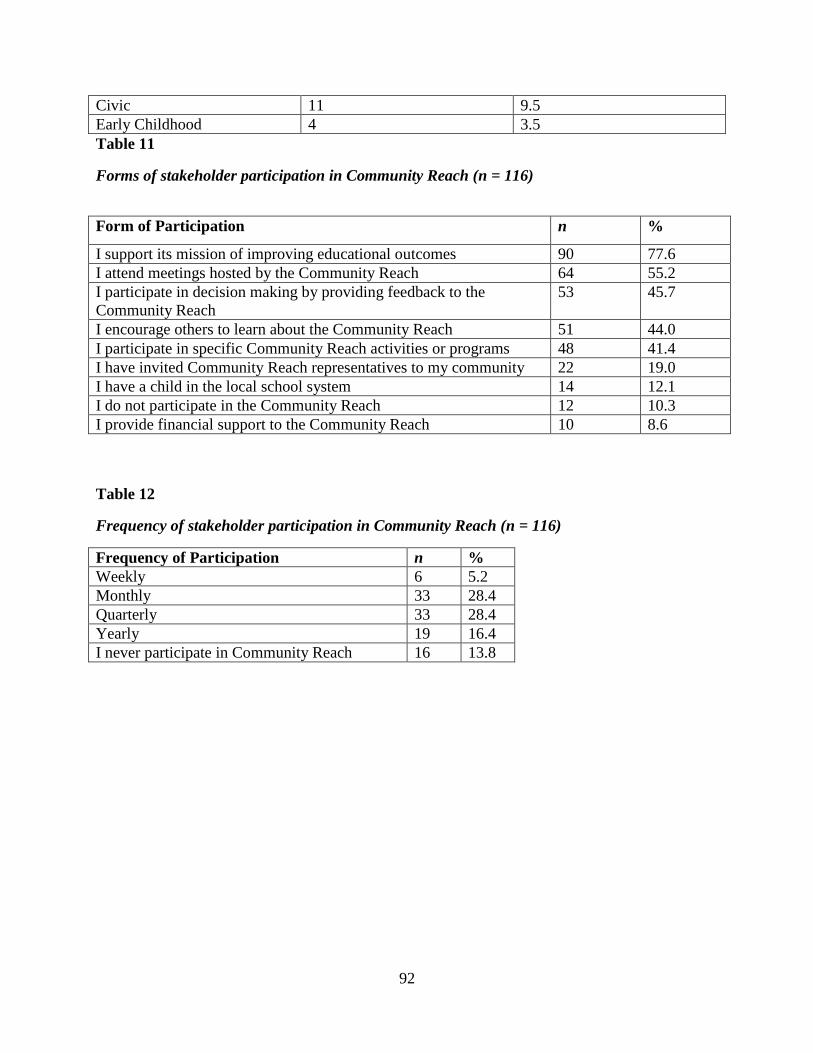
92
Civic 11 9.5
Early Childhood 4 3.5
Table 11
Forms of stakeholder participation in Community Reach (n = 116)
Form of Participation n %
I support its mission of improving educational outcomes 90 77.6
I attend meetings hosted by the Community Reach 64 55.2
I participate in decision making by providing feedback to the
Community Reach
53 45.7
I encourage others to learn about the Community Reach 51 44.0
I participate in specific Community Reach activities or programs 48 41.4
I have invited Community Reach representatives to my community 22 19.0
I have a child in the local school system 14 12.1
I do not participate in the Community Reach 12 10.3
I provide financial support to the Community Reach 10 8.6
Table 12
Frequency of stakeholder participation in Community Reach (n = 116)
Frequency of Participation n %
Weekly 6 5.2
Monthly 33 28.4
Quarterly 33 28.4
Yearly 19 16.4
I never participate in Community Reach 16 13.8
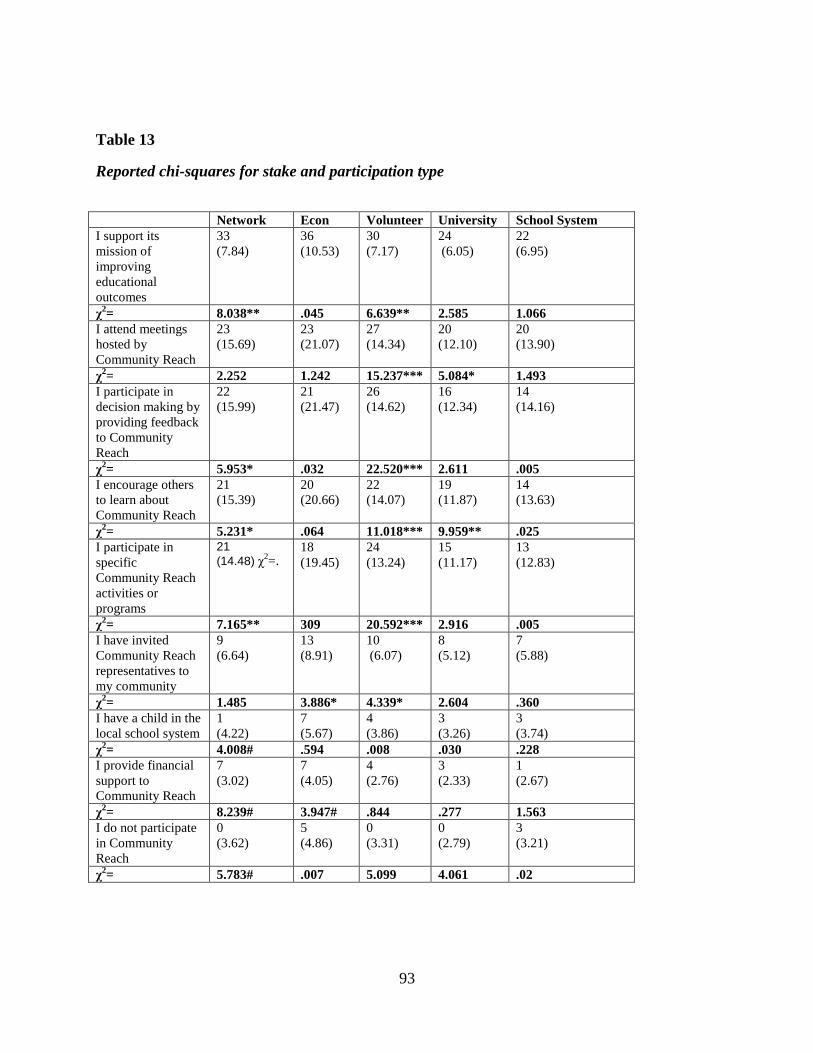
93
Table 13
Reported chi-squares for stake and participation type
Network Econ Volunteer University School System
I support its
mission of
improving
educational
outcomes
33
(7.84)
36
(10.53)
30
(7.17)
24
(6.05)
22
(6.95)
χ2= 8.038** .045 6.639** 2.585 1.066
I attend meetings
hosted by
Community Reach
23
(15.69)
23
(21.07)
27
(14.34)
20
(12.10)
20
(13.90)
χ2= 2.252 1.242 15.237*** 5.084* 1.493
I participate in
decision making by
providing feedback
to Community
Reach
22
(15.99)
21
(21.47)
26
(14.62)
16
(12.34)
14
(14.16)
χ2= 5.953* .032 22.520*** 2.611 .005
I encourage others
to learn about
Community Reach
21
(15.39)
20
(20.66)
22
(14.07)
19
(11.87)
14
(13.63)
χ2= 5.231* .064 11.018*** 9.959** .025
I participate in
specific
Community Reach
activities or
programs
21
(14.48) χ2=.
18
(19.45)
24
(13.24)
15
(11.17)
13
(12.83)
χ2= 7.165** 309 20.592*** 2.916 .005
I have invited
Community Reach
representatives to
my community
9
(6.64)
13
(8.91)
10
(6.07)
8
(5.12)
7
(5.88)
χ2= 1.485 3.886* 4.339* 2.604 .360
I have a child in the
local school system
1
(4.22)
7
(5.67)
4
(3.86)
3
(3.26)
3
(3.74)
χ2= 4.008# .594 .008 .030 .228
I provide financial
support to
Community Reach
7
(3.02)
7
(4.05)
4
(2.76)
3
(2.33)
1
(2.67)
χ2= 8.239# 3.947# .844 .277 1.563
I do not participate
in Community
Reach
0
(3.62)
5
(4.86)
0
(3.31)
0
(2.79)
3
(3.21)
χ2= 5.783# .007 5.099 4.061 .02
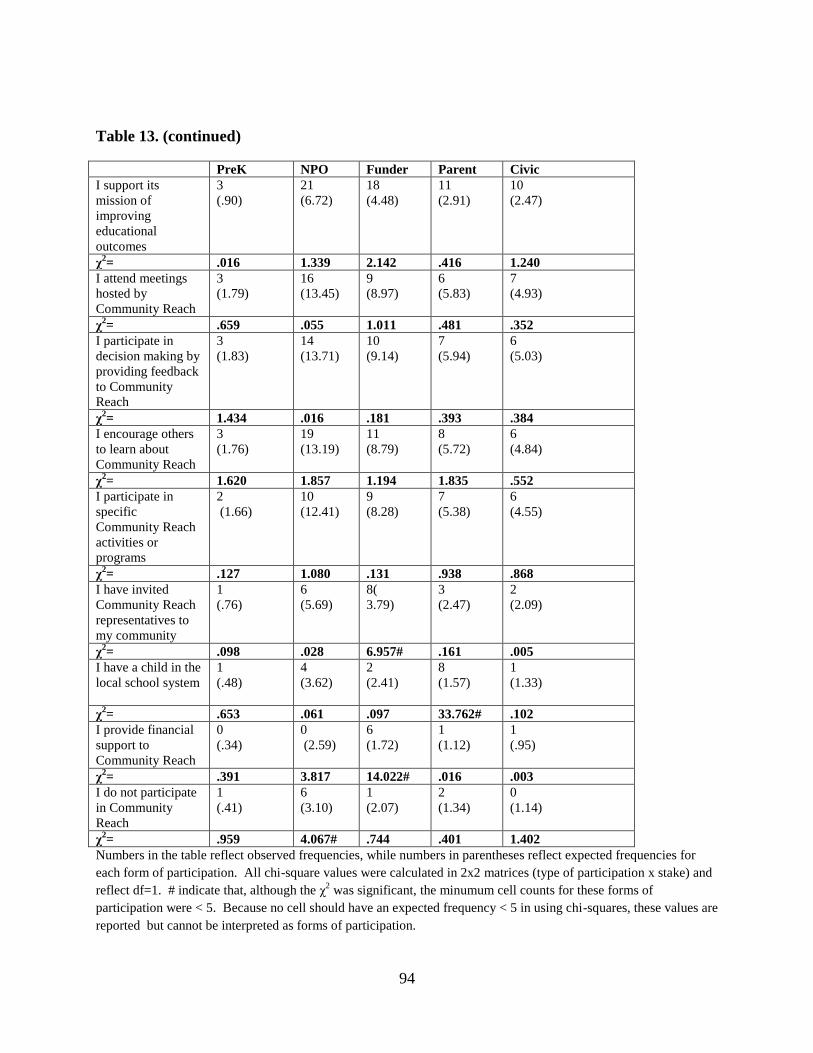
94
Table 13. (continued)
PreK NPO Funder Parent Civic
I support its
mission of
improving
educational
outcomes
3
(.90)
21
(6.72)
18
(4.48)
11
(2.91)
10
(2.47)
χ2= .016 1.339 2.142 .416 1.240
I attend meetings
hosted by
Community Reach
3
(1.79)
16
(13.45)
9
(8.97)
6
(5.83)
7
(4.93)
χ2= .659 .055 1.011 .481 .352
I participate in
decision making by
providing feedback
to Community
Reach
3
(1.83)
14
(13.71)
10
(9.14)
7
(5.94)
6
(5.03)
χ2= 1.434 .016 .181 .393 .384
I encourage others
to learn about
Community Reach
3
(1.76)
19
(13.19)
11
(8.79)
8
(5.72)
6
(4.84)
χ2= 1.620 1.857 1.194 1.835 .552
I participate in
specific
Community Reach
activities or
programs
2
(1.66)
10
(12.41)
9
(8.28)
7
(5.38)
6
(4.55)
χ2= .127 1.080 .131 .938 .868
I have invited
Community Reach
representatives to
my community
1
(.76)
6
(5.69)
8(
3.79)
3
(2.47)
2
(2.09)
χ2= .098 .028 6.957# .161 .005
I have a child in the
local school system
1
(.48)
4
(3.62)
2
(2.41)
8
(1.57)
1
(1.33)
χ2= .653 .061 .097 33.762# .102
I provide financial
support to
Community Reach
0
(.34)
0
(2.59)
6
(1.72)
1
(1.12)
1
(.95)
χ2= .391 3.817 14.022# .016 .003
I do not participate
in Community
Reach
1
(.41)
6
(3.10)
1
(2.07)
2
(1.34)
0
(1.14)
χ2= .959 4.067# .744 .401 1.402
Numbers in the table reflect observed frequencies, while numbers in parentheses reflect expected frequencies for
each form of participation. All chi-square values were calculated in 2x2 matrices (type of participation x stake) and
reflect df=1. # indicate that, although the χ2 was significant, the minumum cell counts for these forms of
participation were < 5. Because no cell should have an expected frequency < 5 in using chi-squares, these values are
reported but cannot be interpreted as forms of participation.
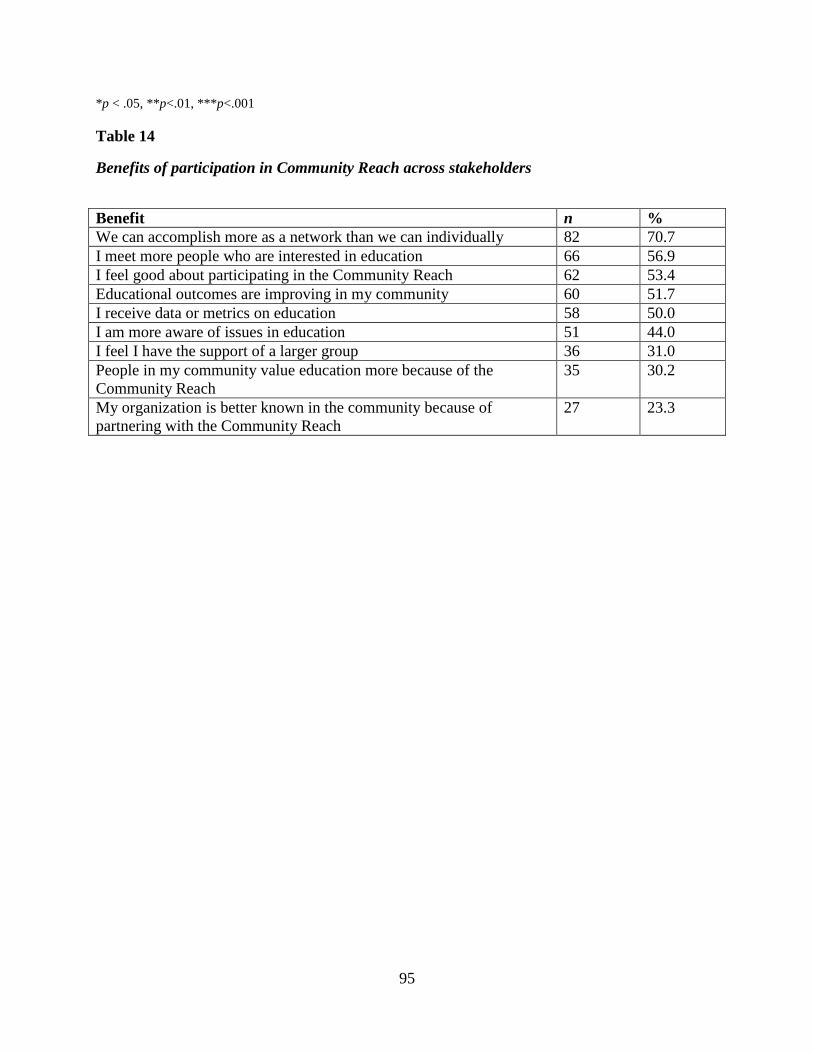
95
*p < .05, **p<.01, ***p<.001
Table 14
Benefits of participation in Community Reach across stakeholders
Benefit n %
We can accomplish more as a network than we can individually 82 70.7
I meet more people who are interested in education 66 56.9
I feel good about participating in the Community Reach 62 53.4
Educational outcomes are improving in my community 60 51.7
I receive data or metrics on education 58 50.0
I am more aware of issues in education 51 44.0
I feel I have the support of a larger group 36 31.0
People in my community value education more because of the
Community Reach
35 30.2
My organization is better known in the community because of
partnering with the Community Reach
27 23.3
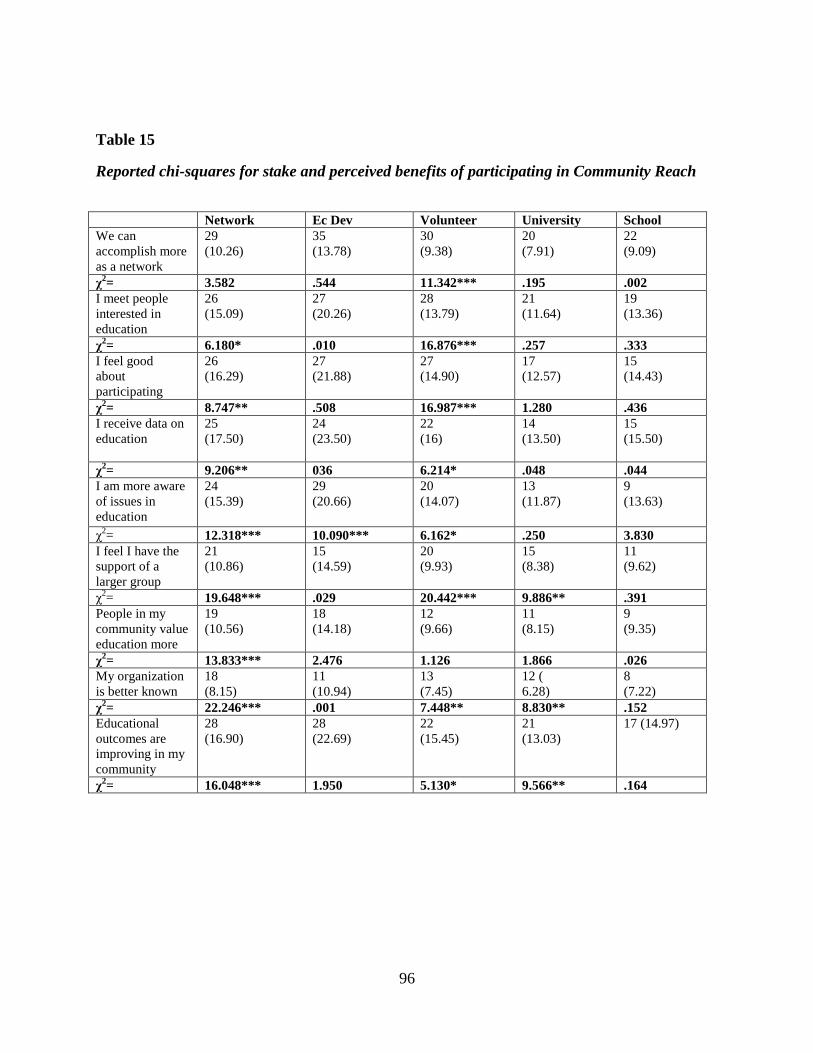
96
Table 15
Reported chi-squares for stake and perceived benefits of participating in Community Reach
Network Ec Dev Volunteer University School
We can
accomplish more
as a network
29
(10.26)
35
(13.78) 30
(9.38) 20
(7.91) 22
(9.09)
χ2= 3.582 .544 11.342*** .195 .002
I meet people
interested in
education
26
(15.09)
27
(20.26) 28
(13.79)
21
(11.64)
19
(13.36)
χ2= 6.180* .010 16.876*** .257 .333
I feel good
about
participating
26
(16.29) 27
(21.88) 27
(14.90) 17
(12.57) 15
(14.43)
χ2= 8.747** .508 16.987*** 1.280 .436
I receive data on
education
25
(17.50)
24
(23.50) 22
(16) 14
(13.50) 15
(15.50)
χ2= 9.206** 036 6.214* .048 .044
I am more aware of issues in
education
24
(15.39) 29
(20.66) 20
(14.07)
13
(11.87) 9
(13.63)
χ
2= 12.318*** 10.090*** 6.162* .250 3.830
I feel I have the
support of a
larger group
21
(10.86) 15
(14.59) 20
(9.93) 15
(8.38) 11
(9.62)
χ2= 19.648*** .029 20.442*** 9.886** .391
People in my
community value
education more
19
(10.56) 18
(14.18) 12
(9.66) 11
(8.15)
9
(9.35)
χ2= 13.833*** 2.476 1.126 1.866 .026
My organization
is better known
18
(8.15) 11
(10.94) 13
(7.45) 12 (
6.28) 8
(7.22) χ
2= 22.246*** .001 7.448** 8.830** .152
Educational
outcomes are
improving in my
community
28
(16.90)
28
(22.69)
22
(15.45)
21
(13.03)
17 (14.97)
χ2= 16.048*** 1.950 5.130* 9.566** .164
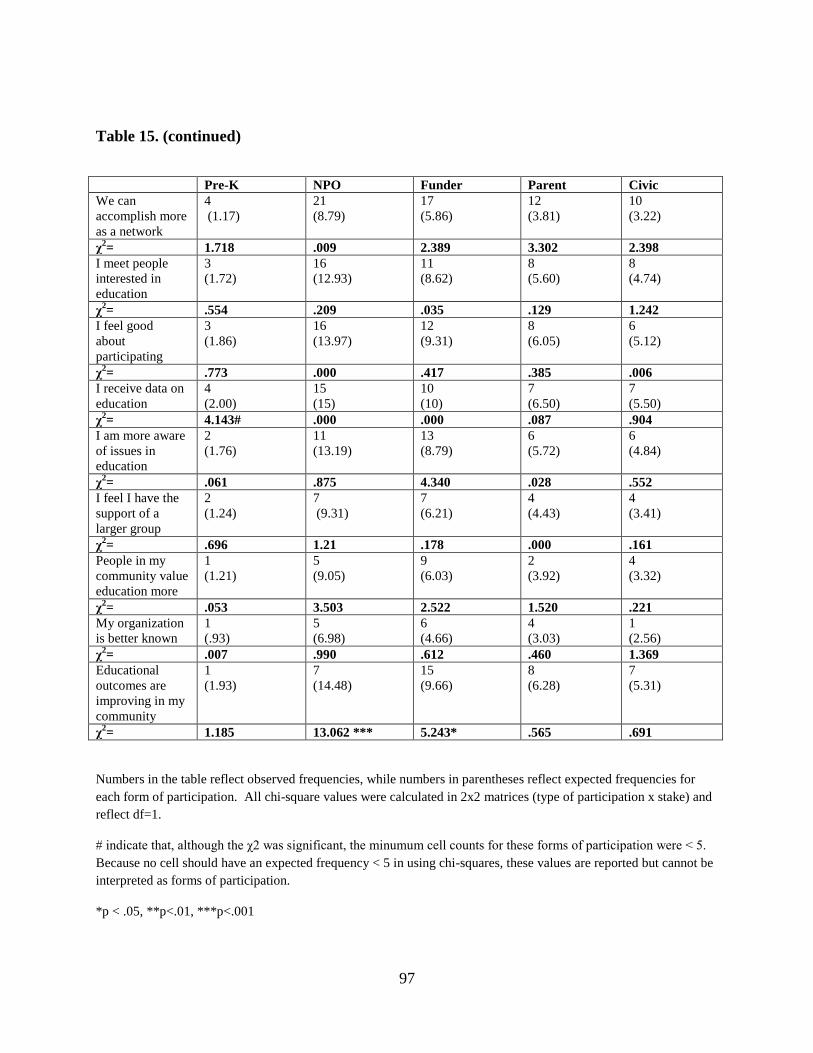
97
Table 15. (continued)
Pre-K NPO Funder Parent Civic
We can
accomplish more
as a network
4
(1.17)
21
(8.79)
17
(5.86)
12
(3.81)
10
(3.22)
χ2= 1.718 .009 2.389 3.302 2.398
I meet people
interested in
education
3
(1.72)
16
(12.93)
11
(8.62)
8
(5.60)
8
(4.74)
χ2= .554 .209 .035 .129 1.242
I feel good
about
participating
3
(1.86)
16
(13.97)
12
(9.31)
8
(6.05)
6
(5.12)
χ2= .773 .000 .417 .385 .006
I receive data on
education
4
(2.00)
15
(15)
10
(10)
7
(6.50)
7
(5.50)
χ2= 4.143# .000 .000 .087 .904
I am more aware
of issues in
education
2
(1.76)
11
(13.19)
13
(8.79)
6
(5.72)
6
(4.84)
χ2= .061 .875 4.340 .028 .552
I feel I have the
support of a
larger group
2
(1.24)
7
(9.31)
7
(6.21)
4
(4.43)
4
(3.41)
χ2= .696 1.21 .178 .000 .161
People in my
community value
education more
1
(1.21)
5
(9.05)
9
(6.03)
2
(3.92)
4
(3.32)
χ2= .053 3.503 2.522 1.520 .221
My organization
is better known
1
(.93)
5
(6.98)
6
(4.66)
4
(3.03)
1
(2.56)
χ2= .007 .990 .612 .460 1.369
Educational
outcomes are
improving in my
community
1
(1.93)
7
(14.48)
15
(9.66)
8
(6.28)
7
(5.31)
χ2= 1.185 13.062 *** 5.243* .565 .691
Numbers in the table reflect observed frequencies, while numbers in parentheses reflect expected frequencies for
each form of participation. All chi-square values were calculated in 2x2 matrices (type of participation x stake) and
reflect df=1.
# indicate that, although the χ2 was significant, the minumum cell counts for these forms of participation were < 5.
Because no cell should have an expected frequency < 5 in using chi-squares, these values are reported but cannot be
interpreted as forms of participation.
*p < .05, **p<.01, ***p<.001
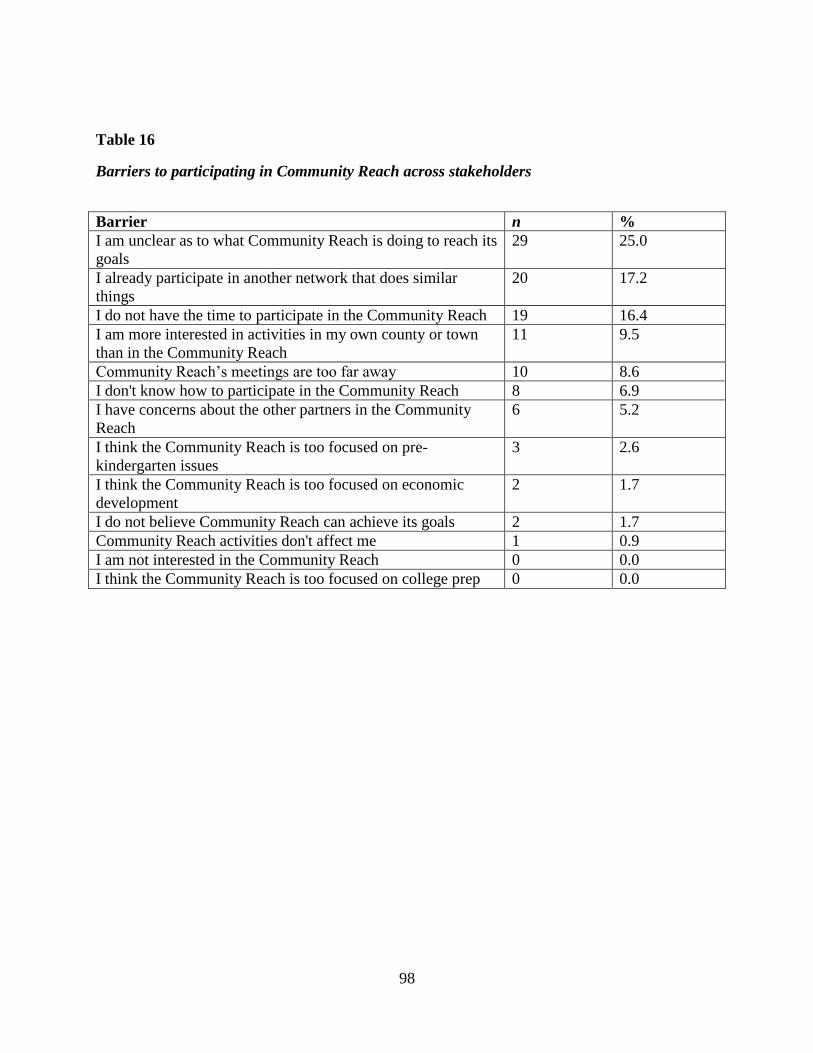
98
Table 16
Barriers to participating in Community Reach across stakeholders
Barrier n %
I am unclear as to what Community Reach is doing to reach its
goals
29 25.0
I already participate in another network that does similar
things
20 17.2
I do not have the time to participate in the Community Reach 19 16.4
I am more interested in activities in my own county or town
than in the Community Reach
11 9.5
Community Reach’s meetings are too far away 10 8.6
I don't know how to participate in the Community Reach 8 6.9
I have concerns about the other partners in the Community
Reach
6 5.2
I think the Community Reach is too focused on pre-
kindergarten issues
3 2.6
I think the Community Reach is too focused on economic
development
2 1.7
I do not believe Community Reach can achieve its goals 2 1.7
Community Reach activities don't affect me 1 0.9
I am not interested in the Community Reach 0 0.0
I think the Community Reach is too focused on college prep 0 0.0
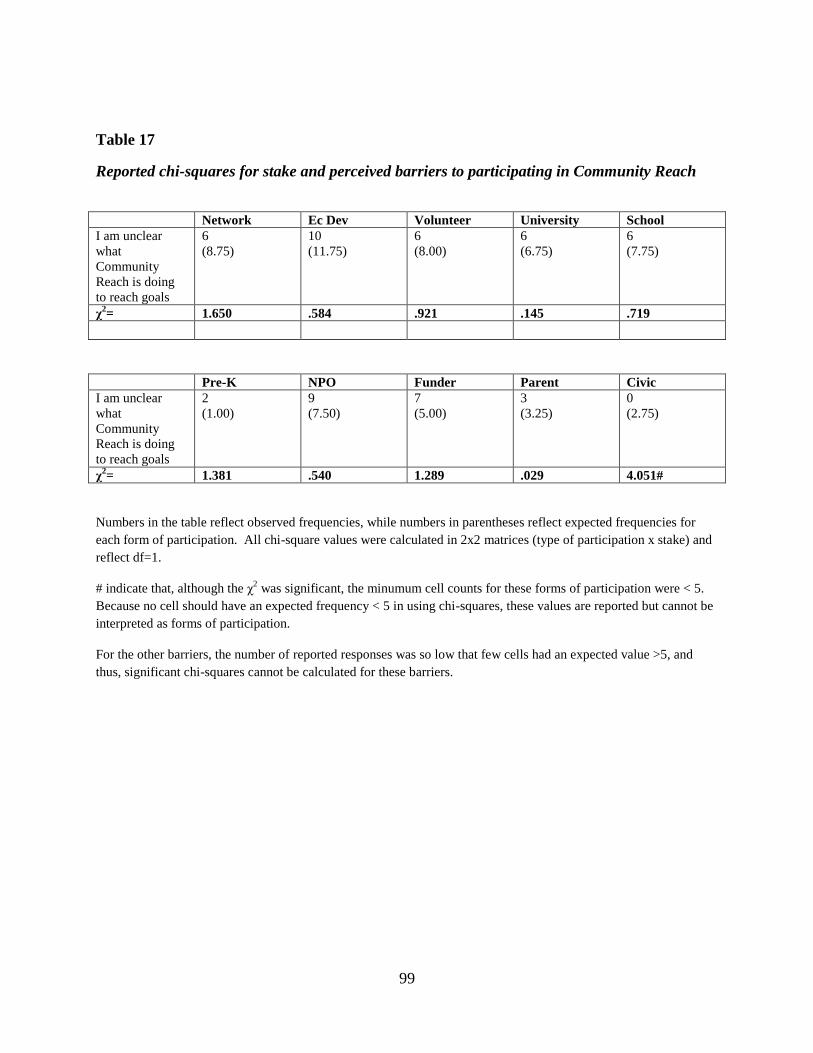
99
Table 17
Reported chi-squares for stake and perceived barriers to participating in Community Reach
Network Ec Dev Volunteer University School
I am unclear
what
Community
Reach is doing
to reach goals
6
(8.75) 10
(11.75) 6
(8.00) 6
(6.75) 6
(7.75)
χ2= 1.650 .584 .921 .145 .719
Pre-K NPO Funder Parent Civic
I am unclear
what
Community
Reach is doing
to reach goals
2
(1.00) 9
(7.50) 7
(5.00) 3
(3.25) 0
(2.75)
χ2= 1.381 .540 1.289 .029 4.051#
Numbers in the table reflect observed frequencies, while numbers in parentheses reflect expected frequencies for
each form of participation. All chi-square values were calculated in 2x2 matrices (type of participation x stake) and
reflect df=1.
# indicate that, although the χ2 was significant, the minumum cell counts for these forms of participation were < 5.
Because no cell should have an expected frequency < 5 in using chi-squares, these values are reported but cannot be
interpreted as forms of participation.
For the other barriers, the number of reported responses was so low that few cells had an expected value >5, and
thus, significant chi-squares cannot be calculated for these barriers.
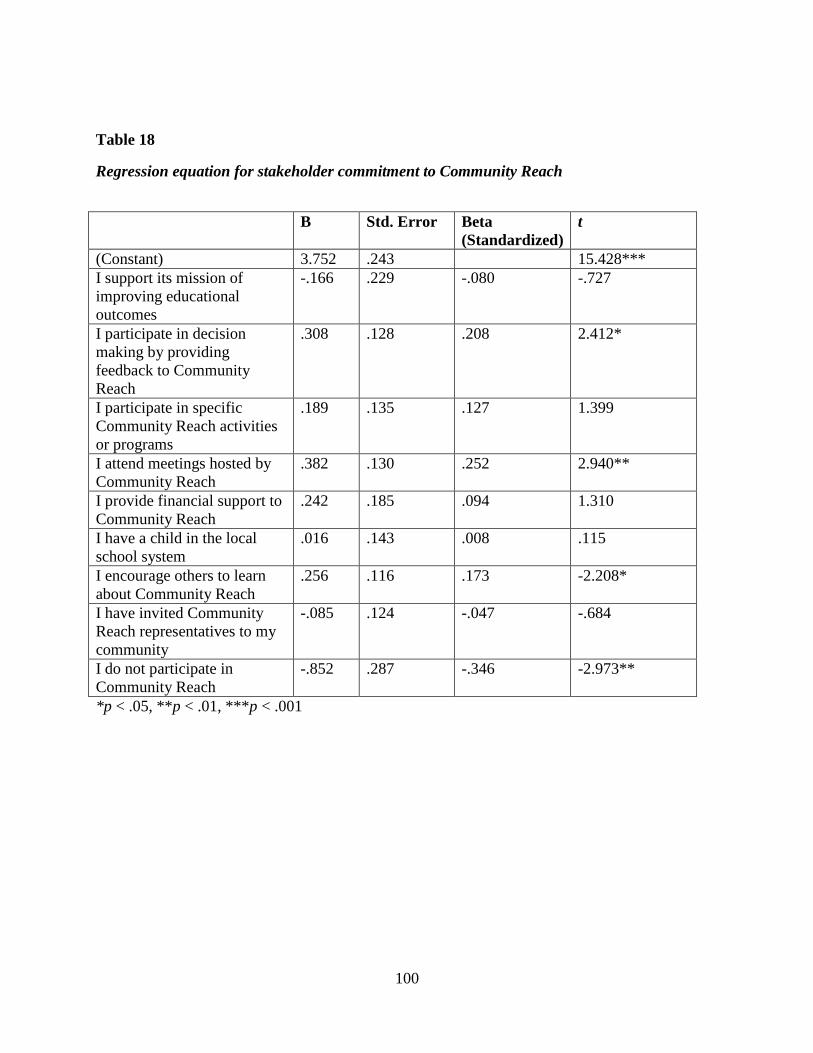
100
Table 18
Regression equation for stakeholder commitment to Community Reach
B Std. Error Beta
(Standardized)
t
(Constant) 3.752 .243 15.428***
I support its mission of
improving educational
outcomes
-.166 .229 -.080 -.727
I participate in decision
making by providing
feedback to Community
Reach
.308 .128 .208 2.412*
I participate in specific
Community Reach activities
or programs
.189 .135 .127 1.399
I attend meetings hosted by
Community Reach
.382 .130 .252 2.940**
I provide financial support to
Community Reach
.242 .185
.094 1.310
I have a child in the local
school system
.016 .143 .008 .115
I encourage others to learn
about Community Reach
.256 .116 .173 -2.208*
I have invited Community
Reach representatives to my
community
-.085 .124 -.047 -.684
I do not participate in
Community Reach
-.852 .287 -.346 -2.973**
*p < .05, **p < .01, ***p < .001
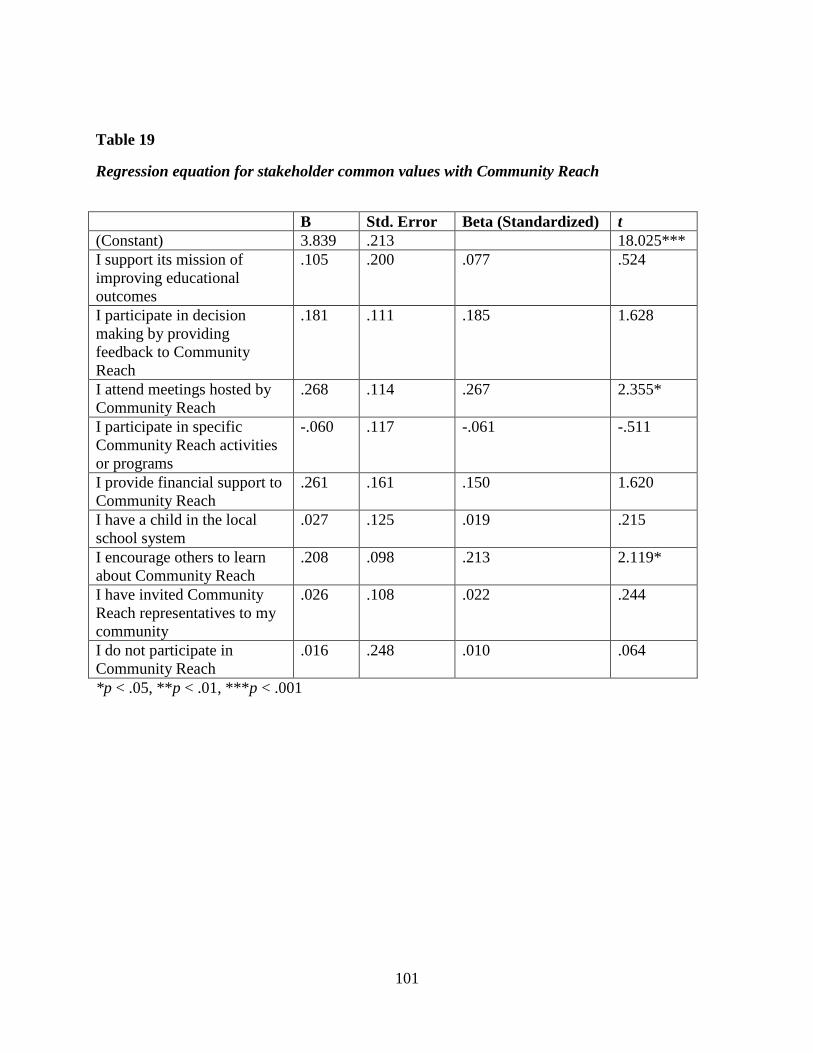
101
Table 19
Regression equation for stakeholder common values with Community Reach
B Std. Error Beta (Standardized) t
(Constant) 3.839 .213 18.025***
I support its mission of
improving educational
outcomes
.105 .200 .077 .524
I participate in decision
making by providing
feedback to Community
Reach
.181 .111 .185 1.628
I attend meetings hosted by
Community Reach
.268 .114 .267 2.355*
I participate in specific
Community Reach activities
or programs
-.060 .117 -.061 -.511
I provide financial support to
Community Reach
.261 .161 .150 1.620
I have a child in the local
school system
.027 .125 .019 .215
I encourage others to learn
about Community Reach
.208 .098 .213 2.119*
I have invited Community
Reach representatives to my
community
.026 .108 .022 .244
I do not participate in
Community Reach
.016 .248 .010 .064
*p < .05, **p < .01, ***p < .001
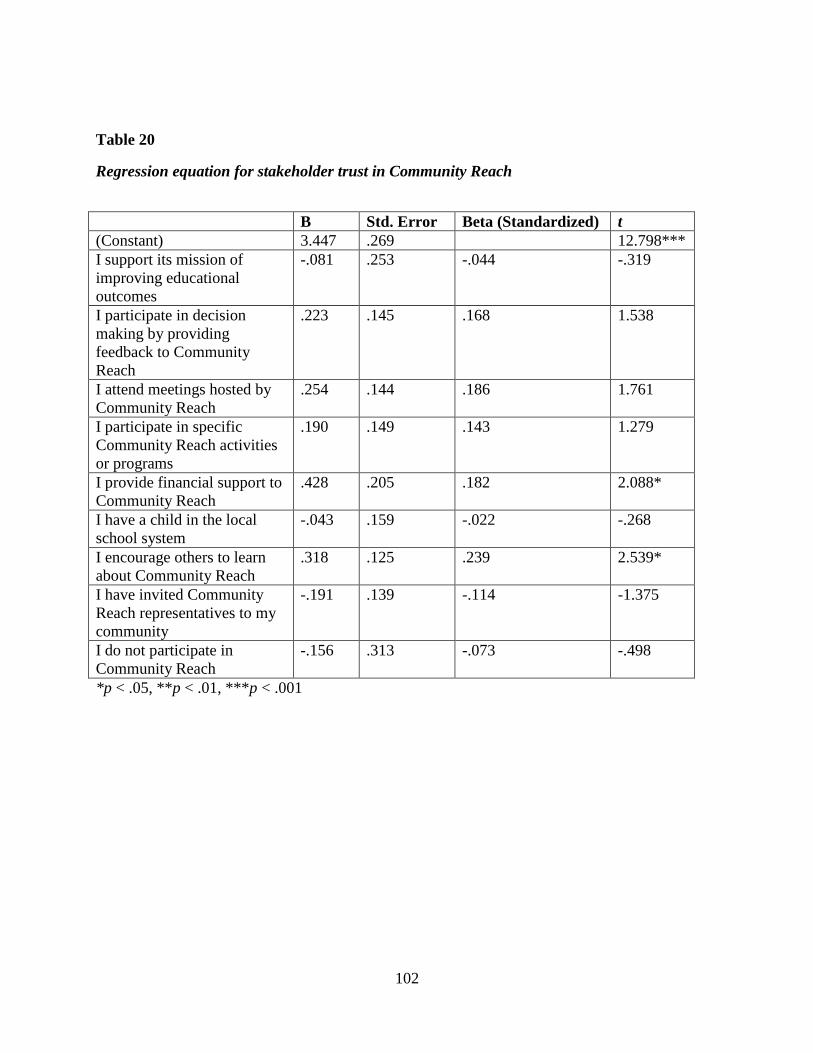
102
Table 20
Regression equation for stakeholder trust in Community Reach
B Std. Error Beta (Standardized) t
(Constant) 3.447 .269 12.798***
I support its mission of
improving educational
outcomes
-.081 .253 -.044 -.319
I participate in decision
making by providing
feedback to Community
Reach
.223 .145 .168 1.538
I attend meetings hosted by
Community Reach
.254 .144 .186 1.761
I participate in specific
Community Reach activities
or programs
.190 .149 .143 1.279
I provide financial support to
Community Reach
.428 .205 .182 2.088*
I have a child in the local
school system
-.043 .159 -.022 -.268
I encourage others to learn
about Community Reach
.318 .125 .239 2.539*
I have invited Community
Reach representatives to my
community
-.191 .139 -.114 -1.375
I do not participate in
Community Reach
-.156 .313 -.073 -.498
*p < .05, **p < .01, ***p < .001
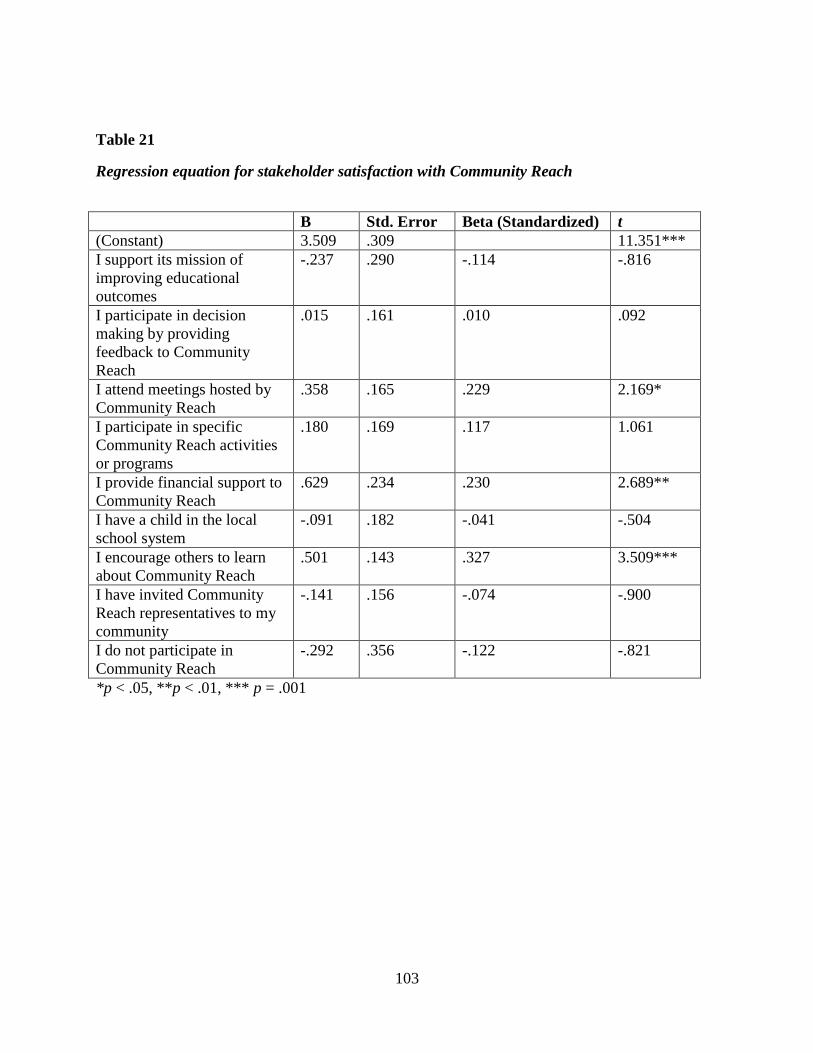
103
Table 21
Regression equation for stakeholder satisfaction with Community Reach
B Std. Error Beta (Standardized) t
(Constant) 3.509 .309 11.351***
I support its mission of
improving educational
outcomes
-.237 .290 -.114 -.816
I participate in decision
making by providing
feedback to Community
Reach
.015 .161 .010 .092
I attend meetings hosted by
Community Reach
.358 .165 .229 2.169*
I participate in specific
Community Reach activities
or programs
.180 .169 .117 1.061
I provide financial support to
Community Reach
.629 .234 .230 2.689**
I have a child in the local
school system
-.091 .182 -.041 -.504
I encourage others to learn
about Community Reach
.501 .143 .327 3.509***
I have invited Community
Reach representatives to my
community
-.141 .156 -.074 -.900
I do not participate in
Community Reach
-.292 .356 -.122 -.821
*p < .05, **p < .01, *** p = .001
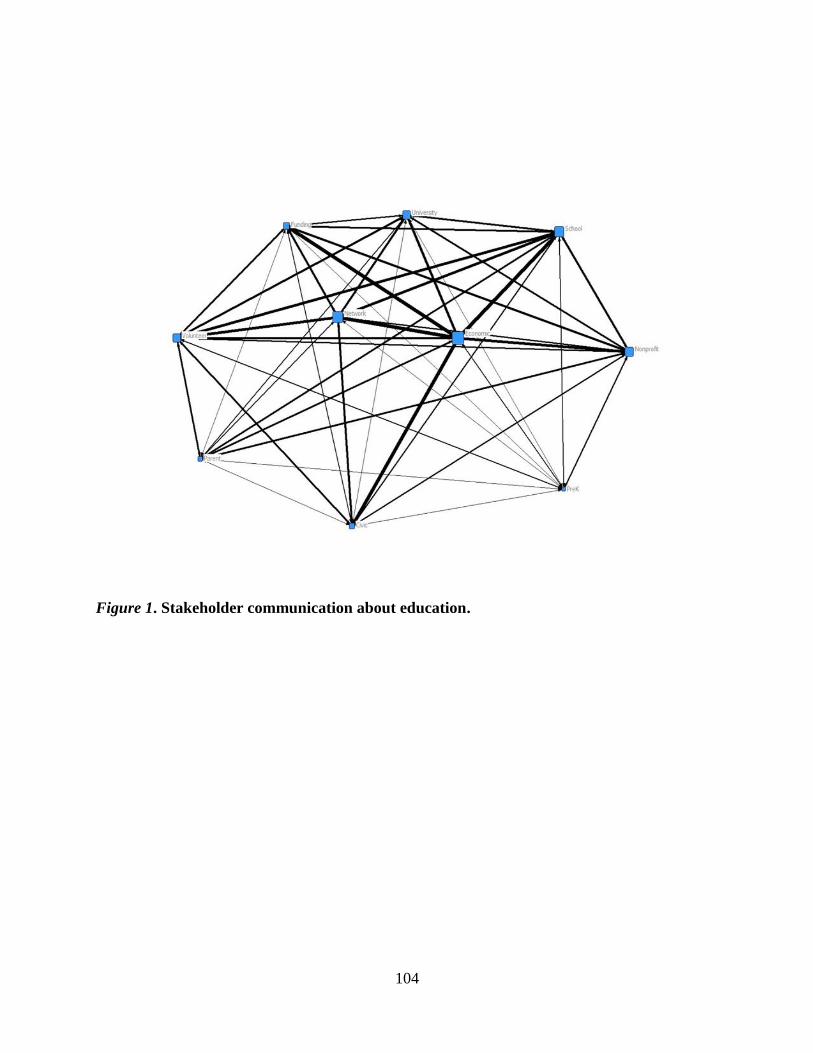
104
Figure 1. Stakeholder communication about education.
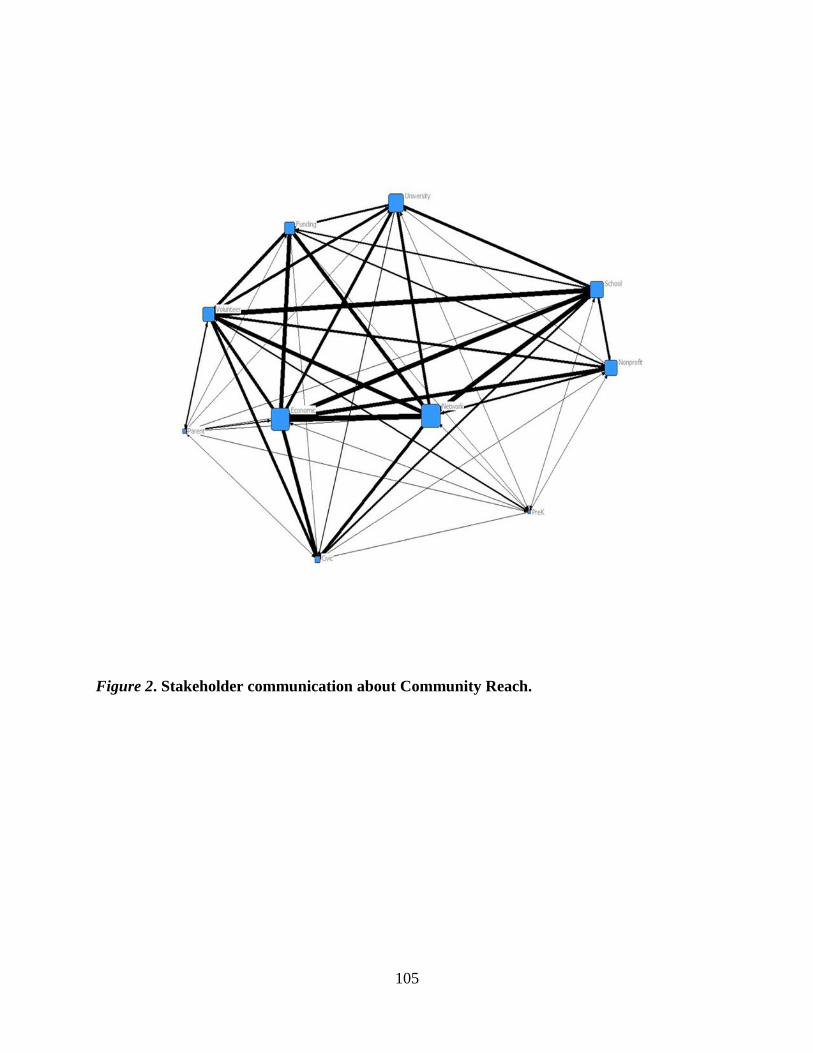
105
Figure 2. Stakeholder communication about Community Reach.
106
CHAPTER 5: Discussion and Conclusion
The results paint a picture of a complex network structure dominated by community
leaders and articulated against a backdrop of economic tensions. The stakes described by
Community Reach are evident in the community, and these stakes – Network membership,
Economic Development, Volunteer, Nonprofit, Early Childhood, School Systems, University,
Parent, Civic, and Funding – in turn influence the relationships within the network, the perceived
benefits and barriers to participation, and ultimately, stakeholder outcomes of participation in
Community Reach.
This discussion comments on major findings from the groupings of research questions:
stakeholder relationships, stakes, stakeholder participation, stakeholder differences in
participation, and stakeholder outcomes of participation. Previous research has indicated
scholarly concern that organizational research does not necessarily reflect diverse stakeholder
perspectives and that there is a need for other points of view (Freeman et al., 2010; Friedman &
Miles, 2002); because the survey was developed from stakeholder interviews, quotes are
included to illustrate survey findings throughout the discussion. Following a summary of results,
I draw on these findings to suggest implications for nonprofit collaborative networks, including
a) the reproduction of organizational problems at a network level, b) the realities of multi-
organizational collaboration in response to a wicked problem, c) the role of nonprofits in
networks, and d) the communicative impacts of this study for collaborative networks.
These findings also have implications for stakeholder theory. In the discussion, I return
to some of the criticisms of stakeholder theory and suggest that this study challenges some of the
assumptions present in stakeholder theory. I suggest three main contributions for stakeholder
107
theory: first, that stakeholder engagement, rather than stakeholder management, leads to
outcomes; second, that despite the normative components ascribed to stakeholder theory, power
differences are present and even accentuated in interorganizational collaboration; and third, that
the application of stakeholder theory to a problem domain allows for a focus on stakes rather
than the identification of individual stakeholders to a focal organizations that typically dominates
stakeholder theory and research. I suggest a preliminary model in which stakes inform
relationships, benefits and barriers that influence various forms of participation and ultimately
result in stakeholder, organizational, and network-level outcomes. The section concludes with
limitations and future research directions.
Stakeholder Relationships
The first two research questions pertained to stakeholder relationships. Researchers
know little about stakeholder relationships (Antonacopoulou & Meric, 2005), though stakeholder
interaction has been described as an area of future research (Lewis, 2011). RQ1 asked what
relationships existed among stakeholders in the general educational network, and the findings
revealed that the survey population tended to talk to those representing Economic Development
organizations about educational issues. There was a substantial difference in the centrality
measures, indicating that Economic Development representatives are more central in discussions
of education, with survey respondents indicating that they had fewer conversations with
representatives of School Systems or Universities in talking about educational issues. Economic
Development stakeholders make up the largest group within this sample, and are likely to talk
more to other Economic Development stakeholders (although these figures are more evenly
distributed in the general educational category than in conversations pertaining to Community
Reach).
108
The second research question asked who stakeholders communicated with in response to
Community Reach. Although the centrality results did not indicate as large of a differential as
was the case in asking who stakeholders talked to about education in general, stakeholders still
reported more relationships with Economic Development professionals and regional networks
than they did with those stakeholders representing local schools, universities, or nonprofits. It is
important to remember that these stakes are not mutually exclusive – that is, an individual could
be local business owners (Economic Development) as well as serve on local school board
(School Systems) or have a child enrolled in the local school (Parent). However, despite the fact
that multiple stakeholder affiliations may be reported, it appears that many of the conversations
about education, and specifically, the educational goals within Community Reach, are happening
among members representing the area’s economic interests. These results confirm that, as
several interview participants suggested, representatives of local schools are less likely to know
about Community Reach or its activities. Said Kirsten, a member of a local community
foundation:
There’s kind of a gap there right now. In fact, I just met with one of our superintendents
from one of our largest school districts. “What have you heard about Community
Reach?” And she said, “Not a lot.” And it kind of pained me a little bit but the other part
of me was saying, “Well, me neither.”
Deborah, a school board member, indicated that within the school systems, leaders are
likely more privy to conversations about Community Reach:
“I wouldn’t have a good feel for teachers. I doubt that the teachers – I would imagine
administrators are more aware than teachers. …I don’t think it’s filtered down much to
teachers yet.”
Deborah’s comments echo those of several other interview participants who indicated
that community leaders, be they in business or schools or local government, were more likely to
109
know about Community Reach than those not in leadership positions. Those who hold
leadership positions likely wield some sort of power, but in network terminology, relationships
themselves may be conceived as power. Centrality is “power obtained through the network’s
structure” (Rowley, 1997, p. 898), and the findings for both RQs 1 and 2 suggest that those
representing Economic Development or Network Membership indicate that these players have
more power in these interactions pertaining to education in general or educational initiatives
within the scope of Community Reach. The in-degree centrality indicates that, although School
Systems are frequently talked to about Education, Funders emerge as the next sought-after
group, with Economic Development stakeholders talked to about as frequently as University
Educators. Within Community Reach, School Systems has the highest indegree centrality,
though this is closely followed by Network membership.
These findings are interesting in that they indicate stakeholder relationships; less clear
from the findings is stakeholder relationship to the focal organizations. Most stakeholder
research focuses not on stakeholder relationships but relationships to target or focal organizations
(see Butterfield, Reed, & Lemak, 2004; Rowley, 1997). Rowley’s (1997) propositions pertain
to the focal organization, suggesting that as its centrality increases, the focal organization also
has an increasing ability to resist stakeholder pressure. Although the centrality statistics indicate
some more powerful groups within Community Reach, their connection to the collaboration is
further muddled by the fact that stakeholders representing these more “central” stakes identified
as members of the regional networks that fund or convene Community Reach. These stakes
were explored further in RQ3.
110
Stakes in Community Reach
The third research question asked what stakes were represented in Community Reach.
Despite the fact that this collaboration is dedicated to improving educational outcomes,
Economic Development stakeholders dominate the landscape of Community Reach.
Interestingly, most of the Economic Development stakeholders were named by other individuals
rather than the by Community Reach itself. When the director of Community Reach was asked
to identify stakeholders, the largest group was comprised of representatives of social services
Nonprofits, followed by University or vocational educators, Economic Development
professionals, and School Systems. However, when those stakeholders were asked to name
additional stakeholders, School Systems (24.2% of total stakeholders and Economic
Development (20.1%) emerged as the largest groups, with a steep drop-off between these groups
and the University educators, Community Foundations, Civic groups, Early Childhood
education, and Nonprofit representatives. Economic Development emerged as the largest group
in the stakeholder survey (40.5%).
Several interview participants suggested the link between education and economic
development. Rose, an economic development professional, pointed out that education was
necessary to improve the lives of community members in the region, who have lost a number of
blue-collar and manufacturing jobs:
You can’t overemphasize how important any kind of a higher education skill is to have
for your citizens in your area. … I think the best way to explain it is in this area; 30 years
ago you were looking at factory jobs that paid $25, $30. Amazing pay. Those jobs don’t
exist anymore, and a lot of the people in this region … haven’t gotten that mindset yet
that those jobs, they just don’t exist. Computers are doing those jobs, machines are doing
those jobs. There has to be a huge shift in the way people think about how much money
you plan to make to live and survive comfortably and what you can do to make that
money. Nowadays you cannot work in a factory and make the kind of money you need
to raise two children.
111
Julian, a prominent community leader with connections to local schools and local
businesses, voiced his concern that many of the towns in this region would not survive if not for
the ability to attract employers, and saw Community Reach as the answer:
“I’m convinced that the professionals who work there [at new employers] or the highly
skilled, highly trained people who work there would not be moving into [the] county if
we weren’t pursuing Community Reach.”
The presence of so many Economic Development stakeholders in an education-based
collaborative network is not without some controversy. Mark, a superintendent in one of the
local school systems, expressed his desire not to be involved in Community Reach because it
was not as explicitly involved in educational issues:
I know part of Community Reach is even to work with the …community and different
things so that people might want to locate here, but I think it’s more job-driven than it is
community-driven. I know those go hand in hand, but that’s how I view it.
Economic Development stakes also overlap quite a bit with Network Membership. This
stake refers to membership in one of the three regional networks formed for purposes of
economic growth and play pivotal roles in funding and convening Community Reach. Although
survey participants could indicate their membership in various networks, interview participants
admitted that these distinctions were confusing, particularly to those who did not identify as a
part of the regional network. Jon, a member of a local community foundation, suggested that
this was a problem for his staff as well as for his own work:
…A lot of them don't even understand what Umbrella Network is, much less what Project
Network is, much less the [goals]. And it just trickles down. … That's where the
confusion occurs. …I have my own board who doesn't understand this agency versus the
regional [network]. They get them confused constantly. …It confuses me, too. When we
have the [goals] and we have all the committees that break off into them, I get lost. What
is this for? I should know.
112
If such designations are confusing to local leaders, they are even more so to those in non-
leadership positions as suggested by Ben, the mayor of a small town:
I bet you 95 percent of the citizens of [my town] have never heard of Community Reach
or the Umbrella Network. They may have heard of the Umbrella Network but they don’t
understand what they do. They get them mixed up …There’s too many, there’s too
many... they hear too many [regional] things and they don’t understand that stuff. It’s my
job to try to educate them. They don’t have to know the specifics, just have to know
what the goal is for everybody.
The research suggests that collaboration membership structures can be ambiguous,
complex, and dynamic, and that it is difficult to identify stakeholders in collaboration (Huxham
& Vangen, 2000), but the presence of these networks within the Community Reach network
makes stakeholder identification particularly challenging. It is difficult to know when one
network ends and another begins; moreover, Network membership seems to indicate a hidden, or
implicit, stake that emerged later in the data collection process. Although Community Reach
states its affiliation with the three regional networks on its website, the director of Community
Reach named only 4 of 99 stakeholders as identified by their Network membership. Network
membership came up so frequently in interviews that I added it as a survey category, and nearly
one-third of survey participants reported membership in at least one of the three regional
networks.
This “implicit” stake is also further complicates the distinction between internal and
external stakeholders often used in nonprofit research. Van Puyvelde et al. (2012) refer to
internal stakeholders (employees, managers, and volunteers), external (funders, beneficiaries,
suppliers/contractors, competitors, organizational partners and other media or community
groups) and interface (board members). Network members are a hybrid of funders,
organizational partners, and volunteers, making it difficult to place them under existing
stakeholder classifications.
113
Self-identified Volunteers were also likely to report membership in at least one of the
networks, which begs the question as to how the role of the volunteer is changing. Although
service-driven nonprofit organizations typically rely on volunteer services to complete activities
from stuffing envelopes to tutoring, it is less clear what it means to volunteer in a collaborative
such as Community Reach means. For those who belong to the regional networks that fund or
convene Community Reach, it is possible that membership in these networks is seen as
volunteering without participation in specific activities. Asked whether they were people in the
community to sustain Community Reach activities through more traditional ways of
volunteering, Kirsten, a community foundation member, was uncertain as to whether people
could fill those roles:
“That’s a good question. I struggle with that a little bit. …Volunteerism is a dying art.
People just don’t seem to have the time.”
Those representing Community Foundations, such as Kirsten, seemingly represent
several stakes within Community Reach. Community Foundations were named as stakes by both
Community Reach as well as by other stakeholders – and, by the latter, more frequently named
than other kinds of nonprofits, even those working with children or educational initiatives.
Community Reach members were described as most powerful stakeholders more frequently than
they were described as organized, interested in education or interested in working with others.
Interviews indicated that Community Foundation members were frequently sought out for input
or for resources pertaining to education. Elizabeth, a representative of a local community
foundation, explained her organization’s relationship to Community Reach:
I believe our foundation was probably on their radar as somebody to cultivate a
relationship with. They saw community foundations as being, maybe not necessary, but
ideal partners because we are county wide, and community foundations are generally
thought of as conveners of groups and collaborators, and we’re more neutral bodies that
organizations that have more specific agendas and interests. …So I think probably
community foundations get this better than other organizations.
114
Elizabeth suggested that community foundations were better positioned to understand
Community Reach, and interestingly, several community foundations had started their own
collective impact educational initiatives independently of Community Reach. The perception of
Community Foundations as funders rather than individual donors is also indicative of the
changing nature of stakes in a collaborative network. Similarly to how volunteer efforts are
perceived differently in a network than in traditional nonprofit contexts, the presence of
foundations represent a bigger stake in Community Reach than individual donors.
Up to this point, most of the discussion has focused on stakes that are more frequently
represented in Community Reach or presumably possess more power within the collaboration. It
is worth commenting on some of the less prominent stakes, particularly Early Childhood
Education and Parents. Early Childhood Educators were a consistently smaller group of
stakeholders, whether named by Community Reach itself or Community Reach stakeholders, and
the relationship between Early Childhood Educators and other educators – or Community Reach
in general – proved to be somewhat murky. Deborah, a school board member, described an early
Community Reach planning meeting in which participants were split “into age level groups by,
like, preschool, early childhood education, high school, post-secondary and tried to figure out
what benchmarks would be appropriate for each of those levels.” Julian, a community leader,
complained that despite the emphasis on these different groups, Early Childhood had a privileged
stake at first:
One of the challenges and obstacles initially was making certain that we didn’t have –
this is going to sound horrible – we didn’t have Community Reach being run by
preschoolers. And additionally, preschool people. And initially, that’s really what, kind
of, took the lead on everything. Not the public schools, not post-secondary, not economic
development, but preschool. And everything was, kind of, being put that way. And…we
had to stomp our feet a little bit to get some things changed.”
115
Any influence Early Childhood stakeholders may have had in the beginning of
Community Reach’s influence seems to have diminished. The results for RQs 1 and 2 also
indicate that Early Childhood stakeholders are marginalized in this collaboration; few
stakeholders seek out Early Childhood educators to talk to about education or specifically about
Community Reach. Early Childhood educators were also targeted far less than K-12 School
Systems or University educators. However, in the data collection for this project, Early
Childhood Educators played a small but significant role: two Early Childhood Educators, upon
receipt of the pre-survey, included Parents as a stakeholder group. These were the only
individuals to do so.
As indicated in the literature, organizational studies typically rely on the employee
perspective, and nonprofit literature rarely includes the perspective of clients or beneficiaries. In
this case, given that Community Reach is dedicated to improving educational outcomes, clients
or beneficiaries would likely be construed as families consisting of students and their parents.
However, getting feedback from this group proved to be difficult for two reasons: first, as
previously mentioned, only two Community Reach stakeholders actually named parents as
fellow stakeholders. Second, few of the survey participants identified as parents themselves
(12.1% indicated they had children in the local school system). Although one may assume that
many more of the survey participants do in fact have children, the age of the participants suggest
that it is likely that their children have not been in the local schools for quite some time. Of the
three interview participants whose only stake was being a Parent, none of them had heard of
Community Reach. This would correspond to the literature, which indicates that nonprofits
typically do not see clients as strategically important stakeholders (Kilby, 2006); however, it is
somewhat surprising that in a network dedicated to educational outcomes, parental needs,
116
interest or involvement were rarely cited from other stakeholders across Educational or
Economic stakes.
The presence of stakes in Community Reach – from Educational to Economic, Civic to
Nonprofit – further demonstrate the challenges of combating a “wicked” problem. As Weber
and Khademiam (2008) suggested, such problems are “cross-cutting” as indicated by the
presence of multiple, interdependent stakeholders and diverse perspectives. The stakeholders
represented in interviews and surveys are but a fraction of individuals across the 10 counties
affected by Community Reach; their perceptions as reflected in the data reveal a number of
rivaling stakes further complicated by the fact that individuals often play multiple roles.
Stakeholder Participation in Community Reach
Having explored these stakes and the relationships between stakes, I turn now to a further
exploration of how these various stakeholders participate in Community Reach. The fourth
research question pertained to how stakeholders participated in Community Reach, and the
results indicate that most of the survey participants do participate in Community Reach in
multiple ways, on a monthly or quarterly basis. Although the interviews revealed a number of
ways to participate that were confirmed by survey responses, interview participants were often
vague in what it meant to participate in Community Reach. Recognizing that Community Reach
is a somewhat unfamiliar entity in the community, interview participants suggested that simply
being aware of the network’s efforts was important. As stated by Ben, a local mayor: “I really
haven’t done a whole lot for Community Reach, but I’ve understood what they’re trying to do,
anyhow.” The idea of supporting the cause of improving educational outcomes was mentioned
numerous times by interview participants, and by far the most common form of participation in
117
Community Reach (77.6%). When asked what it means to participate in Community Reach,
Deborah stated:
Well, I – I’m not sure. As my – as a school board person I suppose it means just to be
supportive of the goal. I’m not – I haven’t been involved in that any further than that, so
– that’s my level of commitment at the moment.
Fortunately for Community Reach, most people indicated that they also participated in
other ways besides simply believing its mission. Alongside this idea of support, many suggested
that their role was to tell others about Community Reach. For example, Elizabeth, a community
foundation member, said, “What it means to participate? I think probably the best we could hope
for is awareness.” Elizabeth went on to say in the interview, “I think a form of participation is
being a champion. For the initiative, yes, Community Reach and the cause of raising the level of
education.” Others mentioned that telling people about Community Reach is about all they
could do, since they didn’t know other ways of participating or were limited in terms of time, as
was the case with Kirsten, another community foundation member in a different county. Asked
what it means to participate, Kirsten said:
You know, right now, just a conduit for information. There’s not a lot we’re doing right
now, other than trying to bring up the message of what Community Reach is going to be.
…The one thing I feel like I’m doing right now, is to the best of my ability, I’m bringing
the information back to this county. The best that I can. Again, I don’t know that there’s
a lot of information for me to share at this point.
Information about Community Reach was commonly disseminated at meetings, and
meeting attendance was the second most common way of participating in Community Reach
(55.2%). Claire, a nonprofit leader, was asked if she could talk about what it meant to participate
in Community Reach, responded: “No, I can't. I think it's, ‘Come to meetings. Don't come to
meetings.’” Meetings are commonplace as suggested by Jon, a community funder: “In the
broader section of Community Reach, it seems I've attended meetings. I've attended kick-offs,
work sessions where we brainstorm…We still do that.”
118
The most common ways of participating in Community Reach involve supporting the
mission and communicating about the network through meetings or with personal contacts.
Beyond these forms of participation, two interview participants mentioned participating in
specific Community Reach activities and programs, and these pertained to the development of a
college savings account program for area youth (a program which, it is worth mentioning,
combines economic and educational initiatives). Several educators and community foundation
members indicated that they had been involved in some sort of curriculum development, though
these mostly pertained to programs at the county level rather than across Community Reach, and
several community leaders representing Economic Development or Civic stakes indicated that
there were programs in their communities that allowed students to visit college campuses or
work sites, even if they were not involved with these explicitly, and these programs were not
necessarily affiliated with Community Reach. Only 41.4% of survey participants indicated that
they participated in specific Community Reach activities or programs.
These findings do not necessarily shed much light on stakeholder participation, for which
there is no accepted understanding (Green & Hunton-Clarke, 2003). However, they do seem to
back up earlier studies that indicate that stakeholder participation in collaboration may be
construed as simply showing up (see Koschmann, 2008). Given that Community Reach is still a
relatively new network, it may be that stakeholders have not yet caught on to different ways in
which they may participate. However, it is telling that stakeholders that hold leadership
positions and may be internal to the collaboration are more likely to participate in Community
Reach.
119
Stakeholder differences in participation.
In RQ5, I asked whether different stakeholders participate in different ways. The results
indicate that Network members were far more likely to participate than other stakeholders.
Other stakeholders stand out in various forms of participation – for example, University
stakeholders were slightly more likely to attend meetings or encourage others to learn about
Community Reach – but Network members and Volunteers emerge as more likely to participate
than other stakeholders across categories. This is indicative of two things; first, that, despite the
acknowledged need to access stakeholder perspectives other than those of organizational insiders
(see Friedman & Miles, 2002), organizational insiders are more likely to participate in varied
ways. Second, that the Networks are ultimately governed by economic goals again reveals the
tension between Education and Economic Development present in Community Reach, as those
representing economic interests are more likely to participate than those representing educational
or nonprofit stakes. Among educators, only those at the University level stand out as being
likely to participate in specific ways.
It is perhaps worth commenting on the role of meetings here. Volunteers (heavily
comprised of network members, as previously established), business owners, and university
educators were more likely than other stakeholders to attend meetings. This is reminiscent of
Purdy’s (2012) study in which she notes that nonprofits, although they had relatively little power
save in the way of discursive legitimacy, were rather limited in meetings. Purdy pointed out that
businesses have a heavier presence at meetings because their jobs allowed them to send several
representatives. For nonprofit organizations, which tend to have fewer resources and fewer staff,
having a regular presence at meetings could be difficult, as suggested by Matthew:
120
It takes a lot of time to do – to get the meetings and I’ve participated in some of them and
we are blessed to have a lot of staff like a lot of nonprofits yet we still don’t have a lot of
time to spend the meetings to discuss some of these things and I think a lot of nonprofits
think the same way.
Missing meetings is problematic if that’s where decisions are made, and several
interviewees suggested that leaders perhaps had a greater presence at these meetings. Drew, a
university educator, was actively involved in Community Reach’s savings account program, but
rarely attended meetings:
For me, it's more at a micro level. I know that there are bigger fish that are in larger
meetings – CEOs, university presidents, and so forth – who go to monthly meetings. By
the time it comes down to me, I would consider myself a smaller fish. By the time it gets
to me, it's about more on the ground progress – working with individuals on specific
projects.
Claire, the nonprofit leader who expressed disdain for the number of Community Reach
meetings, suggested that there were additional meetings to which she wasn’t invited:
I can allude to the fact, from meetings, that there are after meeting meetings, or prior
meetings, or in-between-meeting meetings. I'm thinking none of this was discussed when
I was here, so surely something has occurred that I don't have knowledge of.
The survey results indicate that Network members and Volunteers were more likely to
indicate that they participate in decision making, and although interview participants did not
explicitly share ways in which they did so, Claire expressed frustration that this process was not
as transparent as she would like:
It's like – this is supposed to be organic. This just happened last week. A bunch of guys
[said] "It seems like you already know the answer. You already know what you want.
So why are you asking us?" Because every time we try to give a different idea, you get
us right back to where you want. But then it's like, "No, no. It's organic." No, I don't
think it's organic. … somebody expressed frustration last week and said, "It sounds to me
like you know where you want to go.”
Claire’s disappointment was echoed by another nonprofit leader. Scott said he was not
involved in Community Reach, but had been involved in other prior educational initiatives with
121
Project Network. His own experience had indicated that those involved in the decision-making
did not necessarily represent the broader community:
That’s what’s so difficult with people who are making decisions on groups that they have
no real personal tie to. They may miss the mark on what will exactly work, so you can
make all kinds of great things for people the way you would do it, but if that’s not what
they want then it’s not gonna work. So, I think it’s so critical to engage the people you’re
trying to work with in addition to people like me who are working with low-income
people.
The likelihood of organizational insiders to participate was also evident in RQ6, which
explored different stakeholders’ perceptions of Community Reach. Only about half of survey
participants indicated their agreement with most of the perceived benefits of participating in
Community Reach, but again, Network members and Volunteers were much more likely to
perceive these benefits. As has been the case in prior research questions, there is a divide
between Economic Development and Education, as stakes in the former group are generally
more likely to perceive benefits of participating in Community Reach. Although other studies
have found that stakeholders are generally influential community members and organizational
decision makers (see Heath, 2007), this study goes one step further to indicate that these
stakeholders typically perceive more benefits than other stakeholders.
Of the perceived benefits, the most frequently cited advantage of participating in
Community Reach was this idea that a network approach could accomplish more than individual
approaches (70%). This was a common refrain in the interviews that preceded the survey, put
simply here by Rose, an economic development professional:
Anytime you can partner with like your surrounding counties and do bigger things,
people see that and it’s on so much of a larger scale than what we could ever do
individually. So I really love the idea of any kind of a partnership within a region or
surrounding counties, anything like that. … five counties pulled together do, can do so
much more than one little county.”
122
Many interview participants championed network approaches, and the survey indicated
that many participants identify as members of regional networks or other local educational
networks. However, the fervor with which stakeholders embrace network approaches can also
lead to network fatigue. Just over 17% of survey participants indicated that they already
participate in another network that does similar things to Community Reach. Interview
participants talked at length about some of their local efforts and how that diminished the
attentions they could give to Community Reach. As Jon succinctly put it, “I have enough to
worry about. We're doing it locally, so I'm not going to worry about the region.” This sentiment
was echoed by Julian, a community leader working across several stakes:
In a multi-county effort there are always turf battles. We’re still ten counties trying to
work and do – ultimately, my goal is for [my] county to prosper. And I can’t always look
at that with a regional eye. I sometimes have to be very colloquial in what we do.
In general, survey participants reported more perceived benefits than barriers to
participating in Community Reach, and no significant differences were found among different
stakeholders in reporting barriers. However, 25% of survey participants said that they were
unclear as to what Community Reach is doing to reach its goals. Rose, the economic
development professional, put it this way:
… The criteria and the steps that are being taken, they seemed little unclear to me. …I
wasn’t exactly sure what was getting accomplished, as horrible as that is to say. …It kind
of loops into itself over and over again. And I know when it’s a region it has to be that
way a little bit because you want everybody to feel included, but I think that’s where I got
a little lost in the, “Okay, exactly how are we doing this?” Like, I get what we want to
do. I don’t really get the steps of how we’re doing this. …I want to know the steps
you’re taking to actually make this goal a reality.
For Community Reach stakeholders, it seems, supporting the network’s goals and
understanding the mission came naturally, but stakeholders did not necessarily know what the
network was actually accomplishing or their role in it, as suggested by Kirsten:
123
You know, I’m struggling a little bit with it, to be honest with you. Not that I can’t
articulate what Community Reach is, I get that. It seems like it has been so focused on
data gathering, at this point, that I feel like I’ve kind of lost touch with – maybe I
shouldn’t say that. Instead of lost touch, maybe I should say I’m waiting. I’m waiting
for what the next piece of information is that comes up, to me that says, here’s how this
needs to work in your little community. Here’s your piece of the pie.
Outcomes of Participation in Community Reach
Despite any barriers to participating in Community Reach noted by stakeholders, survey
participants were generally positive about their experience with Community Reach. Researchers
suggest that little is known about stakeholders’ interpretations of collaboration as well as
outcomes of those collaborations (see Butterfield, Reed, & Lemak, 2004), and as Community
Reach is a relatively new network working until 2025 to meet their goals, there are not
necessarily many measurable outcomes at a network level. Using measures of relationship
quality, I sought to evaluate stakeholder outcomes as a result of their participation. In general,
stakeholders indicated that they were committed to, held common values with, trusted, and were
satisfied with Community Reach. Network members and Volunteers, who were more likely than
other stakeholders to participate and perceive benefits of participating in Community Reach, also
were more likely than others to experience these outcomes.
Several interview participants had talked about a “good feeling” that emerged from
working with children or families or in specific programs at through their own organizations if
not necessarily through Community Reach. For example, Drew talked about finding connections
between his service in Community Reach and his role as a university educator:
For me, there is a benefit, a positive outcome, in just feeling like the work I do is
connected. …I don't typically sit and think about the service I do. But feeling like there
is a connectedness between all of the various aspects of my life is meaningful. It's nice to
be able to know that part of the reason for that is because there's this larger initiative. I'm
able to see the impact of my work in a variety of projects that lean toward a larger effort.
124
However, the survey results indicated, surprisingly, that participating in decision-making
or participating in specific activities did not have as much of an effect on whether stakeholders
were more likely to experience these outcomes. Instead, participating in meetings and
encouraging others to learn about Community Reach were more likely to contribute to
stakeholders’ feelings of commitment, common values, trust, and satisfaction with the network.
Implications for Collaborative Networks
The results of this study reveal several implications for interorganizational collaboration
or networks, particularly those collaborations comprised of multiple organizational forms. These
implications include the reproduction of organizational problems at a network level, the realities
of multi-organizational collaboration in response to a wicked problem, the role of nonprofit
organizations in nonprofit collaborative networks, and the communicative impacts of network
relationships. Each implication is discussed in turn.
Organizational problems at a network level.
The first implication of this study is the apparent reproduction of organizational problems
at a network level. Network approaches are frequently touted as a “fix-all” solution for
organizations working in isolation (see Kania & Kramer, 2011), but unless organizations can
determine a way to improve their various limitations, they may only be replicating the same
problems across the network. This is demonstrated in the limitations Community Reach as a
network has with regards to its stakeholders, particularly in terms of reaching “external”
stakeholders.
Identifying and including stakeholders has shown to be a challenge for organizations
(Huxham & Vangen, 2000). These challenges become exponentially more difficult when
dealing with a network of dozens of organizations. Stakeholders represent many affiliations, and
125
although many of these were related to an occupation or an organization (for example, being a
high school teacher or working for a nonprofit), that was not always the case. Networks
comprised of organizations may have an easier time accounting for stakeholders affiliated with
individual organizations, but in the case of Community Reach, stakeholders not affiliated with
organizations – in particular, parents – were harder to identify and include. The fact that Parents
play a vital role in educational initiatives should be apparent – as stated by Scott, a nonprofit
representative, “At the end of the day, parents are the first teachers.” Yet they rarely came up in
interviews and appear not to be a major factor in survey results. The literature indicates that
clients are rarely seen as a strategic stakeholder group by nonprofit organizations (see Kilby,
2006), and this appears to be the case at a network level as well.
Although this study was designed particularly to reach underrepresented stakeholders,
such as Parents, locating them was still a problem, in part because neither Community Reach nor
most of its identified stakeholders seemed to see Parents as a part of the network. Parents, while
certainly affected by educational initiatives in their community, seemed an external, almost
peripheral stakeholder group. This is, at first glance, a bit disappointing. Although one would
expect clientele of some nonprofit networks to be somewhat diminished in their role, a network
geared to improving educational outcomes would hopefully see parents as a vital part of the
network’s initiatives. Of course, part of the problem could be that the stakeholder groups that
tended to be underrepresented – Early Childhood and Parents – do not tend to be particularly
organized entities on their own, and thus it is more difficult to identify these groups and
encourage them to participate. Regardless, it seems that the same difficulties organizations face
in including underrepresented stakeholder group is especially pronounced in a network.
126
In contrast to the more external stakeholders, there was also an internal group that
emerged – in particular, members of the three regional networks that initially funded and
convened Community Reach are well-represented across the study participants, and these
individuals participate more and perceive more benefits of their participation. This suggests an
“inner circle” or hierarchy within the network, showing that power in the form of decision-
making, resources or connections are not distributed across the network but rather limited to a
few insiders. Such insiders were heavily represented in the survey; Claire, a nonprofit leader
who was not particularly enthused about working with Community Reach, acknowledged that:
…I think people that are closer and closer to it will say a lot more positive things, too.
They'll know what's going on. I'm just not privy to all of those things. But again, those
are the things you want. You want the community privy to all of that. It makes them
owners and investors in what you're doing.
As Claire predicted, these insiders were largely positive about Community Reach as
reported in the survey results. Though it is not inherently problematic that stakeholders who are
invested in Community Reach are positive about it, it is concerning that there is a small group of
insiders who are primarily in charge and see few barriers to participation. These hierarchical
structures are commonly seen in individual organizations, and though network structures are
thought to enable a more even distribution of power or greater access to participation, that does
not appear to be the case in Community Reach.
Additionally, just as internal stakeholders, such as employees, at individual nonprofit
organizations typically differ from the clients they serve, most of the participants in Community
Reach differ from the community in which they operate. Community Reach insiders were
predominately white, wealthy, and educated, and in a region where approximately 70% of
residents do not have a college degree, 65.5% of survey participants indicated that they had done
postgraduate work. Of particular concern, however, is that so few of Community Reach’s
127
stakeholders have children in the local school system. Although one could surmise, based on the
ages of the participants, that many Community Reach insiders have children, only 36.2% of
survey participants indicated that they had children under the age of 24, and 12.1% indicated
their participation in the form of having a child in the local school system. Decision-makers in
Community Reach may be familiar with educational issues, but this knowledge comes from
other roles, and not from parenting children in the local school systems.
When it comes to individual organizations dedicated to a social mission, such
organizations are often criticized for their exclusion of external stakeholders, for hierarchical
structures, and for being different from the populations they serve. Although a network approach
theoretically provides the opportunity to add more diversity and a greater range of perspectives,
it seems that in Community Reach’s case, these same concerns present in individual
organizations are apparent across a large, multi-organizational network. However, such
challenges are readily understood as part of responding to a wicked problem.
Organizational collaboration in response to a wicked problem.
Network approaches are often demanded in response to a wicked problem. The case of
Community Reach revealed the realities of multi-organizational collaboration in response to a
wicked problem. In particular, this was evident in the difficulty of coordinating multi-county
sites, in the tension present between education and economic stakes, and in the power
differentials across stakeholder types.
Wicked problems, as described by Weber and Khademiam (2008) are unstructured,
cross-cutting, and relentless. Community Reach represented an effort to coordinate educational
goals across a 10-county region in a state that underperforms on educational standards. Only
9.5% of survey respondents said that they were more interested in their own county or town than
128
in Community Reach’s regional efforts, and 8.6% of survey participants said that Community
Reach meetings were too far away. These are not huge numbers, but they do suggest that the
regional approach presents challenges both in the logistics of attending meetings as well as the
potential for county bias. Although stakeholders recognized that the goal was important, they
also acknowledged in interviews that the multi-county nature of the network was challenging.
The region included a mid-size city as well as rural communities; on a practical level, some
stakeholders noted that it was difficult to get to the city for meetings or programs. However,
some stakeholders indicated that they felt left out or expressed a desire for Community Reach to
come more to their communities. Some also admitted that, although they understood the
importance of regional efforts, their loyalties were to their own respective communities, or that
they didn’t miss Community Reach’s presence. Mark, a superintendent, viewed his county’s
distance from the city in which Community Reach was headquartered as an excuse not to get
involved personally, though he admitted that they were also less likely to be a priority for
Community Reach.
We’re far enough away from [the city] that it’s – I don’t know, it’s tough for us to
connect with them in many ways. …I think the further you get away from the ring of
[the city] I think people are less involved. …I think they also see that people outside of
that immediate area maybe haven’t seen the benefit, and I think they’ve stopped trying to
impact us.
This interest in the prosperity of their own respective counties was in part connected to
the economic initiatives to the region, as the 10 counties were involved in a major campaign to
draw employers to the area. The efforts to spur economic development in the region were
closely tied to education in that residents realized that improved educational outcomes might lure
employers or keep businesses in the area, but these two stakes – education and economic
development – proved to be a somewhat uneasy pairing. The results from this case study suggest
129
that Economic Development stakeholders were more involved in some of the set-up and
maintenance of Community Reach, and the results from RQ1 and RQ2 indicate that people were
more likely to talk about educational issues with Economic Development stakeholders rather
than local educators. The fact that stakeholders appreciate the interconnectedness of economic
and educational interests is advantageous in helping others recognize the importance of
Community Reach and its efforts, but the dominance of Economic Development within the
network raises questions as to whether economic interests supersede educational interests among
network stakeholders. There are also questions as to whether education leads to economic
development or vice versa, as demonstrated by comments from these interviewees:
I think, somehow or other they had the data on the fact that [our region’s] per capita
income had been on a substantial downward trend for 20 years. Wherever they brought
that information out – I wish I could remember where I first saw that – was what made
me go, “Hmm, this is the answer that I need.” You know, you have to give people the
why. You have to explain why you’ve agreed to move on this endeavor. And that was
my why. We could dance around and say we need better education, but that was a cold,
hard fact. (Kirsten, Community Foundation)
…As a professional economic developer, I understand that today workforce development
is economic development and that education is the key part of workforce development.
…Our region – nine out of ten counties – we’re all in danger. (Julian, Economic
Development).
The quotes from these participants indicate that, although education and economic
development are closely tied together, it is unclear as to whether economic development is a
“gateway” issue for caring about education, or whether education is the key to improving the
region’s economic climate.
The dominance of Economic Development stakeholders within Community Reach also
points to another potential pitfall of multi-organizational collaboration in response to a wicked
problem: the presence of elitism among network stakeholders. The presence of so many white,
wealthy, and educated individuals in this sample suggests that Community Reach stakeholders
130
hold privileged places in this community, but moreover, power differentials are present in every
sub-grouping of organizations. The presence of Economic Development stakeholders has
already been noted, and these individuals – representing membership in regional networks,
ownership of local businesses – typically wielded more influence in Community Reach than
those not possessing Economic Development stakes. However, among those representing
Educational stakes, a power differential is also apparent, as educators at the University level
were more likely to participate and to see benefits of their participation than those representing
School Systems, or Early Childhood. Early Childhood stakeholders seemingly had less influence
than any of the other Educational stakeholders, as these individuals were frequently cited as
being interested in education and interested in working with others but not seen as a powerful
group or stakeholders who were sought out for input on educational issues or Community Reach.
Among nonprofits, Community Foundations were seen as less interested in educational issues
but more frequently named as powerful stakeholders than their social service counterparts.
Access to resources and the clientele they serve may better position Community Foundations for
more influence in these networks than traditional, service-driven nonprofits.
The challenges of coordinating efforts across counties, the competing tensions of various
stakes, and the emergence of elite stakeholder groups were present in Community Reach’s
approach to combating the “wicked” problem. As organizations work together towards
improving educational outcomes, however, it is possible that the organizations themselves are
changed, as seen in the next implication.
Reduced roles for traditional nonprofits.
Community Reach is a network comprised of approximately 100 organizations. As a
collaborative modeled after StriveTogether, the internal stakeholders value collective impact and
131
the survey results indicate that most stakeholders have bought into the network idea.
Approximately 1/3 of participants also claimed membership in one of the three large regional
networks – Umbrella Network, Project Network – and Convener Network – and among the
benefits of participating in Community Reach, the most commonly cited benefit was the idea that
networks can accomplish more than individuals (70.7%).
Nonprofits have been urged to adopt collective impact approaches (Kania & Kramer,
2011). This discussion has already suggested that the adoption of network approaches may not
necessarily eliminate the pitfalls of organizations working in isolation but instead may
experience these problems on a network scale, but as yet undiscussed is the suggestion that, in
network approaches, traditional social service nonprofits may be forced to play a reduced role.
Successful collective impact initiatives depend on data collection and measurement,
traditionally not strengths of service-driven nonprofit organizations. In addition to shared
measurement systems, collective impact initiatives require “backbone support” organizations and
significant financial resources (see Hanleybrown, Kania, & Kramer, 2012; Kania & Kramer,
2011). These suggest roles better suited to for-profit entities rather than traditional service-
driven nonprofits, and the prevalence of Economic Development stakes over traditional
Nonprofit interests in the Community Reach case study support this notion that network
approaches are better suited to the domain of businesses.
Although the list of stakeholders provided by Community Reach had slightly more
Nonprofit representatives and Educators than Economic Development stakeholders, Economic
Development stakes became more pronounced in each subsequent wave of data collection.
Purdy (2012) argued that nonprofits typically wield discursive power for the ability to be an
authority on an issue, but Nonprofits’ relatively weak showing in RQs 1 and 2 indicate that they
132
are less of a resource on educational issues than Economic Development stakeholders. Simply
put, Nonprofit representatives typically do not factor into the conversations as much as those
representing economic stakes.
The ways of participating and models of success suggested by Community Reach also
suggest a more business-like approach to network governance that may exclude or diminish the
roles of nonprofits. For example, receiving data or metrics on education was cited as a benefit of
participating in Community Reach by a full 50% of survey participants. However, Network
members were more likely than any other group to cite this as a benefit, and the suggestion that
this is a network value confirms the emphasis on data in collective impact work (see Kania &
Kramer, 2011). Said Kirsten, a nonprofit executive representing a Community Foundation:
“I think they’ve [Community Reach] been so concentrated on data gathering and I
haven’t seen much beyond that. I haven’t seen what the next step is supposed to be and I
haven’t heard what that step is supposed to be.”
Nonprofit representatives also were not as likely to attend meetings, which indicates that
these stakeholders miss out on a common way of participating in Community Reach. Attending
meetings was the second-most popular way of participating in the network, and the most
frequent attenders were members of other regional networks. In interviews, nonprofit
representatives expressed frustration with meetings. Claire noted that it was difficult to sustain
excitement for Community Reach because there was so much talking but little action: “But I can
see how they would go, "Another thing. Another meeting." That meeting was so exciting and
then nothing happens. It's more of that talk.” Purdy’s (2012) concerns that nonprofits may not
be able to participate in meetings as equal partners to their business counterparts seem evident
here, as the business practice of attending meetings may seem like a waste of time for those who
prefer to work with people. Such examples may include representatives from traditional social
133
services nonprofits, or perhaps teachers as well. Claire went on to recall how her funders
chastised her for not attending enough meetings, though it was not a favorite part of her job:
Years ago some of my key funders sat me down and said, "You're trying to help
everybody and you're never coming to the funding meetings." I'm like, "Well, I really
enjoy the front end work." "Yeah, but we're paying for your brain to come to our
meetings." So I do get that whole – people are motivated by where they are resourced.
But at the same time, that's not what some of this is about.
Should nonprofits be excluded from networks, however, they might continue to work in
the “isolated” fashion criticized by Kania and Kramer (2011). This was evidenced by Matthew,
a community foundation executive who admitted that, although networks had become very
popular in his community, he did not necessarily see the value of all of them:
… It’s nice to have it as a community-wide goal but I just don’t think that its existence is
going to change what that nonprofit does. They will continue to try to do the best they
can in the space that they work with …I’m just skeptical of what meaningful difference it
might make. If we achieve that goal, I think we would’ve achieved that goal with or
without the existence of Community Reach. That’s just my opinion.
The value on more business-like practices of data collection and frequent meetings may
seem counterintuitive to traditional social service nonprofits geared towards different kinds of
interventions. In missing meetings, nonprofits not only miss out on the opportunity to participate
in Community Reach, they also play a diminished role in the communicative work of the
network.
Communicative implications of participation in Community Reach.
Koschmann (2007) argued that organizational communication scholars could contribute
to the development of stakeholder research by emphasizing the role of communication. This
study suggests the importance of communication by highlighting the link between
communicative activity and stakeholder outcomes of participation.
The results for RQ7 indicate that it is communicative activity more so than any other type
of participation that leads stakeholders to feel committed to, common values with, trust in, or
134
satisfied with Community Reach. Attending meetings was a significant factor in participants’
experiencing commitment, common values, or satisfaction, and encouraging others to learn about
Community Reach was also significant in participants’ experiencing all four outcomes. These
findings suggest that, more so than participating in decision-making or even in participating in
specific programs or activities, simply receiving information from the collaboration and telling
others about it are more likely to result in allegiance to the network. Several interview
participants noted they just wanted to know what Community Reach was doing and pass along
information to others:
I would say probably it would be nice if there was a greater awareness. I don't know the
right way or the best way to get more information across, but it seems like it's largely
based on higher people in the community. It doesn't always filter down, maybe. (Drew,
University educator)
I just need a little bit more direct messaging from them. What would they like the
message to be in this community? You tell me what you want it to be and I’ll do what I
can to spread the word so that we’re speaking the same language. You know what I’m
saying? (Kirsten, Community Foundation executive)
Given that several models of stakeholder participation include classifications of “non-
participation” or “tokenism” that do not encourage more meaningful stakeholder participation
(see Lewis, 2011; Arnstein, 1969), these findings may be discouraging in that simply knowing
what Community Reach is up to through attending meetings or telling others about the network
has more of an impact on these outcomes rather than participating in decision-making or actual
activities or programs. This is especially concerning due to the heavy presence of Economic
Development stakeholders and a lesser presence from Educators and Parents. Still, these
findings point to the importance of communicative activity as participation, and moreover, that
communicative participation is likely to lead to stakeholder outcomes. These also have practical
implications for networks that claim to want stakeholder participation but are unsure about how
135
to do so or reluctant to invite all stakeholders into decision-making. Holding meetings open to
all stakeholders and encouraging community members to tell others about Community Reach
may go a long way in building goodwill towards the network.
With that being said, it is worth noting that several interview participants representing
Nonprofits pointed out the need for including stakeholders in a meaningful way.
You have to sit down with people. You have to engage with them, partner with them,
and understand what their needs are. You don't just tell people what you're going to do
for them. It just doesn't work. You can't do that for social work. My clients – I don't go
into the community and say, "This is what we're going to do for you." No, "This is what
you can do for yourself. This is how we're going to work together to impact your
community." It's very disingenuous when you don't do that. And that holds true for the
lowest person in the socioeconomic scale to the highest person. I think somehow that
was forgotten for awhile. (Claire, Nonprofit leader)
I think to really have legitimate collaboration and cooperation you have to be engaged in
the process when decisions are made, otherwise what happens is you create a structure
that maybe fits the vision of someone who is on the outside looking in, but it doesn’t fit
across cultures, across ethnic groups, and across parts of the community. That’s why all
people who are actually making a difference in the community should be a part of it,
otherwise it’s just a big, big miss on maybe a group that could – if you don’t understand,
sometimes it can be very confusing, even when you’re doing the right thing. (Scott,
Nonprofit leader)
This research on stakeholder interests, relationships, participation and outcomes have
some implications for interorganizational collaboration – particularly networks comprised of
multiple organizational forms, as discussed thus far. However, these implications also further
contribute to the development of stakeholder theory, explored in the next section.
Contributions to Stakeholder Theory
Stakeholder theory, although popular for its concepts and practical implications among
managers, has also faced heavy criticism since its inception. This research’s usage of
stakeholder theory as a framework for a nonprofit collaborative network as well as an orientation
for quantitative work is somewhat unusual, but both the context and methods used suggest
136
several possible contributions to stakeholder theory. In this section, I review the criticisms of
stakeholder theory and argue that this research provides new theoretical developments by
emphasizing stakeholder engagement over stakeholder management, consideration of
stakeholder power structures within and across collaboration, and application of stakeholder
theory around a problem domain rather than a traditional organization-stakeholder relationship.
These contributions further inform the development of a model of stakeholder participation in
response to a wicked problem.
The literature review included a number of criticisms of stakeholder theory, suggesting
that the theory was not rigorous enough (see Lewis, 2007) or sufficiently empirical (Tevino &
Weaver, 1999). Reviews of stakeholder theory published roughly 10 and 25 years after
Freeman’s (1984) work indicated that key propositions in stakeholder theory had not been
empirically validated (Jones, 1995; Laplume, Sonpar, & Litz, 2008). Freeman (1984) argued
that conceptual rigor was more important than empirical validation, but the lack of empirical
development has frustrated scholars who find it insufficiently developed despite widespread
usage of its terms. Perhaps because of stakeholder theory’s limitations, many have sought to
combine it with other theoretical approaches (see Bouckaert & Vandenhove, 1998; Cots, 2011;
Jenson & Sandström, 2011; Jones & Wicks, 1999; Knox & Gruar, 2007; Mitchell, Agle, &
Wood, 1997; Ryan & Schneider, 2003; Van Puyvelde, Caers, Du Bois, & Jegers, 2011).
However, despite these attempts to revise or revitalize stakeholder theory, theoretical
developments have been largely stagnant; the dismal assessment from Laplume, Sonpar, and Litz
(2008) is that stakeholder theory has “plateaued.” In the hopes of moving stakeholder theory
forward, I use findings from this study to suggest three potential contributions as well as areas of
development for future stakeholder research.
137
Stakeholder engagement versus stakeholder management.
The first area of development for stakeholder theory is the idea that stakeholder
engagement, rather than stakeholder management, leads to specific outcomes. Typically,
stakeholder research focuses on the leaders or organizational insiders (Friedman & Miles, 2002)
and offers suggestions for these organizational leaders can manage stakeholders. This study’s
findings, which draw from leaders and non-leaders, as well as influential stakeholders and those
somewhat peripheral to the network, finds that rather than how managers respond to
stakeholders, it’s stakeholder participation that result in these outcomes.
Stakeholder management is described as the maintenance and improvement of
relationships with stakeholders (Smudde & Courtright, 2011), and although leaders play an
important role in stakeholder relationships, most of the stakeholder literature remains fixated on
what organizational leaders can do to manage stakeholders (see Mitchell, Agle, & Wood, 1997).
Even within different contexts, such as nonprofit organizations, or with studies that consider
more than one kind of stakeholder, the literature typically takes a managerial approach by
looking at how organizational leaders respond to stakeholders (see LeRoux, 2009). Stakeholder
participation may also be seen as contingent solely on managers’ invitations to get involved.
This research suggests that stakeholder engagement, not management, holds the key to
outcomes. Proponents of stakeholder theory argue that stakeholder relationships should lead to
organizational outcomes (see Freeman, 1984; Laplume, Sonpar, & Litz, 2008), which may
include a competitive advantage (see Jones; 1995; Freeman, 1984) and organizational
effectiveness (see Koschmann, 2007; Balser & McCluskey, 2005). The outcomes referred to in
stakeholder research typically refer to outcomes at an organizational level. This study differs
from much of the previous stakeholder research by focusing on outcomes of participation at a
138
stakeholder level. Although there is still much to be learned about stakeholder management – as
well as outcomes of stakeholder participation on an organizational or systems level – this study
suggests greater consideration of the role of stakeholder engagement in future stakeholder
research.
Part stakeholder engagement is of communication. Previously, communication only
factors into stakeholder research by way of organizational recommendations for managing
stakeholders (Koschman, 2007), though recent work has stressed the communication present in
stakeholder participation. Specifically, Lewis (2011) noted that soliciting input, participation in
decision-making, empowerment, positive climate, feedback, upward communication, and voice
may all be construed to refer to stakeholder participation, and Bruce and Shelley (2010) argued
that stakeholder engagement is communication. This study revealed the importance of
communicative activity such as attending meetings and telling others about the network in
influencing stakeholders’ attitudes toward the collaboration. These findings point to the
importance of communication by not only highlighting the importance of messages exchanged
between an organization and its stakeholders as is often the case in previous research, but
interactions between stakeholders.
The forms of participation described in this study, whether communicative activities or
not, also indicate activities that stakeholders may engage in on their own. Although one
typically assumes that stakeholders must be invited to participate, some forms of participation
named in interviews and measured surveys – for example, inviting Community Reach to their
communities or telling others about Community Reach – are forms of participation that
stakeholders can engage in without invitations from a focal organization or organizational leader.
Future work in stakeholder research should continue to develop not only diverse stakeholder
139
perspectives, but to explore how stakeholder participation leads to outcomes at stakeholder,
organizational, and systems levels rather than how stakeholders are managed.
The focus on stakeholder engagement rather than stakeholder management may be seen
as a welcome development by those who champion the normative components of stakeholder
theory or argue for greater consideration of non-managerial stakeholders. A stakeholder
engagement orientation does allow for greater focus on a greater diversity of stakeholders, but, as
seen in the next contribution, resolving the power differentials present among stakeholders
remains a concern.
Challenging the normative components of stakeholder theory in collaboration.
Stakeholder theory has been touted as a moral or ethical theory – and sometimes
criticized by management scholars as being too lofty to be of any good. Power in stakeholder
theory and research is largely presumed present in the focal organization, with stakeholders
having less power in relation to the organization. Stakeholder theory has been suggested as a
response to organizational power. However, despite the moral high ground supposedly present
in stakeholder theory and stakeholder research, this dissertation suggests that power differences
persist and are evident in the stakes represented and how stakeholders are identified by others,
stakeholder relationships, stakeholder participation, and the outcomes of that participation, and
that these power differences may be particularly evident in collaborative contexts.
Stakeholder inclusion seems like an appealing idea, but critics of stakeholders say that
managers cannot treat all stakeholders equally, nor can all stakeholders be considered (see Jensen
& Sandström, 2011; Sternberg, 2002). These criticisms have largely been within management
and pertaining to stakeholder theory’s application within a corporate context, but the ethical
influence has been inherent in stakeholder theory from its beginning. Donaldson and Preston
140
(1995) identify a normative approach as one of the three theoretical components that comprise
stakeholder theory; the authors fixated primarily on the normative approach as the “core” of
stakeholder theory. However, in recent years, scholars claim that the normative components
receive too much attention in stakeholder approaches (see Hasnas, 2012; Jensen & Sandström,
2011; Laplume, Sonpar, & Litz, 2008).
This research situates stakeholder theory within a nonprofit collective network in which
the very values of the network are to invite stakeholder participation, and the findings suggest
that values inherent in stakeholder theory are difficult to practice. Such power differentials may
not be due to willful or strategic managerial concerns, however. This research suggests that
interorganizational collaboration may in fact exacerbate power differences between stakeholders
because of the capacity required to participate.
Capacity has long been a concern for nonprofit organizations, which may have fewer
staff and yet maintain heavy workloads in comparison to for-profit or public organizations
(Light, 2002). This is somewhat problematic for the organizations that may find themselves less
in the habit of organizing, for those who have fewer resources, or for organizations that are
perceived as lesser status. Such divides were present in the structure of Community Reach, in
which Network Members participated to a greater extent and perceived more benefits of
participation than non-network members. This may also echo concerns about the stakeholders
constructing collaborative domains to their advantage (Hardy & Phillips, 2008). However, these
differences were also revealed across other stakes; for example, Early Childhood Educators were
marginalized compared to their University or K-12 School System counterparts, and, compared
to Community Foundations, Nonprofit representatives from a traditional social service sector
were regarded as less powerful. Parents, who do not have a larger organizational affiliation, are
141
also largely peripheral in this network. The minimal influence of these groups seems less to do
with Community Reach’s intention to leave them out – after all, the StriveTogether model
stresses the importance of stakeholder involvement and coordination across sectors – and more
to do with the structures of the organizations present in the collaboration.
This may be problematic not only for those who see stakeholder theory as a remedy for
disproportionate power relationships in organizations as well as for those that encourage
collaboration or network approaches, which are thought to allow access to different perspectives,
build systems knowledge, and coordinate resources (Scearce, 2011). This study suggests that,
despite network attempts to be inclusive, organizations are limited by the capacities of their
organizational structures – or, in the case of Parents, their lack of organizational structures. Such
limitations echo findings from previous researchers such as Purdy (2012) who found that
stakeholder participation in collaboration may rely on perceptions of power as well as
organizational limitations, such as the ability to maintain a presence at meetings.
Disenfranchised stakeholders may have other ways of exerting their influence; stakeholder
relationships may be an area for further exploration of power in stakeholder research. The
relationships revealed in this study indicate that more powerful groups report more relationships
and thus experience more centrality in the network. Nowell (2009) suggested that stakeholder
relationships should be regarded as a type of capacity that can influence the collaboration;
although it is naïve to suggest that it is easy to build more relationships across stakes, this may be
a more feasible way for marginalized groups to try to build capacity.
Although critics have suggested that stakeholder theory has too much of a normative
bent, this study finds that, even in a non-corporate context, power dynamics emerge between
stakeholders that challenge participation. The power differentials evident in this study are not
142
between focal organizations and stakeholders as is typically assumed in stakeholder research, but
between stakes that run across different organizations and organizational sub-fields. Such
differences suggest the importance of studying stakes as exercised on a larger scale than is
typically considered in organizational stakeholder research.
Stakes in a problem domain.
This research adds to stakeholder theory by expanding on scholars’ understanding of the
applicability of the theory. Scholars have previously made the case for considering stakeholder
theory in different contexts; this study has placed stakeholder theory in a nonprofit, collaborative
context that reveals a number of organizational forms, relationships, and overlapping stakes. Too
often, stakeholder theory has been applied in corporate settings. This likely stems from
Donaldson and Preston’s (1995) assertion that stakeholder theory is a theory of corporations,
though others have more recently suggested that stakeholder theory may be applied in a variety
of organizational contexts, including nonprofit (Freeman et al., 2010; Philips, Freeman, &
Wicks, 2003). This research considers stakeholder theory in the context of nonprofit
collaborative network, and in doing so, expands stakeholder theory by exploring stakes within a
problem domain rather than simply between a focal organization and individual stakeholder
groups as has often been the case in stakeholder research.
A common criticism of stakeholder research is that stakeholder relationships are largely
seen as existing between a focal organization and groups of stakeholders. Freeman (1984)
depicted organization-stakeholders as a hub and spoke model; individual organizations are seen
as the “centerpiece of theorizing” (Gray & Wood, 1991) and collaboration research typically
focuses on a target organization (Butterfield, Reed, & Lemak, 2004). Even pieces that focus on
stakeholder relationships still assume a focal organization; Rowley’s (1997) work is heavily cited
143
because it deals with stakeholder relationships, but his propositions consider the impact of
stakeholder relationships on a focal organization. The idea of large-scale problems that require
include multiple organizations as well as representation of many interests across a problem
domain is a familiar concept in organizational research (see Chevalier, 1966; Selsky & Parker,
2005; Trist, 1983; Weber & Khademiam, 2008). Exploration of a problem domain rather than an
individual organization enables study of stakeholders at individual, organizational, and systems
levels.
Another oft-cited concern within stakeholder research is that Freeman’s (1984) definition
of stakeholder is too broad, and considerable scholarly work has been done to further classify
and break down these groups (see Brickson, 2007; Clarkson, 1995; Lewis, 2001; Phillips,
Freeman, & Wicks, 2003). However, even with the myriad of stakeholder classification systems,
stakeholder identification remains a challenge and often provides a challenge to stakeholder
research. Stakeholder identification within collaboration becomes nearly impossible due to the
sheer number of stakeholders and stakeholder affiliations (see Huxham & Vangen, 2000;
Keyton, Ford, & Smith, 2008). Too often, stakeholder research gets caught in arguments over
whether stakeholders can be identified (Barringer & Harrison, 2000). Studying
interorganizational collaboration or networks are a means of exploring stakeholder relationships
beyond those with a focal organization. Emphasizing stakes represented within a problem
domain over determining which stakeholders also provides some helpful further directions for
stakeholder theory.
This research suggests that stakes inform stakeholder relationships as well as how
stakeholders perceive and participate in organizational or collaborative activity. This is
particularly useful for looking at wicked problems such as improving educational outcomes in
144
which anyone is conceivably a stakeholder. However, this research also suggests that stakes may
be more varied than anticipated, and that even coalescing around a wicked problem may be more
difficult than initially thought.
Previous collaboration research, although it allows for a diversity of stakeholders, seems
to assume a common problem (Gray, 1985; Gray & Wood, 1991; Wood & Gray, 1991). In this
study, improving educational outcomes is the reason for convening Community Reach, but
stakeholders had very different understandings of the problem as evidenced by the tension
between economic and educational stakes. A wicked problem – even one such as education that
has wide appeal across different populations – does not necessarily create a unifying force for
collaboration, but instead provides opportunities for groups to assert different stakes that may
shape participation, and ultimately, outcomes of the collaboration.
Emphasis on the exercise of stakes in a problem domain rather than the responses of a
focal organization to individual stakeholders represents a departure for stakeholder theory
research, as does the emphasis on stakeholder engagement over stakeholder management and
reconsideration of the normative components of stakeholder theory as demonstrated within a
collaboration. Further development of these may ideas help stakeholder theory move beyond its
stagnation.
In addition, this study has provided a response to several pre-existing calls for further
work in stakeholder theory. Suggested areas of further research and theoretical development
have included stakeholder interaction effects, stakeholder relationships over time, the
development of stakeholder metrics (Freeman et al., 2010), and operationalization of stakeholder
outcomes such as commitment and other behavioral variables (Ansell & Gash, 2007). Several
have made the case for considering other perspectives besides employees in stakeholder research
145
(Freeman et al., 2010; Friedman & Miles, 2002); reliance on one stakeholder perspective has
also been the norm in collaboration research (Lewis, 2006) and has resulted in less knowledge
about how other stakeholders experience collaboration (Butterfield, Reed, & Lemak, 2006). This
study included multiple stakeholder perspectives across a diverse, multi-organizational
collaborative network in an exploration of stakeholder relationships, stakeholder participation,
and stakeholder outcomes. The findings here suggest a new model of stakeholder participation.
Model of Stakeholder Participation in Response to a Wicked Problem
As previously mentioned, there is no one accepted understanding of stakeholder
participation (Green & Hunton-Clarke, 2003), though there are models that exist for different
contexts. This suggested model for stakeholder participation is in context of a wicked problem,
wherein stakes lead to relationships, benefits, barriers, which in turn lead to specific types of
participation, which then result in specific outcomes.
This does not include rungs or tiers of participation as present in other models (see
Arnstein, 1968; Lewis, 2011) or suggest that stakeholders can work their way up to more ideal
forms of participating. Rather, this model takes a more descriptive approach to explore how
stakeholders participate in response to a problem domain. This also differs from Wandersman’s
(1979) conceptual framework of participation parameters; though Wandersman did include
participant types, participation type, and participation techniques in his model and account for
outcomes. The presence of relationships as discussed here is an addition to previous models of
stakeholder participation as well as addresses the need for consideration of relationships in
stakeholder research (see Rowley, 1997).
Such a model doesn’t fully eliminate or rule out stakeholder management aspects, nor
does the model pressure stakeholders to articulate or assert stakes in opposition to an
146
organizational force. Previous research suggests that even when invited to participate in
collaboration, not all stakeholders choose to do so (Leach, Pelkey, & Sabatier, 2002), and
previous research also suggests that there may be difficulties in reaching stakeholders because of
communication differences or difficulties (Medved et al., 2001) or that “disadvantaged”
stakeholders may lack the ability to participate (see Watson & Foster-Fishman, 2012). But rather
than focusing on stakeholder types or managerial action as is often the case in stakeholder
research, this model suggests that the presence of a wicked problem prompts individuals to
assume specific interests or stakes, and that these stakes in turn lead them to form relationships,
to perceive different benefits or barriers to their participation, and to participate in different ways
that ultimately affect outcomes. The example of Community Reach revealed a variety of stakes
that were influential in whom they communicated with in terms of improving educational
outcomes in their community. These stakes also influenced the perceptions of the network; in
this case, stakes had a significant impact on perceived benefits to participation in Community
Reach. Stakes also influenced the types of participation in the network, and these forms of
participation, from providing financial support to attending meetings to telling others about
Community Reach. Outcomes in this study were at the stakeholder level, as Community Reach
has not been in existence long enough to study further impacts. However, some of the perceived
benefits named by participants in this study – for example, that one’s organization was better
known as a result of participating in Community Reach, or that educational outcomes were
improving in the community – hint at eventual potential outcomes at an organizational or
systems level.
In this model, the boundary is the problem domain. Stakes – or the claims or interests in
the problem – are represented as informing relationships as well as perceived benefits and
147
barriers of participating in the collaboration. This seeks to build on previous research in which
more attention has been given to identifying individual stakeholders as opposed to determining
the interests they represent. This may be a more practical starting point for collaboration around
a wicked problem, in which it may be impossible to identify every individual who can affect or is
affected by the problem. Instead, it may be more realistic – and perhaps more helpful – to
identify the interests in the problem. This also allows for the fact that individual stakeholders
may represent several stakes or interests.
The arrows in the model suggest that, although stakes lead to relationships as well as
influence perceived benefits of or barriers to participating in the collaboration, the nature of
stakeholder participation may also influence these perceptions as well as stakeholder
relationships. Participation may inform benefits or barriers to participation as stakeholders
become encouraged or discouraged about their participation. Likewise, relationships and
participation influence each other, as relationships may lead to specific types of participation, but
participation also may enable stakeholders to meet other stakeholders, thus leading to new
relationships. The emphasis on relationships and participation also place communication in a
central role.
This allows for some of flexibility discussed by previous researchers – for example,
Lewis (2011) talked about the interdependence of stakeholders as existing in sequential or
reciprocal forms – while not prescribing stakeholder actions or that all stakeholder input is equal.
This also fits with previous research that suggests not all stakeholders should be treated equally
due to differences in stakeholder contributions (Philips, Freeman, & Wicks, 2003) as well as the
research described here, in which collaboration may exacerbate differentials between
stakeholders. Further testing of this model is necessary, as described in next sections.
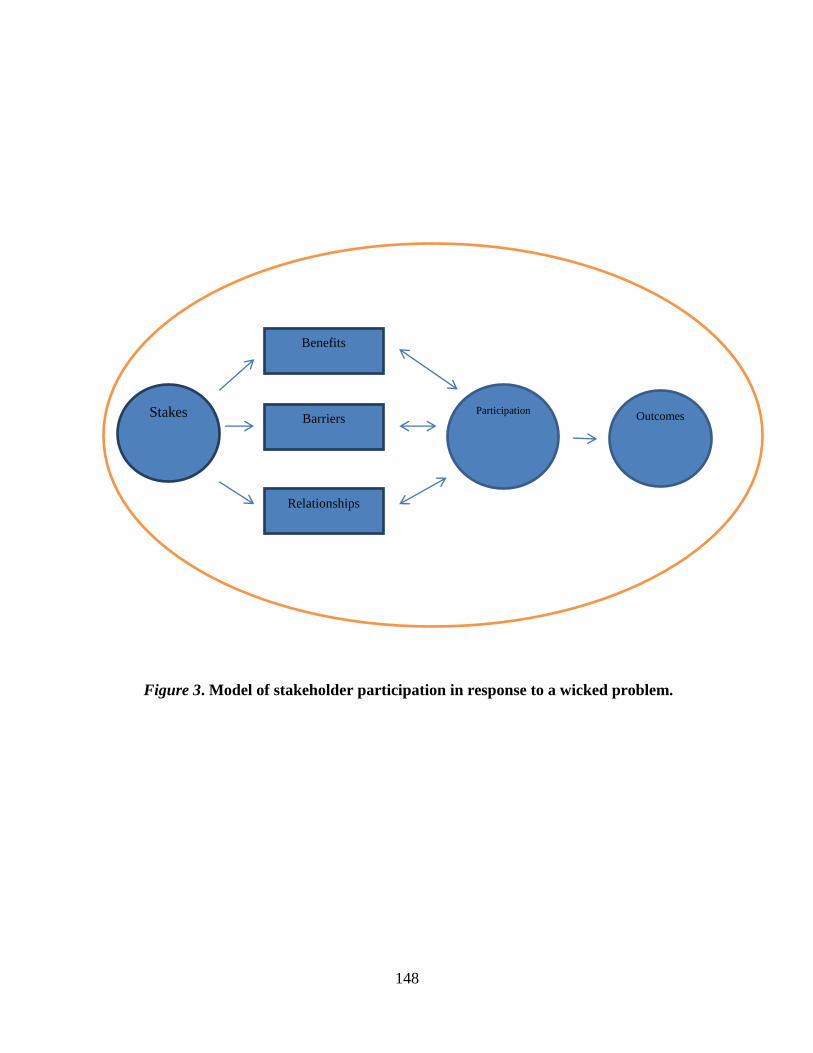
148
Figure 3. Model of stakeholder participation in response to a wicked problem.
Stakes Participation Outcomes
Benefits
Barriers
Relationships
149
Limitations
There are several limitations for this study, including concerns regarding the
methodology, measures, and sample in this study. First, the methodology poses some
limitations. The focus on Community Reach prompts concerns about generalizability, and
further testing is needed to determine whether these findings are applicable to other
organizations (see Hardy, Phillips, & Lawrence, 2003). Interview data in this case led to the
development of survey categories, which suggests that the survey findings may not be
generalizable to other networks.
Second, the measures used suggest some limitations. As few stakeholder constructs have
been empirically validated (see Laplume, Sonpar, & Litz, 2008), there are not pre-existing, valid
instruments that can be used to evaluate stakeholder participation in nonprofit collaboration.
Collecting network data for a stakeholder group of this size is problematic (see Rowley &
Moldeveanu, 2003, for a discussion of difficulties in collecting network data from stakeholders)
and performance data using stakeholder theory has thus far been problematic in terms of low
explained variance and unpredictable statistical results (see Dalton, Daily, Ellstrand, & Johnson,
1998; Gerde, 2000; Hillman, Keim, & Luce, 2001; in Gazley, Chang, & Bingham, 2010).
Questions may also persist about the choice of Hallahan’s (2008) constructs, derived from
measures of relationship quality used in public relations research. This study, using interviews to
create survey responses, is a first step towards creating measures of stakeholder outcomes of
participation in a network, but more data is needed to further test and develop further measures.
Third, the sample of this study presents obvious limitations. While organizational studies
typically include the perspectives of employees as the sole stakeholders, this is understandable as
these perspectives are the easiest to obtain. In attempting to reach other types of stakeholders,
150
numerous challenges arise. It is impossible to identify and include all stakeholders across the
network; stakeholders may or may not identify themselves as such, organizations may not be
able – or willing – to identify all stakeholders, and stakeholders themselves may of varying
levels of competency and interest pertaining to the collaboration. This study sought to include
underrepresented stakeholder perspectives and thus add to builds on the oft-repeated, but rarely
realized, call to include other stakeholder types. With that being said, many of the stakeholders
surveyed here appear to be “internal” stakeholders in that they have other network affiliations
that led them to be familiar with Community Reach though they may not necessarily work for
the network itself. Additionally, more testing is needed to determine whether the dominance of
Economic Development stakeholders in terms of relationships and forms of participation
reported is as much of an effect or rather reflective of a greater number of Economic
Development stakeholders who filled out the survey. That Economic Development stakeholders
play a significant role in convening and sustaining Community Reach is documented, but less is
known about those named stakeholders who did not choose to fill out the survey. These
limitations also suggest future directions for further research.
Directions for Further Research
The limitations of this study suggest several directions for future research. First, this
study has focused primarily on the results of stakeholder type on different forms of participation,
and how various forms of stakeholder participation impact stakeholder outcomes. Data in this
study to suggests stakeholder relationships, but a logical next step would be to explore the impact
of stakeholder communication on stakeholder participation and the impact stakeholder
communication on stakeholder outcomes. Although collecting data for large stakeholder
151
networks is challenging, such studies provide opportunity for communication scholars to further
understand the role of communication in large-scale inter-organizational collaborations.
Additional quantitative work will also help in developing more robust measures of
stakeholder participation. Stakeholder theory, as has been discussed, holds many interesting
ideas but is relatively underdeveloped. For stakeholder theory to continue to develop, additional
studies are needed to further develop and test constructs of stakeholder participation and
stakeholder communication.
Future research will also do well to explore the outcomes at a systems level. This study
has focused on individual stakeholders in an effort to include underrepresented stakeholders, and,
as Community Reach has only been in existence a short period of time, this work reflects
outcomes of participation on a stakeholder level. However, Community Reach is a collective
impact effort that aims to enact drastic regional changes over the next decade. Additional
research may include not only outcomes of participation for the stakeholder, but outcomes of
stakeholder participation at the network level.
Finally, future research would also do well to include stakeholder perspectives across
different types of collaboration. Community Reach represents a network focused on improving
educational outcomes, but as network approaches to wicked problems become more
commonplace, there will be additional contexts for exploring stakeholder participation. These
research directions would enable the further development and testing of the model of stakeholder
participation in response to a wicked problem.
152
Conclusion
Wicked problems often prompt an interorganizational response. In particular, nonprofit
organizations, motivated to achieve a social good and hindered by limited resources, are
encouraged to collaborate with other organizations. Collective impact models or network
approaches include nonprofit organizations and other partners from business and civic
organizations to mount a systems-level response.
Despite the promise of such approaches, collaboration across different sectors and
organizations proves challenging. In particular, the size and scope of collaborative networks
render it difficult to identify all individuals with a stake in the issue. Stakeholder theory
provided the framework for this research. Limitations of stakeholder theory include an over-
emphasis on corporate contexts involving a singular focal organization as well as an over-
reliance on internal stakeholders, such as employees. In addition, stakeholder theory has not
sufficiently developed to a point where stakeholder participation or stakeholder outcomes of
participation can be measured. This research suggests that stakeholder theory could be further
developed in the context of a nonprofit collaborative network and through exploration of diverse
stakeholder participation within the network.
This study focused on stakeholder participation in Community Reach, a 10-county,
interorganizational effort to improve educational outcomes. This study included research
questions pertaining to stakeholder relationships, stakes represented in a nonprofit collaborative
network, stakeholder participation, differences in stakeholder participation as well as perceived
benefits and barriers to participation, and stakeholder outcomes based on participation.
The research revealed 10 categories of stakes. Among these stakes, Economic
Development, Network membership, and Volunteers (comprised heavily of Network members)
153
reported a greater number of relationships within Community Reach. Network members and
Volunteers were also more likely to participate in Community Reach, as well as perceive more
benefits to participating in the collaboration.
The dominance of economic development in the network seemingly relegated education
to a lesser role within the collaboration. Among educators, status differences were evident, as
University educators were more likely to participate in Community Reach and perceive benefits
of their participation than School Systems or Early Childhood educators. In particular, Early
Childhood had a diminished role within the network. A similarly marginalized group was
Parents, evident not only in the frequency with which Parents were named as a stake, but in the
demographic data that suggested most of the players in Community Reach did not have children
in the local school system.
Regression models predicted outcomes based on stakeholder participation; somewhat
surprisingly, more “engaged” ways of participating such as participating in decision-making or
in specific activities or programs were not significant in determining stakeholder commitment,
common values, trust, or satisfaction with Community Reach. Instead, attending meetings and
telling others about Community Reach were found to be predictors of stakeholder outcomes,
suggesting the importance of communicative activity within the network.
These findings have several implications for collaborative networks. The research
suggests that rather than improving on organizational problems at a network level, problems such
as stakeholder identification and unequal distribution of power were replicated across a network
level. The study revealed realities of multi-organizational collaboration in response to a
“wicked” problem of improving educational outcomes by exposing the difficulty of coordinating
collaborative work across a regional site, tensions between education and economic
154
development, and the presence of elitism across organizational levels. Traditional and new
organizational forms were explored in terms of how they may exist in collective impact or
network approaches. These findings suggest that as collective impact networks become more
popular forms of collaboration, traditional nonprofits will lose ground due to the business-
friendly practices used to convene and sustain a network. The outcomes of stakeholder
participation also highlight communicative impacts of relationships within the network,
suggesting that keeping stakeholders informed about the network and encouraging them to talk
to others leads to outcomes such as commitment, common values, trust, and satisfaction with the
organizational network.
Finally, these findings suggest some further developments for stakeholder theory. This
research first suggests that stakeholder engagement, not stakeholder management, leads to
outcomes. Second, the study finds that despite the normative core of stakeholder theory,
interorganizational collaboration may exacerbate power differences between stakeholders.
Third, the exploration of stakes in response to a social problem in this research suggests new
theoretical directions by focusing on diverse stakeholders in a problem domain rather than
relationships between a focal organization and individual stakeholders. A model of stakeholder
participation in response to a wicked problem is suggested as a future area of development, in
which stakes lead to relationships, benefits, and barriers to participation. These factors influence
– and are influenced by – various forms of stakeholder participation, which lead to outcomes on
an individual, organizational, or systems level.
Community Reach, still in its early stages, has many years to achieve its goals. In the
meantime, the StriveTogether model – and others similar to it – is replicated across the country.
Nonprofit collaborative networks are changing the ways in which organizations respond to

155
wicked problems, as well as changing the organizations themselves. Less certain is to what
extent networks can affect the wicked problem, and to what role different stakeholders will play
in the process.
156
REFERENCES
Aaker, J. L & Akutsu, S. (2009). Why do people give? The role of identity in giving. Journal of
Consumer Psychology, 19, 267-270.
Abzug, R. & Webb, N. J. (1999). Relationships between nonprofit and for-profit organizations:
A stakeholder perspective. Nonprofit and Voluntary Sector Quarterly, 28(4), 416-431.
doi: 10.1177/0899764099284003
Ahuja, G. (2000). Collaboration networks, structural holes, and innovation: A longitudinal study.
Administrative Science Quarterly, 45(3), 425-455. doi: 10.2307/2667105
Anheier, H. K. (2005). Nonprofit organizations: Theory, management, policy. London, UK:
Routledge.
Ansell, C., & Gash, A. (2008). Collaborative governance in theory and practice. Journal of
Public Administration Research and Theory, 18(4), 543-571.
Antonacopoulou, E., & Meric, J. (2005). From power to knowledge relationships: Stakeholder
interactions as learning partnerships. Stakeholder Theory. A European Perspective, 125-
147.
Arenas, D., Lozano, J. M., & Albareda, L. (2009). The role of NGOs in CSR: Mutual perceptions
among stakeholders. Journal of Business Ethics, 88(1), 175-197. doi: 10.1007/s10551-
009-0109-x
Arino, A., & De La Torre, J. (1998). Learning from failure: Towards an evolutionary model of
collaborative ventures. Organization Science, 9(3), 306-325.
157
Arnstein, S. R. (1969). A ladder of citizen participation. Journal of the American Institute of
Planners, 35(4), 216-224. doi: 10.1080/01944366908977225
Arya, B., & Lin, Z. (2007). Understanding collaboration outcomes from an extended resource
based view perspective: The roles of organizational characteristics, partner attributes, and
network structures. Journal of Management, 33(5), 697-723. doi:
10.1177/0149206307305561
Atler, C., & Hage, J. (1993). Organizations working together. Newbury Park, CA: Sage.
Atouba, Y., & Shumate, M. (2010). Interorganizational networking patterns among development
organizations. Journal of Communication, 60, 293-317. doi: 10.1111/j.1460-
2466.2010.01483.x
Austin, J. E. (2000). Strategic collaboration between nonprofits and usiness. Nonprofit and
Voluntary Sector Quarterly, 29(suppl 1), 69-97. doi: 10.1177/089976400773746346
Babiak, K., & Thibault, L. (2009). Challenges in multiple cross-sector partnerships. Nonprofit
and Voluntary Sector Quarterly, 38(1), 117-143. doi: 10.1177/0899764008316054
Bailey, D., & Koney, E. M. (1996). Interorganizational community-based collaboratives: A
strategic response to shape the social work agenda. Social Work, 41(6), 602-611.
Balser, D., & McClusky, J. (2005). Managing stakeholder relationships and nonprofit
organization effectiveness. Nonprofit Management and Leadership, 15(3), 295-315.
doi: 10.1002/nml.70
Barringer, B. R., & Harrison, J. S. (2000). Walking a tightrope: Creating value through
interorganizational relationships. Journal of Management, 26(3), 367-403. doi:
10.1177/014920630002600302
158
Benjamin, L. M. (2008). Account space: How accountability requirements shape nonprofit
practice. Nonprofit and Voluntary Sector Quarterly, 37(2), 201-223. doi:
10.1177/0899764007301288
Ben-Ner, A., & Van Hoomissen, T. (1991). Nonprofits in the mixed economy: A demand and
supply analysis. Annals of Public and Cooperative Economics, 62, 519-550.
Borgatti, S. P., Everett, M. G. and Freeman, L. C. 2002. Ucinet 6 for Windows: Software for
Social Network Analysis. Harvard, MA: Analytic Technologies.
Borgatti, S. P., & Foster, P. C. (2003). The network paradigm in organizational research: A
review and typology. Journal of Management, 29(6), 991-1013. doi: 10.1016/s0149-
2063_03_00087-4
Bouckaert, L., & Vandenhove, J. (1998). Business ethics and the management of non-profit
institutions. Journal of Business Ethics, 17(9), 1073-1081.
doi:10.1023/A:1006071416514
Breeze, B., & Dean, J. (2012). Pictures of me: User views on their representation in
homelessness fundraising appeals. International Journal of Nonprofit and Voluntary
Sector Marketing, 17(2), 132-143. doi: 10.1002/nvsm.1417
Brickson, S. L. (2007). Organizational identity orientation: The genesis of the role of the firm
and distinct forms of social value. Academy of Management Review, 32(3), 864-888. doi:
10.5465/AMR.2007.25275679
Brown, L. D., & Moore, M. H. (2001). Accountability, strategy, and international
nongovernmental Organizations. Nonprofit and Voluntary Sector Quarterly, 30(3), 569-
587. doi: 10.1177/0899764001303012
159
Browning, L. D., Beyer, J. M., & Shetler, J. C. (1995). Building cooperation in a competitive
industry: SEMATECH and the semiconductor industry. The Academy of Management
Journal, 38(1), 113-151.
Bruce, P., & Shelley, R. (2010). Assessing stakeholder engagement. Communication Journal of
New Zealand, 11(2), 30-48.
Burchell, J., & Cook, J. (2008). Stakeholder dialogue and organisational learning: Changing
relationships between companies and NGOs. Business Ethics: A European Review, 17(1),
35-46. doi: 10.1111/j.1467-8608.2008.00518.x
Butterfield, K. D., Reed, R., & Lemak, D. J. (2004). An inductive model of collaboration from
the stakeholder’s perspective. Business & Society, 43(2), 162-195. doi:
10.1177/0007650304265956
Cairns, B., & Harris, M. (2011). Local cross-sector partnerships: Tackling the challenges
collaboratively. Nonprofit Management and Leadership, 21(3), 311--324. doi:
10.1002/nml.20027
Charmaz, K. (2006). Constructing grounded theory: A practical guide through qualitative
analysis. Sage Publications Limited.
Chevalier, M. (1966). A wider range of perspectives in the bureaucratic structure. Ottawa:
Commission on Bilingualism and Biculturalism.
Christensen, R. A., & Ebrahim, A. (2006). How does accountability affect mission? The case of
a nonprofit serving immigrants and refugees. Nonprofit Management & Leadership,
17(2), 195-209.
160
Clarkson, M. E. (1995). A stakeholder framework for analyzing and evaluating corporate social
performance. Academy of Management Review, 20(1), 92-117. doi:
10.5465/AMR.1995.9503271994
Clary, E. G., & Snyder, M. (1999). The motivations to volunteer: Theoretical and practical
considerations. Current Directions in Psychological Science, 8(5), 156-159.
Cooper, K. R. (2013, November). Bona fide networks: Propositions for a new theory of
collaboration. Paper presented at annual conference of the National Communication
Association, Washington, DC.
Cooper, K. R., & Shumate, M. (2012). Interorganizational collaboration explored through the
bona fide network perspective. Management Communication Quarterly, 26(4), 623-654.
doi: 10.1177/0893318912462014
Cots, E. G. (2011). Stakeholder social capital: A new approach to stakeholder theory. Business
Ethics: A European Review, 20(4), 328-341. doi: 10.1111/j.1467-8608.2011.01635.x
Cotton, M., & Devine-Wright, P. (2012). Making electricity networks “visible”: Industry actor
representations of “publics” and public engagement in infrastructure planning. Public
Understanding of Science, 21(1), 17-35. doi: 10.1177/0963662510362658
Dalton, D. R., Daily, C. M., Ellstrand, A. E., & Johnson, J. L. (1998). Meta-analytic reviews of
board composition, leadership structure, and financial performance. Strategic
Management Journal, 19(3), 269–90.
Deetz, S. (1992). Democracy in the age of corporate colonization. New York: State University
of New York Press.
161
Donaldson, T., & Preston, L. E. (1995). The stakeholder theory of the corporation: Concepts,
evidence, and implication. Academy of Management Review, 20(1), 65-91.
Eade, D. (1997). Capacity-building: An approach to people-centered development. Oxford, UK:
Oxfam.
Ebrahim, A. (2005). Accountability myopia: Losing sight of organizational learning. Nonprofit
and Voluntary Sector Quarterly, 34(1), 56-87.
Edwards, M., & Hulme, D. (1996). Too close for comfort? The impact of official aid on
nongovernmental organizations. World Development, 24, 961-973.
Eesley, C., & Lenox, M. J. (2006). Firm responses to secondary stakeholder action. Strategic
Management Journal, 27(8), 765-781. doi: 10.1002/smj.536
Eschenfelder, B. E. (2007). Interagency collaboration and communication: Funders and service
providers working together to create a management service organization (Doctoral
dissertation). Retrieved from ProQuest. (3306840).
Eweje, G., & Palakshappa, N. (2009). Business partnerships with nonprofits: Working to solve
mutual problems in New Zealand. Corporate Social Responsibility and Environmental
Management, 16(6), 337-351. DOI: 10.1002/csr.192
Finkelstein, M. A. (2008). Predictors of volunteer time: The changing contributions of motive
fulfillment and role identity. Social Behavior and Personality, 36(10), 1353-1364.
Foster, M. K., & Meinhard, A. G. (2002). A regression model explaining predisposition to
collaborate. Nonprofit and Voluntary Sector Quarterly, 31(4), 549-564. doi:
10.1177/0899764002238100
162
Freeman, R. E. (1984). Strategic management: A stakeholder approach. Marshfield, MA:
Pitman.
Freeman, R. E., Harrison, J. S., Wicks, A. C., Parmar, B. L., & De Colle, S. (2010). Stakeholder
theory: The state of the art. Cambridge University Press.
Friedman, A. L., & Miles, S. (2002). Developing stakeholder theory. Journal of Management
Studies, 39(1), 1-21. doi: 10.1111/1467-6486.00280
Frooman, J., & Murrell, A. J. (2005). Stakeholder influence strategies: The roles of structural and
demographic determinants. Business & Society, 44(1), 3-31. doi:
10.1177/0007650304273434
Frumkin, P. (2007). Strategic giving: The art and science of philanthropy. Chicago/London:
University of Chicago Press.
Galaskiewicz, J. (1985). Interorganizational relations. Annual Review of Sociology, 11, 281-304.
Galaskiewicz, J., & Bielefeld, W. (1998). Nonprofit organizations in an age of uncertainty: A
study of organizational change. Hawthorne, NY: Aldine.
Ganesh, S. (2009). 9 Discourses of Volunteerism. Communication Yearbook 33, Routledge.
Gazley, B. (2010). Linking collaborative capacity to performance measurement in government-
nonprofit partnerships. Nonprofit and Voluntary Sector Quarterly, 39(4), 653-673. doi:
10.1177/0899764009360823
Gazley, B., Chang, W. K., & Bingham, L. B. (2010). Board diversity, stakeholder representation,
and collaborative performance in community mediation centers. Public Administration
Review, 70(4), 610-620. doi: 10.1111/j.1540-6210.2010.02182.x
163
Gerde, V. W. (2000). Stakeholders and organization design: An empirical test of corporate social
performance. In J.K. Logsdon, D.J. Wood, and L.E. Benson (Eds.), Research in
Stakeholder Theory, 1997–1998: The Sloan Foundation Minigrant Project, (pp. 7–19).
Toronto: Clarkson Centre for Business Ethics, University of Toronto.
Gray, B. (1985). Conditions facilitating interorganizational collaboration. Human Relations,
38(10), 911-936. doi: 0.1177/001872678503801001
Gray, B., & Wood, D. J. (1991). Collaborative alliances: Moving from practice to theory. The
Journal of Applied Behavioral Science, 27(1), 3-22. doi: 10.1177/0021886391271001
Green, A. O., & Hunton‐Clarke, L. (2003). A typology of stakeholder participation for company
environmental decision‐making. Business Strategy and the Environment, 12(5), 292-299.
doi: 10.1002/bse.371
Greene, J. C. (2007). Mixed methods in social inquiry. San Francisco, CA: Joessy-Bass.
Guo, C., & Musso, J. A. (2007). Representation in nonprofit and voluntary organizations: A
conceptual framework. Nonprofit and Voluntary Sector Quarterly, 36(2), 308-326. doi:
10.1177/0899764006289764
Hallahan, K. (2008). Organizational–public relationships in cyberspace. In T. L. Hansen-Horn, &
B. D. Neff (Eds.), Public relations: From theory to practice (pp. 46–73). Boston, MA:
Pearson.
164
Handy, F., Cnaan, R. A., Brudney, J. L., Ascoli, U., Meijs, L. C. M. P. & Ranade, S. (2000).
Public perception of “who is a volunteer:” An examination of the net-cost approach from
a cross cultural perspective. Voluntas: International Journal of Voluntary and Nonprofit
Organizations, 11(1), 45-65.
Handy, F., Mook, L., & Quarter, J. (2007). The interchangeability of paid staff and volunteers in
nonprofit organizations. Nonprofit and Voluntary Sector Quarterly, 37, 76-92.
Hardy, C., & Phillips, N. (1998). Strategies of engagement: Lessons from the critical
examination of collaboration and conflict in an interorganizational domain. Organization
Science, 9(2), 217-230. doi: 10.1287/orsc.9.2.217
Hardy, C., Phillips, N., & Lawrence, T. (2003). Resources, knowledge and influence: The
organizational effects of interorganizational collaboration. Journal of Management
Studies, 40(2), 321-347. doi: 10.1111/1467-6486.00342
Harrison, J. S., & Freeman, R. E. (1999). Stakeholders, social responsibility, and performance:
Empirical evidence and theoretical perspectives. Academy of Management Journal,
42(5), 479-485.
Harrison, J. S., & St. John, C. H. (1996). Managing and partnering with external stakeholders.
Academy of Management Executive, 10(2), 46–59.
Hasnas, J. (2012). Whither stakeholder theory? A guide for the perplexed revisited. Journal of
Business Ethics, 1-11. doi: 10.1007/s10551-012-1231-8
165
Heath, R. G. (2007). Rethinking community collaboration through a dialogic lens creativity,
democracy, and diversity in community organizing. Management Communication
Quarterly, 21(2), 145-171. doi: 10.1177/0893318907306032
Heath, R. G., & Frey, L. R. (2004). Ideal collaboration: A conceptual framework of community
collaboration. In P. J. Kalbfleisch (Ed.), Communication Yearbook 28 (pp. 189-231).
Mahwah, NJ: Lawrence Erlbaum.
Heath, R. G., & Sias, P.M. (1999). Communicating spirit in a collaborative alliance. Journal of
Applied Communication Research, 27, 356-376. doi: 10.1080/00909889909365545
Heller, K., Price, R. H., Reinharz, S., Riger, S. & Wandersman, A. (1984). Psychology and
community change: Challenges of the future (2nd Ed.). Homewood, IL: Dorsey.
Henri, L., Mohan, G., & Yanacopulos, H. (2004). Networks as transnational agents of
development. Third World Quarterly, 25(5), 839-855. doi:
10.1080/0143659042000231983
Hillman, A. J., Keim, G. D. & Luce, R. A. (2001). Board composition and stakeholder
performance: Do stakeholder directors make a difference? Business and Society, 40(3),
295–314.
Huang, Y. H. (2001). OPRA: A cross-cultural, multiple-item scale for measuring organization-
public relationships. Journal of Public Relations Research, 13(1), 61-90.
Huang, Y. (1997, May). Toward the contemporary Chinese philosophy of public relations: A
perspective from the theory of global public relations. Paper presented to the Division of
Public Relations at the 47th annual conference of the International Communication
Association, Quebec, Canada.
166
Hug, N. K., Meckel, M., & Jäger, U. (2011). Managing nonprofits’ multiple accountabilities-
How nonprofits manage multiple stakeholders’ accountability expectations in accordance
with their missions (Doctoral dissertation). Retrieved from Google Scholar (3902).
Huxham, C., & Macdonald, D. (1992). Introducing collaborative advantage: Achieving inter-
organizational effectiveness through meta-strategy. Management Decision, 30(3), 50-56.
doi: 10.1108/00251749210013104
Huxham, C., & Vangen, S. (2000). Ambiguity, complexity and dynamics in the membership of
collaboration. Human Relations, 53(6), 771-806. doi: 10.1177/0018726700536002
Huxham, C., & Eden, C. (2000). The challenge of collaborative governance. Public Management
and International Journal of Research and Theory, 2(3), 337-358.
Jamali, D. (2008). A stakeholder approach to corporate social responsibility: A fresh perspective
into theory and practice. Journal of Business Ethics, 82(1), 213-231. doi:
10.1007/s10551-007-9572-4
Jawahar, I. M., & McLaughlin, G. L. (2001). Toward a descriptive stakeholder theory: An
organizational life cycle approach. Academy of Management Review, 397-414.
Jensen, T., & Sandström, J. (2011). Stakeholder theory and globalization: The challenges of
power and responsibility. Organization Studies, 32(4), 473-488.
Jensen, M. C. (2005). Value maximization, stakeholder theory, and the corporate objective
function. Journal of Applied Corporate Finance, 14(3), 8-21. doi: 10.1111/j.1745-
6622.2001.tb00434.x
Jensen, M., & Meckling, W. (1976). Theory of the firm: Managerial behavior, agency costs and
ownership structure. Journal of Financial Economics, 3, 305–360.
167
Jones, C., Hesterly, W. S., & Borgatti, S. P. (1997). A general theory of network governance:
Exchange conditions and social mechanisms. Academy of Management Review, 22, 911–
945.
Jones, T. M. (1995). Instrumental stakeholder theory: A synthesis of ethics and economics.
Academy of Management Review, 20(2), 404-437. doi 10.5465/AMR.1995.950731292
Jones, T. M., & Wicks, A. C. (1999). Convergent stakeholder theory. Academy of Management
Review, 24(2), 206-221.
Kania, J., & Kramer, M. (2011). Collective impact. Stanford Social Innovation Review, 1(9), 36-
41.
Keyton, J., Ford, D. J., & Smith, F. I. (2008). A mesolevel communicative model of
collaboration. Communication Theory, 18, 376–406. doi:10.1111/j.1468-
2885.2008.00327.x
Kilby, P. (2006). Accountability for empowerment: Dilemmas facing non-governmental
organizations. World Development, 34(6), 951-963.
Kissane, R. J., & Gingerich, J. (2004). Do you see what I see? Nonprofit and resident perceptions
of urban neighborhood problems. Nonprofit and Voluntary Sector Quarterly, 33(2), 311-
333. doi: 10.1177/0899764004263519
Knox, S., & Gruar, C. (2007). The application of stakeholder theory to relationship marketing
strategy development in a non-profit organization. Journal of Business Ethics, 75(2), 115-
135. doi: 10.1007/s10551-006-9258-3
168
Koschmann, M.A. (2008). Communication in collaborative interorganizational relationships: A
field study of leadership and stakeholder participation (Doctoral dissertation). Retrieved
from ProQuest. (3315095)
Koschmann, M. (2007, Nov). Communicative study of stakeholder relationships in the nonprofit
sector: A conceptual foundation. Paper presented at the annual convention of the National
Communication Association, Chicago, IL.
Koschmann, M. A., Kuhn, T. R., & Pfarrer, M. D. (2012). A communicative framework of value
in cross-sector partnerships. Academy of Management Review, 37(3), 332-354. doi:
10.5465/amr.2010.0314
Laplume, A. O., Sonpar, K., & Litz, R. A. (2008). Stakeholder theory: Reviewing a theory that
moves us. Journal of Management, 34(6), 1152-1189. doi: 10.1177/0149206308324322
Lawrence, T. B., Hardy, C., & Phillips, N. (2002). Institutional effects of interorganizational
collaboration: The emergence of proto-institutions. Academy of Management Journal,
45(1), 281-290. doi: 10.2307/3069297
Leach, W. D., Pelkey, N. W., & Sabatier, P. A. (2002). Stakeholder partnerships as collaborative
policymaking: Evaluation criteria applied to watershed management in California and
Washington. Journal of Policy Analysis and Management, 21(4), 645-670. doi:
10.1002/pam.10079
LeRoux, K. (2009). Managing stakeholder demands: Balancing responsiveness to clients and
funding agents in nonprofit social service organizations. Administration & Society, 41
(2), 158-184. doi: 10.1177/0095399709332298
169
LeRoux, K., & Wright, N. S. (2010). Does performance measurement improve strategic decision
making? Findings from a national survey of nonprofit social service agencies. Nonprofit
and Voluntary Sector Quarterly, 39(4), 571-587. doi: 10.1177/0899764009359942
Lewis, L. K. (2011). Organizational change: Creating change through strategic communication.
Chichester, UK: Wiley-Blackwell.
Lewis, L. K. (2007). An organizational stakeholder model of change implementation
communication. Communication Theory, 17(2), 176-204. doi:10.1111/j.1468-
2885.2007.00291.x
Lewis, L. K. (2006). Collaborative interaction: Review of communication scholarship and a
research agenda. In C.S. Beck (Ed.), Communication Yearbook 30 (pp. 197-247).
Mahwah, NJ: Lawrence Erlbaum Associates.
Lewis, L. K., Hamel, S. A., & Richardson, B. K. (2001). Communicating change to nonprofit
stakeholders: Models and predictors of implementers' approaches. Management
Communication Quarterly, 15(1), 5-41. doi: 10.1177/0893318901151001
Lewis, L., Isbell, M. G., & Koschmann, M. (2010). Collaborative tensions: Practitioners'
experiences of interorganizational relationships. Communication Monographs, 77(4),
460-479. doi:10.1080/03637751.2010.523605
Lewis, L. K., Richardson, B. K., & Hamel, S. A. (2003). When the "stakes" are communicative.
Human Communication Research, 29(3), 400-430. doi: 10.1111/j.1468-
2958.2003.tb00845.x
170
Lewis, L. K, Scott, C. R., D’Urso, S. C., & Davis, J. (2008, November). Development of
interorganizational communication: A case study of an IOR network. Paper presented at
the annual conference of the National Communication Association, San Diego, CA.
Light, P. C. (2002). The content of their character: The state of the nonprofit workforce.
Nonprofit Quarterly, 9(3), 6-16.
Lynam, T., de Jong, W., Shell, D., Kusumanto, T., & Evans, K. (2007). A review of tools for
incorporating community knowledge, preferences, and values into decision making in
natural resources management. Ecology and Society 12, (1), 1-15.
Medved, C., Morrison, K., Dearing, J., Larson, S., Cline, G., & Brummans, B. (2001). Tensions
in community health improvement initiatives: Communication and collaboration in a
managed care environment. Journal of Applied Communication Research, 29(2), 137-
152.
Menz, F., & Stahl, H. K. (2008). Handbuch Stakeholderkommunikation. Berlin: Erich Schmidt
Verlag.
Merchant, A., Ford, J. B., & Sargeant, A. (2010). Charitable organizations' storytelling influence
on donors' emotions and intentions. Journal of Business Research, 63(7), 754-762. doi:
10.1016/j.jbusres.2009.05.013
Miller, K., Scott, C. R., Stage, C., & Birkholt, M. (1995). Communication and coordination in an
interorganizational system: Service provision for the urban homeless. Communication
Research, 22(6), 679-699. doi: 10.1177/009365095022006006
Mitchell, R. K., Agle, B. R., & Wood, D. J. (1997). Toward a theory of stakeholder identification
and salience: Defining the principle of who and what really counts. Academy of
Management Review, 22, 853-886.
171
Monge, P., & Contractor, N. (2003). Theories of communication networks. Oxford: Oxford
University Press.
Moore, E. A. & Koontz, T. M. (2003). A typology of collaborative watershed groups: Citizen-
based, agency-based, and mixed partnerships. Society &Natural Resources, 16(5), 451-
460. doi: 10.1080/08941920390190087
Murray, V. V. (1998). Interorganizational collaborations in the nonprofit sector. In J. M. Shafirtz
(Ed.), International encyclopedia of public policy and administration (2), pp. 1192-
1196). Boulder, CO: Westview.
Najam, A. (1996). NGO accountability: A conceptual framework. Development Policy Review,
14(4), 339-353.
Neville, B. A., Bell, S. J., & Whitwell, G. J. (2011). Stakeholder salience revisited: Refining,
redefining, and refueling an underdeveloped conceptual tool. Journal of Business Ethics,
102(3), 357-378. doi: 10.1007/s10551-011-0818-9
Nowell, B. (2009). Profiling capacity for coordination and systems change: The relative
contribution of stakeholder relationships in interorganizational collaboratives. American
Journal of Community Psychology, 44(3), 196-212. doi: 10.1007/s10464-009-9276-2
Oliver, C. (1991). Strategic responses to institutional processes. The Academy of Management
Review, 16(1), 145–179.
Oppen, M., Sack, D., & Wegener, A. (2005). German public-private partnerships in personal
social services: New directions in a corporatist environment. In G. Hodge & C. Greve
(Eds.), The challenge of public-private partnerships: Learning from international
experience (pp. 269-289). Cheltenham, UK: Edward Elgar.
172
O'Regan, K. M., & Oster, S. M. (2000). Nonprofit and for-profit partnerships: Rationale and
challenges of cross-sector contracting. Nonprofit and Voluntary Sector Quarterly,
29(suppl 1), 120-140. doi: 10.1177/089976400773746364
Phillips, R., Freeman, R. E., & Wicks, A. C. (2003). What stakeholder theory is not. Business
Ethics Quarterly, 479-502.
Podnar, K., & Jancic, Z. (2006). Towards a categorization of stakeholder groups: An empirical
verification of a three‐level model. Journal of Marketing Communications, 12(4), 297-
308. doi: 10.1080/13527260600720376
Pretty, J. N. (1995). Participatory learning for sustainable agriculture. World Development
23(8), 1247-1263.
Provan, K. G., & Kenis, P. (2008). Modes of network governance: Structure, management, and
effectiveness. Journal of Public Administration Research and Theory, 18, 229-252.
doi:10.1093/jopart/mum015
Provan, K. G., Nakama, L., Veazie, M. A., Teufel-Shone, N. I., & Huddleston, C. (2003).
Building community capacity around chronic disease services through a collaborative
interorganizational network. Health Education & Behavior, 30(6), 646-662. doi:
10.1177/1090198103255366
Purdy, J. M. (2012). A framework for assessing power in collaborative governance processes.
Public Administration Review, 72(3), 409–417. doi: 10.1111/j.1540-6210.2011.02525.x
Rehberg, W. (2005). Altruistic individualists: Motivations for international volunteering among
young adults. Voluntas: International Journal of Voluntary and Nonprofit
Organizations, 16(2), 109-122.
173
Rittel, H. W., & Webber, M. M. (1973). Dilemmas in a general theory of planning. Policy
sciences, 4(2), 155-169.
Roeger, K. L., Blackwood, A., & Pettijohn, S. L. (2012). The Nonprofit Almanac 2012.
Washington, DC: Urban Institute Press.
Rowley, T. J. (1997). Moving beyond dyadic ties: A network theory of stakeholder influences.
Academy of Management Review, 22, 887-910.
Rowley, T. I., & Moldoveanu, M. (2003). When will stakeholder groups act? An interest- and
identity-based model of stakeholder group mobilization. Academy of Management
Review, 28(2), 204-219. doi: 10.5465/AMR.2003.9416080
Ryan, L. V., & Schneider, M. (2003). Institutional investor power and heterogeneity:
Implications for agency and stakeholder theories. Business & Society, 42(4), 398-429.
doi: 10.1177/0007650303260450
Scearce, D. (2011). Catalyzing networks for social change: A funder’s guide. San
Francisco, CA: Monitor Institute.
Selsky, J. W., & Parker, B. (2005). Cross-sector partnerships to address social issues: Challenges
to theory and practice. Journal of Management, 31(6), 849-873. doi:
10.1177/0149206305279601
Smudde, P. M., & Courtright, J. L. (2011). A holistic approach to stakeholder management: A
rhetorical foundation. Public Relations Review, 37(2), 137-144.
doi:10.1016/j.pubrev.2011.01.008
Sonpar, K., Pazzaglia, F., & Kornijenko, J. (2010). The paradox and constraints of legitimacy.
Journal of Business Ethics, 95(1), 1-21. doi: 10.1007/s10551-009-0344-1
174
Sowa, J. E. (2009). The collaboration decision in nonprofit organizations. Nonprofit and
Voluntary Sector Quarterly, 38(6), 1003-1025. doi: 10.1177/0899764008325247
Speckbacher, G. (2008). Nonprofit versus corporate governance: An economic approach.
Nonprofit Management and Leadership, 18(3), 295-320. doi: 10.1002/nml.187
Sternberg, E. (2002). The defects of stakeholder theory. Corporate Governance: An
International Review, 5(1), 3-10. doi: 10.1111/1467-8683.00034
Stohl, C., & Walker, K. (2002). A bona fide perspective for the future of groups: Understanding
collaborating groups. In L. R. Frey (Ed.), New Directions in Group Communication (pp.
237-252). Thousand Oaks, CA: Sage.
StriveTogether. Retrieved January 9, 2014, from http://www.strivetogether.org/cradle-career-
network.
Strauss, A., & Corbin, J. (1994). Grounded theory methodology. In N. K. Denzin &Y. S. Lincoln
(Eds.), Handbook of qualitative research (pp. 273-285).Thousand Oaks, CA: Sage.
Taylor, M., & Doerfel, M.L. (2005). Another dimension to explicating relationships: Measuring
inter-organizational linkages. Public Relations Review, 31(1),121-129. doi:
10.1016/j.pubrev.2004.11013
Teddlie, C., & Tashakkori, A. (2009). Foundations of mixed methods research: Integrating
quantitative and qualitative approaches in the social and behavioral sciences. Thousand
Oaks, CA: Sage.
Trevino, L. K., & Weaver, G. H. (1999). The stakeholder research tradition: Converging
theorists and not convergent theory. Academy of Management Review, 24(2), 222-227.
doi: 10.5465/AMR.1999.1893930
175
Trist, E. (1983). Referent organizations and the development of inter-organizational domains.
Human Relations, 36(3), 269-284. doi: 10.1177/001872678303600304
Trotter, R. T. II, Briody, E. K., Sengire, G. H., & Meerwarth, T. L. (2008). The life cycle of
collaborative partnerships: Evolution of structure and roles in industry-university
research networks. Connections, 28, 40-58.
Twersky, F., Buchanan, P., & Threlfall, V. (2013). Listening to those who matter most, the
beneficiaries. Stanford Social Innovation Review, Spring, 41-45.
Van de Bunt, G. G., & Groenewegen, P. (2007). An actor-oriented dynamic network approach:
The case of interorganizational network evolution. Organizational Research Methods,
10(3), 463-482. doi: 10.1177/1094428107300203
Van Puyvelde, S., Caers, R., Du Bois, S. & Jegers, M. (2011). The governance of nonprofit
organizations: Integrating agency theory with stakeholder and stewardship theory.
Nonprofit and Voluntary Sector Quarterly, 41(3), 1-22. doi: 10.1177/0899764011409757
Wandersman, A. (1979). User participation in planning environments: A conceptual framework.
Environment and Behavior, 11(4), 465-482. doi: 10.1177/0013916579114003
Watson, E. R., & Foster-Fishman, P. G. (2012). The exchange boundary framework:
Understanding the evolution of power within collaborative decision-making settings.
American Journal of Community Psychology, 1-13. doi: 10.1007/s10464-012-9540-8
Warwick, M. (2008). How to write successful fundraising letters. 2nd ed. San Francisco: Jossey
Bass.
176
Weber, E. P., & Khademian, A. M. (2008). Wicked problems, knowledge challenges, and
collaborative capacity builders in network settings. Public Administration Review, 68(2),
334-349.
Wood, D. J., & Gray, B. (1991). Toward a comprehensive theory of collaboration. Journal of
Applied Behavioral Science, 27, 139-162. doi: 10.1177/0021886391272001
Zimmerman, M. A., & Rappaport, J. (1988). Citizen participation, perceived control, and
psychological empowerment. American Journal of Community Psychology, 16(5), 725-
750. Doi: 10.1007/BF00930023
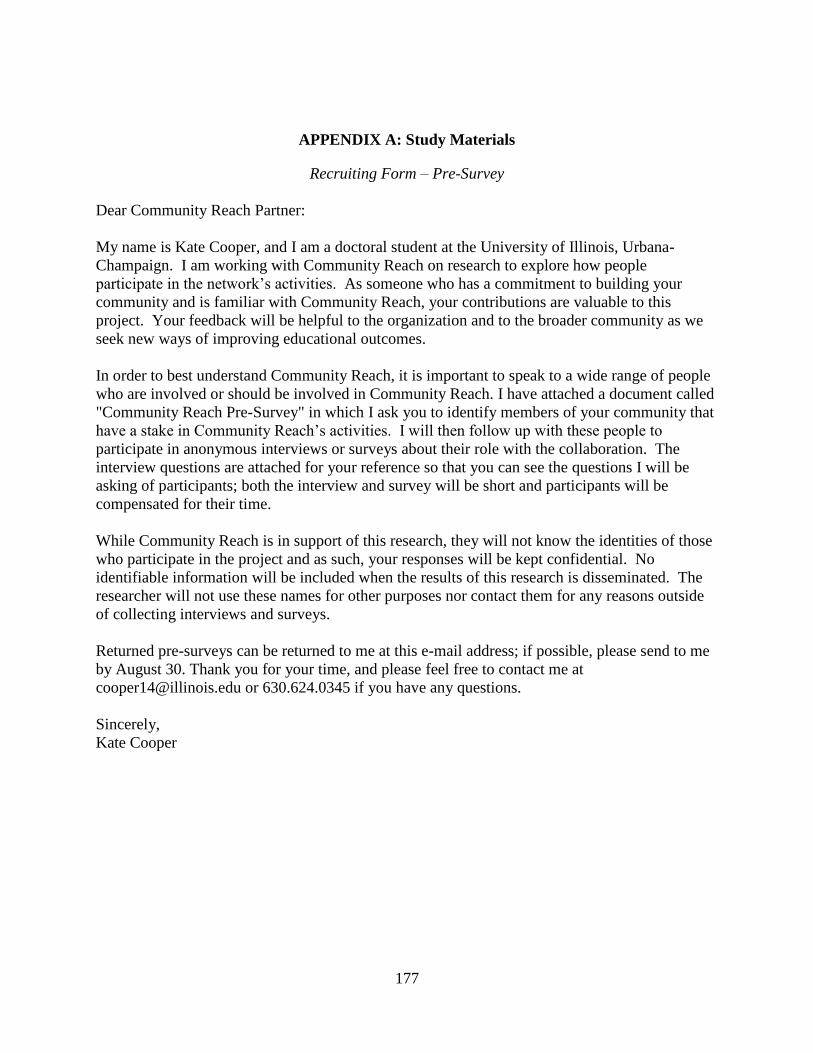
177
APPENDIX A: Study Materials
Recruiting Form – Pre-Survey
Dear Community Reach Partner:
My name is Kate Cooper, and I am a doctoral student at the University of Illinois, Urbana-
Champaign. I am working with Community Reach on research to explore how people
participate in the network’s activities. As someone who has a commitment to building your
community and is familiar with Community Reach, your contributions are valuable to this
project. Your feedback will be helpful to the organization and to the broader community as we
seek new ways of improving educational outcomes.
In order to best understand Community Reach, it is important to speak to a wide range of people
who are involved or should be involved in Community Reach. I have attached a document called
"Community Reach Pre-Survey" in which I ask you to identify members of your community that
have a stake in Community Reach’s activities. I will then follow up with these people to
participate in anonymous interviews or surveys about their role with the collaboration. The
interview questions are attached for your reference so that you can see the questions I will be
asking of participants; both the interview and survey will be short and participants will be
compensated for their time.
While Community Reach is in support of this research, they will not know the identities of those
who participate in the project and as such, your responses will be kept confidential. No
identifiable information will be included when the results of this research is disseminated. The
researcher will not use these names for other purposes nor contact them for any reasons outside
of collecting interviews and surveys.
Returned pre-surveys can be returned to me at this e-mail address; if possible, please send to me
by August 30. Thank you for your time, and please feel free to contact me at
[email protected] or 630.624.0345 if you have any questions.
Sincerely,
Kate Cooper
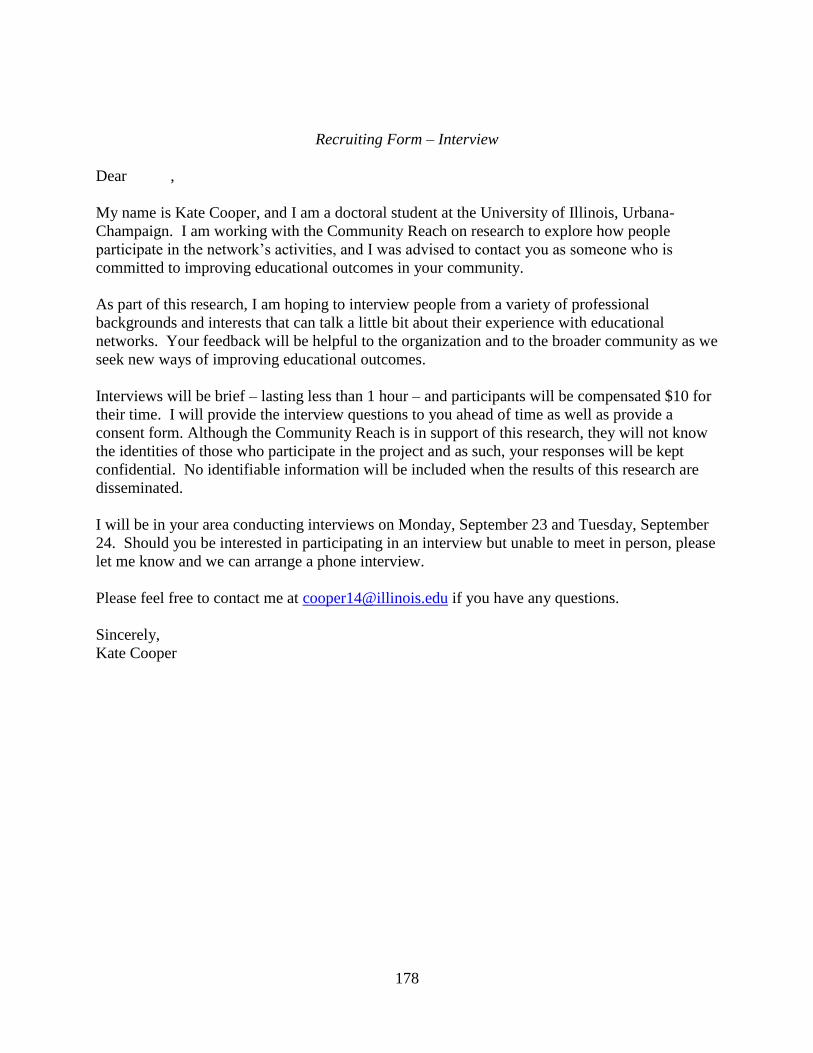
178
Recruiting Form – Interview
Dear ,
My name is Kate Cooper, and I am a doctoral student at the University of Illinois, Urbana-
Champaign. I am working with the Community Reach on research to explore how people
participate in the network’s activities, and I was advised to contact you as someone who is
committed to improving educational outcomes in your community.
As part of this research, I am hoping to interview people from a variety of professional
backgrounds and interests that can talk a little bit about their experience with educational
networks. Your feedback will be helpful to the organization and to the broader community as we
seek new ways of improving educational outcomes.
Interviews will be brief – lasting less than 1 hour – and participants will be compensated $10 for
their time. I will provide the interview questions to you ahead of time as well as provide a
consent form. Although the Community Reach is in support of this research, they will not know
the identities of those who participate in the project and as such, your responses will be kept
confidential. No identifiable information will be included when the results of this research are
disseminated.
I will be in your area conducting interviews on Monday, September 23 and Tuesday, September
24. Should you be interested in participating in an interview but unable to meet in person, please
let me know and we can arrange a phone interview.
Please feel free to contact me at [email protected] if you have any questions.
Sincerely,
Kate Cooper
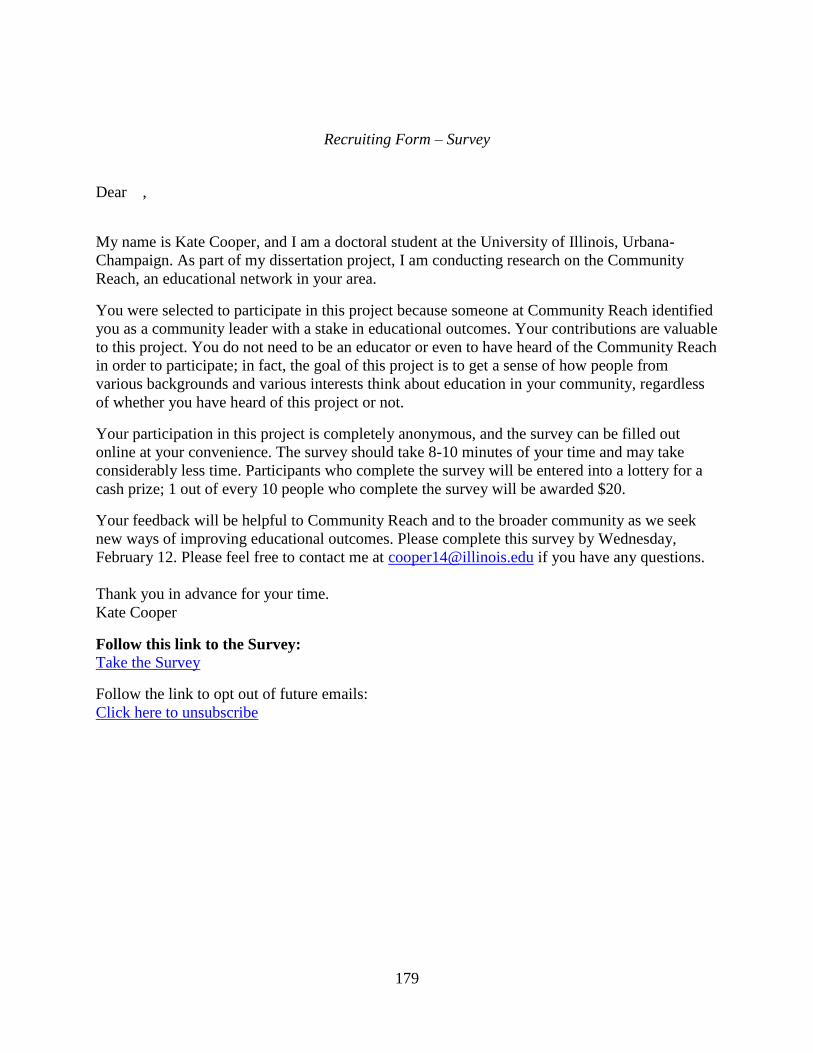
179
Recruiting Form – Survey
Dear ,
My name is Kate Cooper, and I am a doctoral student at the University of Illinois, Urbana-
Champaign. As part of my dissertation project, I am conducting research on the Community
Reach, an educational network in your area.
You were selected to participate in this project because someone at Community Reach identified
you as a community leader with a stake in educational outcomes. Your contributions are valuable
to this project. You do not need to be an educator or even to have heard of the Community Reach
in order to participate; in fact, the goal of this project is to get a sense of how people from
various backgrounds and various interests think about education in your community, regardless
of whether you have heard of this project or not.
Your participation in this project is completely anonymous, and the survey can be filled out
online at your convenience. The survey should take 8-10 minutes of your time and may take
considerably less time. Participants who complete the survey will be entered into a lottery for a
cash prize; 1 out of every 10 people who complete the survey will be awarded $20.
Your feedback will be helpful to Community Reach and to the broader community as we seek
new ways of improving educational outcomes. Please complete this survey by Wednesday,
February 12. Please feel free to contact me at [email protected] if you have any questions.
Thank you in advance for your time.
Kate Cooper
Follow this link to the Survey:
Take the Survey
Follow the link to opt out of future emails:
Click here to unsubscribe
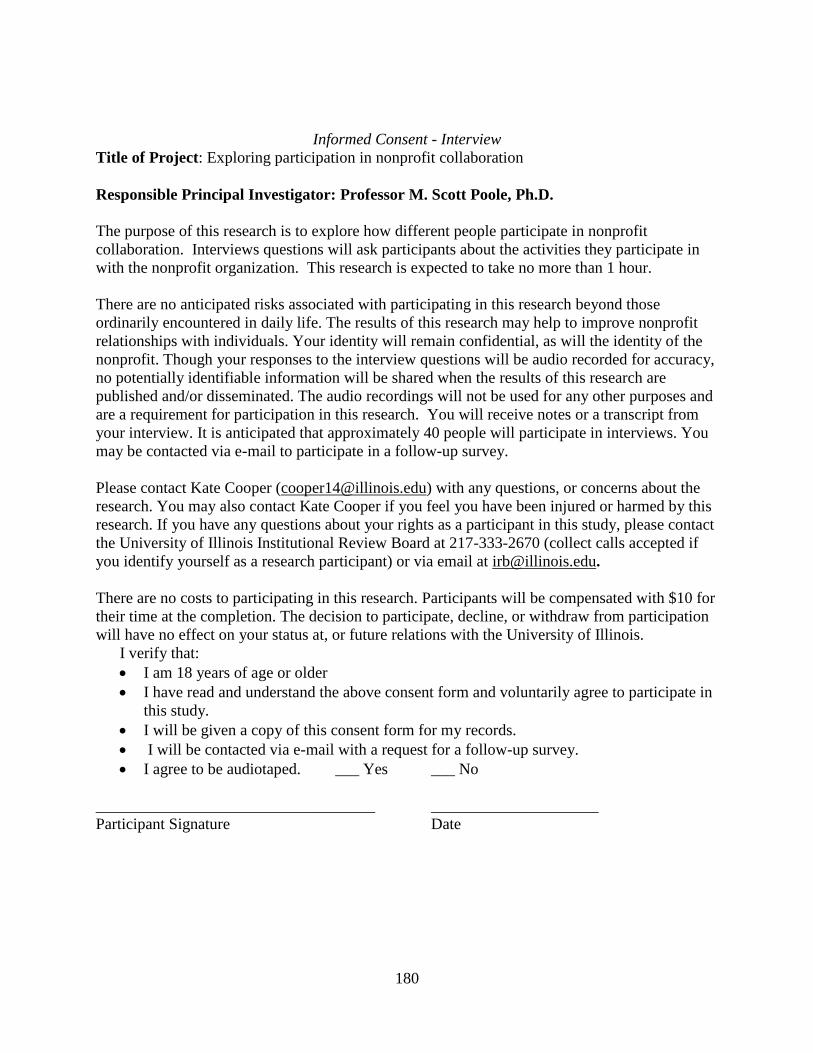
180
Informed Consent - Interview
Title of Project: Exploring participation in nonprofit collaboration
Responsible Principal Investigator: Professor M. Scott Poole, Ph.D.
The purpose of this research is to explore how different people participate in nonprofit
collaboration. Interviews questions will ask participants about the activities they participate in
with the nonprofit organization. This research is expected to take no more than 1 hour.
There are no anticipated risks associated with participating in this research beyond those
ordinarily encountered in daily life. The results of this research may help to improve nonprofit
relationships with individuals. Your identity will remain confidential, as will the identity of the
nonprofit. Though your responses to the interview questions will be audio recorded for accuracy,
no potentially identifiable information will be shared when the results of this research are
published and/or disseminated. The audio recordings will not be used for any other purposes and
are a requirement for participation in this research. You will receive notes or a transcript from
your interview. It is anticipated that approximately 40 people will participate in interviews. You
may be contacted via e-mail to participate in a follow-up survey.
Please contact Kate Cooper ([email protected]) with any questions, or concerns about the
research. You may also contact Kate Cooper if you feel you have been injured or harmed by this
research. If you have any questions about your rights as a participant in this study, please contact
the University of Illinois Institutional Review Board at 217-333-2670 (collect calls accepted if
you identify yourself as a research participant) or via email at [email protected].
There are no costs to participating in this research. Participants will be compensated with $10 for
their time at the completion. The decision to participate, decline, or withdraw from participation
will have no effect on your status at, or future relations with the University of Illinois.
I verify that:
I am 18 years of age or older
I have read and understand the above consent form and voluntarily agree to participate in
this study.
I will be given a copy of this consent form for my records.
I will be contacted via e-mail with a request for a follow-up survey.
I agree to be audiotaped. ___ Yes ___ No
___________________________________ _____________________
Participant Signature Date
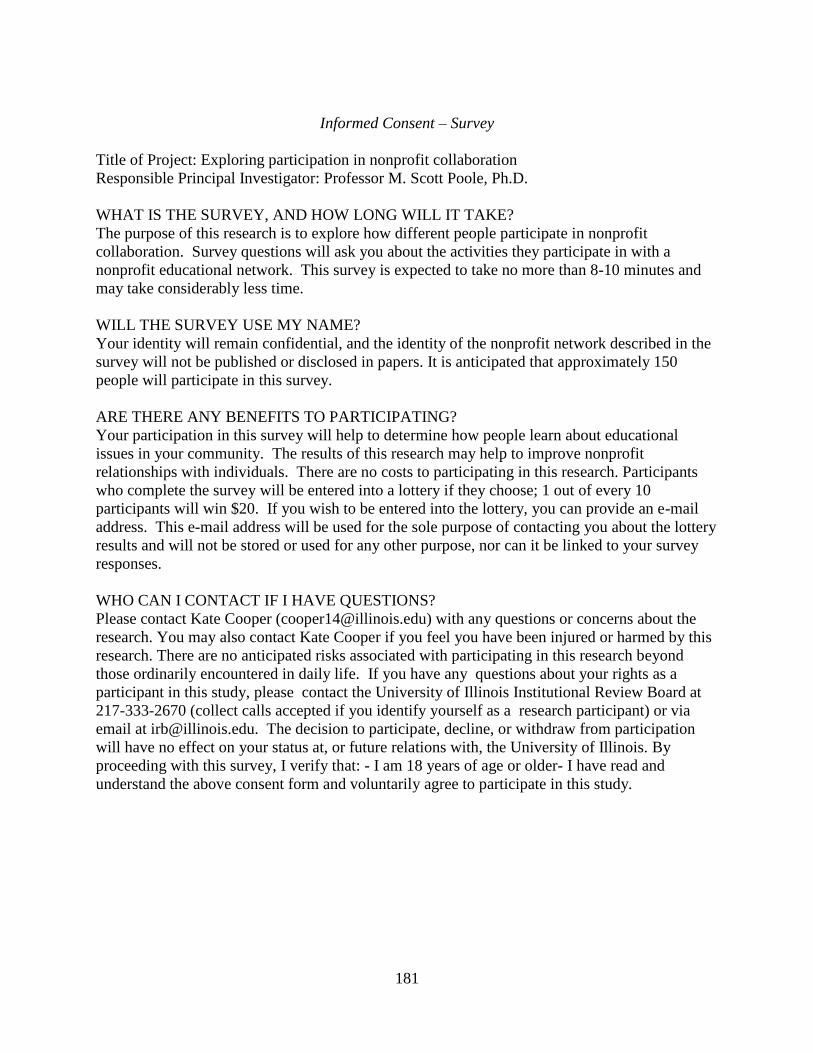
181
Informed Consent – Survey
Title of Project: Exploring participation in nonprofit collaboration
Responsible Principal Investigator: Professor M. Scott Poole, Ph.D.
WHAT IS THE SURVEY, AND HOW LONG WILL IT TAKE?
The purpose of this research is to explore how different people participate in nonprofit
collaboration. Survey questions will ask you about the activities they participate in with a
nonprofit educational network. This survey is expected to take no more than 8-10 minutes and
may take considerably less time.
WILL THE SURVEY USE MY NAME?
Your identity will remain confidential, and the identity of the nonprofit network described in the
survey will not be published or disclosed in papers. It is anticipated that approximately 150
people will participate in this survey.
ARE THERE ANY BENEFITS TO PARTICIPATING?
Your participation in this survey will help to determine how people learn about educational
issues in your community. The results of this research may help to improve nonprofit
relationships with individuals. There are no costs to participating in this research. Participants
who complete the survey will be entered into a lottery if they choose; 1 out of every 10
participants will win $20. If you wish to be entered into the lottery, you can provide an e-mail
address. This e-mail address will be used for the sole purpose of contacting you about the lottery
results and will not be stored or used for any other purpose, nor can it be linked to your survey
responses.
WHO CAN I CONTACT IF I HAVE QUESTIONS?
Please contact Kate Cooper ([email protected]) with any questions or concerns about the
research. You may also contact Kate Cooper if you feel you have been injured or harmed by this
research. There are no anticipated risks associated with participating in this research beyond
those ordinarily encountered in daily life. If you have any questions about your rights as a
participant in this study, please contact the University of Illinois Institutional Review Board at
217-333-2670 (collect calls accepted if you identify yourself as a research participant) or via
email at [email protected]. The decision to participate, decline, or withdraw from participation
will have no effect on your status at, or future relations with, the University of Illinois. By
proceeding with this survey, I verify that: - I am 18 years of age or older- I have read and
understand the above consent form and voluntarily agree to participate in this study.
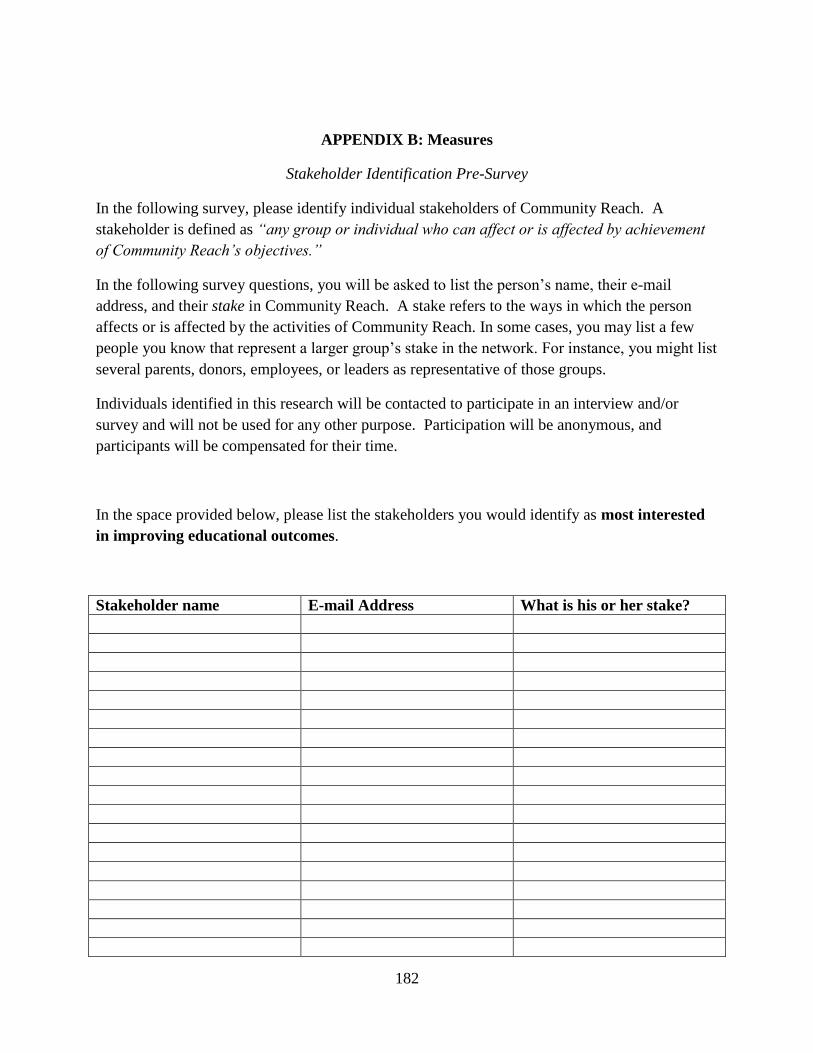
182
APPENDIX B: Measures
Stakeholder Identification Pre-Survey
In the following survey, please identify individual stakeholders of Community Reach. A
stakeholder is defined as “any group or individual who can affect or is affected by achievement
of Community Reach’s objectives.”
In the following survey questions, you will be asked to list the person’s name, their e-mail
address, and their stake in Community Reach. A stake refers to the ways in which the person
affects or is affected by the activities of Community Reach. In some cases, you may list a few
people you know that represent a larger group’s stake in the network. For instance, you might list
several parents, donors, employees, or leaders as representative of those groups.
Individuals identified in this research will be contacted to participate in an interview and/or
survey and will not be used for any other purpose. Participation will be anonymous, and
participants will be compensated for their time.
In the space provided below, please list the stakeholders you would identify as most interested
in improving educational outcomes.
Stakeholder name E-mail Address What is his or her stake?

183
In the space provided below, please list the stakeholders you would identify as most interested
in working with others in Community Reach.
Stakeholder name E-mail Address What is his or her stake?
In the space provided below, please list the stakeholders you would identify as most powerful in
that they have the ability to affect Community Reach.
Stakeholder name E-mail Address What is his or her stake?

184
In the space provided below, please list the stakeholders you would identify as most organized,
in that they know other stakeholders, participate, or coordinate activities with other stakeholders.
Stakeholder name E-mail Address What is his or her stake?
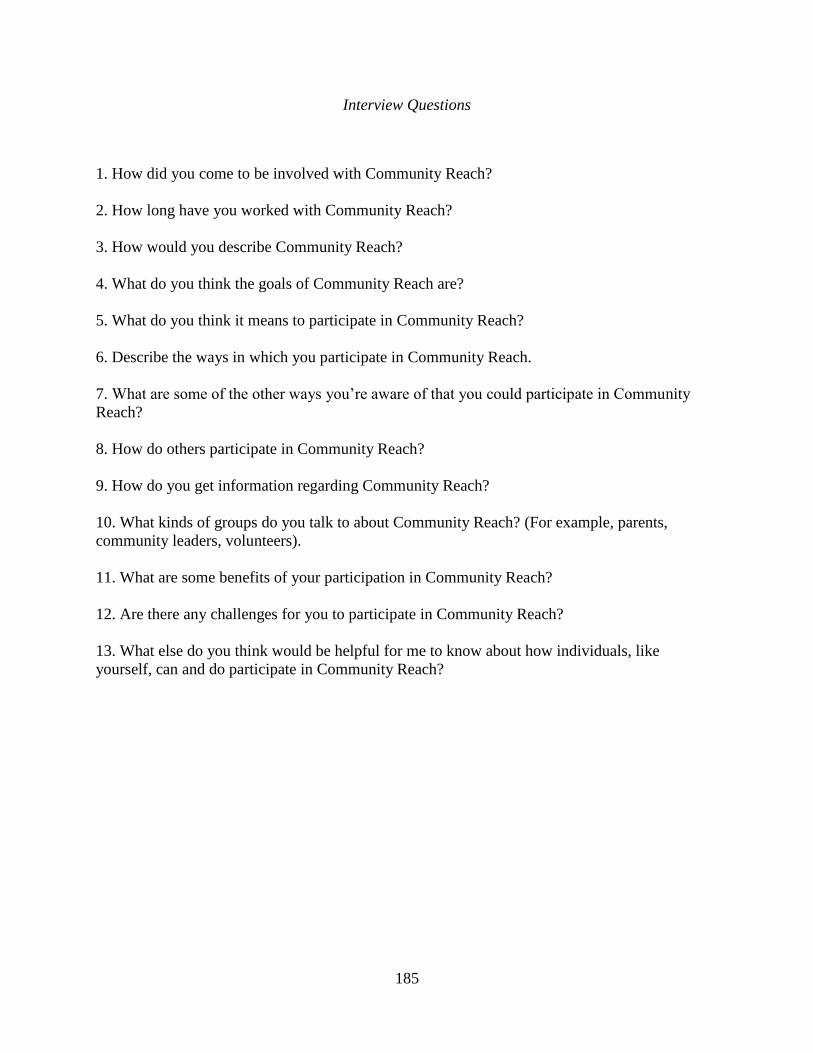
185
Interview Questions
1. How did you come to be involved with Community Reach?
2. How long have you worked with Community Reach?
3. How would you describe Community Reach?
4. What do you think the goals of Community Reach are?
5. What do you think it means to participate in Community Reach?
6. Describe the ways in which you participate in Community Reach.
7. What are some of the other ways you’re aware of that you could participate in Community
Reach?
8. How do others participate in Community Reach?
9. How do you get information regarding Community Reach?
10. What kinds of groups do you talk to about Community Reach? (For example, parents,
community leaders, volunteers).
11. What are some benefits of your participation in Community Reach?
12. Are there any challenges for you to participate in Community Reach?
13. What else do you think would be helpful for me to know about how individuals, like
yourself, can and do participate in Community Reach?
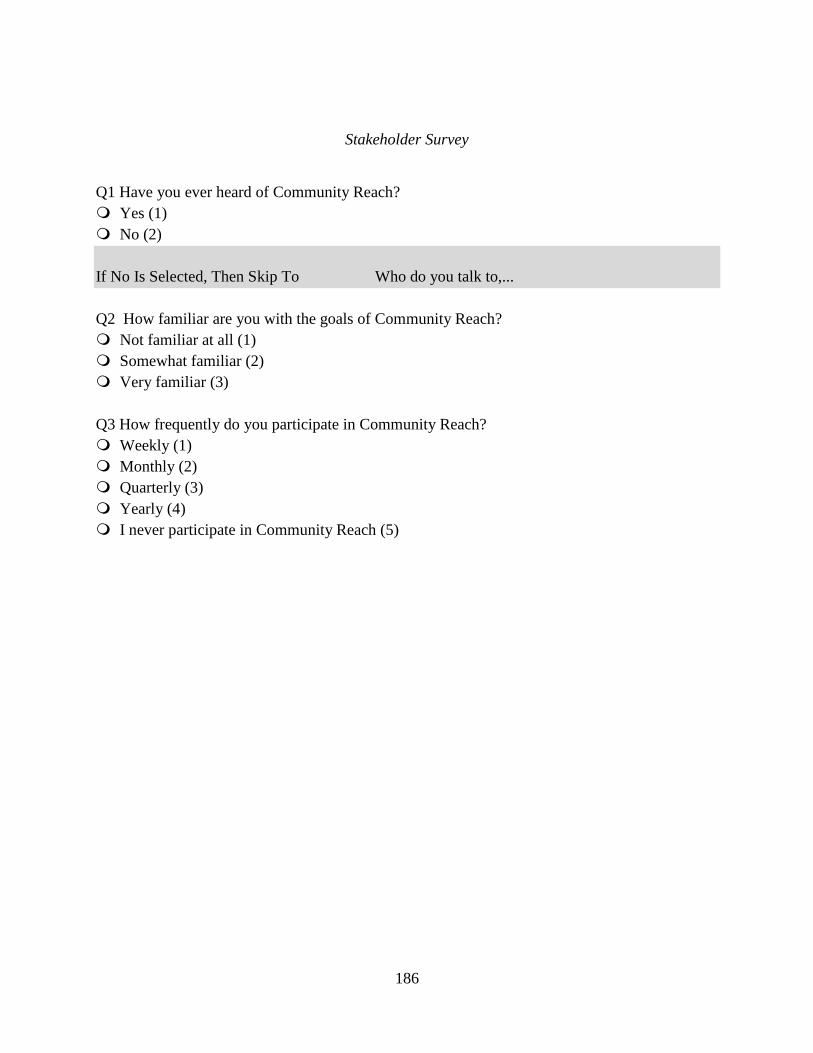
186
Stakeholder Survey
Q1 Have you ever heard of Community Reach?
Yes (1)
No (2)
If No Is Selected, Then Skip To Who do you talk to,...
Q2 How familiar are you with the goals of Community Reach?
Not familiar at all (1)
Somewhat familiar (2)
Very familiar (3)
Q3 How frequently do you participate in Community Reach?
Weekly (1)
Monthly (2)
Quarterly (3)
Yearly (4)
I never participate in Community Reach (5)
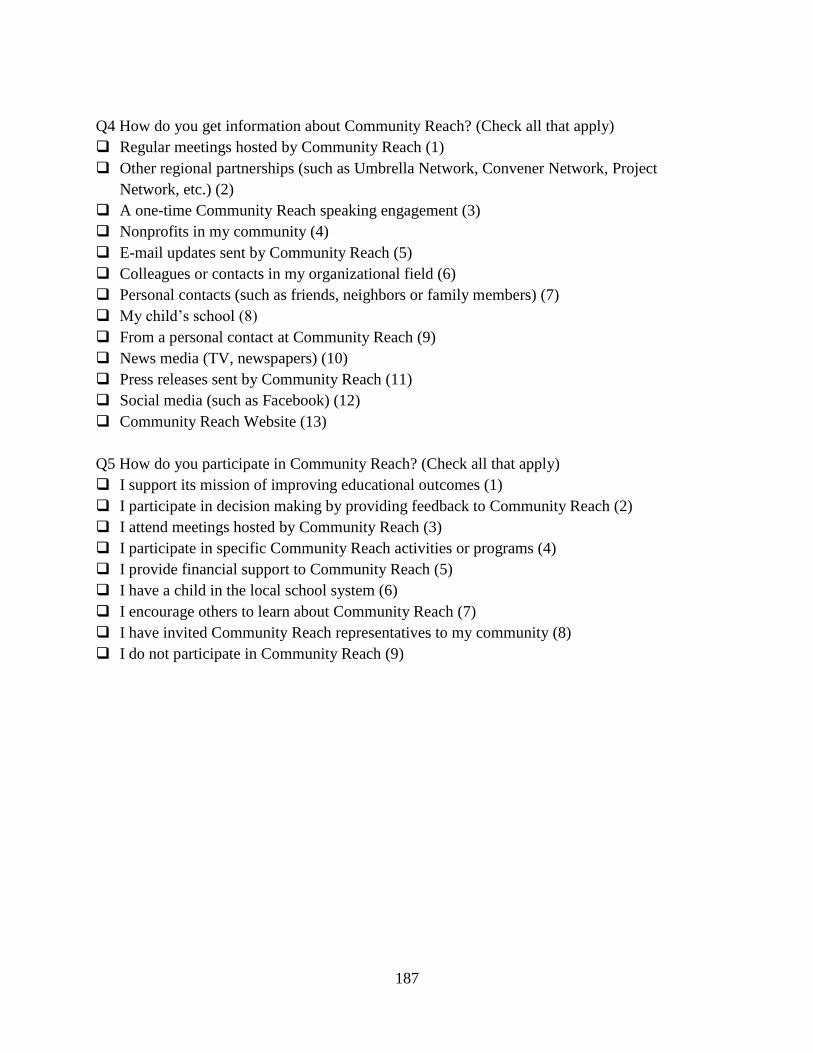
187
Q4 How do you get information about Community Reach? (Check all that apply)
Regular meetings hosted by Community Reach (1)
Other regional partnerships (such as Umbrella Network, Convener Network, Project
Network, etc.) (2)
A one-time Community Reach speaking engagement (3)
Nonprofits in my community (4)
E-mail updates sent by Community Reach (5)
Colleagues or contacts in my organizational field (6)
Personal contacts (such as friends, neighbors or family members) (7)
My child’s school (8)
From a personal contact at Community Reach (9)
News media (TV, newspapers) (10)
Press releases sent by Community Reach (11)
Social media (such as Facebook) (12)
Community Reach Website (13)
Q5 How do you participate in Community Reach? (Check all that apply)
I support its mission of improving educational outcomes (1)
I participate in decision making by providing feedback to Community Reach (2)
I attend meetings hosted by Community Reach (3)
I participate in specific Community Reach activities or programs (4)
I provide financial support to Community Reach (5)
I have a child in the local school system (6)
I encourage others to learn about Community Reach (7)
I have invited Community Reach representatives to my community (8)
I do not participate in Community Reach (9)
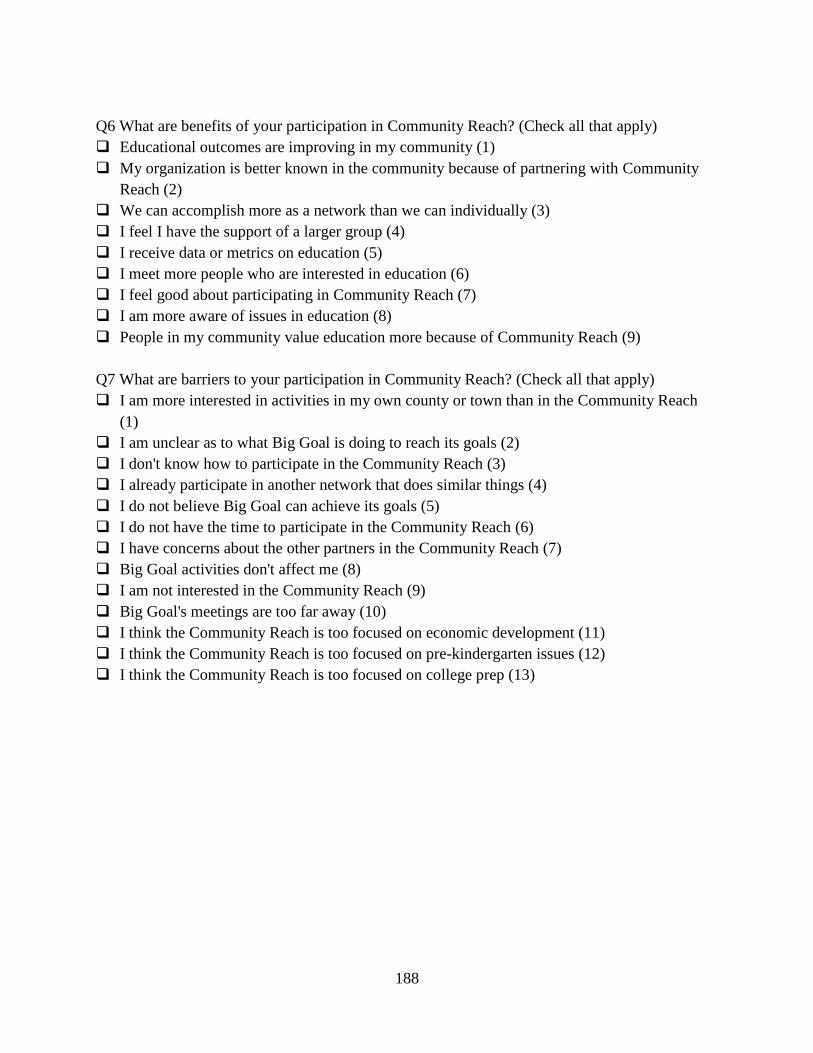
188
Q6 What are benefits of your participation in Community Reach? (Check all that apply)
Educational outcomes are improving in my community (1)
My organization is better known in the community because of partnering with Community
Reach (2)
We can accomplish more as a network than we can individually (3)
I feel I have the support of a larger group (4)
I receive data or metrics on education (5)
I meet more people who are interested in education (6)
I feel good about participating in Community Reach (7)
I am more aware of issues in education (8)
People in my community value education more because of Community Reach (9)
Q7 What are barriers to your participation in Community Reach? (Check all that apply)
I am more interested in activities in my own county or town than in the Community Reach
(1)
I am unclear as to what Big Goal is doing to reach its goals (2)
I don't know how to participate in the Community Reach (3)
I already participate in another network that does similar things (4)
I do not believe Big Goal can achieve its goals (5)
I do not have the time to participate in the Community Reach (6)
I have concerns about the other partners in the Community Reach (7)
Big Goal activities don't affect me (8)
I am not interested in the Community Reach (9)
Big Goal's meetings are too far away (10)
I think the Community Reach is too focused on economic development (11)
I think the Community Reach is too focused on pre-kindergarten issues (12)
I think the Community Reach is too focused on college prep (13)
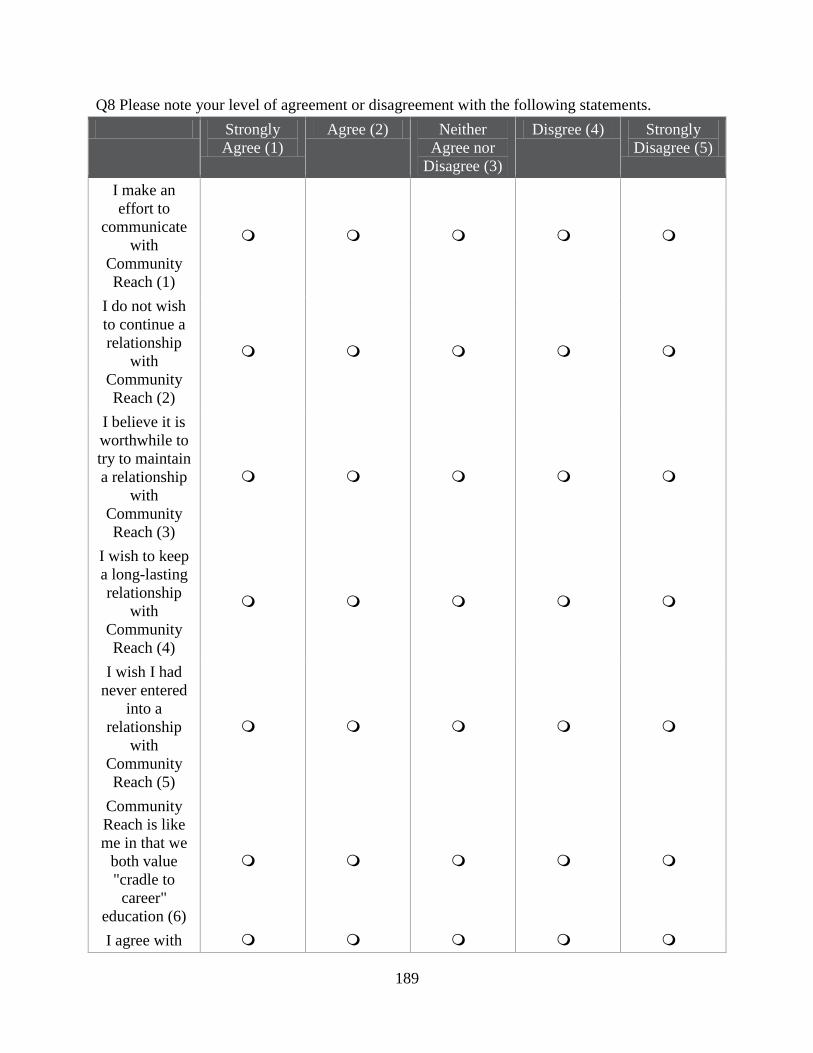
189
Q8 Please note your level of agreement or disagreement with the following statements.
Strongly
Agree (1)
Agree (2) Neither
Agree nor
Disagree (3)
Disgree (4) Strongly
Disagree (5)
I make an
effort to
communicate
with
Community
Reach (1)
I do not wish
to continue a
relationship
with
Community
Reach (2)
I believe it is
worthwhile to
try to maintain
a relationship
with
Community
Reach (3)
I wish to keep
a long-lasting
relationship
with
Community
Reach (4)
I wish I had
never entered
into a
relationship
with
Community
Reach (5)
Community
Reach is like
me in that we
both value
"cradle to
career"
education (6)
I agree with
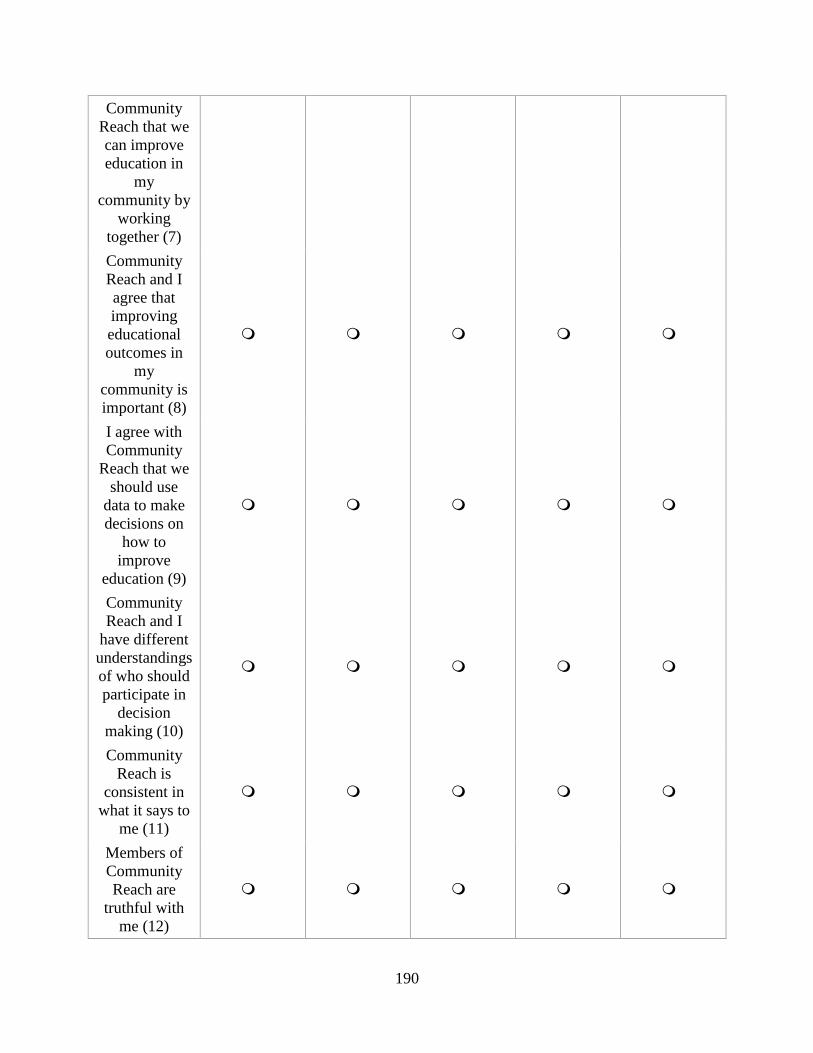
190
Community
Reach that we
can improve
education in
my
community by
working
together (7)
Community
Reach and I
agree that
improving
educational
outcomes in
my
community is
important (8)
I agree with
Community
Reach that we
should use
data to make
decisions on
how to
improve
education (9)
Community
Reach and I
have different
understandings
of who should
participate in
decision
making (10)
Community
Reach is
consistent in
what it says to
me (11)
Members of
Community
Reach are
truthful with
me (12)
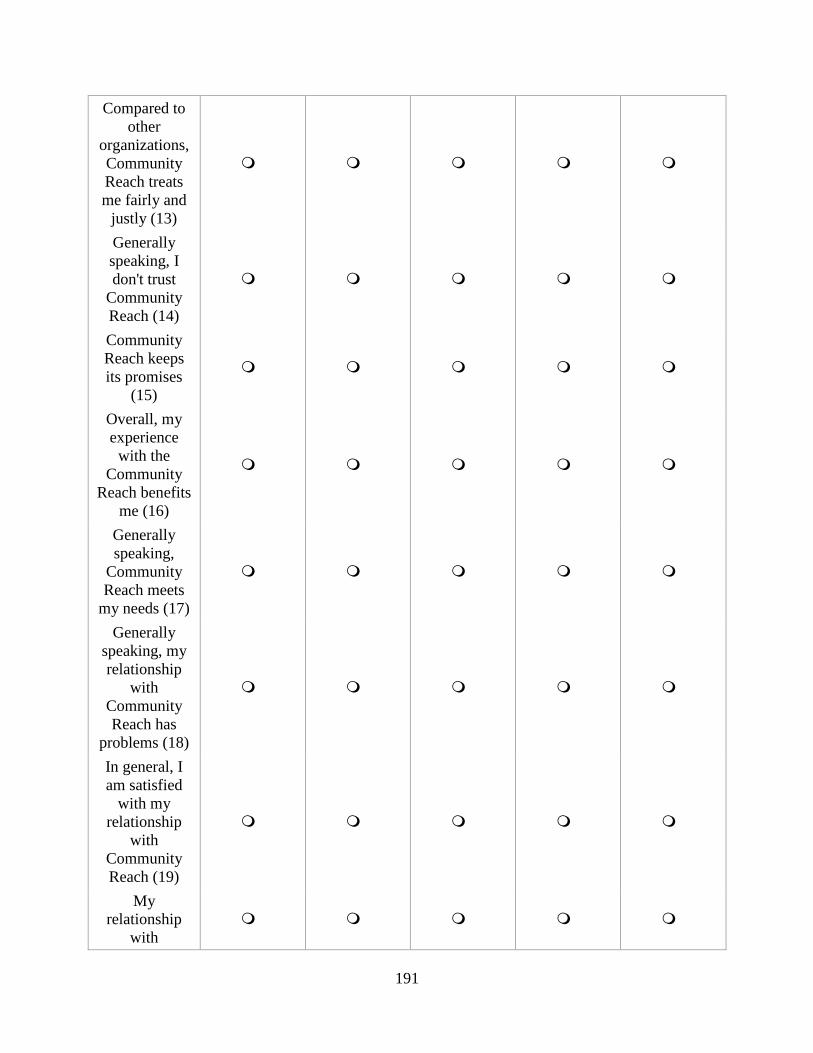
191
Compared to
other
organizations,
Community
Reach treats
me fairly and
justly (13)
Generally
speaking, I
don't trust
Community
Reach (14)
Community
Reach keeps
its promises
(15)
Overall, my
experience
with the
Community
Reach benefits
me (16)
Generally
speaking,
Community
Reach meets
my needs (17)
Generally
speaking, my
relationship
with
Community
Reach has
problems (18)
In general, I
am satisfied
with my
relationship
with
Community
Reach (19)
My
relationship
with

192
Community
Reach is good
(20)

193
Q9 Who do you talk to about the Community Reach? (Check all that apply)
Nonprofit representative (social services) (1)
Nonprofit representative (community foundation) (2)
Nonprofit representative (economic development) (3)
School principal (4)
Educator (pre-K) (5)
Educator (K-12) (6)
Educator (University or vocational) (7)
Educator (Adult education) (8)
School counselor/social worker (9)
Librarian (10)
Parent of child/children under 24 years old (11)
School administrator (12)
School board member (13)
Superintendent (14)
Government representative (i.e. mayor, city council member, congressperson) (15)
Member, Local chamber of commerce (16)
Member, Umbrella Network (17)
Member, Convener Network (18)
Member, Project Network (19)
Volunteer in Community Reach (20)
Funder for Community Reach (21)
Business owner or employer (22)
Clergy (23)
Member of judicial system (24)
Member of other educational network (please list here) (25) ____________________

194
Q10 Who do you talk to, in general, about education in your community? (Check all that apply)
Nonprofit representative (social services) (1)
Nonprofit representative (community foundation) (2)
Nonprofit representative (economic development) (3)
School principal (4)
Educator (pre-K) (5)
Educator (K-12) (6)
Educator (University or vocational) (7)
Educator (Adult education) (8)
School counselor/social worker (9)
Librarian (10)
Parent of child/children under 24 years old (11)
School administrator (12)
School board member (13)
Superintendent (14)
Government representative (i.e. mayor, city council member, congressperson) (15)
Member, Local chamber of commerce (16)
Member, Umbrella Network (17)
Member, Convener Network (18)
Member, Project Network (19)
Volunteer in Community Reach (20)
Funder for Community Reach (21)
Business owner or employer (22)
Clergy (23)
Member of judicial system (24)
Member of other educational network (please list here) (25) ____________________
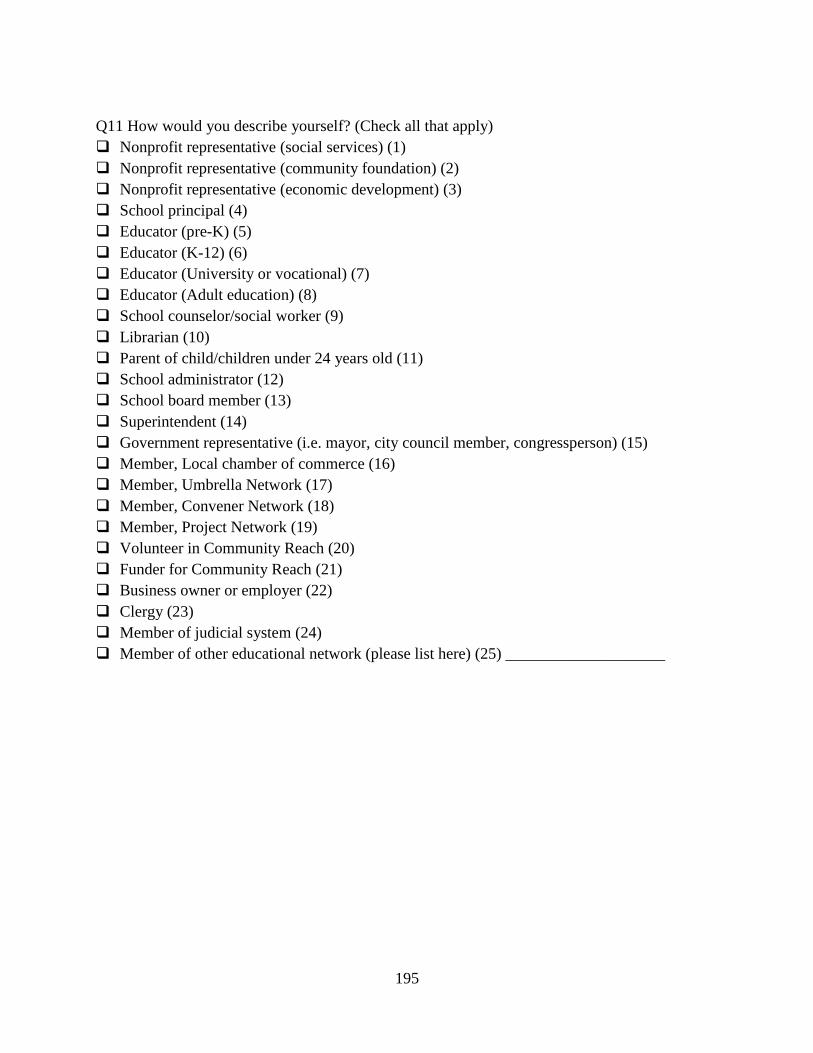
195
Q11 How would you describe yourself? (Check all that apply)
Nonprofit representative (social services) (1)
Nonprofit representative (community foundation) (2)
Nonprofit representative (economic development) (3)
School principal (4)
Educator (pre-K) (5)
Educator (K-12) (6)
Educator (University or vocational) (7)
Educator (Adult education) (8)
School counselor/social worker (9)
Librarian (10)
Parent of child/children under 24 years old (11)
School administrator (12)
School board member (13)
Superintendent (14)
Government representative (i.e. mayor, city council member, congressperson) (15)
Member, Local chamber of commerce (16)
Member, Umbrella Network (17)
Member, Convener Network (18)
Member, Project Network (19)
Volunteer in Community Reach (20)
Funder for Community Reach (21)
Business owner or employer (22)
Clergy (23)
Member of judicial system (24)
Member of other educational network (please list here) (25) ____________________
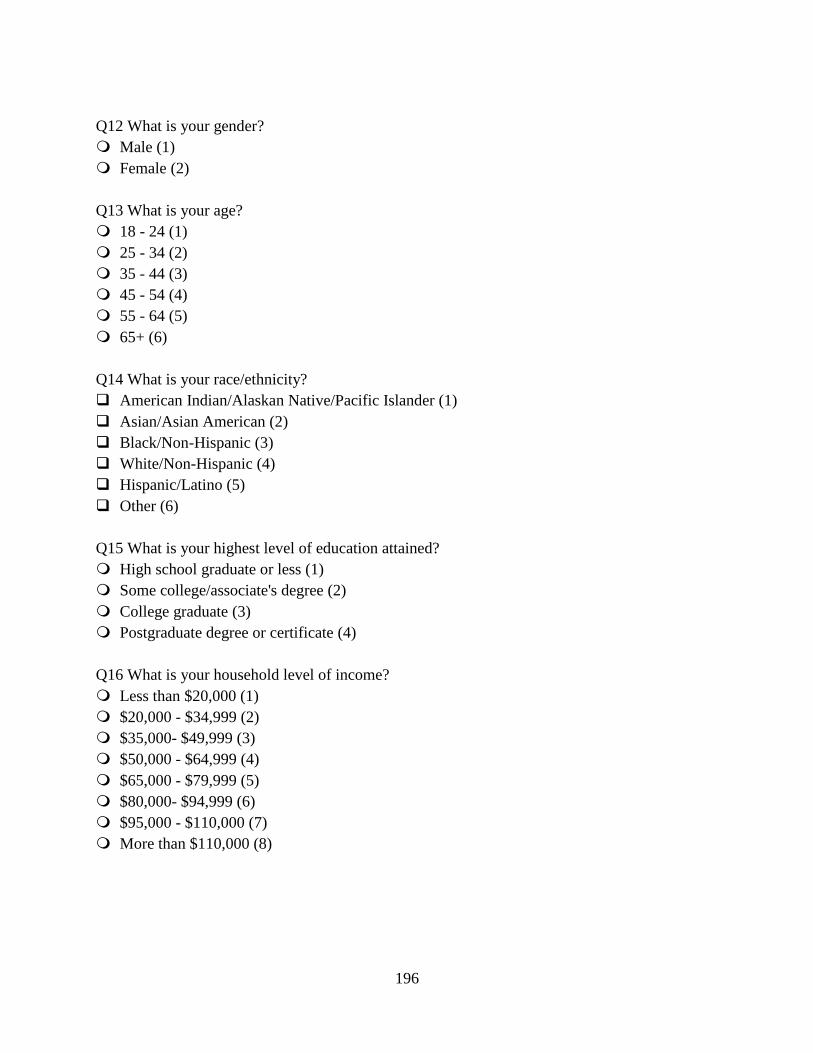
196
Q12 What is your gender?
Male (1)
Female (2)
Q13 What is your age?
18 - 24 (1)
25 - 34 (2)
35 - 44 (3)
45 - 54 (4)
55 - 64 (5)
65+ (6)
Q14 What is your race/ethnicity?
American Indian/Alaskan Native/Pacific Islander (1)
Asian/Asian American (2)
Black/Non-Hispanic (3)
White/Non-Hispanic (4)
Hispanic/Latino (5)
Other (6)
Q15 What is your highest level of education attained?
High school graduate or less (1)
Some college/associate's degree (2)
College graduate (3)
Postgraduate degree or certificate (4)
Q16 What is your household level of income?
Less than $20,000 (1)
$20,000 - $34,999 (2)
$35,000- $49,999 (3)
$50,000 - $64,999 (4)
$65,000 - $79,999 (5)
$80,000- $94,999 (6)
$95,000 - $110,000 (7)
More than $110,000 (8)
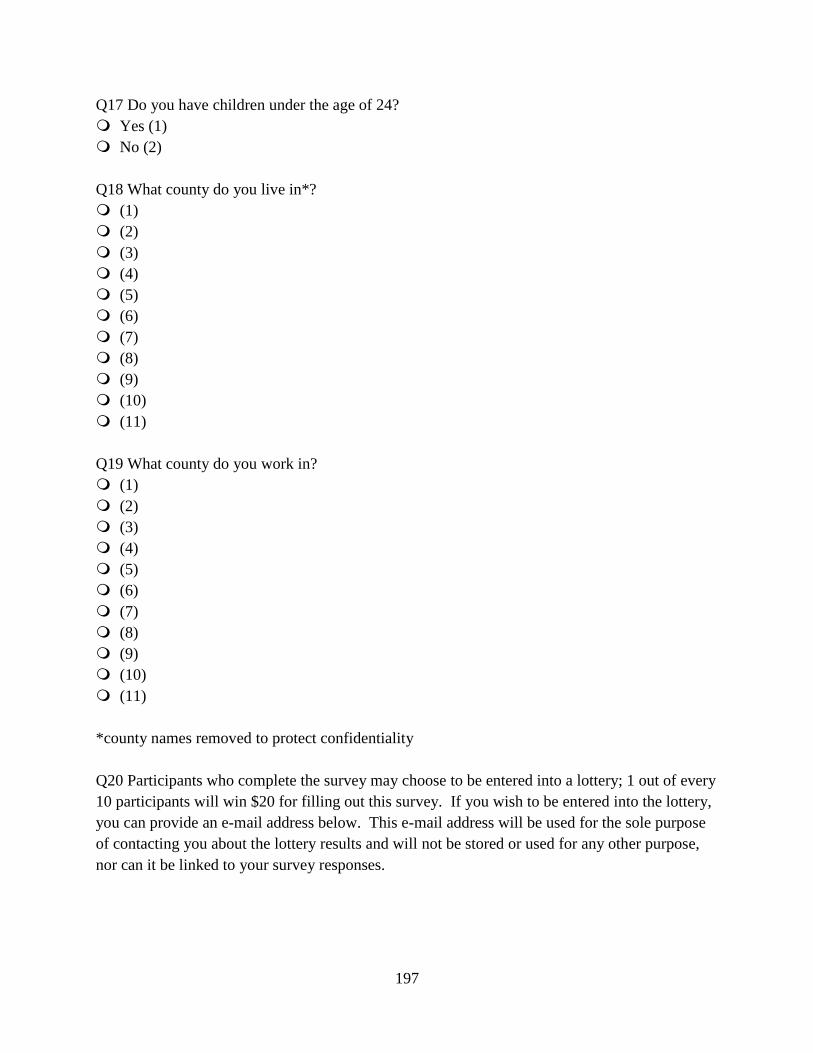
197
Q17 Do you have children under the age of 24?
Yes (1)
No (2)
Q18 What county do you live in*?
(1)
(2)
(3)
(4)
(5)
(6)
(7)
(8)
(9)
(10)
(11)
Q19 What county do you work in?
(1)
(2)
(3)
(4)
(5)
(6)
(7)
(8)
(9)
(10)
(11)
*county names removed to protect confidentiality
Q20 Participants who complete the survey may choose to be entered into a lottery; 1 out of every
10 participants will win $20 for filling out this survey. If you wish to be entered into the lottery,
you can provide an e-mail address below. This e-mail address will be used for the sole purpose
of contacting you about the lottery results and will not be stored or used for any other purpose,
nor can it be linked to your survey responses.