Embed Size (px)
Citation preview

Exploring QoE for Power Efficiency: A Field Study onMobile Videos with LCD Displays
Zhisheng Yan, Qian LiuState University of New York
at Buffalo
Tong ZhangRensselaer Polytechnic
Institute
Chang Wen ChenState University of New York
at Buffalo
ABSTRACTDisplay power consumption has become a major concern forboth mobile users and design engineers, especially consider-ing the prevalence of today’s video-rich mobile services. Thepower consumption of liquid crystal display (LCD), a domi-nant mobile display technology, can be reduced by dynamicbacklight scaling (DBS). However, such dynamic changes ofscreen brightness may degrade users’ quality of experience(QoE) in viewing videos. How would QoE be impacted bydifferent DBS strategies has not yet been understood clearlyand thus obscures the way to achieve systematic power sav-ing. In this paper, we take a first step to explore the QoEof DBS on smartphones and aim at maximally enhancingthe display power performance without negatively impact-ing users’ QoE. In particular, we conduct three motivationalstudies to uncover the inherent relationship between QoEand backlight scaling frequency, magnitude, and temporalconsistency, respectively. Motivated by the findings of thesestudies, we design a suite of techniques to implement a com-prehensive DBS strategy. We demonstrate an example ap-plication of the proposed DBS designs in a mobile videostreaming system. Measurements and user evaluations showthat more than 40% system power reduction, or equivalently,20% more power savings than the non-QoE approaches, canbe achieved without QoE impairment.
Categories and Subject DescriptorsH.5.1 [Multimedia Information Systems]: Video
General TermsDesign; Experimentation; Human Factors
KeywordsLCD; Mobile Video Streaming; Power Consumption; QoE
1. INTRODUCTIONThe proliferation of mobile web access and social networks
has dramatically boosted mobile video services. Although
Permission to make digital or hard copies of all or part of this work for personal orclassroom use is granted without fee provided that copies are not made or distributedfor profit or commercial advantage and that copies bear this notice and the full cita-tion on the first page. Copyrights for components of this work owned by others thanACM must be honored. Abstracting with credit is permitted. To copy otherwise, or re-publish, to post on servers or to redistribute to lists, requires prior specific permissionand/or a fee. Request permissions from [email protected]’15 October 26–30, 2015, Brisbane, Australia.c© 2015 ACM. ISBN 978-1-4503-3459-4/15/10 ...$15.00.
DOI: http://dx.doi.org/10.1145/2733373.2806269.
mobile computing and storage capabilities have been con-tinuously expanding in order to meet the ever-growing videoservices, relatively short lifetime of batteries has long beena major complaint by smartphone users. Among the op-erational components of a mobile phone, display power isone crucial issue that needs to be addressed urgently. Notonly have displays been identified as one of the most power-consuming subsystems [1], but display power is also con-sumed in a broader video-related applications as long as thevideo is playing on the mobile phone. For example, unlikecommunication components that consume energy only whenvideo streaming is in session, power dissipation of displaysshall occur in both online and offline video viewing.
Liquid crystal display (LCD) is a dominant display tech-nology that is adopted by larger number of modern devices,e.g., Apple iPhone 6/6 Plus, Google Nexus 4/5, and LG G3/4/Pro. According to a recent study [2], the revenue shareof LCD-based mobile phones is expected to reach 70% in2020. The power consumption of LCD primarily comes fromthe backlight at the display panel. By dimming the back-light, we could save the display energy. However, dimmedbacklight may lead to a lower perceptual luminance of dis-played pixels, which would cause video distortion and even-tually degrade users’ quality of experience (QoE). Hence, thekey principle of LCD power reduction in mobile videos is todynamically scale the backlight as low as possible withoutnegatively impacting users’ QoE. This is commonly termedas dynamic backlight scaling (DBS).
Despite this general consensus, we observe that our under-standing of power-saving strategies for LCD is still limited.This might surprise many experts since DBS has been ac-tively studied in design automation communities. The rea-son behind this observation is that mobile videos introducenew effects on the QoE of backlight scaling while little isknown regarding the optimal backlight under this new con-text. First, prior backlight scaling schemes for a single image[3–5] cannot be directly applied to the multi-frame videos.Second, most exiting works [6, 7] were implemented usingprogrammable LCD modules, which cannot adequately re-flect human perception on smartphones that employ largerscreen size and higher pixel-density. Most importantly, priorobjective distortion metrics for DBS, e.g., linear relationshipbetween perceptual luminance and backlight levels [4, 8, 9],become inaccurate and need to be replaced by subjectiveQoE modeling that specifically targets DBS.
On the other hand, although video QoE has been exten-sively researched in the context of encoding and streamingto improve compression and delivery performance, QoE of
backlight-scaled videos for power efficiency has not beenstudied. In this research, we take a first step to exploreQoE when DBS is applied in order to maximally enhancethe power performance of LCD-based mobile phones with-out sacrificing end users’ QoE. To achieve this ambitiousobjective, we are facing several research challenges.
• Finding a suitable scaling frequency : How frequentlyshould DBS be applied is fundamentally dependent onboth QoE and power. Less frequent scaling will resultin more stable viewing experience, but will leave muchsmaller space for manipulating the backlight dynamics,which diminishes the potential for power saving [8].When to apply the scaling also matters because abruptvariation of backlight is annoying to users.
• Determining a smallest scaling magnitude: For a givensegment of video frames, obtaining a smallest scalingmagnitude in order to maximally reduce power con-sumption is a non-trivial task. The inherent relation-ship between QoE and backlight change has not yetbeen understood clearly. This is further complicatedby the fact that users may express distinct perceptionfor different video contents even under the same back-light condition.
• Applying temporally consistent DBS across multiplesegments: Simply scaling each segment’s backlight in-dividually without inter-segment consideration shalllead to QoE degradation because human eyes are shownto be extremely sensitive to temporally inconsistentvideos. For example, adaptive streaming studies [10]have reported that quality switches with high variationfrustrate the end users.
In order to tackle these challenges, we have carried out acomprehensive investigation on the QoE of dynamic back-light scaling. We have developed a customized video App,QoEPlayer, to conduct three motivational studies to explorethe connection between QoE and scaling frequency, magni-tude, and temporal consistency, respectively. By leverag-ing statistical analysis, we discover that a video shot basedscaling frequency is on average 11 times more acceptable byusers than other alternative approaches. Accordingly, we de-sign and tune a video shot detection algorithm to decide thebest scaling frequency. Furthermore, we observe a content-luminance-dependent logistic relationship (instead of linear)between QoE and backlight levels. We then construct aQoE model using logistic regression in order to determinethe best scaling magnitude of a given video shot. Moreover,we find it interesting that users are only sensitive to down-scaled backlight switches rather than up-scaled ones. There-fore, we train a binary classifier to detect those inconsistentdown-scaled backlight switches and then properly smooththese variations. Finally, combining all these findings, wedevelop a systematic strategy for DBS as applied to mo-bile phones. We demonstrate an example application of theproposed designs in a video delivery system and show thatmore than 40% system power can be saved, which is equiva-lent to 20% more power savings than conventional strategieswithout QoE considerations.
To summarize, the contributions of the proposed researchinclude:
• A open-source video App, QoEPlayer, for subjectivemobile video studies on Android platform (Section 3).
• A set of motivational studies to explore the intrinsic re-lation between QoE and scaling frequency, magnitudeand temporal consistency (Section 4-6).
• A suite of designs to achieve the most power-efficientDBS strategies without negative effects on user expe-rience (Section 4-6).
• A practical demonstration of the usage of the proposedDBS designs, showing 40% system power reduction, orequivalently, 20% more power savings than non-QoEapproaches (Section 7).
2. RELATED WORK
2.1 Dynamic Backlight ScalingIn general, exiting DBS schemes first compute the percep-
tual luminance of a backlight-scaled image by assuming itis linearly proportional to scaling magnitude and/or originalpixel value. Then the backlight keeps scaling down until cer-tain distortion thresholds between the two images are met.
Particularly, Cheng and Pedram scaled the backlight whilepreserving the image contrast [3]. Chang et al. increased theoriginal pixel values to compensate for the scaling distortionand then retained the brightness and contrast [4]. Iranliet al. compensated the original image by considering his-togram equalization [5]. These single-image level schemesdemonstrate the principle of backlight scaling, but they arenot directly applicable to mobile videos.
DBS for videos were studied by considering video-relateddistortion metrics. Structural similarity (SSIM) [7] and peaksignal-to-noise ratio (PSNR) [11] based measure were ex-ploited to apply DBS. Visual sensitivity characterization infrequency domain was used to smooth the flicker effect ofDBS [6]. Recently, Lin et al. optimized the scaling strate-gies by dynamic programming to minimize power consump-tion [8]. Liu et al. proposed to use GPU to perform lu-minance compensation and to reduce power effectively [9].However, these works all rely on objective distortion for-mulations that are not specifically developed for DBS andtherefore lack direct relationship with user experience.
In this paper, we explore the user experience of backlight-scaled videos through subjective user tests on modern smart-phones. We aim at uncovering the inherent relations amongQoE, backlight and video content, and utilizing them to im-prove the power performance of mobile phones.
2.2 QoE StudiesMany objective metrics for QoE focus on low-level video
features, e.g., PSNR and SSIM [12]. However, whether ornot these objective metrics match well with user experienceis still controversial and is usually application-dependent[13]. More commonly, QoE is modeled as mean opinionscores obtained from subjective evaluation data. Many ef-forts were made for different applications, such as generalnetworked video systems [14] and adaptive HTTP stream-ing [15, 16], and ITU video-telephony [17]. One potentialissue of such score-based tests is that participants may beoverburdened by the multiple levels of score and may strug-gle with making a decision [18].
Recently, binary assessment choice was suggested for sub-jective tests to evaluate the acceptability of videos [13,18,19].The lowest acceptable video for pleasant viewing can be
found using Method of Limits in classical psychophysics [20],where users view a series of videos varied in successive dis-crete steps with descending or ascending order and submittheir binary acceptability choice.
There were also important data-driven works that minethe large-scale network traffic [21] or user engagement data[22] to model QoE in Internet applications. However, this isnot feasible for DBS on mobile phones as users need to per-sonally hold the device and view the backlight-scaled videoto experience the video display.
All these exiting works explore how QoE is impacted byencoding or transmission parameters, e.g, resolution, bit-rate and delay, in order to enhance the networking perfor-mance. In this paper, however, our objective is fundamen-tally different in that we probe into the new QoE space ofbacklight scaling in order to enhance the power performance.
3. USER STUDY SETUPIn this section, we introduce the general setup of user
studies and system demo. Test-dependent setup will be pre-sented in the subsequent sections.
Test Devices. LG Optimus G Pro and Google Nexus4 are used in all tests except the study of temporal consis-tency where G Pro and Xiaomi Mi 2 are used. The screensize, resolution, pixel density of G Pro, Nexus 4, and Mi 2are 5.5 inch/1080x1920/401 ppi, 4.7 inch/768x1280/318 ppi,4.3 inch/720x1280/342 ppi, respectively. The diverse screensetting allows us to study the impacts for different devices.
Participants. We recruit a total of 50 participants fromtwo universities. Their ages range from 20 to 39. There are32 males and 18 females. All participants have a normalcolor vision. We also report that one participant works inthe area of mobile display. However, we do not find any sig-nificant difference in that particular result. A set of 40 par-ticipants take part in the three motivational studies whereasa set of 20 participants evaluate the system application. Foreach test, participants are divided into two halves and eachhalf uses a different test phone.
Video Sources. We use 15 training sources for moti-vational studies. There are 5 standard sequences, 2 openmovies [23], and 8 movie trailers that are 2015 Oscar nomi-nees for best picture. To validate the designs in system-levelapplication, we also prepare another 4 test sources that are2015 Oscar nominees for best actor and actress without over-lapping with above sources. Such selection concurs with theimportant principle of user studies that real-world materialsshould be used [18]. Since we are interested in DBS, we en-code all videos identically at a high quality with 1280x720resolution, 23 quantization parameter, 24 frames/second,and H.264/AVC baseline profile. We also encode all au-dio materials at AAC format with 44kHz and >180kbps toguarantee that users can understand the content and enjoythe viewing experience. These encoded sources will be splitinto test clips for the studies in the subsequent sections.
Assessment Objective. Due to the simplicity and com-fort of user decision in binary-choice QoE tests, we followprior works [13,18,19] to adopt this promising method. Par-ticipants are asked to identify whether or not a test clip isacceptable. Since we intend to maximally reduce the powerwithout negative effects on users’ regular viewing experience,acceptable quality is informed as the quality with tiny/noadjustment of screen brightness that participants would en-joy and thus have a pleasant experience in daily life.
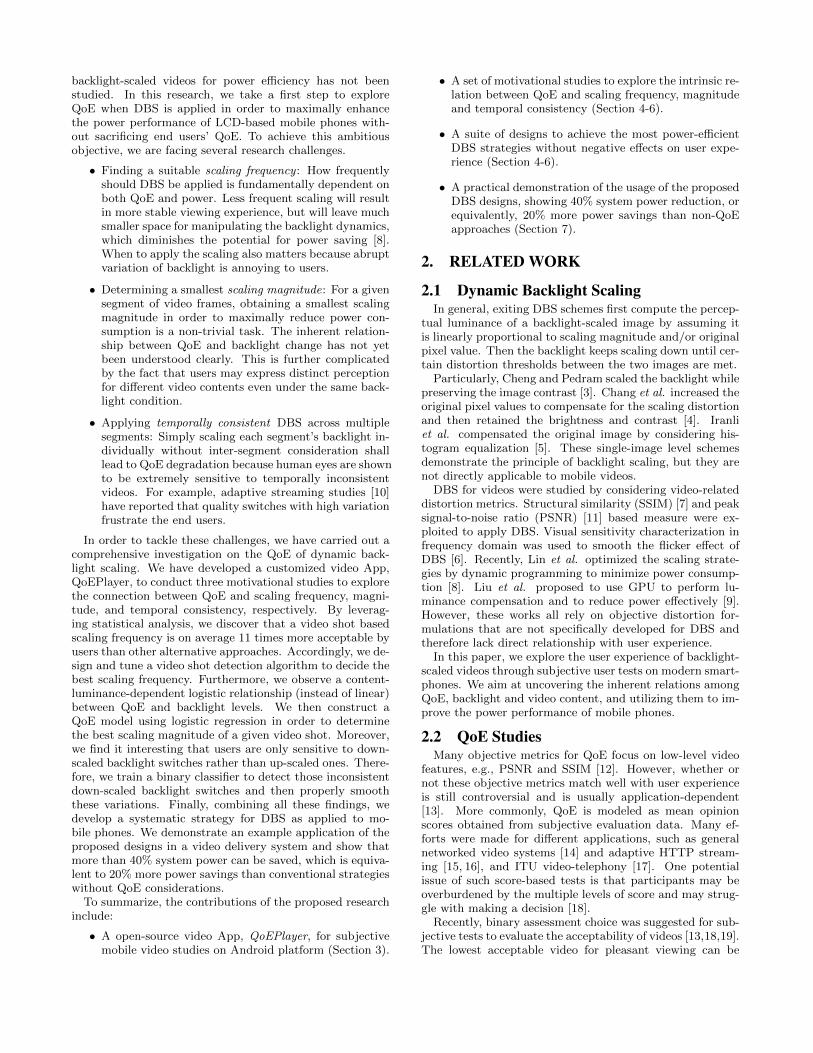
(a) Readme (b) Playlist
(c) Pop-up Dialogue (d) Opinion Form
Figure 1: Screenshots of QoEPlayer.
Test Environment. Human perception of screen bright-ness might be affected by ambient light. We focus on theambient light ranging from 100 to 1000 lux, which mim-ics the indoor residential and working lighting [24]. Thisis because people spend majority of time on viewing mo-bile videos in such indoor scenarios. According to the studyin [25], 358 out of 663 people watch mobile video at homewhile 176 at university or working place, 92 at vehicle and37 at cafe shop, barber and bus station. Although the loca-tion distribution within the categories is not known, it is stillclear that a greater bulk of mobile viewing occurs indoor.
Test App: QoEPlayer. We implement a open-source1
Android application for the tests. Initially, participants reg-ister at the Readme page (Figure 1a) by providing personalinformation. They are then asked to randomly select a videoclip that has multiple versions differed by a certain stimu-lus (Figure 1b). The presentation order of multiple versionscan be customized as random, ascending, and descending.Once a test version is selected, QoEPlayer will automati-cally check whether the ambient light meets the requirementvia the light sensor in the device. If satisfied, video playbackwill start. Otherwise, a warning window that instructs usersto move to a darker/brighter environment will pop up.
Upon playing the video, QoEPlayer creates a control threadto dynamically adjust the backlight via Android API basedon a given scaling profile. It also guarantees that DBS is syn-chronized with the video and audio codec to support pause,fast forward, etc. During video playback, participants candouble tap the screen to initiate a pop-up dialogue (Fig-ure 1c) and submit their decision. Note that this functionis only active when allowed by the test protocol. Alterna-tively, there is always a opinion form (Figure 1d) showingat the end of playback. After the choices are submitted in
1www.cse.buffalo.edu/UBMM/People/zhisheng_yan.html
either way, QoEPlayer will automatically save the results ofparticipants and return to the playlist.
This automatic process provides participants with a sim-pler and more immersive viewing experience, which eventu-ally speeds up the studies. We emphasize that QoEPlayercan be modified and ported to any mobile QoE studies.
4. ADDRESSING DBS FREQUENCYTo find a proper scaling frequency, we must identify the
requirements in terms of both QoE and power. First, it is de-sired to let the backlight scaling occur at time points whenusers pay much less attention to the video. Second, thenumber of video segments separated by the scaling pointsshould be as many as possible if QoE is not compromised.In fact, more segments allow more rooms for manipulatingthe backlight dynamics, hence reducing more power [8]. Forexample, if we mix two segments whose lowest scaling mag-nitude to maintain QoE areM1 andM2, we would need toapply the magnitude max(M1,M2) to the mixed segmentto ensure QoE, which is less power efficient than assigningM1 and M2 to each segment, respectively.
4.1 Motivational Study
4.1.1 MethodologyIdeally, we should examine the QoE under all combina-
tions of segmentation for a video and then model the scalingfrequency versus QoE data and content features of segments.However, this is infeasible as there are too many ways ofsegmentation, e.g., a 1-second video will have tens of mil-lions options. Therefore, we proceed by comparing severalpossible approaches and obtain a suboptimal yet acceptablesolution. To the best of our knowledge, only two previousworks considered DBS frequency. In [8], a constant scalingfrequency with certain number of frames was used (denotedas Const). In [26], the authors used the rule that the vari-ance of average luminance of frames belonging to a segmentshould be less than a threshold value (denoted as GoS).
In addition, we propose to adopt a video shot as one scal-ing segment and scale the backlight at shot boundaries. Ashot refers to a series of consecutive frames played for anuninterrupted period of time. We propose this strategy asthere is usually a sudden transition of content when the shotis switched. We anticipate that users might pay much lessattention to the shot-boundary frames with sudden switchthan to the within-shot frames showing the actual contents.Thereby, the impacts of DBS can be diminished. Note thatvideo scenes in semantic level is a similar idea. We pre-fer shots as scaling segments since a scene consists of one ormore shots and thus leaves us less space for power reduction.
4.1.2 ResultsWe prepare 4 test clips (2 full trailers and 2 movie clips)
with average duration 115 seconds. Each clip is dynamicallybacklight scaled using the above three frequencies. The con-stant frequency and variance threshold are set to the defaultvalue of 10 frames [8] and 40 [26], respectively. Besides, weuse a shot detection algorithm to be introduced in the nextsubsection to find the shot boundaries and manually correctthe false/missed detection. For all frequency strategies, thescaling magnitude M of each segment i is decided using asimple linear mapping that is based on the scheme in [26].Specifically, if the content of the current segment is darker
sniper bunny tear theory
Acc
epta
bilit
y (9
5% C
I)
0
0.2
0.4
0.6
0.8
1
Shot GoS Const
sniper bunny tear theory
Acc
epta
bilit
y (9
5% C
I)
0
0.2
0.4
0.6
0.8
1
Shot GoS Const
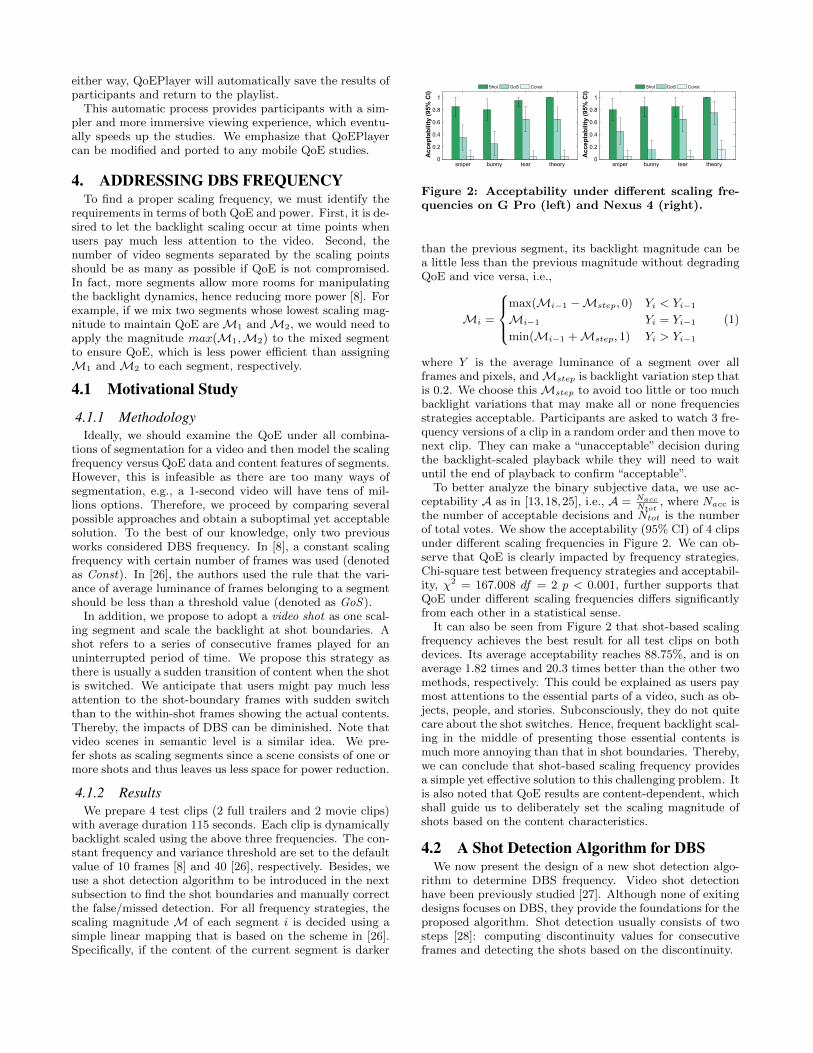
Figure 2: Acceptability under different scaling fre-quencies on G Pro (left) and Nexus 4 (right).
than the previous segment, its backlight magnitude can bea little less than the previous magnitude without degradingQoE and vice versa, i.e.,
Mi =
max(Mi−1 −Mstep, 0) Yi < Yi−1
Mi−1 Yi = Yi−1
min(Mi−1 +Mstep, 1) Yi > Yi−1
(1)
where Y is the average luminance of a segment over allframes and pixels, andMstep is backlight variation step thatis 0.2. We choose thisMstep to avoid too little or too muchbacklight variations that may make all or none frequenciesstrategies acceptable. Participants are asked to watch 3 fre-quency versions of a clip in a random order and then move tonext clip. They can make a “unacceptable” decision duringthe backlight-scaled playback while they will need to waituntil the end of playback to confirm “acceptable”.
To better analyze the binary subjective data, we use ac-ceptability A as in [13,18,25], i.e., A = Nacc
Ntot, where Nacc is
the number of acceptable decisions and Ntot is the numberof total votes. We show the acceptability (95% CI) of 4 clipsunder different scaling frequencies in Figure 2. We can ob-serve that QoE is clearly impacted by frequency strategies.Chi-square test between frequency strategies and acceptabil-ity, χ2 = 167.008 df = 2 p < 0.001, further supports thatQoE under different scaling frequencies differs significantlyfrom each other in a statistical sense.
It can also be seen from Figure 2 that shot-based scalingfrequency achieves the best result for all test clips on bothdevices. Its average acceptability reaches 88.75%, and is onaverage 1.82 times and 20.3 times better than the other twomethods, respectively. This could be explained as users paymost attentions to the essential parts of a video, such as ob-jects, people, and stories. Subconsciously, they do not quitecare about the shot switches. Hence, frequent backlight scal-ing in the middle of presenting those essential contents ismuch more annoying than that in shot boundaries. Thereby,we can conclude that shot-based scaling frequency providesa simple yet effective solution to this challenging problem. Itis also noted that QoE results are content-dependent, whichshall guide us to deliberately set the scaling magnitude ofshots based on the content characteristics.
4.2 A Shot Detection Algorithm for DBSWe now present the design of a new shot detection algo-
rithm to determine DBS frequency. Video shot detectionhave been previously studied [27]. Although none of exitingdesigns focuses on DBS, they provide the foundations for theproposed algorithm. Shot detection usually consists of twosteps [28]: computing discontinuity values for consecutiveframes and detecting the shots based on the discontinuity.

Frame Index0 400 800 1200 1600
EMD
0
50
100
150
example hard cut EMD=4.23 Relative EMD=138.17
example hard cut EMD=157.41 Relative EMD=609.91
example non-hard-cut EMD=7.11 Relative EMD=1.05
EMD curveGlobal threshold θ
Figure 3: EMD of “sniper” (first 1600 frames)
Algorithm 1 Proposed Shot Detection Algorithm
1: procedure Shot Detection for DBS2: S ← 0, EMDpre ← EMD(0, 1)3: for k ← 1; k < LastFrame; k ← k + 1 do
4: if EMD(k, k + 1) > θ & EMD(k,k+1)EMDpre
> η then
5: if k + 1− spre ≥ Dmin then6: S ← S ∪ {k + 1}, spre ← k + 1
7: EMDpre ← EMD(k, k + 1)
8: return S . S: set of start frames for shots
We propose to adopt the luminance histogram based dis-continuity metric in DBS. This is because DBS is more powerefficient if we divide a video into segments with distinct lu-minance feature rather than mixing them together. Further-more, luminance metric is robust to missed detection in thecase of DBS since missed detection could occur only whenthe luminance strength between two shots are very similar.This is not a problem as we would assign the same scalingmagnitude to both shots even if we detected them. Summa-rizing these discussions, we set the objective to detect hard-cut shots with abrupt luminance change. It is unnecessaryto detect those shots with gradual transition like dissolves.
We employ Earth Mover’s Distance (EMD) [29], whichis commonly used in image retrieval, as the luminance his-togram feature. EMD is defined as the minimum cost paidto transform one histogram into the other. Formally, EMDbetween histogram P and Q is expressed as:
EMD(P,Q) = (minfij∑i,j fijdij)/(
∑i,j fij)
s.t. fij ≥ 0,∑j fij ≤ Pi,
∑i fij ≤ Qj∑
i,j fij = min(∑i Pi,
∑j Qj)
(2)where fij is the flow amount transported from ith bin tojth bin and dij is ground distance between bin i and j. Wechoose EMD because it is a cross-bin metric that considersboth bin height and inter-bin distance. Unlike bin-to-binmetrics used in conventional shot detection, EMD effectivelycaptures the luminance discontinuity, which makes it a sat-isfactory metric for DBS.
The proposed shot detection exploits EMD for global thresh-olding and relative EMD for local thresholding to make thedetection decision. This is more flexible than conventionalglobal threshold based methods. The reason is that we ob-serve a wide range of EMD values at true hard-cut positions,as exemplified in Figure 2. By incorporating relative thresh-old η, we can ensure that non-hard-cut positions with EMDgreater than global threshold θ would be dropped. Sincemost hardware cannot support per-frame scaling, the shotduration should also be greater than a minimum value Dmin,which is decided to be 5 based on our measurement. Note
Global Threshold0 1 2 3 4 5 6 7 8 9
Acc
urac
y (%
)
0
5
10
15
20False HitsMiss Rate
Figure 4: Overall shot detection accuracy
Table 1: Detection false hits/miss rate (%)sniper bunny birdman boyhood Budapest0/8.06 4.72/2.36 2.63/18.42 0/2.86 0/4.90
imitation selma tear theory whiplash5.00/7.00 2.07/2.07 11.03/5.15 6.06/0 1.57/3.15
ducks oldtown parkrun rushhour redkayak0/0 0/0 0/0 0/0 0/0
that shot detection is not sensitive to this hardware limit asmost shots last more than 1 second and thus per-shot scal-ing can be easily supported. The algorithm is summarizedin Algorithm 1. Specifically, we first calculate the EMD be-tween frame k and its previous/next frame, respectively. IfEMD(k, k + 1) is greater than global threshold and suffi-ciently larger than EMD(k − 1, k), as well as current shotlasting more than Dmin, we can decide that a new videoshot starts from frame k + 1.
We find the proper thresholds by experiments, as com-monly done in shot detection research [27, 28]. We observethat all hard-cut positions have a much larger EMD thantheir neighbors. We go through all 15 training sources anddiscover that EMD values at hard-cut positions are at least13.37 times greater than its prior neighbor while the EMDsat non-hard-cut positions are at most 3.21 times greater.Hence, we conservatively set η to 10 for possible hard cutsthat have relatively small relative EMD.
Next, we range the global threshold from 1 to 8 and showthe overall detection accuracy of all video sources in Figure4, wherein false hits is the ratio of falsely detected shotsto the actual number of shots and miss rate is the ratio ofmissed shots to the actual number of shots. A larger θ allowsless EMD values to pass the global thresholding and thus isless likely for false hits. However, it would also increase thechance of missing true shotsGiven that both curves show sta-ble trends, we can safely determine the optimal θ as 4. Thedetection results for each source under optimal thresholdsare shown in Table 1. The accuracy fulfills the requirementof 5% false hits and miss rate [27] in most cases.
More importantly, we shall report that a false hit is usu-ally found when there is a special lighting in the video, e.g.,multiple camera lights repeatedly on. Thereby, false hitsare not quite dangerous since people can hardly discern abacklight change under those strong lighting effects. On theother hand, the missed shots usually have very similar con-tent luminance to its neighbors, e.g., a talking man from twoshotting angles. Even though those shots are not missed, wewould scale the backlight for them similarly as their neigh-bors. Based on the results and DBS’s insensitivity to shotdetection accuracy, we conclude that the proposed algorithmcan achieve a satisfactory performance for determining scal-ing frequency.

Scaling Magnitude0 0.2 0.4 0.6 0.8 1
Acc
epta
bilit
y
0
0.2
0.4
0.6
0.8
1EMD
shot:31
EMDshot
:66EMD
shot:86
EMDshot
:131EMD
shot:160
Scaling Magnitude0 0.2 0.4 0.6 0.8 1
Acc
epta
bilit
y
0
0.2
0.4
0.6
0.8
1 EMDshot
:31EMD
shot:66
EMDshot
:86EMD
shot:131
EMDshot
:160
Figure 5: Acceptability under different scaling mag-nitude on G Pro (left) and Nexus 4 (right).
5. MODELING DBS MAGNITUDE
5.1 Motivational StudyWe then proceed to determine the smallest possible scal-
ing magnitude of a given video shot. Recall that both scal-ing magnitude and content luminance have strong effects onQoE. Hence, we must analyze the acceptability of shots withdifferent content luminance under different backlight levels.It is desired to represent the luminance feature of a shot byusing EMD because EMD has shown advantages in char-acterizing the luminance as discussed previously. However,we shall need to first obtain a shot’s histogram in order tocompute EMD. Median histogram is a histogram descriptorfor a group of frames and has been widely used in multi-media applications [30]. Each bin of the median histogramis computed by the median bin height over all the framehistograms. We select this descriptor since it can effectivelyeliminate the outlier frames within the shot [30]. Finally, wedefine the luminance feature of a shot, denoted by EMDshot,as the EMD distance between the shot’s median histogramand the constant histogram of a black (zero-intensity) image.A lager EMDshot indicates a brighter content.
We compute EMDshot for all shots in all the trainingvideos. A total of 1014 values are collected and they rangefrom 16 to 185.38. For user study, we divide EMDshot into 5categories (category 5 darkest) with a step of 34 to representdifferent luminance strength of a shot. We then prepare 5test clips accordingly (average duration 9 seconds). Besides,we vary the backlight scaling magnitude from 0.95 to 0.05 ata step of 0.1. The scaling magnitude can span from 0 (turnoff) to 1 (full backlight). Overall, we prepare 50 versions ofbacklight scaled shots (5 EMDshot x 10 M ) for this userstudy. Notice that the backlight is scaled only once at thebeginning of the shot and the “acceptable” quality becomesthe static brightness that users perceive no/tiny differencecompared with the full-backlight version and would enjoy ev-eryday. Participants are first asked to watch a full-backlightversion as a reference. Then 10 scaled versions are playedeither from highest magnitude or from lowest magnitude us-ing Method of Limit as in [13, 18]. Participants will choosewhether or not each version is acceptable. They are allowedto confirm acceptable/unacceptable during the playback.
Eventually, we collect 2000 binary data points for thisstudy (40 participants x 50 video versions). To better visu-alize the binary data and grasp a clear understanding of thedata, we convert the binary data into acceptability as in theprevious section. We show the raw acceptability data for 5
Table 2: Model CoefficientsTerm Estimate Wald Test Likehood Ratio Test
Constant -9.208 z = −13.69 NAEMDshot -0.081 z = −13.62 χ2 = 2526.5 df = 1964M 28.604 z = 15.09 χ2 = 454.1 df = 1963
∗All tests are significant at p < 0.001.
luminance categories in Figure 5. It is clear that the rela-tionship between QoE and backlight is not linear, indicatingpast assumptions, e.g., [4, 8, 9], is not accurate. Instead, weobserve a sigmoid curve (“S” shape curve) for all luminancecategories. Furthermore, the sigmoid curve is horizontallyshifted when EMDshot is varied. For example, darker con-tent can enjoy a higher acceptability than brighter contentunder the same scaling magnitude. Based on the sigmoidcurve, we propose to employ a logistic function, an effectiveoption for QoE modeling according to ITU-T [17], to modelQoE versus scaling magnitude and luminance feature.
5.2 Logistic Regression AnalysisLogistic regression is a statistical analysis for binary re-
sponse data whose probability of being positive is a sigmoidcurve. This perfectly matches our data shown in Figure 5.The logistic function can be written as:
F (~x) =1
1 + exp−(α+βx1+γx2+δx3+··· )(3)
where α, β, γ, · · · are the coefficients and ~x = (x1, x2, · · · )are the predictor variables. In our user study, the predic-tor variables are the three stimuli, i.e., shot EMD, scalingmagnitude of a shot, and device type. We use maximumlikelihood estimation (MLE) to determine the coefficients.Data points that have studentized residuals less than -2 orgreater than 2 are identified as outliers, which follows thestandard logistic modeling in [31].
The modeling results demonstrate that all the predictorsare significant except device type. Specifically, Wald testof device term, z = −1.313, p = 0.189, implies that thecontribution of device type to model fit is not statisticallysignificant. We also run likelihood ratio test to comparethe two models with and without device type. The results,χ2 = 1.734 df = 1 p = 0.187, confirm that including devicetype into the model would not significantly improve modelfit in a statistical sense. This is interesting as it is opposedto conventional video QoE for coding, where larger screensize relatively enlarges the coding artifacts and indeed de-teriorates QoE. In the proposed scenario, however, peoplewould always have an absolute perception of brightness re-gardless of screen size or pixel density. Considering thatsimplicity is always preferred under the same accuracy, wedrop the device predictor and re-model the data using theother two predictors. We show the regression results in Ta-ble 2. We notice that all the coefficients are now statisticallysignificant by passing Wald test and likelihood ratio test.
After model selection, we evaluate goodness of model fit.We carry out likelihood ratio test of model fit to compareour model with the perfect model that uses all degrees offreedom. The results, χ2 = 454.1 df = 1963 p > 0.999,is insignificant and indicate that there is very little unex-plained variance and thus good model fit. We also com-pute multiple metrics of goodness of model fit in Table 3,i.e., root-mean-square error, Nagelkerke pseudo R-squared,
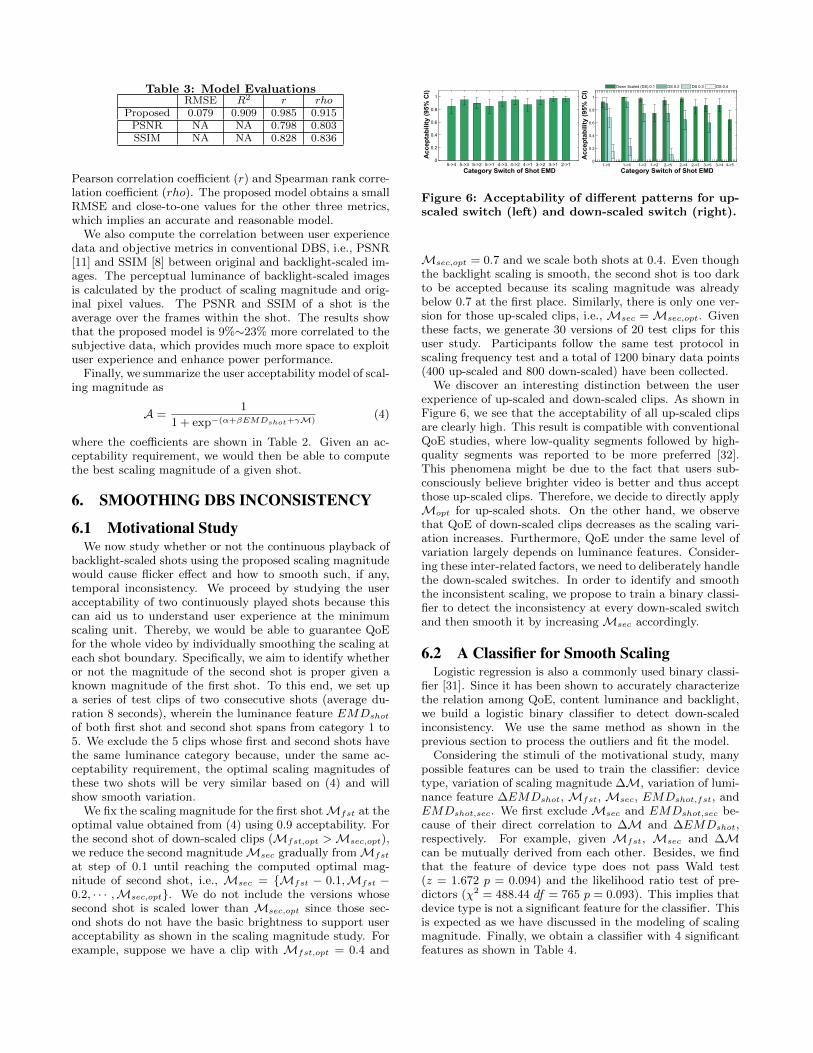
Table 3: Model EvaluationsRMSE R2 r rho
Proposed 0.079 0.909 0.985 0.915PSNR NA NA 0.798 0.803SSIM NA NA 0.828 0.836
Pearson correlation coefficient (r) and Spearman rank corre-lation coefficient (rho). The proposed model obtains a smallRMSE and close-to-one values for the other three metrics,which implies an accurate and reasonable model.
We also compute the correlation between user experiencedata and objective metrics in conventional DBS, i.e., PSNR[11] and SSIM [8] between original and backlight-scaled im-ages. The perceptual luminance of backlight-scaled imagesis calculated by the product of scaling magnitude and orig-inal pixel values. The PSNR and SSIM of a shot is theaverage over the frames within the shot. The results showthat the proposed model is 9%∼23% more correlated to thesubjective data, which provides much more space to exploituser experience and enhance power performance.
Finally, we summarize the user acceptability model of scal-ing magnitude as
A =1
1 + exp−(α+βEMDshot+γM)(4)
where the coefficients are shown in Table 2. Given an ac-ceptability requirement, we would then be able to computethe best scaling magnitude of a given shot.
6. SMOOTHING DBS INCONSISTENCY
6.1 Motivational StudyWe now study whether or not the continuous playback of
backlight-scaled shots using the proposed scaling magnitudewould cause flicker effect and how to smooth such, if any,temporal inconsistency. We proceed by studying the useracceptability of two continuously played shots because thiscan aid us to understand user experience at the minimumscaling unit. Thereby, we would be able to guarantee QoEfor the whole video by individually smoothing the scaling ateach shot boundary. Specifically, we aim to identify whetheror not the magnitude of the second shot is proper given aknown magnitude of the first shot. To this end, we set upa series of test clips of two consecutive shots (average du-ration 8 seconds), wherein the luminance feature EMDshotof both first shot and second shot spans from category 1 to5. We exclude the 5 clips whose first and second shots havethe same luminance category because, under the same ac-ceptability requirement, the optimal scaling magnitudes ofthese two shots will be very similar based on (4) and willshow smooth variation.
We fix the scaling magnitude for the first shotMfst at theoptimal value obtained from (4) using 0.9 acceptability. Forthe second shot of down-scaled clips (Mfst,opt >Msec,opt),we reduce the second magnitudeMsec gradually fromMfst
at step of 0.1 until reaching the computed optimal mag-nitude of second shot, i.e., Msec = {Mfst − 0.1,Mfst −0.2, · · · ,Msec,opt}. We do not include the versions whosesecond shot is scaled lower than Msec,opt since those sec-ond shots do not have the basic brightness to support useracceptability as shown in the scaling magnitude study. Forexample, suppose we have a clip with Mfst,opt = 0.4 and
Category Switch of Shot EMD5->4 5->3 5->2 5->1 4->3 4->2 4->1 3->2 3->1 2->1
Acc
epta
bilit
y (9
5% C
I)
0
0.2
0.4
0.6
0.8
1
Category Switch of Shot EMD1->5 1->4 1->3 1->2 2->5 2->4 2->3 3->5 3->4 4->5
Acc
epta
bilit
y (9
5% C
I)
0
0.2
0.4
0.6
0.8
1
Down Scaled (DS) 0.1 DS 0.2 DS 0.3 DS 0.4
Figure 6: Acceptability of different patterns for up-scaled switch (left) and down-scaled switch (right).
Msec,opt = 0.7 and we scale both shots at 0.4. Even thoughthe backlight scaling is smooth, the second shot is too darkto be accepted because its scaling magnitude was alreadybelow 0.7 at the first place. Similarly, there is only one ver-sion for those up-scaled clips, i.e., Msec =Msec,opt. Giventhese facts, we generate 30 versions of 20 test clips for thisuser study. Participants follow the same test protocol inscaling frequency test and a total of 1200 binary data points(400 up-scaled and 800 down-scaled) have been collected.
We discover an interesting distinction between the userexperience of up-scaled and down-scaled clips. As shown inFigure 6, we see that the acceptability of all up-scaled clipsare clearly high. This result is compatible with conventionalQoE studies, where low-quality segments followed by high-quality segments was reported to be more preferred [32].This phenomena might be due to the fact that users sub-consciously believe brighter video is better and thus acceptthose up-scaled clips. Therefore, we decide to directly applyMopt for up-scaled shots. On the other hand, we observethat QoE of down-scaled clips decreases as the scaling vari-ation increases. Furthermore, QoE under the same level ofvariation largely depends on luminance features. Consider-ing these inter-related factors, we need to deliberately handlethe down-scaled switches. In order to identify and smooththe inconsistent scaling, we propose to train a binary classi-fier to detect the inconsistency at every down-scaled switchand then smooth it by increasing Msec accordingly.
6.2 A Classifier for Smooth ScalingLogistic regression is also a commonly used binary classi-
fier [31]. Since it has been shown to accurately characterizethe relation among QoE, content luminance and backlight,we build a logistic binary classifier to detect down-scaledinconsistency. We use the same method as shown in theprevious section to process the outliers and fit the model.
Considering the stimuli of the motivational study, manypossible features can be used to train the classifier: devicetype, variation of scaling magnitude ∆M, variation of lumi-nance feature ∆EMDshot, Mfst, Msec, EMDshot,fst, andEMDshot,sec. We first exclude Msec and EMDshot,sec be-cause of their direct correlation to ∆M and ∆EMDshot,respectively. For example, given Mfst, Msec and ∆Mcan be mutually derived from each other. Besides, we findthat the feature of device type does not pass Wald test(z = 1.672 p = 0.094) and the likelihood ratio test of pre-dictors (χ2 = 488.44 df = 765 p = 0.093). This implies thatdevice type is not a significant feature for the classifier. Thisis expected as we have discussed in the modeling of scalingmagnitude. Finally, we obtain a classifier with 4 significantfeatures as shown in Table 4.
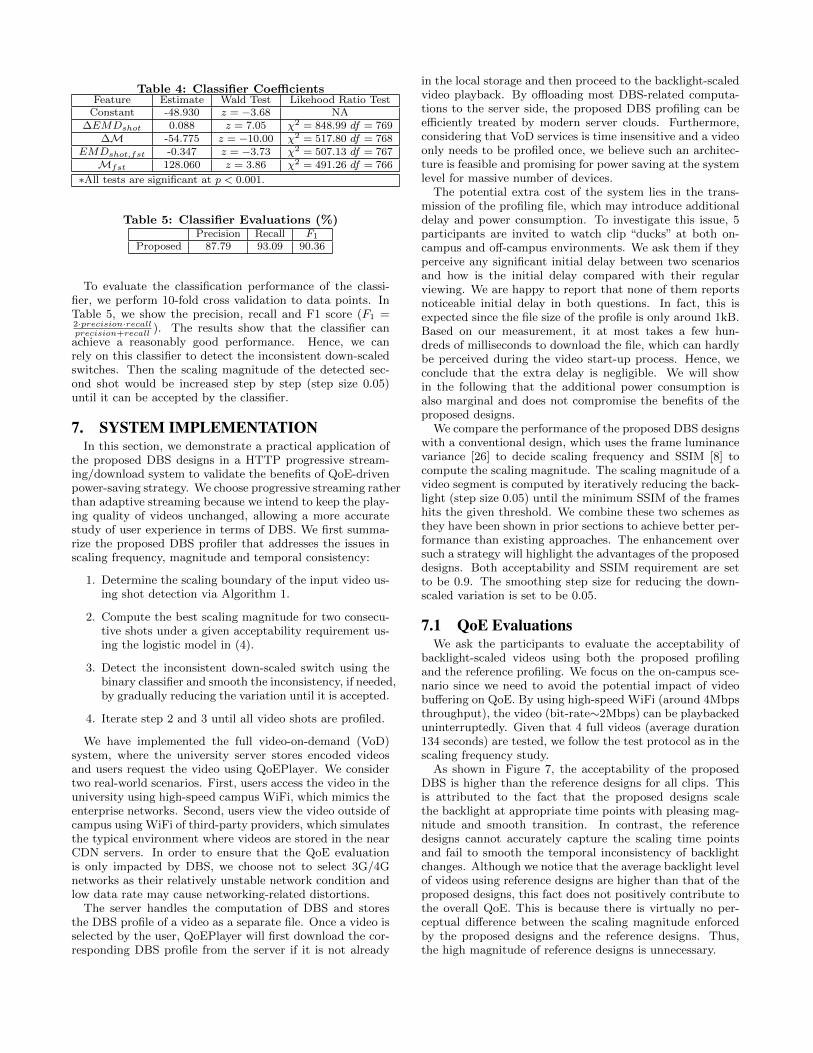
Table 4: Classifier CoefficientsFeature Estimate Wald Test Likehood Ratio Test
Constant -48.930 z = −3.68 NA∆EMDshot 0.088 z = 7.05 χ2 = 848.99 df = 769
∆M -54.775 z = −10.00 χ2 = 517.80 df = 768EMDshot,fst -0.347 z = −3.73 χ2 = 507.13 df = 767Mfst 128.060 z = 3.86 χ2 = 491.26 df = 766
∗All tests are significant at p < 0.001.
Table 5: Classifier Evaluations (%)Precision Recall F1
Proposed 87.79 93.09 90.36
To evaluate the classification performance of the classi-fier, we perform 10-fold cross validation to data points. InTable 5, we show the precision, recall and F1 score (F1 =2·precision·recallprecision+recall
). The results show that the classifier canachieve a reasonably good performance. Hence, we canrely on this classifier to detect the inconsistent down-scaledswitches. Then the scaling magnitude of the detected sec-ond shot would be increased step by step (step size 0.05)until it can be accepted by the classifier.
7. SYSTEM IMPLEMENTATIONIn this section, we demonstrate a practical application of
the proposed DBS designs in a HTTP progressive stream-ing/download system to validate the benefits of QoE-drivenpower-saving strategy. We choose progressive streaming ratherthan adaptive streaming because we intend to keep the play-ing quality of videos unchanged, allowing a more accuratestudy of user experience in terms of DBS. We first summa-rize the proposed DBS profiler that addresses the issues inscaling frequency, magnitude and temporal consistency:
1. Determine the scaling boundary of the input video us-ing shot detection via Algorithm 1.
2. Compute the best scaling magnitude for two consecu-tive shots under a given acceptability requirement us-ing the logistic model in (4).
3. Detect the inconsistent down-scaled switch using thebinary classifier and smooth the inconsistency, if needed,by gradually reducing the variation until it is accepted.
4. Iterate step 2 and 3 until all video shots are profiled.
We have implemented the full video-on-demand (VoD)system, where the university server stores encoded videosand users request the video using QoEPlayer. We considertwo real-world scenarios. First, users access the video in theuniversity using high-speed campus WiFi, which mimics theenterprise networks. Second, users view the video outside ofcampus using WiFi of third-party providers, which simulatesthe typical environment where videos are stored in the nearCDN servers. In order to ensure that the QoE evaluationis only impacted by DBS, we choose not to select 3G/4Gnetworks as their relatively unstable network condition andlow data rate may cause networking-related distortions.
The server handles the computation of DBS and storesthe DBS profile of a video as a separate file. Once a video isselected by the user, QoEPlayer will first download the cor-responding DBS profile from the server if it is not already
in the local storage and then proceed to the backlight-scaledvideo playback. By offloading most DBS-related computa-tions to the server side, the proposed DBS profiling can beefficiently treated by modern server clouds. Furthermore,considering that VoD services is time insensitive and a videoonly needs to be profiled once, we believe such an architec-ture is feasible and promising for power saving at the systemlevel for massive number of devices.
The potential extra cost of the system lies in the trans-mission of the profiling file, which may introduce additionaldelay and power consumption. To investigate this issue, 5participants are invited to watch clip “ducks” at both on-campus and off-campus environments. We ask them if theyperceive any significant initial delay between two scenariosand how is the initial delay compared with their regularviewing. We are happy to report that none of them reportsnoticeable initial delay in both questions. In fact, this isexpected since the file size of the profile is only around 1kB.Based on our measurement, it at most takes a few hun-dreds of milliseconds to download the file, which can hardlybe perceived during the video start-up process. Hence, weconclude that the extra delay is negligible. We will showin the following that the additional power consumption isalso marginal and does not compromise the benefits of theproposed designs.
We compare the performance of the proposed DBS designswith a conventional design, which uses the frame luminancevariance [26] to decide scaling frequency and SSIM [8] tocompute the scaling magnitude. The scaling magnitude of avideo segment is computed by iteratively reducing the back-light (step size 0.05) until the minimum SSIM of the frameshits the given threshold. We combine these two schemes asthey have been shown in prior sections to achieve better per-formance than existing approaches. The enhancement oversuch a strategy will highlight the advantages of the proposeddesigns. Both acceptability and SSIM requirement are setto be 0.9. The smoothing step size for reducing the down-scaled variation is set to be 0.05.
7.1 QoE EvaluationsWe ask the participants to evaluate the acceptability of
backlight-scaled videos using both the proposed profilingand the reference profiling. We focus on the on-campus sce-nario since we need to avoid the potential impact of videobuffering on QoE. By using high-speed WiFi (around 4Mbpsthroughput), the video (bit-rate∼2Mbps) can be playbackeduninterruptedly. Given that 4 full videos (average duration134 seconds) are tested, we follow the test protocol as in thescaling frequency study.
As shown in Figure 7, the acceptability of the proposedDBS is higher than the reference designs for all clips. Thisis attributed to the fact that the proposed designs scalethe backlight at appropriate time points with pleasing mag-nitude and smooth transition. In contrast, the referencedesigns cannot accurately capture the scaling time pointsand fail to smooth the temporal inconsistency of backlightchanges. Although we notice that the average backlight levelof videos using reference designs are higher than that of theproposed designs, this fact does not positively contribute tothe overall QoE. This is because there is virtually no per-ceptual difference between the scaling magnitude enforcedby the proposed designs and the reference designs. Thus,the high magnitude of reference designs is unnecessary.

gonegirl twodays wild foxcatcher
Acc
epta
bilit
y (9
5% C
I)
0
0.2
0.4
0.6
0.8
1
Proposed Compared
gonegirl twodays wild foxcatcher
Acc
epta
bilit
y (9
5% C
I)
0
0.2
0.4
0.6
0.8
1
Proposed Compared
Figure 7: Acceptability on G Pro (left) and Nexus4 (right).
7.2 Power EvaluationsIn order to measure the battery power, we use Qualcomm
Trepn, a measurement tool that directly reads hardwaredata from the devices. The test devices used in the systemlevel evaluations, i.e., LG Optimus G Pro and Google Nexus4, have been listed by Qualcomm as the supported devicesthat enjoy accurate power readings via Trepn [33]. Duringthe system power measuring, we turn off all the unused appsand services. We also close all unnecessary networking ac-tivities, such as automatic update and Bluetooth, and onlykeep video transmission via WiFi active. We measure thepower between the moment when users click a video andthe moment video playback ends. After every measurementround, we make sure the cache is cleared and the entire videowill be transmitted again in the next round.
We obtain the power reduction of different DBS designsbased on the measurement method in [34]. First, we performten rounds of power measurement for a clip using three dif-ferent strategies: (1) full backlight without DBS, (2) theproposed DBS, and (3) the reference DBS. Then the aver-age power of a particular strategy can be computed. Finally,the power reduction of DBS over full-backlight playback is
expressed asPfull−PDBS
Pfull, where Pfull is the average power
without DBS and PDBS is the average power with DBS (ei-ther the proposed designs or the reference designs).
We show the results of power reduction in Figure 8. Weobserve that the proposed DBS designs accomplish a sig-nificant power savings. It can reach up to 42.34% powerreduction depending on the device and content luminance.If a video is filmed in a darker environment and played ona larger screen, e.g., “wild” on G Pro, more power can besaved. The proposed DBS also outperforms conventional ob-jective distortion based DBS by saving up to 20.95% morepower when clip “wild” is tested on LG G Pro. The reason isthat those objective distortion assumptions of conventionaldesigns sacrifice much space for DBS and thus cannot max-imally exploit the advantages of this technique. Althoughone may decrease the SSIM threshold to reduce the powerof the reference designs, its QoE performance would be fur-ther downgraded, which is unacceptable for everyday appli-cations. Therefore, we conclude that the proposed designsachieve best results in terms of both QoE and power.
8. DISCUSSIONLuminance Compensation. To absorb scaling distor-
tion, several schemes have attempted to compensate thepixel luminance first and then scale the backlight. This lumi-nance compensation is not adopted in this research becausewe would like to focus on the inherent correlation amongQoE, backlight scaling, and content luminance at the funda-
gonegirl twodays wild foxcatcher
Pow
er R
educ
tion
(%)
0
10
20
30
40
Proposed Compared
gonegirl twodays wild foxcatcher
Pow
er R
educ
tion
(%)
0
5
10
15
20
25
Proposed Compared
Figure 8: Power Reduction on G Pro (left) andNexus 4 (right).
mental level. Adopting additional enhancement techniques,such as luminance compensation that relies on many objec-tive or linear assumptions, into our study shall complicatethe issues. Through luminance compensation, many imagepixels can be fully compensated and how the resulting con-trast distortion in the backlight-scaled image would impactQoE is unknown. It is true that luminance compensationis a complimentary technique to DBS. However, a separatefull-scale study is definitely needed. Once the relationshipbetween QoE and luminance compensation is better under-stood, we expect to achieve an even higher power saving.
VoD System Design. We have shown that the overheadof the extra profiling file is negligible. Alternatively, the pro-filing information can be easily embedded into the encodedvideo bitstream as supplemental enhancement information(SEI) of H.264 for DBS at each mobile device to save en-ergy. Such embedding as SEI can be seamlessly integratedinto standard VoD systems. This will provide an elegantway to deliver such miniaturized yet essential information.
Note that both adaptive bit-rate streaming and backlightscaling have significant impacts on the overall QoE. Theyare two independent dimension of QoE. For example, inan adaptive streaming system, when one watches a videowith frequently and abruptly scaled backlight, the overallQoE would be bad no matter how high the bit-rate is andhow smooth the rate variation is. Although HTTP adap-tive streaming is not currently supported in the proposeddesigns, this can be achieved easily by adopting a similarmethod to obtain the scaling magnitude and consistencymodels for different bit-rate/resolution. Similarly, DBS strat-egy for those rare video viewing scenarios, e.g., brighter out-door or darker interior, can also be easily obtained.
9. CONCLUSIONIn this paper, we have presented a novel approach for tack-
ling the challenges of systematic power reduction on LCDsmartphones from the perspective of QoE. We explore theQoE effects when dynamic backlight scaling is applied byconducting three motivational studies. Inspired by the in-teresting insights derived from these studies, we propose asuite of designs to address the DBS frequency, magnitudeand temporal consistency. Through devising a VoD systemthat adopts the proposed designs, we demonstrate that theproposed DBS can achieve more than 40% system power sav-ings, which represents a 20% improvement over conventionalnon-QoE schemes, without QoE impairment.
We would like to emphasize that this new approach is fun-damentally different from conventional video QoE researchwhich mainly aims to improve encoding and networking per-formance. This research is indeed a pioneering step towardsexploring QoE to enhance power performance. Especially,
this approach extends a promising dimension for QoE stud-ies. Furthermore, this research represents a significant at-tempt to address the prevailing issue of mobile display powerin the application layer. The preliminary results have shownthat such interdisciplinary research can achieve much desireddisplay power performance in contemporary .
10. ACKNOWLEDGEMENTSThis research is supported by NSF Grants ECCS-1405594
and ECCS-1406154.
11. REFERENCES[1] A. Carroll and G. Heiser. An analysis of power
consumption in a smartphone. In USENIX annualtechnical conference (USENIXATC), June 2010.
[2] DisplaySearch. http://goo.gl/b56ebH.
[3] W.-C. Cheng and M. Pedram. Power minimization ina backlit tft-lcd display by concurrent brightness andcontrast scaling. IEEE Trans. Consum. Electron.,50:25–32, February 2004.
[4] N. Chang, I. Choi, and H. Shim. Dls: dynamicbacklight luminance scaling of liquid crystal display.IEEE Trans. VLSI Syst., 12:837–846, August 2004.
[5] A. Iranli, H. Fatemi, and M. Pedram. Hebs: histogramequalization for backlight scaling. In Proc. of Design,Automation and Test in Europe (DATE), March 2005.
[6] A. Iranli, W. Lee, and M. Pedram. Hvs-awaredynamic backlight scaling in tft-lcds. IEEE Trans.VLSI Syst., 14:1103–1116, October 2006.
[7] A. Bartolini, M. Ruggiero, and L. Benini. Hvs-dbs:human visual system-aware dynamic luminancebacklight scaling for video streaming applications. InACM international conference on Embedded software(EMSOFT), October 2009.
[8] C.-H. Lin, P.-C. Hsiu, and C.-K. Hsieh. Dynamicbacklight scaling optimization: a cloud-basedenergy-saving service for mobile streamingapplications. IEEE Trans. Comput., 63:335–348,February 2014.
[9] Y. Liu, M. Xiao, M. Zhang, X. Li, M. Dong, Z. Ma, Z.Li, and S. Chen. Content-adaptive display powersaving in internet mobile streaming. In ACMNOSSDAV, March 2015.
[10] P. Ni, R. Eg, A. Eichhorn, C. Griwodz, and P.Halvorsen. Flicker effects in adaptive video streamingto handheld devices. In ACM MM, November 2011.
[11] L. Cheng, S. Mohapatra, M. El Zarki, N. Dutt, and N.Venkatasubramanian. Quality-based backlightoptimization for video playback on handheld devices.Advances in Multimedia, 2007(1):4–4, 2007.
[12] W. Lin and C.-C. Kuo. Perceptual visual qualitymetrics: a survey. Journal of Visual Communicationand Image Representation, 22:297–312, May 2011.
[13] W. Song and D. Tjondronegoro. Acceptability-basedqoe models for mobile video. IEEE Trans. Multimedia,16:738–750, April 2014.
[14] F. Zhang, W. Lin, Z. Chen, and K. N. Ngan. Additivelog-logistic model for networked video qualityassessment. IEEE Trans. Image Process.,16:1536–1547, April 2013.
[15] C. Alberti, D. Renzi, C. Timmerer, C. Mueller,S. Lederer, S. Battista, and M. Mattavelli. Automatedqoe evaluation of dynamic adaptive streaming overhttp. In IEEE QoMEX, July 2013.
[16] Z. Yan, J. Xue, and C. W. Chen. QoE continuumdriven HTTP adaptive streaming over multi-clientwireless networks. In IEEE International Conferenceon Multimedia and Expo (ICME), July 2014.
[17] Opinion model for video-telephony applications.ITU-T Recommendation G.1070. 2007.
[18] W. Song, D. Tjondronegoro, and M. Docherty. Savingbitrate vs. pleasing users: where is the breakeven pointin mobile video quality. In ACM MM, November 2011.
[19] H. Knoche, J. McCarthy, and M. Sasse. Can small bebeautiful?: assessing image resolution requirements formobile tv. In ACM MM, November 2005.
[20] GT Fechner. Element of psychophysics. New York:Holt, Rinehart and Winston, 1966.
[21] A. Balachandran, V. Aggarwal, E. Halepovic, J. Pang,S. Seshan, S. Venkataraman, and H. Yan. Modelingweb quality-of-experience on cellular networks. InACM MobiCom, September 2014.
[22] A. Balachandran, V. Sekar, A. Akella, S. Seshan, I.Stoica, and H. Zhang. Developing a predictive modelof quality of experience for internet video. In ACMSIGCOMM, August 2013.
[23] Xiph. https://media.xiph.org/video/derf/.
[24] DisplayMate. Smartphone displays under brightambient lighting shoot-out. http://goo.gl/n89Kgo.
[25] W. Song, D. Tjondronegoro, and I. Himawan.Acceptability-based qoe management for user-centricmobile video delivery: a field study evaluation. InACM MM, November 2014.
[26] S. Pasricha, M. Luthra, Shivajit Mohapatra, N. Dutt,and N. Venkatasubramanian. Dynamic backlightadaptation for low-power handheld devices. IEEE Des.Test. Comput., 21:398–405, September 2004.
[27] R. Lienhart. Comparison of automatic shot boundarydetection algorithms. In SPIE Electronic Imaging,pages 290–301, 1998.
[28] A. Hanjalic. Shot-boundary detection: unraveled andresolved? IEEE Trans. Circuits Syst. Video Technol.,12:90–105, February 2002.
[29] Y. Rubner, C. Tomasi, and L. Guibas. The earthmover’s distance as a metric for image retrieval.International journal of computer vision, 40:99–121,November 2000.
[30] A M. Ferman, A M. Tekalp, and R. Mehrotra. Robustcolor histogram descriptors for video segment retrievaland identification. IEEE Trans. Image Process.,11:497–508, May 2002.
[31] R. Christensen. Log-Linear Models and LogisticRegression. Springer-Verlag, New York, USA, 1997.
[32] M. Zink, O. Kunzel, J. Schmitt, and R. Steinmetz.Subjective impression of variations in layer encodedvideos. In IEEE/ACM IWQoS, June 2003.
[33] Qualcomm. Devices that report accurate batterypower. http://goo.gl/ZecX96.
[34] M. Dong and L. Zhong. Power modeling andoptimization for oled displays. IEEE Trans. MobileComput., 11:1587–1599, September 2012.


![[MS-QoE]: Quality of Experience Monitoring Server ProtocolMS-QoE]-180828.pdf · 1 / 176 [MS-QoE] - v20180828 Quality of Experience Monitoring Server Protocol Copyright © 2018 Microsoft](https://img.pdfslide.us/doc/110x75/5e79f5bbeb0b920b1f313c68/ms-qoe-quality-of-experience-monitoring-server-protocol-ms-qoe-180828pdf.jpg)