Embed Size (px)
Citation preview
International Electronic Journal of Environmental Education Vol.5, Issue 1, 2015, 21-39 RESEARCH ARTICLE
ISSN: 2146-0329
*Corresponding Author: Fatma TASKIN-EKICI,
E-mail: [email protected]
Exploring PreExploring PreExploring PreExploring Pre----Service Elementary Teachers’ Service Elementary Teachers’ Service Elementary Teachers’ Service Elementary Teachers’ Mental Models of the EnvironmentMental Models of the EnvironmentMental Models of the EnvironmentMental Models of the Environment****
Fatma TASFatma TASFatma TASFatma TASKINKINKINKIN----EKICIEKICIEKICIEKICIaaaa
Pamukkale University, Denizli, TURKEY
Erhan EKICIErhan EKICIErhan EKICIErhan EKICI Pamukkale University, Denizli, TURKEY
Hulusi COKADARHulusi COKADARHulusi COKADARHulusi COKADAR Pamukkale University, Denizli, TURKEY
IntroductionIntroductionIntroductionIntroduction
Though the development in science and technology increases the life standards of people, the development reveals a lot of environmental issues. While humans develop science and technology, they cause emergence of new environmental problems. According to this point of view, peoples’ attitudes and behaviors are origin of environmental issues and this is an educational issue. Loughland, Reid and Petocz (2002) have stated that environmental education is seen to be an important strategy in achieving environmental improvement. The general purpose of environmental education is to provide individuals with the knowledge and skills necessary to protect and improve the environment for all living things (Moseley, Desjean-Perrotta, & Utley, 2010). Teachers must be aware of that factors that shape their environmental understanding to get through the goals indicated by North American Association for Environmental Education “NAAEE” (2004a). The Guidelines for the Initial Preparation and Professional Development of Environmental Educators of the NAAEE, (2004b) states,
The goal of environmental education is to develop a world population that is aware of, and concerned about, the environment and its associated problems, and which has the knowledge, skills, attitudes, motivations, and commitment to work individually and collectively toward solutions of current problems and the prevention of new ones (p. 2).
AbstractAbstractAbstractAbstract
This study aims to explore pre-service elementary teachers’ understandings of the environment. A survey method was carried out in this study. A close-ended questionnaire and Draw-An-Environment Test (DAET) are administered to pre-service teachers (N=255) after instruction of an Environmental Education course. A rubric (DAET-R) is used for assessing the mental models or images of the environment held by pre-service teachers. Results of this study suggest that the participants’ mental models of the environment are incomplete. Majority of participants’ drawings reflect biotic and abiotic environment. Few drawings include human beings as a part of the environment. The results shows that mean scores do not differ regarding to gender, environmental education background, high school type, parental education level, parental occupation, and monthly family income.
Key words:Key words:Key words:Key words: Mental model, environment, education, pre-service teachers, drawing
Exploring Pre-Service Elementary Teachers’ Mental Models of the Environment
22
According to the Guidelines, “educators must possess the understanding, skills and attitudes associated with environmental literacy,” and “environmental literacy hinges on understanding the processes and systems that comprise the environment, including human systems and their influence” (p. 7) (NAAEE 2004b). A large part of our environmental understanding that directs our environmental behavior is derived from sociocultural factors and formal education (Duit, 1991; Payne, 1998).
“Students’ conceptualizations of the environment or their mental models shape the ways in which they understand an environmental issue and guides their environmental behaviors” (Shepardson, Wee, & Harbor, 2007; p328), and this fact is also true for teachers (Moseley et al., 2010). According to these researchers, before teachers can understand environmental issues, firstly they must conceptualize what the environment is, what factors are present in the environment, and how those factors interact to shape and characterize the environment. So, investigating future educators’ knowing and understanding about environmental issues is more important. In order to accomplish the general purpose of the environmental education, individuals both pre- and in-service teachers and students understand the factors that shape their beliefs and perceiving the environment (Moseley et al., 2010).
Theoretical Framework
This research is grounded in mental model theory. Drawings have been used to expose thinking patterns of pre-service elementary teachers in this study. Coll and Treagust (2003) have been defined mental models as representations of reality that people use to understand specific phenomena and make sense of the physical world. Individuals create cognitive or mental models that are based on prior knowledge, existing ideas and past experiences in order to interpret and explain events in the world around them (Moseley et al., 2010). Mental models are incomplete, imprecise and incoherent with the specific domain knowledge (Reinfried, 2006). Although these specific features, Greca and Moreira (2000) states that they are useful, since they are powerful explicative and predictive tools for the interaction of an individual with the world. Reinfried (2006), in her study, asserted that diagnosing the students’ incorrect preconceptions and mental models would be a crucial step of teacher-facilitated mental model building process at all grade levels.
Mental Models
The term “mental model” has been used in many contexts and it plays a significant role in human reasoning. It was formulated, initially, by Kenneth Craik in 1943. Craik proposed that people reason, in general, by carrying out thought experiments on internal models (Nersessian, 1992). Mental models refer to individuals’ internal, mental representations of external, physical phenomena or systems (Gilbert, Boulter, & Elmer, 2000; Vosniadou & Brewer, 1992, 1994). The major feature of this mental representation is its analogous structure to what is represented. That is, a mental model can be thought of as an imaginary structure that corresponds to the externally represented or perceived system in terms of the spatial arrangement of elements involved in the system and the relationships between or among these elements (Chiou & Anderson, 2010). Mental models influence cognitive functioning and can provide science education researchers and teachers with valuable information about the learners’ conceptual framework, that is, their underlying knowledge structures (Vosniadou, 1994). Mental models may serve a number of purposes and function to provide explanations and justifications and to serve as mnemonic devices for memory enhancement (Coll & Treagust, 2003). An important, often overlooked, function that
Taskın-Ekici, Ekici and Cokadar
23
mental models serve is to predict behavior (Williams, Hollan & Stevens, 1983). Mental models can also be divided into physical and conceptual mental models, where physical models represent the physical world; conceptual models represent more abstract matters (Johnson-Laird, 1983). Physical mental models are mental constructs of physical entities—real or imagined, whereas conceptual mental models are mental constructs of concepts, models, or abstractions (Coll & Treagust, 2003).
Drawings
Researchers have used drawings to examine thoughts and attitudes about various content areas for years. These studies usually involve elementary students, rather than the teachers themselves (Burton, 2012). The reason that drawing studies is done with elementary level students may be easier to summarize their ideas with drawings than to receive answers or to obtain verbal or written data during these ages.
Peoples have cognitive or mental models in the base of their prior knowledge, experience and related ideas and they serve the mental and/or cognitive models for the aim of explaining things in their life. Strauss (2001) suggested that mental models are the appropriate psychological entity to be addressed in the study of teacher cognition. Strauss asserted that an implicit mental model organizes thinking and teaching behaviors. Similarly, Haim, Strauss and Ravid (2004) explored how teachers’ mental models related to their subject-matter knowledge. Contrary to traditional claims of the importance of subject-matter knowledge in their instructional behaviors, they found teachers’ mental models, rather than teachers’ depth of content knowledge, drove their instructional practices. Therefore, investigating and summarizing mental and/or cognitive models of pre-service and/or in-service teachers related to environment is important.
A lot of research studies have been done related to students’ mental models in “physics education” (e.g. Borges & Gilbert, 1999; Hubber, 2006; Jabot, & Henry, 2007), “chemistry education” (e.g. Adbo & Taber, 2009; Chittleborough, 2004; Coll & Treagust, 2003a,b; Lin & Chiu, 2010; McClary & Talanquer, 2011), “biology education” (e.g. Chang, 2007; d’Apollonia, Charles & Boyd, 2004; Patrick, 2006), “environmental education” (e.g. Reinfried, 2006; Shepardson, Choi, Niyogi, & Charusombat, 2011; Shepardson, Wee, Priddy & Harbor, 2007), “earth sciences education” (e.g. Gobert, 2000; Panagiotaki, Nobes, & Potton 2009), “astronomy education” (e.g. Cin, 2013; Samarapungavan, Vosniadou & Brewer, 1996; Vosniadou & Brewer, 1994).
Drawing images before writing or verbalizing ideas can foster more creative responses and help generate ideas, because often language can slow down the creative process (Caldwell, & Moore, 1991). In addition, it has been stated that exploration of ideas through drawing does not require the cognitive demands often found when using language. Therefore, drawings are usable with adults, as well as children, to explore both conscious and unconscious thoughts, experiences, and emotions. Several researches have also been done related to pre- and in-service teachers’ mental models about “science teaching” (Minogue, 2010; Tatar, Yildiz Feyzioglu, Buldur, & Akpinar, 2012; Subramaniam, 2013; Ucar, 2012; Wilke & Losh, 2012), “specific scientific issues” (Chiou & Anderson, 2010; Heywood, Parker & Rowlands, 2013) “technology” (Krauskopf, Zahn & Hesse, 2012; Zhang & Xu, 2011), “ideal teacher” (Mensah, 2011), “environment” (Desjean-Perrotta, Moseley, & Cantu, 2008; Moseley et al., 2010), and “classroom structure” (Matteson, Ganesh, Coward, & Patrick, 2012).
Environmental education research studies have frequently examined the relationships between environmental knowledge, attitudes, behaviors, and literacy. Examples for these studies are Boeve-de Pauw and Van Petegem, (2011), Carrier (2007), Digby
Exploring Pre-Service Elementary Teachers’ Mental Models of the Environment
24
(2010), Evans (2007), Prabawa-Sear and Baudains (2011), Robelia and Murphy (2012), Tal (2010), and Teksoz, Sahin and Tekkaya-Oztekin (2012). There are a few studies about individuals’ mental models of the environment (Moseley et al., 2010).
Pre-service teachers will play a critical role as they will be responsible for the education of a significant proportion of the young people in the future. Teachers have also key role for effective environmental education in the classroom and teachers can influence pupils’ worldviews and attitudes, their interactions with the environment, participation in decision-making and ability to make informed responsible choices (McKeown and Hopkins 2002). If teachers (or pre-service teachers as teachers of the future) lack knowledge, skills or commitment, it is unlikely that they will succeed as leaders of environmental change in schools and produce environmentally literate students (Wilke 1985; NAAEE 2004). For this reason, in this research, we aimed to investigate pre-service elementary teachers’ mental models of the environment.
Research Questions
Two research questions guided this study in pre-service elementary teachers’ mental models of the environment. First, “what are pre-service elementary teachers’ mental models of the environment?” Moseley and her colleagues (2010) suggested an investigation whether learners’ mental models differ according to their age, gender, socioeconomic status (SES) and cultural structure in their report for future researches. Therefore, the second research question is, “Are there a significance between pre-service elementary teachers’ drawing scores by their socioeconomic status, gender, parental education level and parental occupation, family income?”
MethodologyMethodologyMethodologyMethodology
Participants and Course Context
Participants in this study were 255 second-year students (n=255; male, n=75; female, n=180) from a state university of Education Faculty, elementary level teacher program. The aim of this program is to prepare elementary teachers for grades 1-4. Two instructors teach the Environmental Education course in third semester of the program in six classes. The Environmental Education course is offered to students after accomplishment other specific science courses (e.g. biology, chemistry). The compulsory course content includes the some issues such as basic concepts and principles of ecology, ecosystems, food chain, food web, habitat, competition, symbiosis, mutual life, survival of life, soil biomes, energy flow, circulation of matter, increasing of population, ecological impact, erosion, deforestation, urban environment, behavioral pollution, environmental pollution, marsh and waste waters, environment-related decision-making, soil and water resources and their management, environmental sensitivity, environmental institutions and organizations in Turkey and in the World.
Research Instruments
To answer the research questions, a survey method was used by an instrument consisting of fixed-response and open-ended sections. The former includes questions to compile participants’ demographic characteristics (gender, age, mother’s education, father’s education, mother’s occupation, and father’s occupation). The latter section of the instrument (Draw-An-Environment Test, DAET) was asked participants to draw and
Taskın-Ekici, Ekici and Cokadar
25
define the environment. DAET was adapted by Desjean-Perrotta, Moseley and Cantu (2008) from an instrument was developed by Shepardson (2005). The first part of the DAET has the prompt ‘My drawing of the environment is…’ with room on the page for a drawing. The second part of the instrument contains the prompt to complete the sentence ‘My definition of the environment is…’ (Appendix A). Open-ended responses have limitations: They may be short, lack depth, and possibly be difficult to code if the writing is illegible or the grammar or sentence construction is difficult to understand.
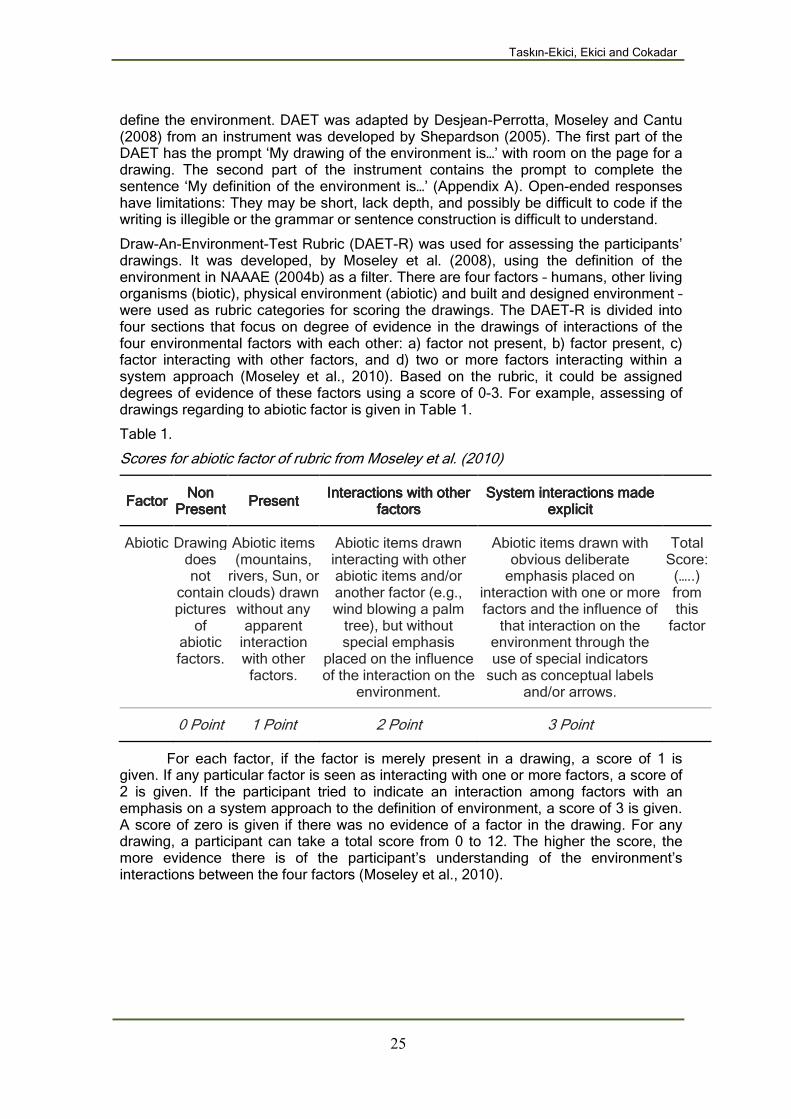
Draw-An-Environment-Test Rubric (DAET-R) was used for assessing the participants’ drawings. It was developed, by Moseley et al. (2008), using the definition of the environment in NAAAE (2004b) as a filter. There are four factors – humans, other living organisms (biotic), physical environment (abiotic) and built and designed environment – were used as rubric categories for scoring the drawings. The DAET-R is divided into four sections that focus on degree of evidence in the drawings of interactions of the four environmental factors with each other: a) factor not present, b) factor present, c) factor interacting with other factors, and d) two or more factors interacting within a system approach (Moseley et al., 2010). Based on the rubric, it could be assigned degrees of evidence of these factors using a score of 0-3. For example, assessing of drawings regarding to abiotic factor is given in Table 1.
Table 1.
Scores for abiotic factor of rubric from Moseley et al. (2010)
FactorFactorFactorFactor Non Non Non Non
PresentPresentPresentPresent PresentPresentPresentPresent
Interactions with other Interactions with other Interactions with other Interactions with other factorsfactorsfactorsfactors
System interactions made System interactions made System interactions made System interactions made explicitexplicitexplicitexplicit
Abiotic Drawing does not
contain pictures
of abiotic factors.
Abiotic items (mountains,
rivers, Sun, or clouds) drawn
without any apparent
interaction with other factors.
Abiotic items drawn interacting with other abiotic items and/or another factor (e.g., wind blowing a palm
tree), but without special emphasis
placed on the influence of the interaction on the
environment.
Abiotic items drawn with obvious deliberate
emphasis placed on interaction with one or more factors and the influence of
that interaction on the environment through the use of special indicators
such as conceptual labels and/or arrows.
Total Score:
(…..) from this
factor
0 Point 1 Point 2 Point 3 Point
For each factor, if the factor is merely present in a drawing, a score of 1 is given. If any particular factor is seen as interacting with one or more factors, a score of 2 is given. If the participant tried to indicate an interaction among factors with an emphasis on a system approach to the definition of environment, a score of 3 is given. A score of zero is given if there was no evidence of a factor in the drawing. For any drawing, a participant can take a total score from 0 to 12. The higher the score, the more evidence there is of the participant’s understanding of the environment’s interactions between the four factors (Moseley et al., 2010).
Exploring Pre-Service Elementary Teachers’ Mental Models of the Environment
26
The Collection of Data
Data were collected during an Environmental Education course hour in last week of December 2012 (at the end of the semester). Instructors, in six sections of the course for participants, administered the DAET using a common set of directions as printed on the survey. Pre-service teachers first drew a picture of the environment and then wrote their definition of the environment by completing an open-ended sentence. Their drawings were intended to provide not only a complementary source of how they represented their mental models in addition to their verbal reports but also a means of gaining rich information about their inner analogue representations of the environment. No time limit was given to complete the survey, but most of the surveys were completed in an average of 20 minutes. The pre-service teachers’ surveys were collected and coded to assure anonymity.
Data Analysis
A descriptive analysis method was used to evaluate data. Initially, the background characteristics of the participants had been recorded and documented in frequencies and percentages. Then, participants’ drawings evaluated according to the DAET-R and individual scores were compared and consensus was achieved among the scorers for each drawing. Lastly, data were used to determine frequency of factors and interactions of those factors. Statistical significance was determined using α= .05 alpha level. Independent samples t-test and one-way ANOVA were used in data analysis.
Validity and Reliability of the Instrument DAET-R
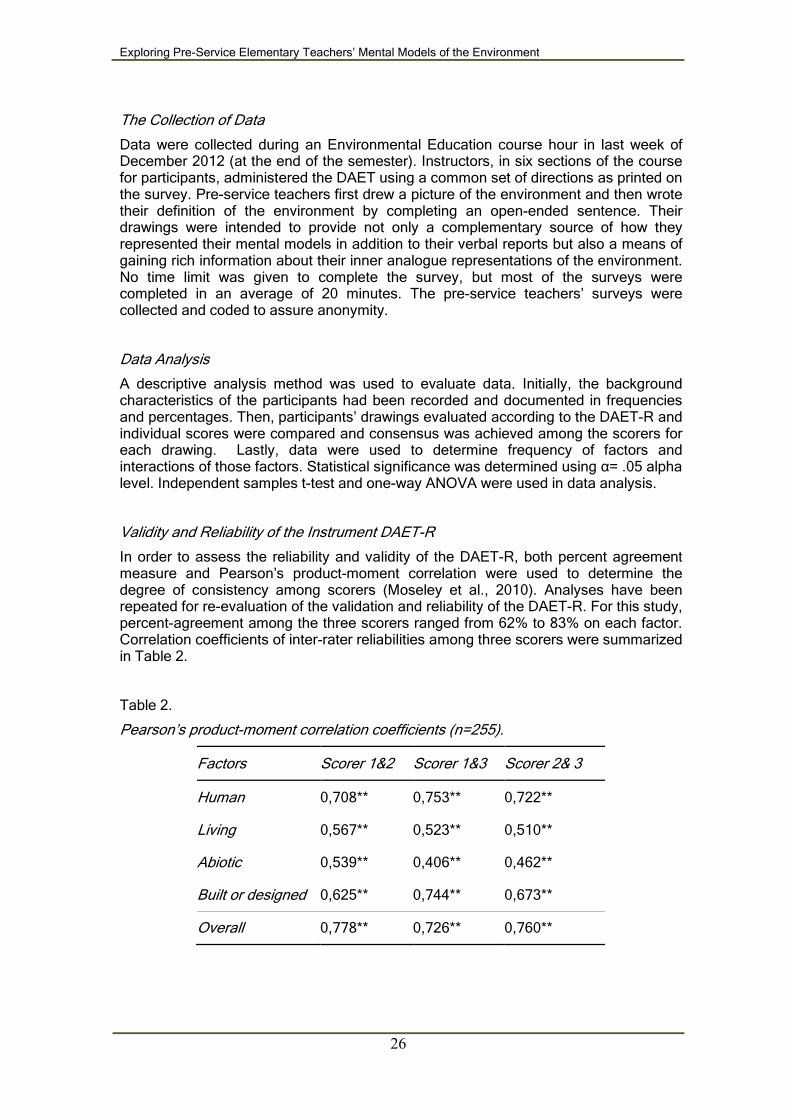
In order to assess the reliability and validity of the DAET-R, both percent agreement measure and Pearson’s product-moment correlation were used to determine the degree of consistency among scorers (Moseley et al., 2010). Analyses have been repeated for re-evaluation of the validation and reliability of the DAET-R. For this study, percent-agreement among the three scorers ranged from 62% to 83% on each factor. Correlation coefficients of inter-rater reliabilities among three scorers were summarized in Table 2.
Table 2.
Pearson’s product-moment correlation coefficients (n=255).
Factors Scorer 1&2 Scorer 1&3 Scorer 2& 3
Human 0,708** 0,753** 0,722**
Living 0,567** 0,523** 0,510**
Abiotic 0,539** 0,406** 0,462**
Built or designed 0,625** 0,744** 0,673**
Overall 0,778** 0,726** 0,760**
Taskın-Ekici, Ekici and Cokadar
27
ResultsResultsResultsResults
Demographic Characteristics
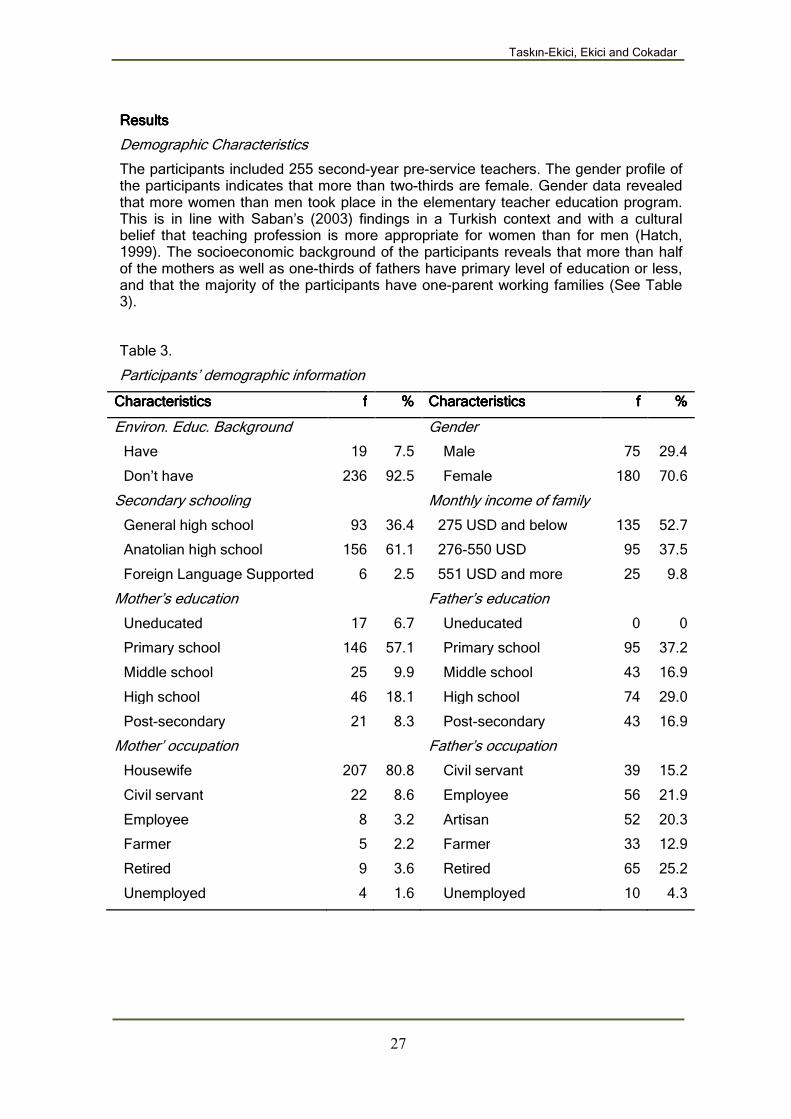
The participants included 255 second-year pre-service teachers. The gender profile of the participants indicates that more than two-thirds are female. Gender data revealed that more women than men took place in the elementary teacher education program. This is in line with Saban’s (2003) findings in a Turkish context and with a cultural belief that teaching profession is more appropriate for women than for men (Hatch, 1999). The socioeconomic background of the participants reveals that more than half of the mothers as well as one-thirds of fathers have primary level of education or less, and that the majority of the participants have one-parent working families (See Table 3).
Table 3.
Participants’ demographic information
CharacteristicsCharacteristicsCharacteristicsCharacteristics ffff %%%% CharacteristicsCharacteristicsCharacteristicsCharacteristics ffff %%%%
Environ. Educ. Background Gender
Have 19 7.5 Male 75 29.4
Don’t have 236 92.5 Female 180 70.6
Secondary schooling Monthly income of family
General high school 93 36.4 275 USD and below 135 52.7
Anatolian high school 156 61.1 276-550 USD 95 37.5
Foreign Language Supported 6 2.5 551 USD and more 25 9.8
Mother’s education Father’s education
Uneducated 17 6.7 Uneducated 0 0
Primary school 146 57.1 Primary school 95 37.2
Middle school 25 9.9 Middle school 43 16.9
High school 46 18.1 High school 74 29.0
Post-secondary 21 8.3 Post-secondary 43 16.9
Mother’ occupation Father’s occupation
Housewife 207 80.8 Civil servant 39 15.2
Civil servant 22 8.6 Employee 56 21.9
Employee 8 3.2 Artisan 52 20.3
Farmer 5 2.2 Farmer 33 12.9
Retired 9 3.6 Retired 65 25.2
Unemployed 4 1.6 Unemployed 10 4.3
Exploring Pre-Service Elementary Teachers’ Mental Models of the Environment
Drawing Scores of Factors
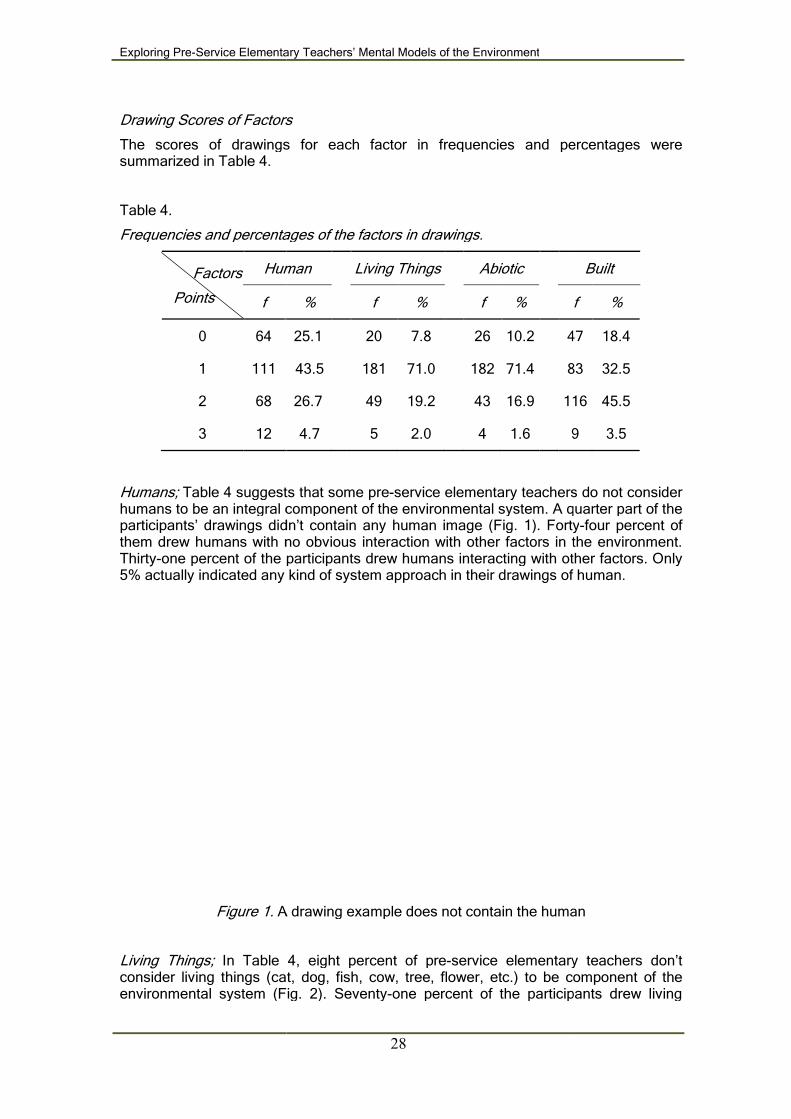
The scores of drawings for each factor in frequencies and percentages were summarized in Table 4.
Table 4.
Frequencies and percentages of the factors in drawings.
Factors
Points
Human
f
0 64
1 111
2 68
3 12
Humans; Table 4 suggests that some prehumans to be an integral component of the environmental system. A quarter part of the participants’ drawings didn’t contain any human image (Fig. 1). Fortythem drew humans with no obvious interaction with other factors in the environment. Thirty-one percent of the participants drew humans interacting with other factors. Only 5% actually indicated any kind of system approach in their drawings of human.
Figure 1. A drawing example does not contain the human
Living Things; In Table 4, eight percent of preconsider living things (cat, dog, fish, cow, tree, flower, etc.) to be component of the environmental system (Fig. 2). Seventy
Service Elementary Teachers’ Mental Models of the Environment
28
Drawing Scores of Factors
The scores of drawings for each factor in frequencies and percentages were
Frequencies and percentages of the factors in drawings.
Human
Living Things Abiotic
% f % f %
25.1 20 7.8 26 10.2 47
43.5 181 71.0 182 71.4 83
26.7 49 19.2 43 16.9 116
4.7 5 2.0 4 1.6 9
Table 4 suggests that some pre-service elementary teachers do not consider humans to be an integral component of the environmental system. A quarter part of the participants’ drawings didn’t contain any human image (Fig. 1). Fortythem drew humans with no obvious interaction with other factors in the environment.
one percent of the participants drew humans interacting with other factors. Only 5% actually indicated any kind of system approach in their drawings of human.
A drawing example does not contain the human
In Table 4, eight percent of pre-service elementary teachers don’t consider living things (cat, dog, fish, cow, tree, flower, etc.) to be component of the environmental system (Fig. 2). Seventy-one percent of the participants drew living
The scores of drawings for each factor in frequencies and percentages were
Built
f %
47 18.4
83 32.5
116 45.5
9 3.5
service elementary teachers do not consider humans to be an integral component of the environmental system. A quarter part of the participants’ drawings didn’t contain any human image (Fig. 1). Forty-four percent of them drew humans with no obvious interaction with other factors in the environment.
one percent of the participants drew humans interacting with other factors. Only 5% actually indicated any kind of system approach in their drawings of human.
A drawing example does not contain the human
service elementary teachers don’t consider living things (cat, dog, fish, cow, tree, flower, etc.) to be component of the
one percent of the participants drew living
things with no obvious interaction with other factors in the environment. Twentypercent of the participants drew living things interacting with other factors. Only two percent of them actually indicated any kind of system approach in their drawings of living things.
Figure 2. A drawing example does not contain living things
Abiotic; According to Table 4, ten percent of participants do not consider abiotic components (e.g. mountain, sun, cloud, river, etc.) as a part of the environmental system (Fig. 3). Seventy-oneno obvious interaction with other factors in the environment. Seventeen percent of the participants drew abiotic interacting with other factors. Only two percent of them actually indicated any kind
Figure 3. A drawing example does not contain the
Taskın-Ekici, Ekici and Cokadar
29
vious interaction with other factors in the environment. Twentypercent of the participants drew living things interacting with other factors. Only two percent of them actually indicated any kind of system approach in their drawings of
A drawing example does not contain living things
According to Table 4, ten percent of participants do not consider abiotic components (e.g. mountain, sun, cloud, river, etc.) as a part of the environmental
one per cent of the participants drew abiotic components with no obvious interaction with other factors in the environment. Seventeen percent of the participants drew abiotic interacting with other factors. Only two percent of them actually indicated any kind of system approach in their drawings of abiotic (non
A drawing example does not contain the abiotic components
Ekici, Ekici and Cokadar
vious interaction with other factors in the environment. Twenty-one percent of the participants drew living things interacting with other factors. Only two percent of them actually indicated any kind of system approach in their drawings of
A drawing example does not contain living things
According to Table 4, ten percent of participants do not consider abiotic components (e.g. mountain, sun, cloud, river, etc.) as a part of the environmental
per cent of the participants drew abiotic components with no obvious interaction with other factors in the environment. Seventeen percent of the participants drew abiotic interacting with other factors. Only two percent of them
of system approach in their drawings of abiotic (non-living).
abiotic components
Exploring Pre-Service Elementary Teachers’ Mental Models of the Environment
Human Built or Designed Objects; service elementary teachers don’t consider human built or designed objects (e.g. factory, car, building, etc.) as a component of environmental system. Thirtyof the participants drew objects witenvironment (Fig. 4). Fortydesigned objects interacting with other factors. Only four percent of them actually indicated any kind of system approach inobjects.
Figure 4. A drawing example does not contain built or designed objects
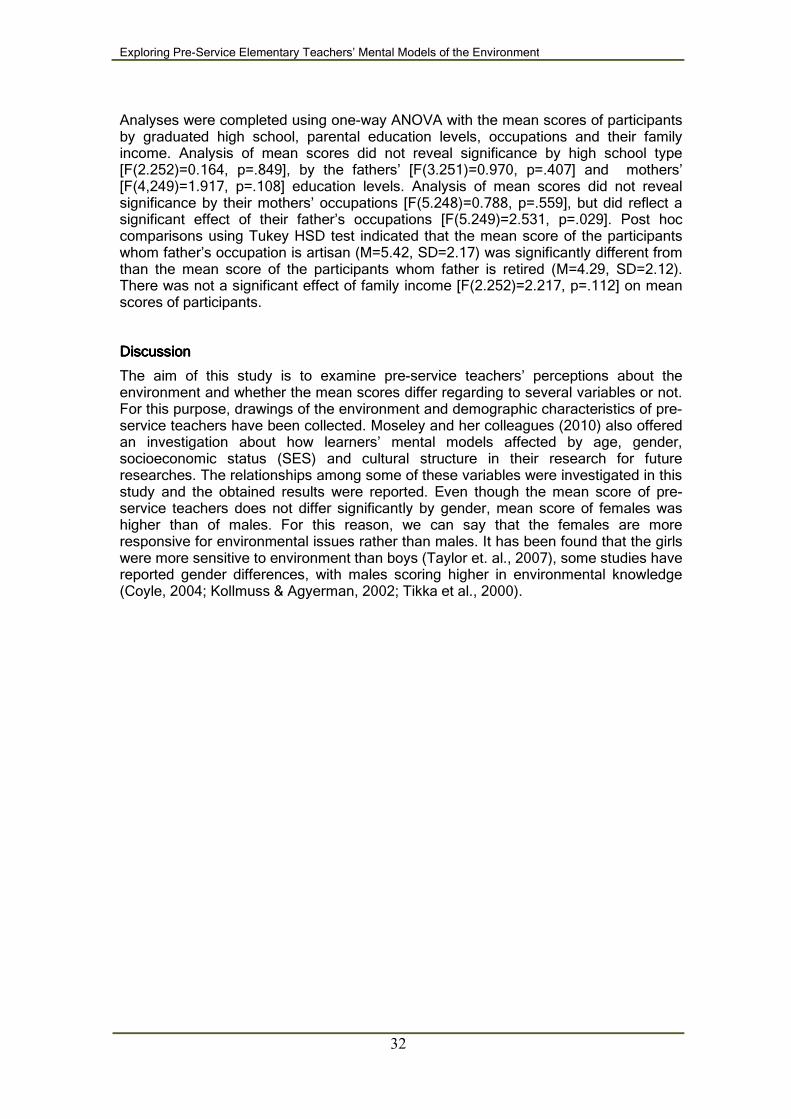
Participants’ total scores of drawings were divided into three broad categories; Model 1: one or more factors present, Model 2: ofactor, and Model 3: two or three factors interacting within a system approach (Table 5). These categories were defined for the participants’ mind models. Model 1 has one or more factors, 43.5% of participants hainteracting with another factor and 52.5% of participants have this model. Model 3 has two or three factors interacting within a system approach. Only 4.0% of participants have this model.
Table 5.
Frequencies and percentages of total scores in three categories
Total Points
Categories
0-4 Model 1: Factor present
5-8 Model 2: Factor interacting with other factor
9-12 Model 3: Factor interacting with two or more factor with system
Service Elementary Teachers’ Mental Models of the Environment
30
Human Built or Designed Objects; According to Table 4, eighteen percent of the preservice elementary teachers don’t consider human built or designed objects (e.g. factory, car, building, etc.) as a component of environmental system. Thirtyof the participants drew objects with no obvious interaction with other factors in the environment (Fig. 4). Forty-nine percent of the participants drew human built or designed objects interacting with other factors. Only four percent of them actually indicated any kind of system approach in their drawings of human built or designed
A drawing example does not contain built or designed objects
Participants’ total scores of drawings were divided into three broad categories; Model 1: one or more factors present, Model 2: one or two factors interacting with another factor, and Model 3: two or three factors interacting within a system approach (Table 5). These categories were defined for the participants’ mind models. Model 1 has one or more factors, 43.5% of participants have this model. Model 2 has one or two factors interacting with another factor and 52.5% of participants have this model. Model 3 has two or three factors interacting within a system approach. Only 4.0% of participants
and percentages of total scores in three categories
Categories f
Model 1: Factor present 111 43.5
Model 2: Factor interacting with other factor
134 52.5
Model 3: Factor interacting with two or more factor with system approach
10 4.0
According to Table 4, eighteen percent of the pre-service elementary teachers don’t consider human built or designed objects (e.g. factory, car, building, etc.) as a component of environmental system. Thirty-two percent
h no obvious interaction with other factors in the nine percent of the participants drew human built or
designed objects interacting with other factors. Only four percent of them actually their drawings of human built or designed
A drawing example does not contain built or designed objects
Participants’ total scores of drawings were divided into three broad categories; Model ne or two factors interacting with another
factor, and Model 3: two or three factors interacting within a system approach (Table 5). These categories were defined for the participants’ mind models. Model 1 has one
ve this model. Model 2 has one or two factors interacting with another factor and 52.5% of participants have this model. Model 3 has two or three factors interacting within a system approach. Only 4.0% of participants
%
43.5
52.5
4.0
Taskın-Ekici, Ekici and Cokadar
31
Forty-four percent of the drawings scored a four or less points, indicating factors the lack of one or more factors in the drawings. Only four percent of the drawings scored 9-12 points, indicating factors depicting interactions within a system approach. That is, ten participants at least in one factor, presented interaction with system approach. In fact, there is no any drawing scored 12 points.
Total Scores and Socioeconomic Characteristics
The mean scores of males and females are compared with independent samples t-test (Table 6). Results show that mean scores do not differ between males (M=4.93, SD=2.00) and females (M=4.61, SD=2.11) at the .05 level of significance (t=1.149, p=.252). Although there is not a significant differences between means, on average score of females is higher than the score of males.
Table 6.
t-test results of total scores by gender of participants
Gender M SD n t df p 95% CI for Mean Difference
Male 4.93 2.00 75 1.149 253 .252 -0.234, 0.889
Female 4.61 2.11 180
p > .05
The mean scores of participants who have or not have environmental education background compared with independent samples t-test (Table 7). The results of analysis show that mean scores does not differ between the participants who have environmental education background (M=5.00, SD=1.97) and the participants who have not background (M=4.68, SD=2.09) at the .05 level of significance (t=0.650, df=253, p=.517). Although there is not a statistically significant difference between mean scores, on average score of participants who have environmental education background is higher than the participants who have not.
Table 7.
t-test results of total scores by environmental education background of participants
Env. Educ.
Background
M SD n t df p 95% CI for Mean Difference
Have 5.00 1.97 19 0.650 253 .517 -0.654, 1.298
Not Have 4.68 2.09 236
p > .05
Exploring Pre-Service Elementary Teachers’ Mental Models of the Environment
32
Analyses were completed using one-way ANOVA with the mean scores of participants by graduated high school, parental education levels, occupations and their family income. Analysis of mean scores did not reveal significance by high school type [F(2.252)=0.164, p=.849], by the fathers’ [F(3.251)=0.970, p=.407] and mothers’ [F(4,249)=1.917, p=.108] education levels. Analysis of mean scores did not reveal significance by their mothers’ occupations [F(5.248)=0.788, p=.559], but did reflect a significant effect of their father’s occupations [F(5.249)=2.531, p=.029]. Post hoc comparisons using Tukey HSD test indicated that the mean score of the participants whom father’s occupation is artisan (M=5.42, SD=2.17) was significantly different from than the mean score of the participants whom father is retired (M=4.29, SD=2.12). There was not a significant effect of family income [F(2.252)=2.217, p=.112] on mean scores of participants.
DiscussionDiscussionDiscussionDiscussion
The aim of this study is to examine pre-service teachers’ perceptions about the environment and whether the mean scores differ regarding to several variables or not. For this purpose, drawings of the environment and demographic characteristics of pre-service teachers have been collected. Moseley and her colleagues (2010) also offered an investigation about how learners’ mental models affected by age, gender, socioeconomic status (SES) and cultural structure in their research for future researches. The relationships among some of these variables were investigated in this study and the obtained results were reported. Even though the mean score of pre-service teachers does not differ significantly by gender, mean score of females was higher than of males. For this reason, we can say that the females are more responsive for environmental issues rather than males. It has been found that the girls were more sensitive to environment than boys (Taylor et. al., 2007), some studies have reported gender differences, with males scoring higher in environmental knowledge (Coyle, 2004; Kollmuss & Agyerman, 2002; Tikka et al., 2000).
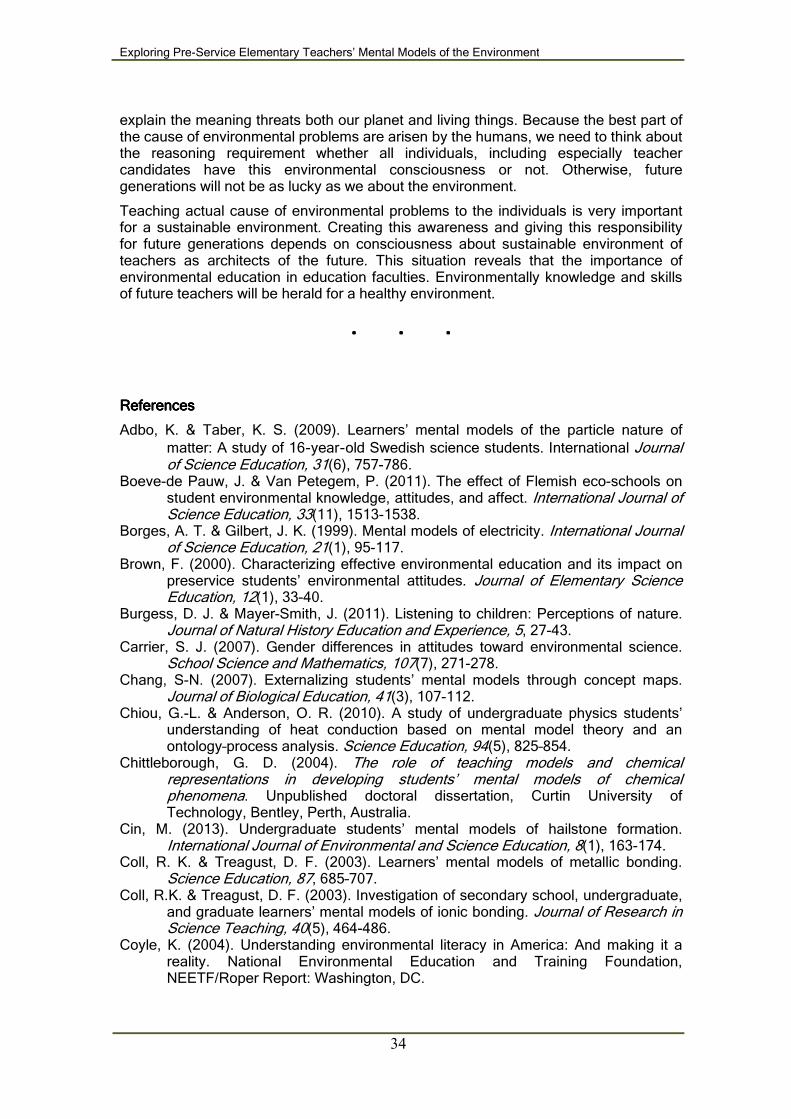
Figure 5.
Another result is average scores of participants do nand educational levels of their parents. Although there is no significant effect of environmental education background on average score, participants with environmental education background have higher scores than who have
Another result of this study is majority of preenvironment as abiotic and living things. It is an impressive result that few participants’ drawings included humans as a part of environment. In the literature, it has beeforwarded that students perceive environments as living area (Burgess, & MayerSmith, 2011; Köşker, 2013; Wilhelm, & Schneider, 2005). Furthermore, the results of this research get along with the literature. In this study, when the predrawings were investigated, it has been seen that the majority of drawings included polluting elements and facts (factory, motor vehicles, etc.). Thus, it can be said that most of them have awareness about environmental pollution and polluting factors.Environmental issues which known as the vast majority derived from humanfactors are not only problem of a country but also the entire world’s problem. Melting of glaciers, the increasing number of extinctions and climate change that we couldn’t
Taskın-Ekici, Ekici and Cokadar
33
Figure 5. Drawing examples have high total scores
Another result is average scores of participants do not differ by their family income, and educational levels of their parents. Although there is no significant effect of environmental education background on average score, participants with environmental education background have higher scores than who have
Another result of this study is majority of pre-service teachers perceive the environment as abiotic and living things. It is an impressive result that few participants’ drawings included humans as a part of environment. In the literature, it has beeforwarded that students perceive environments as living area (Burgess, & MayerSmith, 2011; Köşker, 2013; Wilhelm, & Schneider, 2005). Furthermore, the results of this research get along with the literature. In this study, when the pre-service teachedrawings were investigated, it has been seen that the majority of drawings included polluting elements and facts (factory, motor vehicles, etc.). Thus, it can be said that most of them have awareness about environmental pollution and polluting factors.Environmental issues which known as the vast majority derived from humanfactors are not only problem of a country but also the entire world’s problem. Melting of glaciers, the increasing number of extinctions and climate change that we couldn’t
Ekici, Ekici and Cokadar
ot differ by their family income, and educational levels of their parents. Although there is no significant effect of environmental education background on average score, participants with environmental education background have higher scores than who have not.
service teachers perceive the environment as abiotic and living things. It is an impressive result that few participants’ drawings included humans as a part of environment. In the literature, it has been put forwarded that students perceive environments as living area (Burgess, & Mayer-Smith, 2011; Köşker, 2013; Wilhelm, & Schneider, 2005). Furthermore, the results of
service teachers’ drawings were investigated, it has been seen that the majority of drawings included polluting elements and facts (factory, motor vehicles, etc.). Thus, it can be said that most of them have awareness about environmental pollution and polluting factors. Environmental issues which known as the vast majority derived from human-induced factors are not only problem of a country but also the entire world’s problem. Melting of glaciers, the increasing number of extinctions and climate change that we couldn’t
Exploring Pre-Service Elementary Teachers’ Mental Models of the Environment
34
explain the meaning threats both our planet and living things. Because the best part of the cause of environmental problems are arisen by the humans, we need to think about the reasoning requirement whether all individuals, including especially teacher candidates have this environmental consciousness or not. Otherwise, future generations will not be as lucky as we about the environment.
Teaching actual cause of environmental problems to the individuals is very important for a sustainable environment. Creating this awareness and giving this responsibility for future generations depends on consciousness about sustainable environment of teachers as architects of the future. This situation reveals that the importance of environmental education in education faculties. Environmentally knowledge and skills of future teachers will be herald for a healthy environment.
.... .... ....
ReferencesReferencesReferencesReferences
Adbo, K. & Taber, K. S. (2009). Learners’ mental models of the particle nature of matter: A study of 16‐year‐old Swedish science students. International Journal of Science Education, 31(6), 757-786.
Boeve-de Pauw, J. & Van Petegem, P. (2011). The effect of Flemish eco-schools on student environmental knowledge, attitudes, and affect. International Journal of Science Education, 33(11), 1513-1538.
Borges, A. T. & Gilbert, J. K. (1999). Mental models of electricity. International Journal of Science Education, 21(1), 95-117.
Brown, F. (2000). Characterizing effective environmental education and its impact on preservice students’ environmental attitudes. Journal of Elementary Science Education, 12(1), 33-40.
Burgess, D. J. & Mayer-Smith, J. (2011). Listening to children: Perceptions of nature. Journal of Natural History Education and Experience, 5, 27-43.
Carrier, S. J. (2007). Gender differences in attitudes toward environmental science. School Science and Mathematics, 107(7), 271-278.
Chang, S-N. (2007). Externalizing students’ mental models through concept maps. Journal of Biological Education, 41(3), 107-112.
Chiou, G.-L. & Anderson, O. R. (2010). A study of undergraduate physics students’ understanding of heat conduction based on mental model theory and an ontology–process analysis. Science Education, 94(5), 825–854.
Chittleborough, G. D. (2004). The role of teaching models and chemical representations in developing students’ mental models of chemical phenomena. Unpublished doctoral dissertation, Curtin University of Technology, Bentley, Perth, Australia.
Cin, M. (2013). Undergraduate students’ mental models of hailstone formation. International Journal of Environmental and Science Education, 8(1), 163-174.
Coll, R. K. & Treagust, D. F. (2003). Learners’ mental models of metallic bonding. Science Education, 87, 685–707.
Coll, R.K. & Treagust, D. F. (2003). Investigation of secondary school, undergraduate, and graduate learners’ mental models of ionic bonding. Journal of Research in Science Teaching, 40(5), 464-486.
Coyle, K. (2004). Understanding environmental literacy in America: And making it a reality. National Environmental Education and Training Foundation, NEETF/Roper Report: Washington, DC.
Taskın-Ekici, Ekici and Cokadar
35
d’Apollonia, S. T., Charles, E. S., & Boyd, G. M. (2004). Acquisition of complex systemic thinking: mental models of evolution. Educational Research and Evaluation, 10(4), 499-521.
Desjean-Perrotta , B., Moseley, C. & Cantu, L. E. (2008). Preservice teachers’ perceptions of the environment: Does ethnicity or dominant residential experience matter?. The Journal of Environmental Education, 39(2), 21-32.
Digby, C. L. B. (2010). An examination of the impact of non-formal and informal learning on adult environmental knowledge, attitudes, and behaviors. University of Minnesota, ProQuest, UMI Dissertations Publishing, UMI Number: 3390990
Duit, R. (1991). On the role of analogies and metaphors in learning science. Science Education, 75(6), 649–672.
Evans, G. W., Brauchle, G., Haq, A., Stecker, R., Wong, K., & Shapiro, E. (2007). Young children’s environmental attitudes and behaviors. Environment and Behavior, 39(5), 635-658.
Gilbert, J. K., Boulter, C. J., & Rutherford, M. (2000). Explanations with models in science education. In J. K. Gilbert & C. J. Boulter (Eds.), Developing Models in Science Education. Dordrecht: Kluwer.
Gobert, J. D. (2000). A typology of causal models for plate tectonics: Inferential power and barriers to understanding. International Journal of Science Education, 22(9), 937-977.
Greca, I.M. & Moreira, M.A. (2000). Mental models, conceptual models, and modeling. International Journal of Science Education, 22 (1), 1–11.
Haim, O., Strauss, S., & Ravid, D. (2004). Relations between EFL teachers’ formal knowledge of grammar and their in-action mental models of children’s minds and learning. Teaching and Teacher Education, 20, 861–880.
Hatch, J. A. (1999). What preservice teachers can learn from studies of teachers’ work. Teaching and Teacher Education, 15, 229-242.
Heywood, D., Parker, J., & Rowlands, M. (2013). Exploring the visuospatial challenge of learning about day and night and the sun’s path. Science Education, 97(5), 772–796.
Hubber, P. (2006). Year 12 students’ mental models of the nature of light. Research in Science Education, 36(4), 419-439.
Jabot, M. & Henry, D. (2007). Mental models of elementary and middle school students in analyzing simple battery and bulb circuits. School Science and Mathematics, 107, 371–381.
Johnson-Laird, P. N. (1983). Mental models: Towards a cognitive science of language, inference, and consciousness. Cambridge: Cambridge University Press.
Kollmuss, A. & Agyeman, J. (2002). Mind the gap: Why do people act environmentally and what are the barriers to pro-environmental behavior? Environmental Education Research, 8, 239-260.
Köşker, N. (2013). İlkokul öğrencileri ve sınıf öğretmeni adaylarının doğaya ilişkin algıları ve sorumluluklarına yönelik düşünceleri. International Periodical for the Languages, Literature and History of Turkish or Turkic, 8/3, 341-355.
Krauskopf, K., Zahn, C., & Hesse, F. W. (2012). Leveraging the affordances of YouTube: The role of pedagogical knowledge and mental models of technology functions for lesson planning with technology. Computers & Education, 58(4), 1194-1206.
Lin, J-W. & Chiu, M-H. (2010). The mismatch between students’ mental models of acids/bases and their sources and their teacher’s anticipations there of. International Journal of Science Education, 32(12), 1617–1646.
Loughland, T., Reid, A., & Petocz, P. (2002). Young people’s conceptions of environment: A phenomenographic analysis. Environmental Education Research, 8(2), 187-197.
Exploring Pre-Service Elementary Teachers’ Mental Models of the Environment
36
Matteson, S. M., Ganesh, B. S., Coward, F. L., & Patrick, P. (2012). Middle-Level preservice mathematics teachers’ mental representations of classroom floor plans. Teaching Education, 23(4), 429-450.
McClary, L. & Talanquer, V. (2011). College chemistry students’ mental models of acids and acid strength. Journal of Research in Science Teaching, 48, 396–413.
McKeown, R., and C. Hopkins. (2002). Weaving sustainability into pre-service teacher education programs. In Teaching sustainability – towards curriculum greening, ed. W. Leal Filho. Frankfurt: Peter Lang Verlag.
Mensah, F. M. (2011). The DESTIN: Preservice teachers’ drawings of the ideal elementary science teacher. School Science and Mathematics, 111(8), 379-388.
Minogue, J. (2010). What is the teacher doing? What are the students doing? An application of the Draw-a-Science-Teacher-Test. Journal of Science Teacher Education, 21(7), 767-781.
Moseley, C., Desjean-Perrotta, B., & Utley, J. (2010). The Draw-an-Environment Test Rubric (DAET-R): Exploring pre-service teachers’ mental models of the environment. Environmental Education Research, 16(2), 189-208.
Nersessian, N. J. 1992. In the Theoretician’s Laboratory: Thought Experimenting as Mental Modeling. PSA: Proceedings of the Biennial Meeting of the Philosophy of Science Association, 2, 291-301.
North American Association for Environmental Education (NAAEE). (2004a). Excellence in environmental education: Guidelines for learning (PreK–12). Washington, DC: Author.
North American Association for Environmental Education (NAAEE). (2004b). Guidelines for the initial preparation and professional development of environmental educators. Washington, DC: Author.
Panagiotaki, G., Nobes, G., & Potton, A. (2009). Mental models and other misconceptions in children’s understanding of the earth. Journal of Experimental Child Psychology, 104(1), 52-67.
Patrick, P.G. (2006). Mental models students hold of zoos. Unpublished doctoral dissertation, The University of North Carolina at Greensboro.
Payne, P. (1998). Children’s conceptions of nature. Australian Journal of Environmental Education 14, 19–26.
Prabawa-Sear, K., & Baudains, C. (2011). Asking the participants: Students’ views on their environmental attitudes, behaviours, motivators and barriers. Australian Journal of Environmental Education, 27(2), 219-228.
Reinfried, S. (2006). Conceptual change in physical geography and environmental sciences through mental model building: The example of groundwater. International Research in Geographical and Environmental Education, 15(1), 41-61.
Robelia, B. & Murphy, T. (2012). What do people know about key environmental issues? A review of environmental knowledge surveys. Environmental Education Research, 18(3), 299-321.
Saban, A. (2003). A Turkish profile of prospective elementary school teachers and their views of teaching. Teaching and Teacher Education, 19, 829-846.
Samarapungavan, A., Vosniadou, S., & Brewer, W.F. (1996). Mental models of the earth, sun, and moon: Indian children’s cosmologies. Cognitive Development, 11(4), 491–521.
Shepardson, D. P. (2005). Student ideas: What is an environment?. The Journal of Environmental Education, 36(4), 49–58.
Shepardson, D. P., Choi, S., Niyogi, D., & Charusombat, U. (2011). Seventh grade students’ mental models of the greenhouse effect. Environmental Education Research, 17(1), 1-17.
Taskın-Ekici, Ekici and Cokadar
37
Shepardson, D., Wee, B., Priddy, M., & Harbor, J. (2007). Students’ mental models of the environment, Journal of Research in Science Teaching, 44(2), 327–348.
Strauss, S. (2001). Folk psychology, folk pedagogy, and their relations to subject-matter knowledge. In Torff, B. & Sternberg, R. J. (Eds.) Understanding and teaching the intuitive mind: Student and teacher learning. Mahwah, NJ: Lawrence Erlbaum.
Subramaniam, K. (2013). Minority preservice teachers’ conceptions of teaching science: Sources of science teaching strategies. Research in Science Education, 43(2), 687-709.
Tal, T. (2010). Pre-Service teachers’ reflections on awareness and knowledge following active learning in environmental education. International Research in Geographical and Environmental Education, 19(4), 263-276.
Tatar, N., Yıldız Feyzioglu, E., Buldur, S., & Akpınar, E. (2012). Pre-service science teachers’ mental models about science teaching. Educational Sciences: Theory and Practice, 12(4), 2934-2940.
Taylor, N., Doff, T., Jenkins, K., & Kennelly, J. (2007). Environmental knowledge and attitudes among a cohort of pre-service primary school teachers in Fiji. International Research in Geographical and Environmental Education. 16(4), 367-379.
Teksoz, G., Sahin, E., & Tekkaya-Oztekin, C. (2012). Modeling environmental literacy of university students. Journal of Science Education and Technology, 21(1), 157-166.
Tikka, P., Kuitunen, M., & Tynys, S. (2000). Effects of educational background on students’ attitudes, activity levels, and knowledge concerning the environment. Journal of Environmental Education, 31(3), 12-19.
Ucar, S. (2012). How do pre-service science teachers’ views on science, scientists, and science teaching change over time in a science teacher training program?. Journal of Science Education and Technology, 21(2), 255-266.
Vosniadou, S. (1994). Capturing and modeling the process of conceptual change. Learning and Instruction, 4(1), 45-69.
Vosniadou, S. & Brewer, W. F. (1992). Mental models of the earth: A study of conceptual change in childhood. Cognitive Psychology, 24(4), 535 – 585.
Vosniadou, S. & Brewer, W. F. (1994). Mental models of the day/night cycle. Cognitive Science, 18(1), 123-183.
Wilhelm, S. & Schneider, I.E. (2005). The meaning of nature to diverse urban youth. Applied Environmental Education, 4,103-113.
Wilke, R. A. & Losh, S. C. (2012). Exploring mental models of learning and instruction in teacher education. Action in Teacher Education, 34(3), 221-238.
Wilke, R.J. (1985). Mandating preservice environmental education teacher training: The Wisconsin experience. Journal of Environmental Education, 17(1),1–8.
Williams, M. D., Hollan, J. D., & Stevens, A. L. (1983). Human reasoning about a simple physical system. In Gentner, D. & Stevens, A. L. (Eds.), Mental models. Hillsdale, NJ: Erlbaum.
Zhang, W. & Xu, P. (2011). Do I have to learn something new? Mental models and the acceptance of replacement technologies. Behaviour & Information Technology, 30(2), 201-211.

Exploring Pre-Service Elementary Teachers’ Mental Models of the Environment
38
APPENDIX 1.APPENDIX 1.APPENDIX 1.APPENDIX 1.
Draw an Environment Test (DAET)
Date: ______________ ID#_______________
In the space below draw a picture of what you think the environment is. Below that, please provide your definition of the environment (in words).
---------------------------------------------------------------------------------------------------------
My drawing of the environment is:
---------------------------------------------------------------------------------------------------------
My definition of the environment is:
International Electronic Journal of Environmental Education Vol.5, Issue 1, 2015, 21-39 RESEARCH ARTICLE
ISSN: 2146-0329
*Corresponding Author: Fatma TASKIN-EKICI,
E-mail: [email protected]
Sınıf Öğretmeni Adaylarının Çevreye Yönelik Sınıf Öğretmeni Adaylarının Çevreye Yönelik Sınıf Öğretmeni Adaylarının Çevreye Yönelik Sınıf Öğretmeni Adaylarının Çevreye Yönelik Zihinsel Modellerinin Zihinsel Modellerinin Zihinsel Modellerinin Zihinsel Modellerinin İncelenmesiİncelenmesiİncelenmesiİncelenmesi
Fatma TAŞFatma TAŞFatma TAŞFatma TAŞKINKINKINKIN----EKİEKİEKİEKİCCCCİİİİ
Pamukkale Üniversitesi, Denizli, TÜRKİYE
Erhan EKİCİErhan EKİCİErhan EKİCİErhan EKİCİ Pamukkale Üniversitesi, Denizli, TÜRKİYE
Hulusi ÇHulusi ÇHulusi ÇHulusi ÇOKADAROKADAROKADAROKADAR Pamukkale Üniversitesi, Denizli, TÜRKİYE
ÖzetÖzetÖzetÖzet
Bu çalışmanın amacı sınıf öğretmeni adaylarının çevreye ilişkin algılarının incelenmesidir. Çalışmada tarama yöntemi kullanılmıştır. Çevre eğitimi dersinin verilmesinin ardından 255 öğretmen adayına kapalı uçlu bir ölçek ve Çevre Çizimi Testi (Draw-An-Environment Test [DAET]) uygulanmıştır. Öğretmen adaylarının çevreyle ilgili olarak sahip oldukları zihinsel model ya da imgelerin değerlendirilmesinde bir rubrik (DAET-R) kullanılmıştır. Çalışmanın sonuçları katılımcıların çevreye ilişkin zihinsel modellerinin eksik olduğunu ortaya koymaktadır. Katılımcıların büyük çoğunluğunun çizimleri canlı ve cansız çevreyi yansıtmaktadır. Az sayıda çizim çevrenin bir parçası olarak insanlara yer vermektedir. Sonuçlar, ortalama puanların cinsiyet, çevre eğitimi geçmişi, lise türü, ebeveyn eğitim düzeyi, ebeveyn mesleği ve aylık aile gelirine göre farklılık göstermediğini ortaya koymaktadır. Anahtar Kelimeler: Anahtar Kelimeler: Anahtar Kelimeler: Anahtar Kelimeler: Zihinsel model, çevre, eğitim, aday öğretmen, çizim