Embed Size (px)
Citation preview
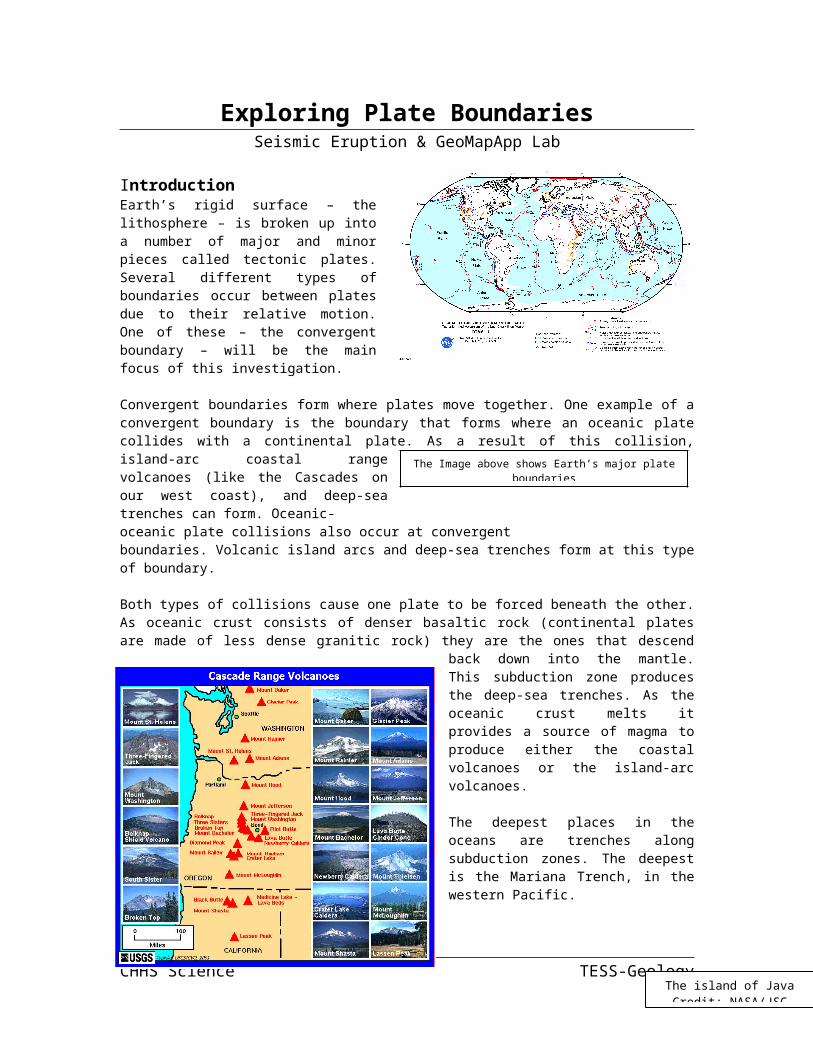
The Image above shows Earth’s major plate boundariesCredit: NASA/GSFC
Volcanoes of the CascadesCredit: USGS
Eruption in the MarianasImage credit:
NASA/GSFC/LaRC/JPL, MISR Team
Exploring Plate BoundariesSeismic Eruption & GeoMapApp Lab
IntroductionEarth’s rigid surface – the lithosphere – is broken up into a number of major and minor pieces called tectonic plates. Several different types of boundaries occur between plates due to their relative motion. One of these – the convergent boundary – will be the main focus of this investigation.
Convergent boundaries form where plates move together. One example of a convergent boundary is the boundary that forms where an oceanic plate collides with a continental plate. As a result of this collision, island-arc coastal range volcanoes (like the Cascades on our west coast), and deep-sea trenches can form. Oceanic-oceanic plate collisions also occur at convergent boundaries. Volcanic island arcs and deep-sea trenches form at this type of boundary.
Both types of collisions cause one plate to be forced beneath the other. As oceanic crust consists of denser basaltic rock (continental plates are made of less dense granitic rock) they are the ones that descend back down into the mantle. This subduction zone produces the deep-sea trenches. As the oceanic crust melts it provides a source of magma to produce either the coastal volcanoes or the island-arc volcanoes.
The deepest places in the oceans are trenches along subduction zones. The deepest is the Mariana Trench, in the western Pacific.
Why are some trenches deeper than others? Does it have to do with the age of the plate boundary? Does the angle formed by one plate plunging beneath the other influence the depth of the trench?
We’ll be exploring the 2nd question - How Subduction Angle Affects Trench Depth.
CHHS Science TESS-Geology
The island of JavaCredit: NASA/JSC
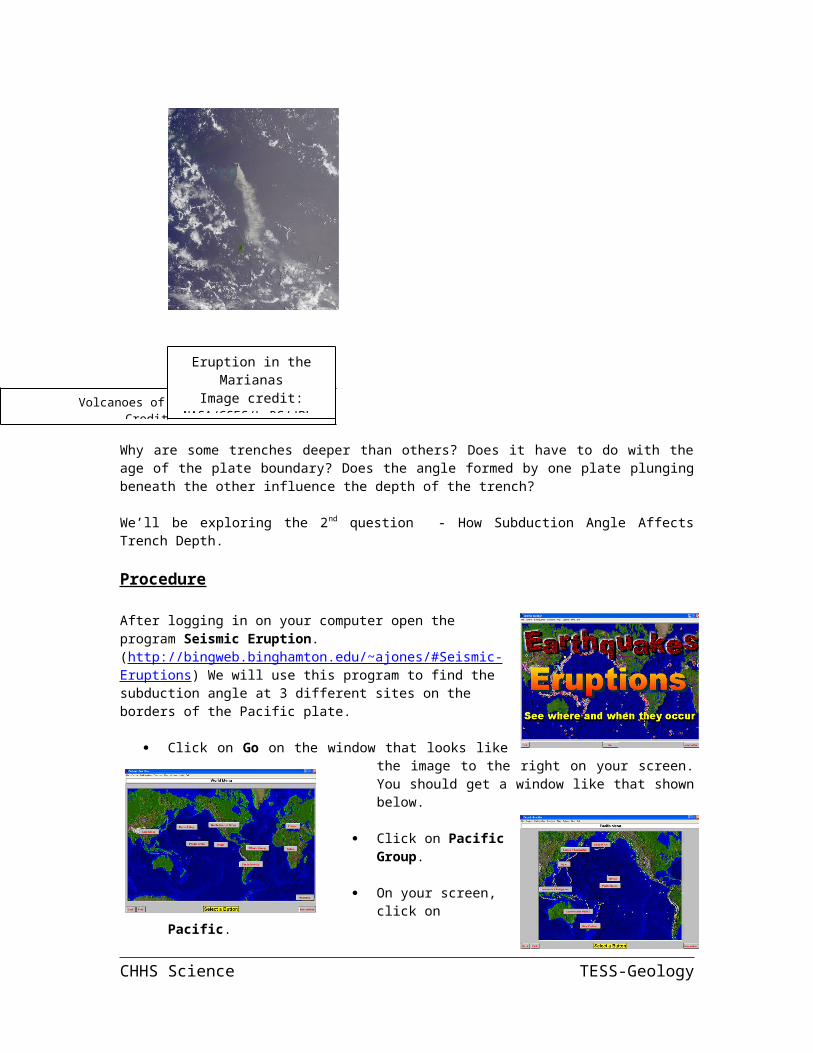
Procedure
After logging in on your computer open the program Seismic Eruption. (http://bingweb.binghamton.edu/~ajones/#Seismic-Eruptions) We will use this program to find the subduction angle at 3 different sites on the borders of the Pacific plate.
Click on Go on the window that looks like the image to the right on your screen. You should get a window like that shown
below.
Click on Pacific Group.
On your screen, click on Pacific.
This window (left) showing the Pacific rim (Ring of Fire) will clearly show the location of plate boundaries as the Seismic Eruption software plots the epicenters and magnitudes of earthquakes in the region over a 48-year period. You can use the programs tool bar (bottom of the window) to speed up time so that you don’t waste too much time waiting to see the locations of the plate boundaries! Allow the time to run to the end of the available data.
The plate boundaries in the Pacific shown in the window below are convergent boundaries. There are significant trenches along the coast of the Aleutian Islands (Alaska) Japan, and New Zealand.
Next we’ll set up the software to display a cross section along each of the subduction zones associated with these trenches.
From the Control menu bar choose Set up Cross Section View.
CHHS Science TESS-Geology
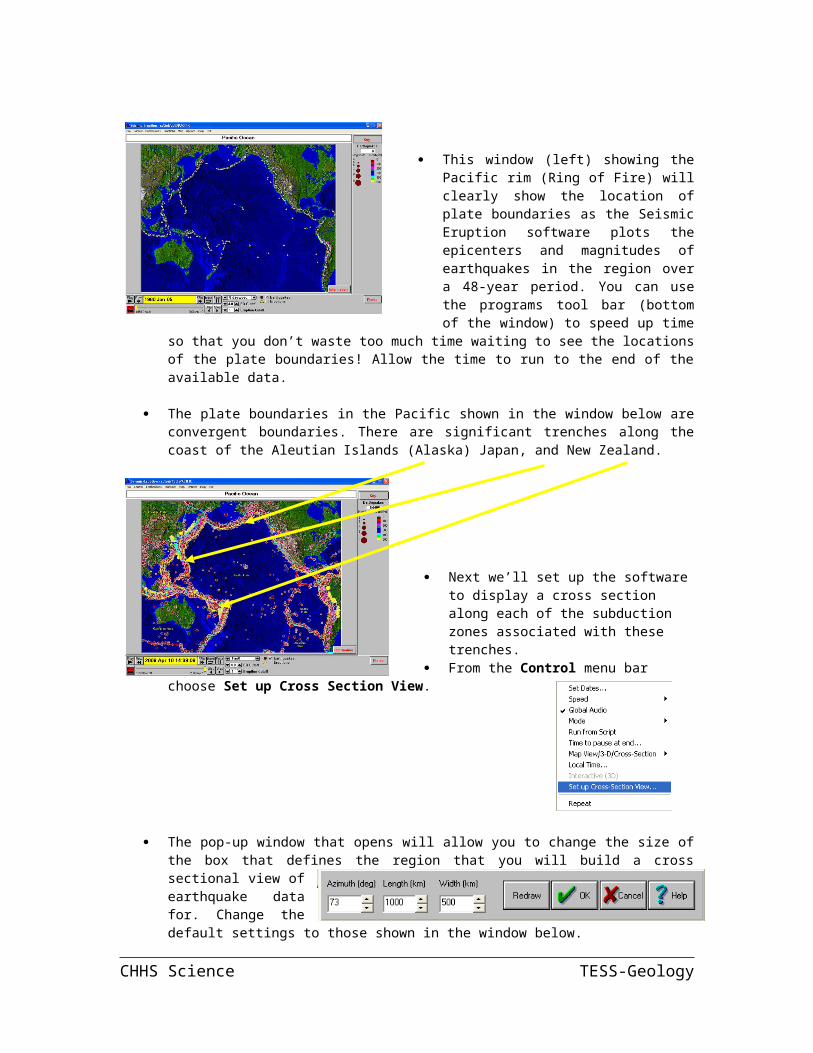
The pop-up window that opens will allow you to change the size of the box that defines the region that you will build a cross sectional view of earthquake data for. Change the default settings to those shown in the window below.
Drag the boxed region up to the Aleutian Islands region to a position similar to that shown in the window below.
Now go to the menu bar Control menu bar. Choose Map View/3-D/Cross-Section and in the new pop-up window choose Cross-Section View.
The
computer will plot the epicenter, magnitude and depth across the plate boundary. The resulting image should show the angle at which one oceanic plate is plunging beneath the other at this boundary.
Use a protractor to measure the subduction angle here at the Aleutian fault and record it in your lab book. BE SURE to set up a data table where you will record the names of the trenches and the subduction angle found there – as well as the average depth of each trench. We will be using a different software package to find these average depths.
Repeat the above steps to find the subduction angle at the trenches offshore from Japan and New
Zealand. Go to Set up Cross-Section view again. Click near the next trench. You can click on the yellow box that appears and drag it to where you want it placed on the trench. You will need to modify the Azimuth of each boxed region you define when setting up these cross sections so that it is perpendicular to the direction each trench runs.
Measure and record the subduction angle in your lab notebook at this sites as well.
Which of these plate boundaries do you think will have a deep-sea trench with the highest average depth? Explain why you chose the site you did in your lab notebook. Label it PREDICTION.
We will now need to switch to a different program. Close Seismic Eruption and open GeoMapApp.
CHHS Science TESS-Geology

The main map window shows a relief map of the world that depicts elevation and depth through the use of color.
What do you see changing in the menu bar of the GeoMapApp window as you move the cursor around on the map?(Answer this question in your lab book)
We want to find depth information for trenches found along the Aleutian Islands, off New Zealand, and along the Mariana Islands. To do this we need to load the Grid information for GeoMapApp.
Click on the Grid tool on the menu bar.
Grid tool
Now when you move the cursor around on the map image you should also see depth information displayed.
Use the zoom in tool to focus in on the Aleutian Islands. Zoom in 5 times to 32x.
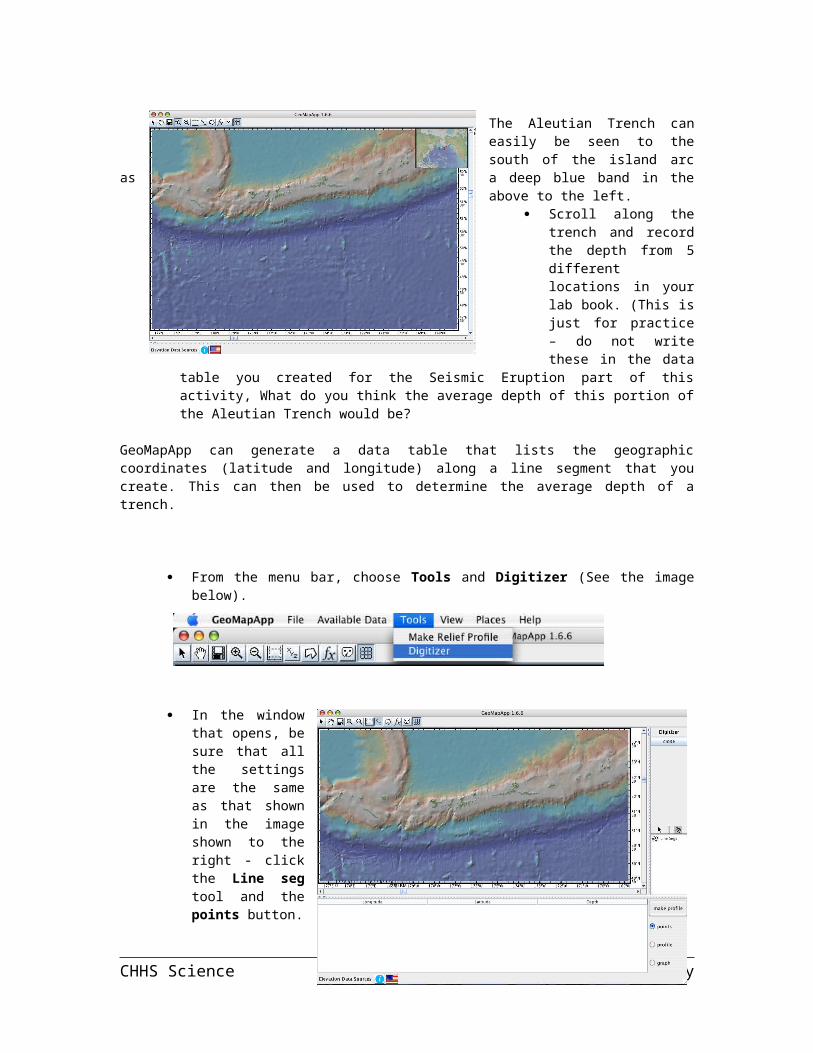
The Aleutian Trench can easily be seen to the south of the island arc as a deep blue band in the above to the left.
Scroll along the trench and record the depth from 5 different locations in your lab book. (This is just for practice – do not write these in the data table you created for the Seismic Eruption part of this activity, What do you think the average depth of this portion of the Aleutian Trench would be?
GeoMapApp can generate a data table that lists the geographic coordinates (latitude and longitude) along a line segment that you create. This can then be used to determine the average depth of a trench.
From the menu bar, choose Tools and Digitizer (See the image below).
CHHS Science TESS-Geology

In the window that opens, be sure that all the settings are the same as that shown in the image shown to the right - click the Line seg tool and the points button.
Once you’ve clicked the Line seg tool, you can click on the location along the trench where you want to start your line segment. Click again further along the trench. If the trench turns, continue to follow it and click again. Keep turning and clicking as you make your way along the darkest blue (deepest) portion of the trench. You should finish with something that looks like the image below. The deepest part of the trench is outlined in black. The coordinate and depth data is beneath the map image.
GeoMappApp does not have a built in method of exporting data to Excel. You will need to open MS Word and create a new document to continue.
CHHS Science TESS-Geology
Once you have a Word document ready, go back to GeoMapApp and highlight all the coordinate and depth data from your line segment. Copy this data (w/a Mac open Apple – C). Click back on the open Word document and paste the data to it (w/a Mac open Apple – V).
Save this as a text file.
Now you need to open Excel. From the Excel menu bar choose File Open. Find your text file – AleutianTrench.txt.
Open this file.
You will see a pop-up window like that shown below. The text file is a Tab-Delimited text file. In the Mac version of Excel you get a Text Import Wizard that walks you through the remainder of the process of transferring the coordinate and depth data from GeoMapApp to Excel so that you can write a formula to calculate the average depth.
Click on Next in the Text Import Wizard – Step 1 of 3.
Again, click on Next in the Text Import Wizard – Step 2 of 3 window.
CHHS Science TESS-Geology

Click Finish in the Text Import Window – Step 3 of 3.
Insert a new row above row one. Add column headings to each column.
At the end of the data in column C (Cell C24 in my example shown) write a formula to find the average of the depths along your line segment for the Aleutian Trench. If you don’t remember how to do this, or need a reminder, look at the image below.
Record the average depth of the Aleutian Trench in the data table you created in your lab book in the previous section.
Repeat the process of finding the average depth along a trench outlined above for both the Mariana Trench and the trench off the north west coast of New Zealand.
Record these values in your data table.
Do you see any relationship between the average depth of a trench and the subduction angle at a convergent plate boundary? Explain your answer.
CHHS Science TESS-Geology