Embed Size (px)
Citation preview
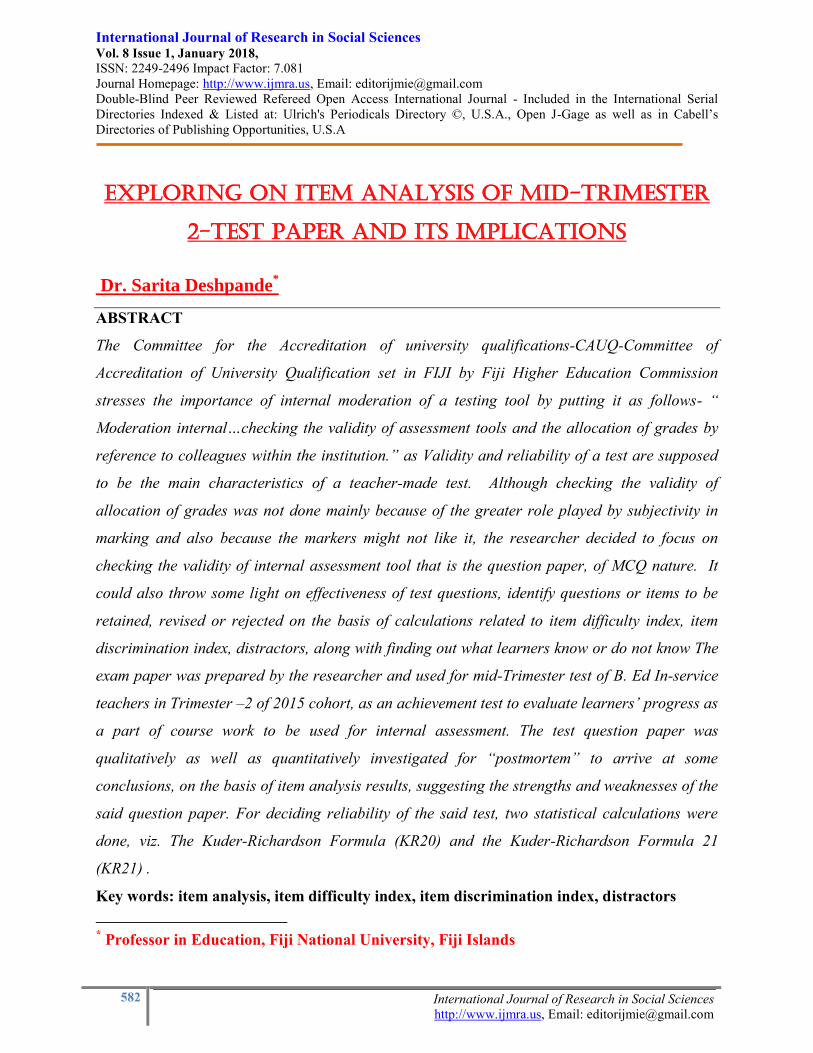
International Journal of Research in Social Sciences Vol. 8 Issue 1, January 2018, ISSN: 2249-2496 Impact Factor: 7.081
Journal Homepage: http://www.ijmra.us, Email: [email protected]
Double-Blind Peer Reviewed Refereed Open Access International Journal - Included in the International Serial
Directories Indexed & Listed at: Ulrich's Periodicals Directory ©, U.S.A., Open J-Gage as well as in Cabell‟s
Directories of Publishing Opportunities, U.S.A
582 International Journal of Research in Social Sciences
http://www.ijmra.us, Email: [email protected]
Exploring on Item Analysis of Mid-trimester
2-Test paper and Its Implications
Dr. Sarita Deshpande*
ABSTRACT
The Committee for the Accreditation of university qualifications-CAUQ-Committee of
Accreditation of University Qualification set in FIJI by Fiji Higher Education Commission
stresses the importance of internal moderation of a testing tool by putting it as follows- “
Moderation internal…checking the validity of assessment tools and the allocation of grades by
reference to colleagues within the institution.” as Validity and reliability of a test are supposed
to be the main characteristics of a teacher-made test. Although checking the validity of
allocation of grades was not done mainly because of the greater role played by subjectivity in
marking and also because the markers might not like it, the researcher decided to focus on
checking the validity of internal assessment tool that is the question paper, of MCQ nature. It
could also throw some light on effectiveness of test questions, identify questions or items to be
retained, revised or rejected on the basis of calculations related to item difficulty index, item
discrimination index, distractors, along with finding out what learners know or do not know The
exam paper was prepared by the researcher and used for mid-Trimester test of B. Ed In-service
teachers in Trimester –2 of 2015 cohort, as an achievement test to evaluate learners’ progress as
a part of course work to be used for internal assessment. The test question paper was
qualitatively as well as quantitatively investigated for “postmortem” to arrive at some
conclusions, on the basis of item analysis results, suggesting the strengths and weaknesses of the
said question paper. For deciding reliability of the said test, two statistical calculations were
done, viz. The Kuder-Richardson Formula (KR20) and the Kuder-Richardson Formula 21
(KR21) .
Key words: item analysis, item difficulty index, item discrimination index, distractors
* Professor in Education, Fiji National University, Fiji Islands
ISSN: 2249-2496 Impact Factor: 7.081
583 International Journal of Research in Social Sciences
http://www.ijmra.us, Email: [email protected]
Introduction
Undertaking the, “postmortem” of question paper after examination/test is over, is a challenging
job that is essential also for professional development of the test makers. Lewis Aiken (1997),
contends that a “postmortem” evaluation is just as necessary in classroom testing as it is in
medicine and it could be done in two ways-Qualitative and Quantitative.” The qualitative way, as
suggested by Raymond M. Zurawski (2009), includes careful proofreading of the exam paper
prior to its administration for typographical errors, for grammatical cues that might inadvertently
tip off examinees to the correct answer, and for the appropriateness of the reading level of the
material.” Accomplishing these tasks demands a broad range of cognitive, technical, and
interpersonal resources as well as skills from a professional as well as a practitioner for
investigating the quality of the evaluative procedure.
Rationale
While teaching item analysis under the unit on Assessment and Evaluation in trimester 2 of
2015, to B.Ed. In-service teachers at FNU, some teachers demanded for hands on experience on
item analysis. Their mid-trimester assessment in the form of objective, multiple choice short test
was just then completed. These teachers were ready to spend extra time on item analysis. So it
was decided by the researcher to give them hands on experience and subsequently write a
research paper also. While working on item analysis, it was also decided by the author, to resolve
the effectiveness of the mid-trimester test taken by these B. Ed In-service teachers.
Review of literature:
After browsing through the internet a few recent researches were considered for confirming
the procedures involved in item analysis, as follows-
1. C. Boopathiraj et.al (2013) did item analysis on a sample of 200 M.Ed student –teachers
enrolled in Tamilnadu Teacher Education University, India using self-made test of 60 items. The
main objective of the work was to find out the item difficulty and the power of discrimination of
Multiple Choice test items. The results showed that only 7 items were found in 80%
discrimination power and those items were selected. Thirteen items out of 60 (21%) were
rejected either due to difficulty level or discrimination index. Thirty five items (58%) were
ISSN: 2249-2496 Impact Factor: 7.081
584 International Journal of Research in Social Sciences
http://www.ijmra.us, Email: [email protected]
accepted without revision while 12 items were accepted provided the necessary revision made in
them. (retrieved from http://indianresearchjournals.com/)
2. Richard J. McCowan Sheila C. McCowan(1999) have conducted item analysis on
criterion-referenced test. It was mainly to find out effectiveness of an item in case of untrained
and trained respondents. ( Retrieved from fromhttp://files.eric.ed.gov/ )
3. As retrieved from http://pareonline.net/, JerardKehoe(1995) from Virginia Polytechnic
Institute and State University, carried basic item analysis for multiple choice tests. This article
offers some suggestions for the improvement of Multiple-choice questions using item analysis
statistics.
4. Susan Matlock-Hetzel (1997) from Texas A&M University, in her article has made some
suggestions that are summarized as follows- Developing the perfect test is the unattainable goal
for anyone in an evaluative position. Even when guidelines for constructing fair and systematic
tests are followed, a plethora of factors may enter into a student's perception of the test items.
Looking at an item's difficulty and discrimination will assist the test developer in determining
what is wrong with individual items. Item and test analysis provide empirical data about how
individual items and whole tests are performing in real test situations.( retrieved from
http://ericae.net/ )
5. Item analysis on The Early Development Instrument (EDI) -a tool to assess
kindergarteners‟ development in the five areas of development: physical health & well-being,
social competence, emotional maturity, language & thinking skills, and communication &
general knowledge, has been carried out by Vijaya Krishnan(2013) from Alberta University. It is
mainly based on classical test theory.(retrieved from http://www.cup.ualberta.ca/)
The above references kept the researcher motivated to continue with item analysis procedure in
order to explain it well during the lecture, as per the request of In-Service teachers of FNU as
also to give them hands on experience.
Objectives:
The objectives that were focused for this work were as follows-
1. To intensify the understanding of item analysis
2. To provide experience of item analysis to In-service teachers
ISSN: 2249-2496 Impact Factor: 7.081
585 International Journal of Research in Social Sciences
http://www.ijmra.us, Email: [email protected]
3. To identify the items that are weak in terms of difficulty index
4. To identify the items that are weak in terms of Discrimination index
5. To analyze distractors – the plausible answers, for each item
6. To ascertain validity and reliability of the self-made achievement test.
Hypothesis
Following negative or null hypotheses were framed to test through statistical evidences-
H01: The items on exam paper are not difficult.
H02: The items on the exam paper are not discriminators between high fliers and low scorers.
H03: The test is not valid and reliable.
Methodology
Research design: Present research was done as a survey- The survey of exam paper So, it was a
survey of document analysis. The analysis of document of a specific group of FNU was
involved. So it was a case study. As a principal lecturer of In-Service group having 89 teachers
enrolled for B. Ed program, the author had an opportunity to create and mark the mid-trimester
test papers of these students. Looking at the nature of question paper which was objective type-
multiple choice paper with 30 questions or items, the author decided to carry out item analysis
of these papers marked by her, in presence of and with assistance of ten test takers who
volunteered from the group so as to have them hands on experience. The others were not much
interested in manual calculations and decided observing the procedure. The marked papers were
86 out of 89 as three teachers were absent. These answer papers of the mid-trimester test were
arranged in descending order manually by volunteer teachers. They were divided into three
groups viz. upper group having 25% scripts (22 scripts) of high scorers, middle group having
50% scripts(42) of middle scorers (which were isolated later, as they were not to be involved in
calculations) and lower group of 25% scripts (22 scripts) of low scorers. Each marked script was
arranged in a respective group in descending order.
Population and sample
There were 89 In-service teachers pursuing B. Ed degree program from FNU in trimester 2 of
2015. As a compulsory subject, it was studied by all and was taught by Principal Lecturer-the
ISSN: 2249-2496 Impact Factor: 7.081
586 International Journal of Research in Social Sciences
http://www.ijmra.us, Email: [email protected]
researcher. Of these, 86 teachers sat for their Mid-Trimester test in the said unit on the same day
and at the same timing. With these common factors, the author decided to carry item analysis for
which the sample selected was answer scripts of 86 In-service teachers-that is the teachers from
her own section, due to easy accessibility to answer papers. The sample thus was inclusive or
purposive type and included marked answer papers of these 86 In-service teachers and
constituted the primary data. It was thus mainly a document analysis.
Tools used:
The researcher made use of an achievement test that was administered to B.Ed –In-service
student teachers as part of their course work. The test was objective in nature. It had 30 multiple-
choice questions each worth one mark, thus the total test carried 30 marks weightage. The time
allocated was one hour. It was a self-made test based on contents from Unit: Assessment and
Evaluation, taught by the researcher. As supported by Maizam Alias (2005),
“…, the decision on what to include in a test paper will depend on what the content of
the syllabus is, as well as what the test objectives are. It is of utmost importance for
for teachers to appreciate that the degree of test validity depends on the test‟s coverage
of the necessary objectives, which, in turn, depends upon the syllabus.” (p:236)
The answer scripts became the source of data, since item analysis was to be carried out from the
responses.
Data collection and analysis:
The data was collected in the form of answer scripts and scores of the student teachers from In-
service group. It was analyzed quantitatively for identifying item difficulty and item
discrimination index. Qualitative analysis was related to nature/ appearance, focus on objectives,
typography, spellings and distractors of question paper. Also it was a requirement of College‟s
Quality Assurance Committee.
Qualitative Analysis
After distributing the test paper, it was carefully read by the author and following observations
were noted-
ISSN: 2249-2496 Impact Factor: 7.081
587 International Journal of Research in Social Sciences
http://www.ijmra.us, Email: [email protected]
Typographical and spelling mistakes were observed in no questions.
Inappropriate stems were observed in no questions.
Inappropriate options/alternatives/distractors were observed in no questions.
Majority of questions in the said test paper were mainly checking knowledge and
understanding, few focused on application, and few were there to check higher order thinking
skills such as analysis, synthesis or evaluation. The paper was created as per blue print, hence
balanced and did not require corrections after editing. These observations were further confirmed
by the helping group of volunteer teachers from the same class that requested for hands on
experience and also others who sat for the test.
Quantitative Analysis
A thorough item analysis includes a number of quantitative procedures. Specifically, three
numerical indicators are often derived during an item analysis: item difficulty, item
discrimination, and distractor power statistics. As ascertained by Ebel et.al.(1986)
“All these test characteristics are important to consider in evaluating the quality of an
achievement test, and the evaluation of each can provide clues regarding the ways in
which the test items might be revised and improved for future use.”(p:226)
The process of item analysis
As stated earlier, item analysis was done for more hands on experiences, hence the details about
the concepts and procedures were essential. Item analysis begins after the test has been
administered and marked or scored. There are different processes that have been developed and
used by different researchers. The researcher used a process that is simple and yet precise
enough, as suggested by Ebel et al(1986). It has six steps. (P: 226). These steps are as follows-
1. Arrange the scored test papers in score order from highest to lowest.
2. Identify an upper group and lower group separately. The upper group is the highest-
scoring 27 % of the entire group and the lower group is the lowest scoring 27% of the entire
group. In this case, it included 25% that is 22 answer papers each in higher group and lower
group, as 25% of 86 would have been a fraction and 25% is also admissible as per Ebel et al.
ISSN: 2249-2496 Impact Factor: 7.081
588 International Journal of Research in Social Sciences
http://www.ijmra.us, Email: [email protected]
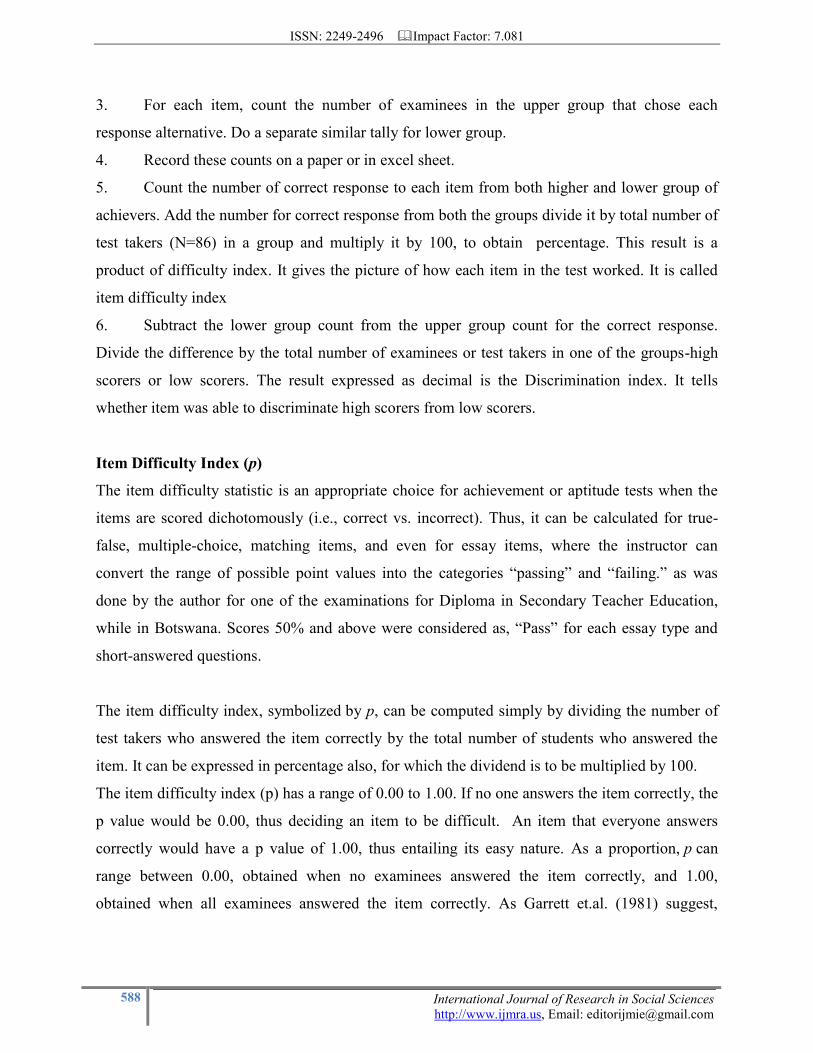
3. For each item, count the number of examinees in the upper group that chose each
response alternative. Do a separate similar tally for lower group.
4. Record these counts on a paper or in excel sheet.
5. Count the number of correct response to each item from both higher and lower group of
achievers. Add the number for correct response from both the groups divide it by total number of
test takers (N=86) in a group and multiply it by 100, to obtain percentage. This result is a
product of difficulty index. It gives the picture of how each item in the test worked. It is called
item difficulty index
6. Subtract the lower group count from the upper group count for the correct response.
Divide the difference by the total number of examinees or test takers in one of the groups-high
scorers or low scorers. The result expressed as decimal is the Discrimination index. It tells
whether item was able to discriminate high scorers from low scorers.
Item Difficulty Index (p)
The item difficulty statistic is an appropriate choice for achievement or aptitude tests when the
items are scored dichotomously (i.e., correct vs. incorrect). Thus, it can be calculated for true-
false, multiple-choice, matching items, and even for essay items, where the instructor can
convert the range of possible point values into the categories “passing” and “failing.” as was
done by the author for one of the examinations for Diploma in Secondary Teacher Education,
while in Botswana. Scores 50% and above were considered as, “Pass” for each essay type and
short-answered questions.
The item difficulty index, symbolized by p, can be computed simply by dividing the number of
test takers who answered the item correctly by the total number of students who answered the
item. It can be expressed in percentage also, for which the dividend is to be multiplied by 100.
The item difficulty index (p) has a range of 0.00 to 1.00. If no one answers the item correctly, the
p value would be 0.00, thus deciding an item to be difficult. An item that everyone answers
correctly would have a p value of 1.00, thus entailing its easy nature. As a proportion, p can
range between 0.00, obtained when no examinees answered the item correctly, and 1.00,
obtained when all examinees answered the item correctly. As Garrett et.al. (1981) suggest,
ISSN: 2249-2496 Impact Factor: 7.081
589 International Journal of Research in Social Sciences
http://www.ijmra.us, Email: [email protected]
“…the number Right or the proportion of the group which can solve an item correctly, is the,
„standard‟ method for determining difficulty in objective examinations.”(:p362)
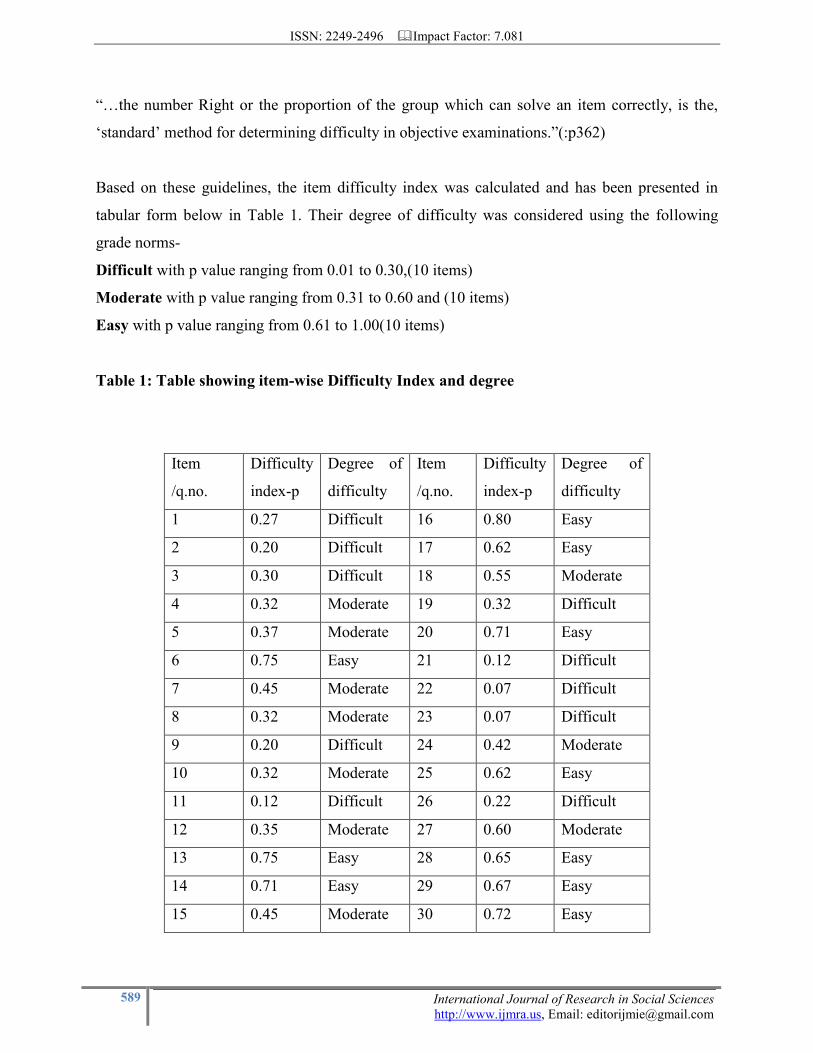
Based on these guidelines, the item difficulty index was calculated and has been presented in
tabular form below in Table 1. Their degree of difficulty was considered using the following
grade norms-
Difficult with p value ranging from 0.01 to 0.30,(10 items)
Moderate with p value ranging from 0.31 to 0.60 and (10 items)
Easy with p value ranging from 0.61 to 1.00(10 items)
Table 1: Table showing item-wise Difficulty Index and degree
Item
/q.no.
Difficulty
index-p
Degree of
difficulty
Item
/q.no.
Difficulty
index-p
Degree of
difficulty
1 0.27 Difficult 16 0.80 Easy
2 0.20 Difficult 17 0.62 Easy
3 0.30 Difficult 18 0.55 Moderate
4 0.32 Moderate 19 0.32 Difficult
5 0.37 Moderate 20 0.71 Easy
6 0.75 Easy 21 0.12 Difficult
7 0.45 Moderate 22 0.07 Difficult
8 0.32 Moderate 23 0.07 Difficult
9 0.20 Difficult 24 0.42 Moderate
10 0.32 Moderate 25 0.62 Easy
11 0.12 Difficult 26 0.22 Difficult
12 0.35 Moderate 27 0.60 Moderate
13 0.75 Easy 28 0.65 Easy
14 0.71 Easy 29 0.67 Easy
15 0.45 Moderate 30 0.72 Easy
ISSN: 2249-2496 Impact Factor: 7.081
590 International Journal of Research in Social Sciences
http://www.ijmra.us, Email: [email protected]
Thus it could be seen from the above table that 10 items from the test that were easy, 10 were
difficult, and 10 were moderate. These need to be revised to turn them to be usable in future. In
fact easy or difficult nature of item is relative to the group answering and is not a permanent
feature. For some other group under different conditions, the same item may prove to be easy.
These are to be used as guidelines to bring further improvement in item construction. For
example, if we calculate lower bound of item, then items below lower bound being very difficult,
should be discarded. In this case, items with p value below 0.32 should be discarded. These
would be 13, - item no.1, 2, 3, 4, 8, 9, 10, 11, 19, 21, 22, 23, 26.
Most test constructors desire items with indices of difficulty no lower than 20 nor higher than
80, with an average index of difficulty from 30 or 40 to a maximum of 60. Considering this, it
could be observed in the Table 1 above that seven of the items (no.1, 2, 3, 9, 11, 19, 21, 22,
23and 26) in the said test were having difficulty index ranging from 0.07 to 0.30-an Index too
low to accept the item as it was seen that all these items were very difficult. difficulty index of
item no. 6, 13, 14, 16, 17, 20, 25, 28, 29, 30 were very higher indicating easy items and 4, 5, 7, 8,
10, 12, 15, 18, 24, 27 in the above table indicates that these items having not very small or not
very large values were mediocre type which was in agreement with what psychologists suggest.
Present test under consideration of this paper would be considered normal as it has few easy, few
moderate and few difficult items. As supported by Linn and Gronlund (1995),
“It is quite normal to assume and many test constructors do assume thata good test intended
to discriminate well over a fairly wide range of levels of achievement must include some easy
items to test the poorer students and some difficult items to test the better students.”(p:231)
Item Discrimination Index (D)
Item discrimination analysis deals with the fact that often different test takers will answer a test
item in different ways. As such, it addresses questions of considerable interest to most faculty,
such as, “Does the test item differentiate those who did well on the exam overall from those who
did not?” or “Does the test item differentiate those who know the material from those who do
not?” In a more technical sense then, item discrimination analysis addresses the validity of the
ISSN: 2249-2496 Impact Factor: 7.081
591 International Journal of Research in Social Sciences
http://www.ijmra.us, Email: [email protected]
items on a test, that is, the extent to which the items tap the attributes they were intended to
assess. As with item difficulty, item discrimination analysis involves a family of techniques.
Which one to use depends on the type of testing situation and the nature of the items. In this
research, the researcher has used the method of discrimination Index calculation based on the
upper and lower group scorers having answered the items correctly. As stated by Ebel,
et.al(1986):
…. “The reasonably good level of discrimination of the item, is indicate by the difference
in proportions of correct response between upper and lower groups of scorers and each of
the distractors functioned well each attracted some responses and these were largely from
subjects in the lower scoring group.” (p228).
The item discrimination index is calculated in the following way:
1. Divide the group of test takers into two groups, high scoring and low scoring. Ordinarily,
this is done by dividing the examinees into those scoring above and those scoring below the
median.
2. Compute the number separately for the upper (p upper) and lower (p lower) scoring groups.
3. Subtract the two numbers such that D = p upper _ p lower / half N. This will give
discrimination index.
Following explanation was advanced to those who participated in item analysis process-How is
the item discrimination index interpreted? Unlike the item difficulty level p, the item
discrimination index can take on negative values and can range between -1.00 and 1.00.
Consider the following situation: suppose that overall, half of the examinees answered a
particular item correctly, and that all of the examinees who scored above the median on the exam
answered the item correctly and all of the examinees who scored below the median answered
incorrectly. In such a situation p upper = 1.00 and p lower = 0.00. As such, the value of the item
discrimination index D is 1.00 and the item is said to be a perfect positive discriminator. Many
would regard this outcome as ideal. It suggests that those who knew the material and were well-
prepared passed the item while all others failed it. Item discrimination index is a measure of
ISSN: 2249-2496 Impact Factor: 7.081
592 International Journal of Research in Social Sciences
http://www.ijmra.us, Email: [email protected]
effectiveness of an item in discriminating between high and low scorers on the entire test. High
value of D indicates more effectiveness of an item, whereas, low value would indicate item being
less effective. When value of D comes to be 1.00, it means all test takers in upper group and no
test takers in lower group answered the item correctly. On the contrary, if none from higher
group but all from lower group answered the item correctly, the value of D would be -1.00.
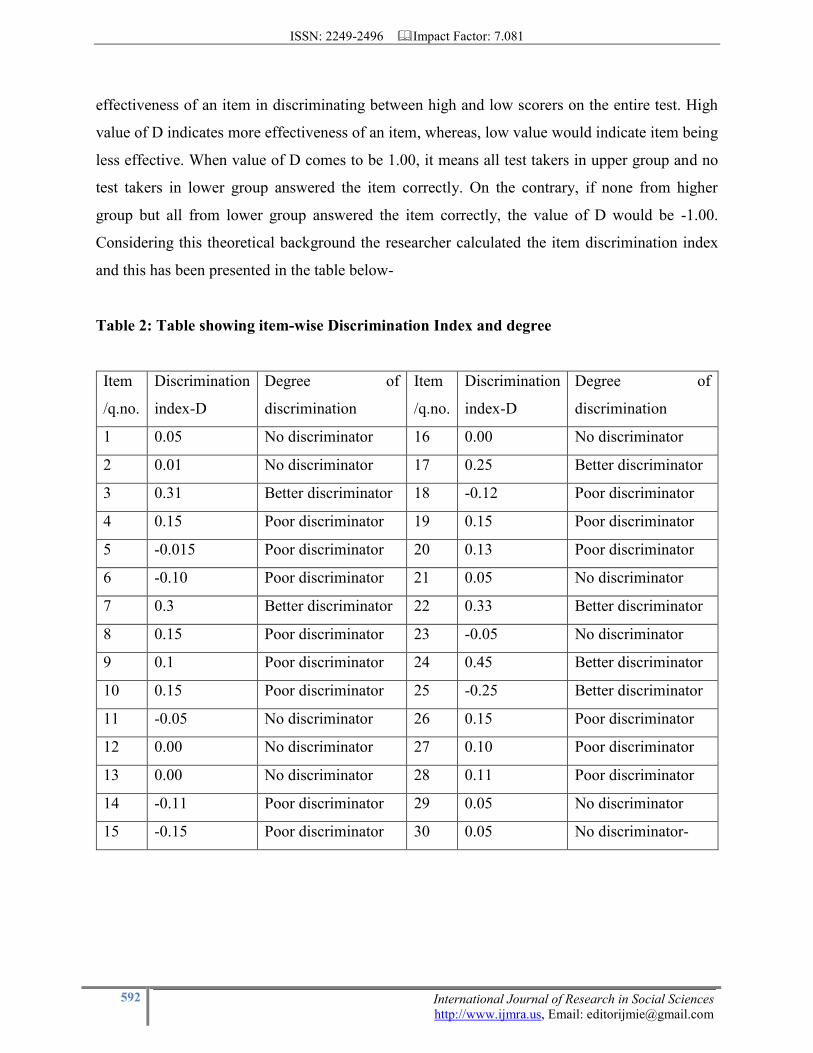
Considering this theoretical background the researcher calculated the item discrimination index
and this has been presented in the table below-
Table 2: Table showing item-wise Discrimination Index and degree
Item
/q.no.
Discrimination
index-D
Degree of
discrimination
Item
/q.no.
Discrimination
index-D
Degree of
discrimination
1 0.05 No discriminator 16 0.00 No discriminator
2 0.01 No discriminator 17 0.25 Better discriminator
3 0.31 Better discriminator 18 -0.12 Poor discriminator
4 0.15 Poor discriminator 19 0.15 Poor discriminator
5 -0.015 Poor discriminator 20 0.13 Poor discriminator
6 -0.10 Poor discriminator 21 0.05 No discriminator
7 0.3 Better discriminator 22 0.33 Better discriminator
8 0.15 Poor discriminator 23 -0.05 No discriminator
9 0.1 Poor discriminator 24 0.45 Better discriminator
10 0.15 Poor discriminator 25 -0.25 Better discriminator
11 -0.05 No discriminator 26 0.15 Poor discriminator
12 0.00 No discriminator 27 0.10 Poor discriminator
13 0.00 No discriminator 28 0.11 Poor discriminator
14 -0.11 Poor discriminator 29 0.05 No discriminator
15 -0.15 Poor discriminator 30 0.05 No discriminator-
ISSN: 2249-2496 Impact Factor: 7.081
593 International Journal of Research in Social Sciences
http://www.ijmra.us, Email: [email protected]
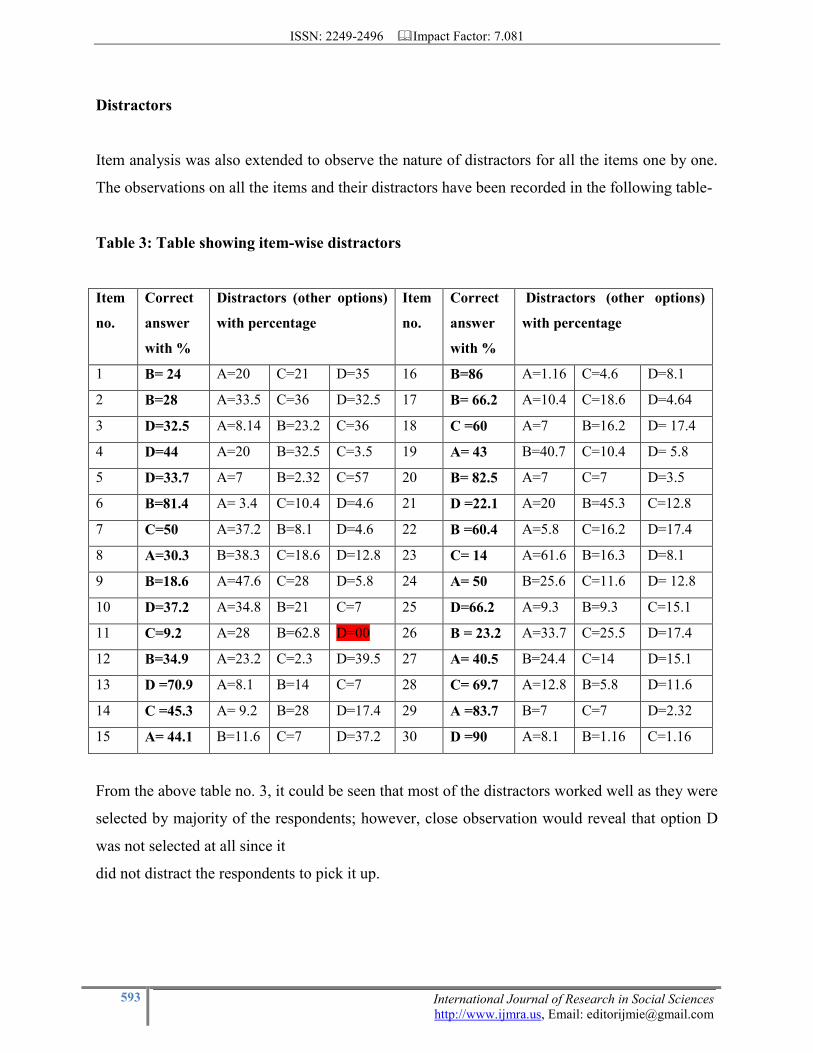
Distractors
Item analysis was also extended to observe the nature of distractors for all the items one by one.
The observations on all the items and their distractors have been recorded in the following table-
Table 3: Table showing item-wise distractors
Item
no.
Correct
answer
with %
Distractors (other options)
with percentage
Item
no.
Correct
answer
with %
Distractors (other options)
with percentage
1 B= 24 A=20 C=21 D=35 16 B=86 A=1.16 C=4.6 D=8.1
2 B=28 A=33.5 C=36 D=32.5 17 B= 66.2 A=10.4 C=18.6 D=4.64
3 D=32.5 A=8.14 B=23.2 C=36 18 C =60 A=7 B=16.2 D= 17.4
4 D=44 A=20 B=32.5 C=3.5 19 A= 43 B=40.7 C=10.4 D= 5.8
5 D=33.7 A=7 B=2.32 C=57 20 B= 82.5 A=7 C=7 D=3.5
6 B=81.4 A= 3.4 C=10.4 D=4.6 21 D =22.1 A=20 B=45.3 C=12.8
7 C=50 A=37.2 B=8.1 D=4.6 22 B =60.4 A=5.8 C=16.2 D=17.4
8 A=30.3 B=38.3 C=18.6 D=12.8 23 C= 14 A=61.6 B=16.3 D=8.1
9 B=18.6 A=47.6 C=28 D=5.8 24 A= 50 B=25.6 C=11.6 D= 12.8
10 D=37.2 A=34.8 B=21 C=7 25 D=66.2 A=9.3 B=9.3 C=15.1
11 C=9.2 A=28 B=62.8 D=00 26 B = 23.2 A=33.7 C=25.5 D=17.4
12 B=34.9 A=23.2 C=2.3 D=39.5 27 A= 40.5 B=24.4 C=14 D=15.1
13 D =70.9 A=8.1 B=14 C=7 28 C= 69.7 A=12.8 B=5.8 D=11.6
14 C =45.3 A= 9.2 B=28 D=17.4 29 A =83.7 B=7 C=7 D=2.32
15 A= 44.1 B=11.6 C=7 D=37.2 30 D =90 A=8.1 B=1.16 C=1.16
From the above table no. 3, it could be seen that most of the distractors worked well as they were
selected by majority of the respondents; however, close observation would reveal that option D
was not selected at all since it
did not distract the respondents to pick it up.
ISSN: 2249-2496 Impact Factor: 7.081
594 International Journal of Research in Social Sciences
http://www.ijmra.us, Email: [email protected]
Observations and Discussion
Similar to item difficulty, it could be said about item discrimination that discriminative nature of
item is relative to the group answering and is not a permanent feature. For some other group the
same item may prove to be better discriminator or no discriminator. These are also to be used as
guidelines to bring further improvement.
We test because we want to find out if students know the material, but all we learn for certain is
how they did on the exam we gave them. The item discrimination index tests the test in the hope
of keeping the correlation between knowledge and exam performance as close as it can be in an
admittedly imperfect system. Finding a perfect positive discriminator on an exam is relatively
rare. Most psychometricians would say that items yielding positive discrimination index values
of 0.30 and above are quite good discriminators and worthy of retention for future exams.
However the Table 1 above reflects that there were few items having discrimination Index
greater than or equal to 0.30, meaning thereby that these items on the said test were able to
discriminate between high and low scorers.
Finally, the difficulty and discrimination are not independent. If all the students in both the upper
and lower levels either pass or fail an item, there‟s nothing in the data to indicate whether the
item itself was good or not. Indeed, the value of the item discrimination index will be maximized
when only half of the test takers overall answer an item correctly; that is, when p = 0.50. Once
again, the ideal situation is one in which the half who passed the item were students who all did
well on the exam overall. However, that was not the case observed here.
Reliability
Reliability is expressed as the constancy of particular instruments in producing the same result in
repeated measurements. An instrument is considered reliable if the instrument produce same
result every time when use to evaluate identical measurement. Boyle and Radocy as mentioned
by ShafizanSabri(2013) in her research paper proposed using Kuder Richardson formula for
analyzing test with dichotomous items. Data were divided into two sections. Kuder-Richardson
20, a formula which is based on item difficulty was used to analyze internal consistency of a
comprehensive test. The value of KR20 range between 0 to 1.The closer the value to 1 the better
ISSN: 2249-2496 Impact Factor: 7.081
595 International Journal of Research in Social Sciences
http://www.ijmra.us, Email: [email protected]
the internal consistency. The KR20 formula is commonly used to measure the reliability of
achievement test with dichotomous choices. According to Fraenkel and Wallen, one should
attempt to generate a KR20 reliability coefficient of .70 and above to acquire reliable score.
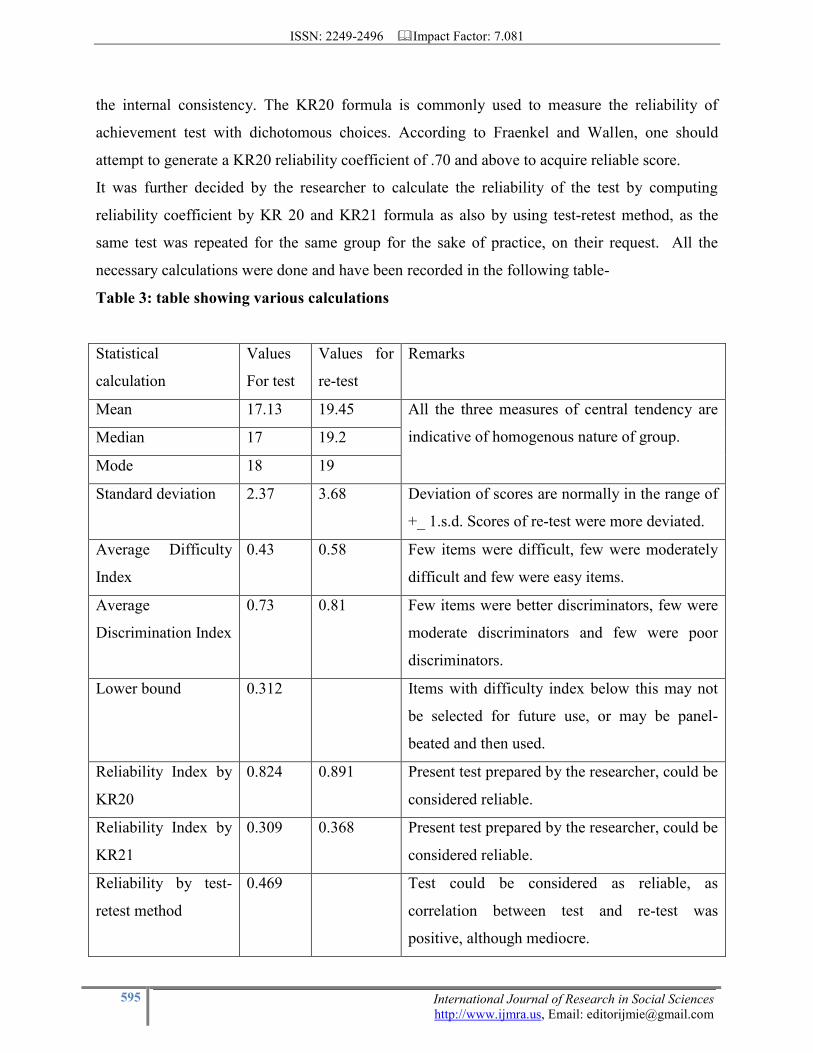
It was further decided by the researcher to calculate the reliability of the test by computing
reliability coefficient by KR 20 and KR21 formula as also by using test-retest method, as the
same test was repeated for the same group for the sake of practice, on their request. All the
necessary calculations were done and have been recorded in the following table-
Table 3: table showing various calculations
Statistical
calculation
Values
For test
Values for
re-test
Remarks
Mean 17.13 19.45 All the three measures of central tendency are
indicative of homogenous nature of group. Median 17 19.2
Mode 18 19
Standard deviation 2.37 3.68 Deviation of scores are normally in the range of
+_ 1.s.d. Scores of re-test were more deviated.
Average Difficulty
Index
0.43 0.58 Few items were difficult, few were moderately
difficult and few were easy items.
Average
Discrimination Index
0.73 0.81 Few items were better discriminators, few were
moderate discriminators and few were poor
discriminators.
Lower bound 0.312 Items with difficulty index below this may not
be selected for future use, or may be panel-
beated and then used.
Reliability Index by
KR20
0.824 0.891 Present test prepared by the researcher, could be
considered reliable.
Reliability Index by
KR21
0.309 0.368 Present test prepared by the researcher, could be
considered reliable.
Reliability by test-
retest method
0.469 Test could be considered as reliable, as
correlation between test and re-test was
positive, although mediocre.
ISSN: 2249-2496 Impact Factor: 7.081
596 International Journal of Research in Social Sciences
http://www.ijmra.us, Email: [email protected]
It could be observed from the above table 3 that generally the scores on re-test have been
increased as indicated by the value of mean; however, the s. d. seems to be much deviated in re-
test as compared to that in test. The correlation co-efficient in two tests seems to be very low
indicating mediocre type of relationship between the two tests. Reliability was also calculated by
KR20 and KR21 formula. It also indicated to be positive index of mediocre value.
Also the re-test indicated that the time taken by all the student teachers for re-test was less than
the time allocated to them in test-that was 45 minutes. The time taken in Re-test ranges from
8minutes to 20 minutes.
Objective-wise findings-
1. To intensify the understanding of item analysis- As item analysis was decided to be
practically done for the benefit of the in-service teachers, it enriched the understanding of the
researcher as well as a group of volunteer teachers, due to extensive readings, explanation and
practice.
2. To provide experience of item analysis to In-service teachers- Procedure of item
difficulty and item discrimination calculations were explained to the active participants and
calculations were explained and done to provide further experience.
3. To identify the items that are weak in terms of difficulty index – no. 1 , 2,3, 9, 11, 19,
21, 22, 23, 26 in the said test were having difficulty index too low to accept the item as it was
seen that all these items were very difficult. Item no. 6, 13, 14, 16, 17, 20, 25, 28, 29, 30 in the
test indicates that these items having larger values were easy and rest of them such as item no. 4,
5, 7, 8, 10, 12, 15, 18, 24, 27 were of mediocre type.
4. To identify the items that are weak in terms of Discrimination index- Items that were
not discriminators were 1, 2, 11, 12, 13, 16, 21, 23, 29, 30. Those that were better discriminators
were- 3, 7, 17, 22, 24, 25. The remaining ones viz.- 4, 5, 6, 8, 9, 10, 14, 15, 18, 19, 20, 26, 27, 28
were poor discriminators.
5. To analyze distractor- The analysis of distractors revealed that all the distractors worked
well and attracted respondents to select as a plausible answer of the items except for distractor D
in item no. 11.
6. To ascertain validity and reliability of test paper- The validity is what a test is
supposed to measure. In this test, it was supposed to measure the respondents overall
ISSN: 2249-2496 Impact Factor: 7.081
597 International Journal of Research in Social Sciences
http://www.ijmra.us, Email: [email protected]
understanding about items related to assessment and Evaluation unit studied and procedures
related to it such as item difficulty and item discrimination index.
The actual hands- on- experience was worth to ascertain validity of a test. The KR and KR1
calculations decided reliability.
Hypothesis testing
Hypotheses framed were tested through statistical evidences as follows-
H01: The items on exam paper are not difficult.
From table 1,it could be seen that ten items were difficult for some examinees, thus not accepting
hypothesis.
H02: The items on the exam paper are not discriminators between high fliers and low
scorers.
From distractor analysis, it was seen that seven items were better discriminators between high
scorers and low scorers, thus not accepting the hypothesis.
H03: The test is not valid and reliable.
From calculations indicated in table 3, it could be evident that the validity and reliability index
have been found to be acceptable, thus confirming validity and reliability of the test.
Conclusion
These items after modification should be stored in item pool or item bank so that next time if the
same teacher has to administer the test these items after modification could be re-used; as it is we
all agree that generating multiple-choice items is not so easy task. It is time-consuming also. The
researcher is of the opinion that extremely difficult or easy items will have low ability to
discriminate but such items are often needed to adequately sample course content objectives and
to keep focus on motivation factor of the high fliers and slow learners, especially on the norm-
referenced test.
However, item analysis should be considered positively, as it will sharpen calculative and critical
thinking skills of a test developer. It will also help develop items, or to improve developed items
properly, in future.
ISSN: 2249-2496 Impact Factor: 7.081
598 International Journal of Research in Social Sciences
http://www.ijmra.us, Email: [email protected]
If at all guess factor and correction factor are to be calculated, then it must be announced well
before the test is administered, as it will develop some personality changes in test takers, as a
result of which the responses to items might alter.
From the two calculative procedures of item difficulty index and item discrimination index, it
could be concluded that there could be following possibilities for the subjects having not scored
very good marks on the test-
1. That the test was not really very difficult –which could be seen from the value of p
(difficulty index of item no. 6, 13, 14, 16, 17, 20, 25, 28, 29, 30. Rests of them were mediocre
type.
2. The test could not discriminate between high fliers and slow learners as the value of
discrimination index for most of the items seen from the table was very low.
3. The test was valid as well as reliable.
4. The teachers who took the test were not, “Test wise” as a result they did not score on
easy items also.
Finally it could be concluded that adequacy and success of a test depends upon the care with
which test items are constructed and selected for inclusion in the test. Preserving such successful
items for future use, would also save the time of a person who has to construct test for one or
other purpose or for other group/s. This will also facilitate the professional growth of a test
constructor.
References:
Committee for the Accreditation of university qualifications (2015): TERMS OF
REFERENCE
& PROCEDURES: 5 MARCH 2015 (p:2)
Deshpande, S.(2003): Opportunities for continuing professional development through
Assessment: NCTE-2003
proceedings, University of Botswana
Ebel, R. L. trisbie, D. A. (1986): Essentials of Educational Measurement, New jersey,
Prentice-hall Inc
ISSN: 2249-2496 Impact Factor: 7.081
599 International Journal of Research in Social Sciences
http://www.ijmra.us, Email: [email protected]
Garrett ,H,E,,Woodworth, R.S.(1981): Statistics in psychology and Education, Bombay,
Vakills, Feffer&Simon ltd.
Linn, R L, Gronlund, N E (1995): Measurement and assessment in Teaching, New jersey,
Prentice-hall Inc.
Maizam Alias (2005): World Transactions on Engineering and Technology Education,
UICEE Vol.4, No.2, 2005
ShafizanSabri(2013): Item analysis of student comprehensive test for research in teaching
beginner string ensemble using model based teaching among music students in public
universities, ISSN: 2201-6333 (Print) ISSN 2201-6740 (Online) www.ijern.com
Zurawski, Raymond M. (2009): Item Analysis- making the most of it, unpublished paper.
http://www.erpjournal.net/wp-content/uploads/2012/07/ERPV38-1.-Drost-E.-2011.-
Validity- and-Reliability-in-Social-Science-Research.
http://indianresearchjournals.com/)
http://files.eric.ed.gov/
http://pareonline.net
http://ericae.net/
http://www.cup.ualberta.ca