Embed Size (px)
Citation preview

Exploring Microsoft PowerPoint 2003 Chapter 3 1 Committed to Shaping the Next Generation of IT Experts.
Chapter 3: Animating a Presentation: Diagrams and
ChartsRobert Grauer and Maryann Barber
Exploring Microsoft PowerPoint 2003

Exploring Microsoft PowerPoint 2003 Chapter 3 2
Objectives
Describe the diagrams that are available in the Diagram Gallery
Create a pyramid diagram, target diagram, and organization chart
Use custom formatting to change the appearance of various diagrams
Use Microsoft Graph to create and edit a chart

Exploring Microsoft PowerPoint 2003 Chapter 3 3
Objectives (continued)
Distinguish between charts with data series in rows and charts with data series in columns
Add custom animation to individual objects on a slide
Animate an organization chart so objects appear by level or branch
Animate a chart so that data appears by category or series

Exploring Microsoft PowerPoint 2003 Chapter 3 4
Case Study: The Kelso Performing Arts Center
The opening case study focuses on preparing a PowerPoint presentation to request funds from the city council to build a performing arts center. Students will open a partially completed presentation and add diagrams and animation. Students are also asked to add the sound of applause to the last slide and to print audience handouts.

Exploring Microsoft PowerPoint 2003 Chapter 3 5
The Diagram Gallery
Six different types Organization chart Cycle diagram Radial diagram Pyramid diagram Venn diagram Target diagram
earth
moon orbit`searth
last (third)quarter
gibbous moon
full moon
gibbous moon
first quarter
crescent
new moon
crescent
waning Moon
waxing Moon
SUN

Exploring Microsoft PowerPoint 2003 Chapter 3 6
Diagram Gallery (continued)
Pyramid diagram
Cycle diagramOrganization
chart
Venn diagram
Radial diagram
Target diagram
Exploring Microsoft PowerPoint 2003 Chapter 3 7
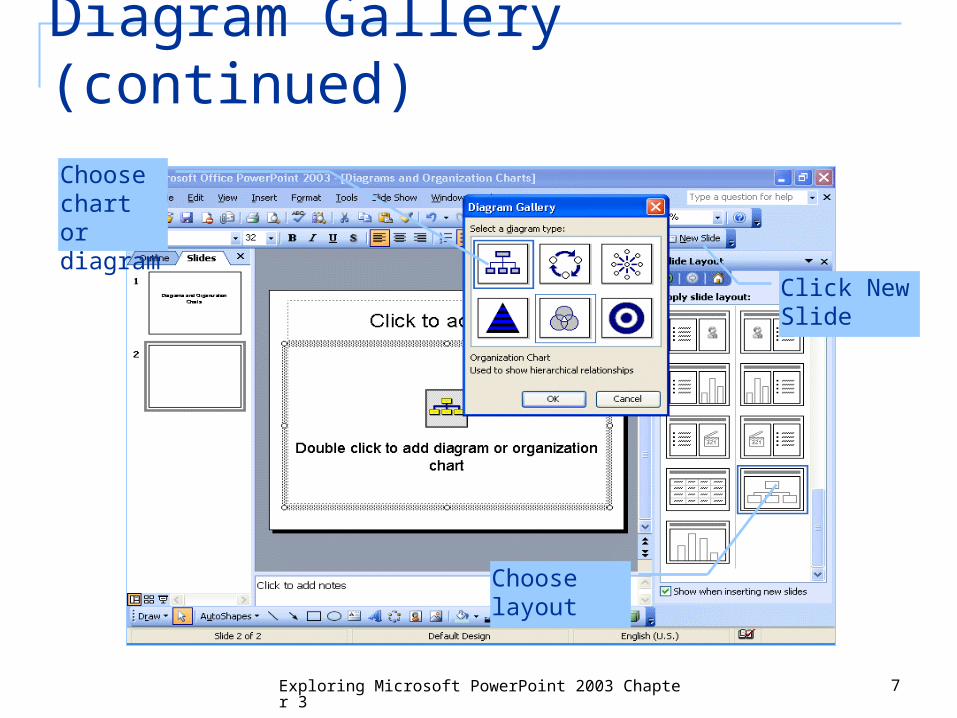
Diagram Gallery (continued)
Choose chart or diagram
Click New Slide
Choose layout

Exploring Microsoft PowerPoint 2003 Chapter 3 8
Organization Chart

Exploring Microsoft PowerPoint 2003 Chapter 3 9
Pyramid Diagram
Elite
Founder
Corporate
Family
Individual

Exploring Microsoft PowerPoint 2003 Chapter 3 10
Target Diagram
Individual
Family
Corporate
Founder
Elite

Exploring Microsoft PowerPoint 2003 Chapter 3 11
Cycle Diagram
Elite
Founder
Corporate
Family
Individual

Exploring Microsoft PowerPoint 2003 Chapter 3 12
Radial Diagram
Individual
Family
Corporate
Founder
Elite
Exploring Microsoft PowerPoint 2003 Chapter 3 13
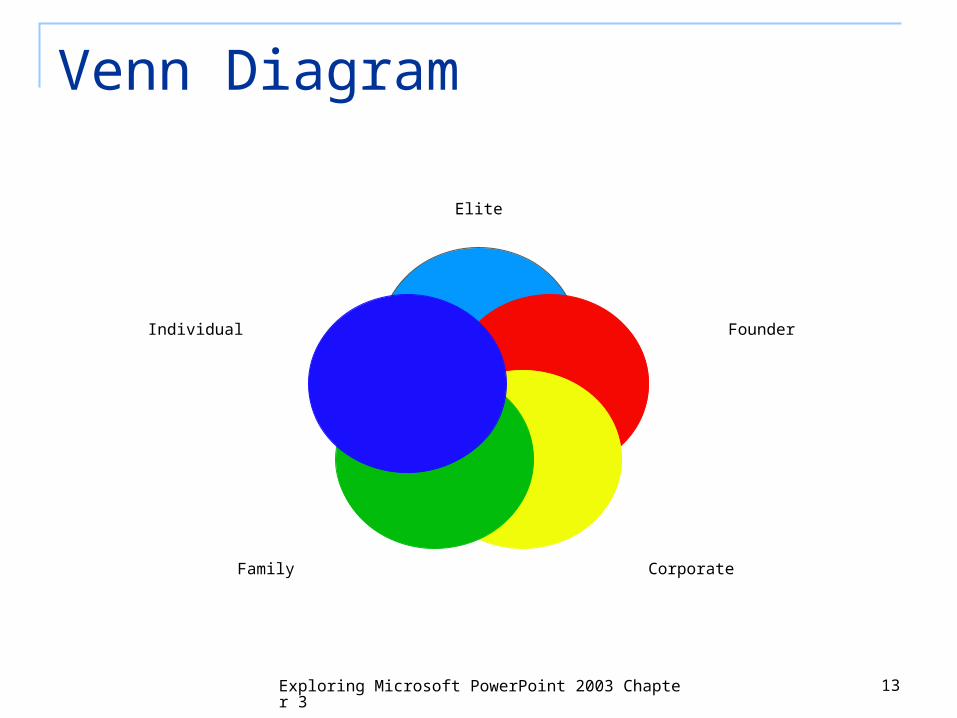
Venn Diagram
Elite
Founder
CorporateFamily
Individual

Exploring Microsoft PowerPoint 2003 Chapter 3 14
Hands-on Exercise 1
Title of Exercise: Diagrams and Organization Charts
Objective: to create and format an organization chart; to create a pyramid and target using the Diagram Gallery. Input file: None Output file: Diagrams and Organization Charts
Exploring Microsoft PowerPoint 2003 Chapter 3 15
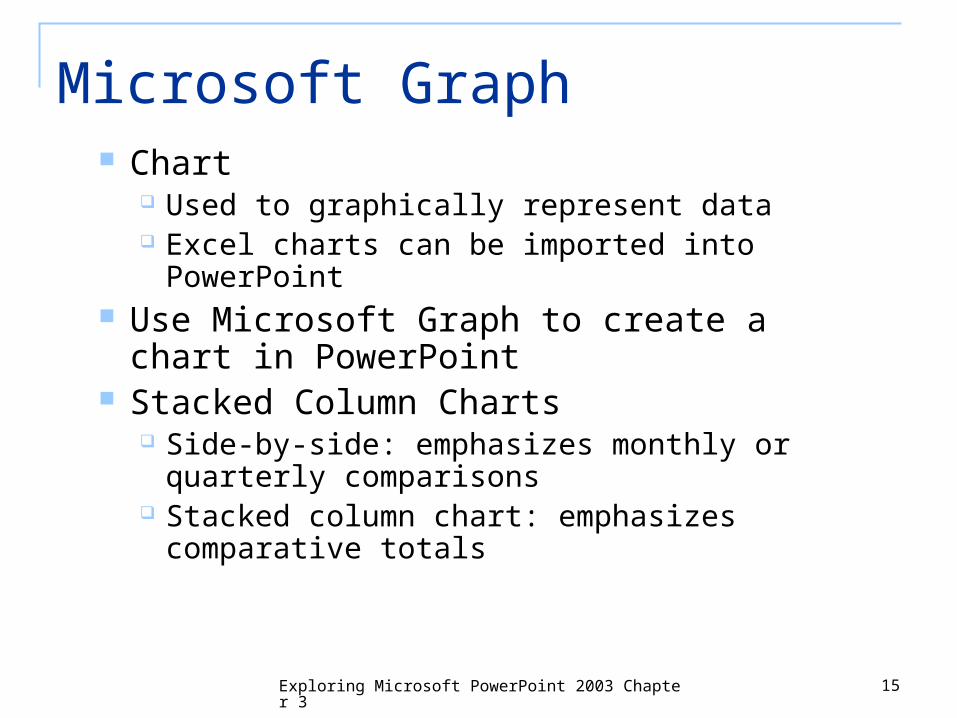
Microsoft Graph Chart
Used to graphically represent data Excel charts can be imported into PowerPoint
Use Microsoft Graph to create a chart in PowerPoint
Stacked Column Charts Side-by-side: emphasizes monthly or quarterly
comparisons Stacked column chart: emphasizes
comparative totals

Exploring Microsoft PowerPoint 2003 Chapter 3 16
Microsoft Graph (continued)
Click New Slide
Choose layout
Double click
Exploring Microsoft PowerPoint 2003 Chapter 3 17
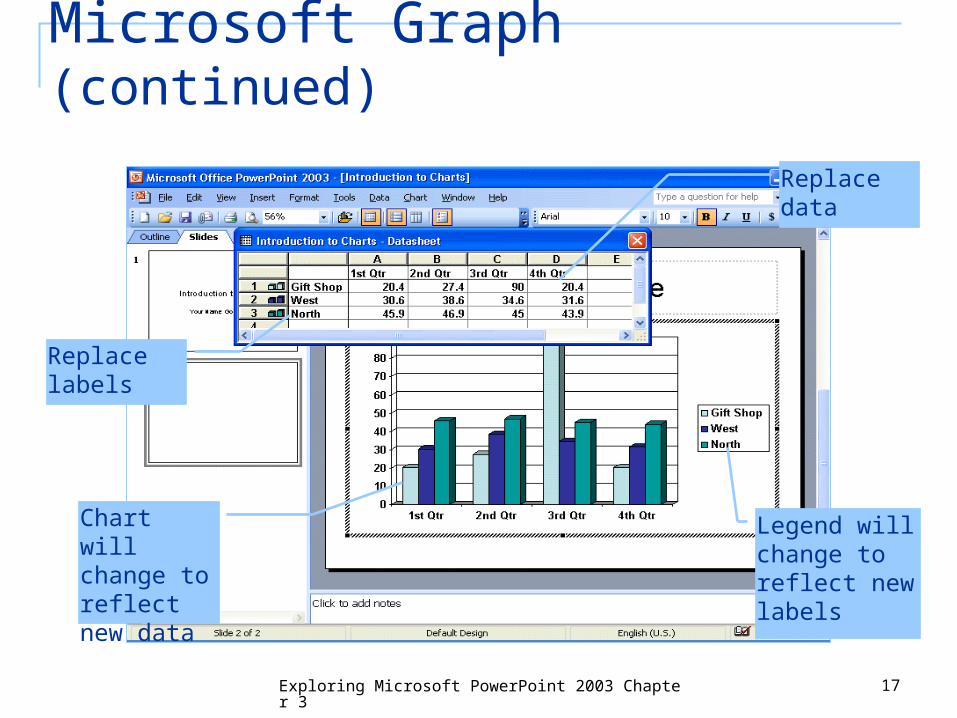
Microsoft Graph (continued)
Replace data
Legend will change to reflect new labels
Replace labels
Chart will change to reflect new data
Exploring Microsoft PowerPoint 2003 Chapter 3 18
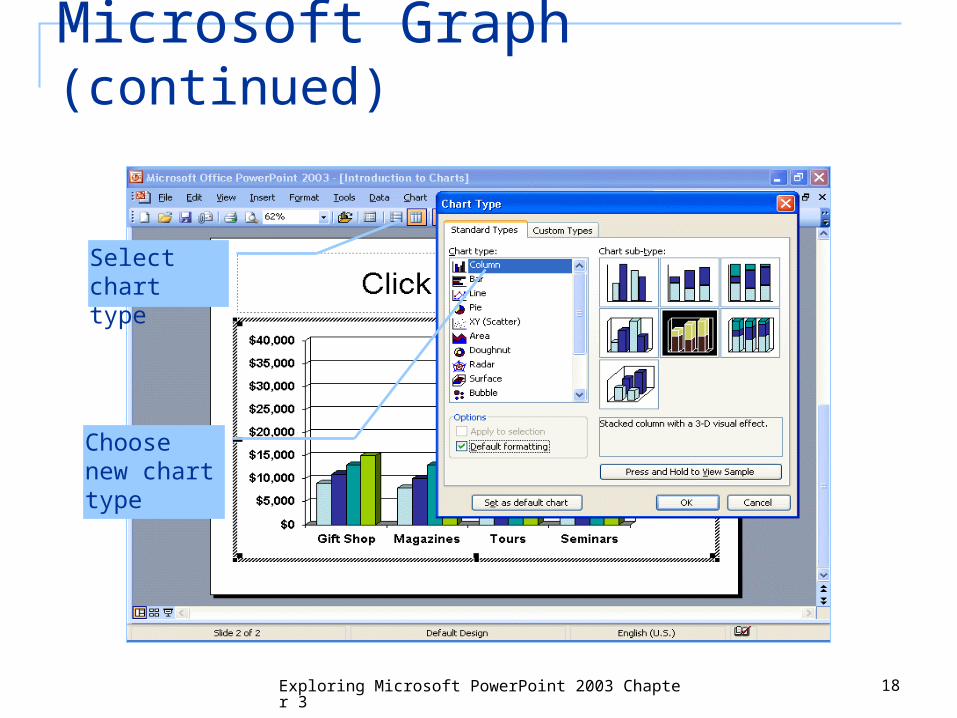
Microsoft Graph (continued)
Select chart type
Choose new chart type
Exploring Microsoft PowerPoint 2003 Chapter 3 19
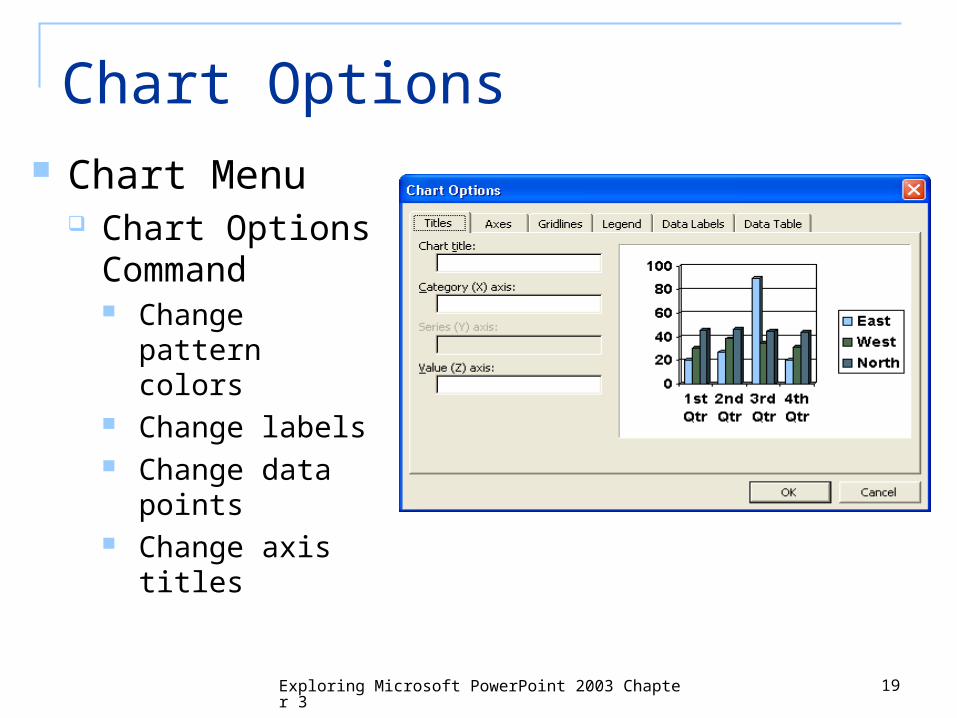
Chart Options Chart Menu
Chart Options Command Change pattern
colors Change labels Change data
points Change axis titles

Exploring Microsoft PowerPoint 2003 Chapter 3 20
Hands-on Exercise 2
Title of Exercise: Microsoft Graph Objective: use Microsoft Graph to insert a
graph into a presentation, modify the graph to display the data in rows or columns, change the graph format and the underlying data. Input file: None Output file: Introduction to Charts

Exploring Microsoft PowerPoint 2003 Chapter 3 21
Custom Animation
Custom Animation is used for controlling the way each individual object will appear on or disappear from the screen
Custom Animation also controls what an object does while it is on the screen
The advanced timeline shows the sequence in which each object appears and the duration that each object stays on screen
Exploring Microsoft PowerPoint 2003 Chapter 3 22
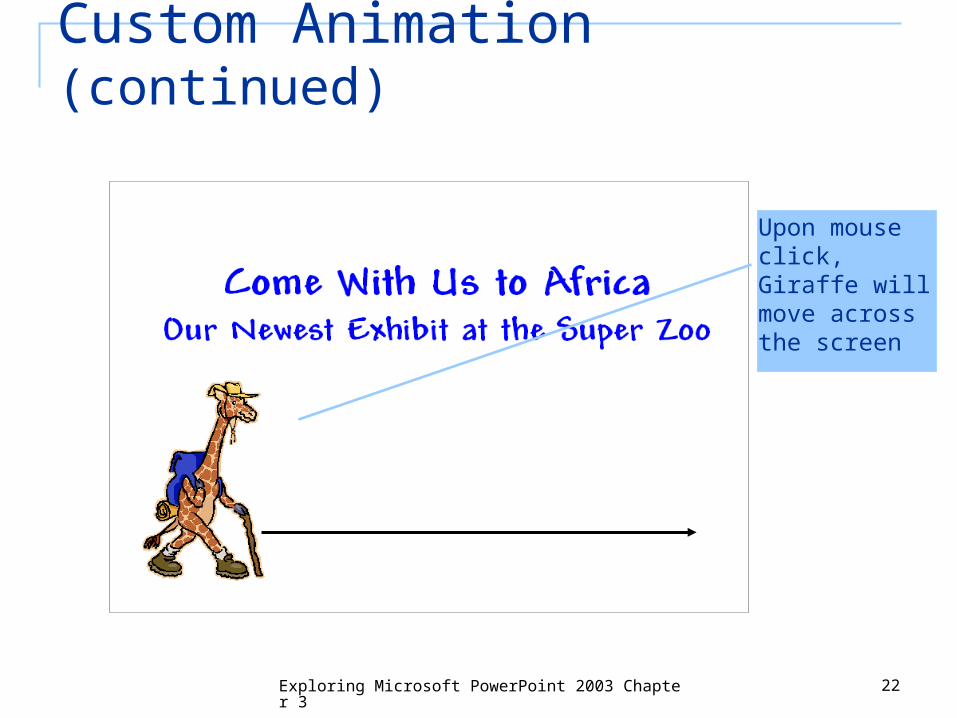
Custom Animation (continued)
Upon mouse click, Giraffe will move across the screen
Exploring Microsoft PowerPoint 2003 Chapter 3 23
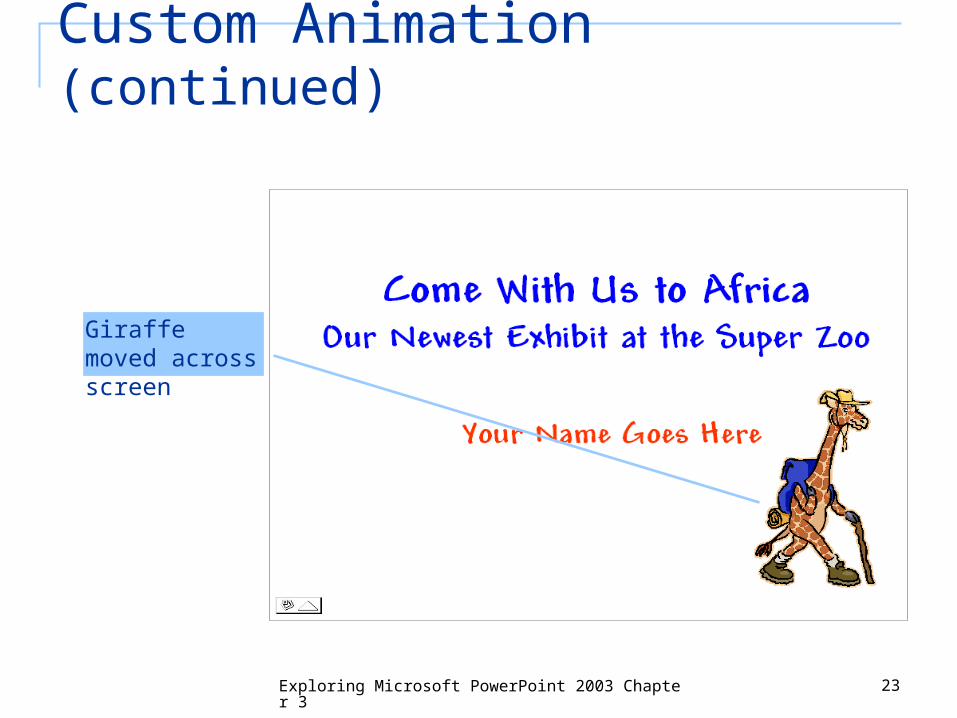
Custom Animation (continued)
Giraffe moved across screen

Exploring Microsoft PowerPoint 2003 Chapter 3 24
Custom Animation (continued)
Giraffe has exited the screen

Exploring Microsoft PowerPoint 2003 Chapter 3 25
Custom Animation (continued)
Animation option
Entrance effect
Exit effect
Emphasis effect
Change Effect
Timeline

Exploring Microsoft PowerPoint 2003 Chapter 3 26
Hands-on Exercise 3
Title of Exercise: Microsoft Graph Objective: add custom animation to individual
objects on a slide, use custom animation to animate an organization chart and a graphical chart. Input file: Super Zoo Output file: Super Zoo Solution

Exploring Microsoft PowerPoint 2003 Chapter 3 27
Summary The Diagram Gallery provides six figure types to
work with A chart can be used to represent data in a
graphical format An Excel chart can be imported into PowerPoint A chart can contain data points, labels, and may include
different formatting options
Custom animation determines the ways objects will appear on a slide

Exploring Microsoft PowerPoint 2003 Chapter 3 28
End-of-chapter Exercises Multiple Choice Practice Exercises
Exercise 1 – Animation 101 Exercise 2 – Adding a Timeline Exercise 3 – Working with Photographs Exercise 4 – Organization Charts Exercise 5 – The Diagram Gallery Exercise 6 – Charts and Animation Exercise 7 – Left Brain/Right Brain Exercise 8 – The Grand Finale

Exploring Microsoft PowerPoint 2003 Chapter 3 29
End-of-chapter Exercises
Mini Cases Case 1 – Digital Cameras Case 2 – Microsoft Producer Case 3 – Microsoft Excel vs. Microsoft
Graph Case 4 – Movies and Video

Exploring Microsoft PowerPoint 2003 Chapter 3 30
Questions?