Embed Size (px)
Citation preview
Journal of Student Financial Aid Journal of Student Financial Aid
Volume 49 Issue 2 Article 3
2020
Exploring IDR: A Comparison of Financial Situations and Exploring IDR: A Comparison of Financial Situations and
Behaviors Between Those in Traditional Student Loan Repayment Behaviors Between Those in Traditional Student Loan Repayment
and Those in Income-Driven Repayment and Those in Income-Driven Repayment
Daniel A. Collier W.E. Upjohn Institute, [email protected]
Follow this and additional works at: https://ir.library.louisville.edu/jsfa
Part of the Higher Education Administration Commons
Recommended Citation Recommended Citation Collier, Daniel A. (2020) "Exploring IDR: A Comparison of Financial Situations and Behaviors Between Those in Traditional Student Loan Repayment and Those in Income-Driven Repayment," Journal of Student Financial Aid: Vol. 49 : Iss. 2 , Article 3. Available at: https://ir.library.louisville.edu/jsfa/vol49/iss2/3
This Research Article is brought to you for free and open access by ThinkIR: The University of Louisville's Institutional Repository. It has been accepted for inclusion in Journal of Student Financial Aid by an authorized administrator of ThinkIR: The University of Louisville's Institutional Repository. For more information, please contact [email protected].

Exploring IDR: A Comparison of Financial Situations and Behaviors Between Exploring IDR: A Comparison of Financial Situations and Behaviors Between Those in Traditional Student Loan Repayment and Those in Income-Driven Those in Traditional Student Loan Repayment and Those in Income-Driven Repayment Repayment
Cover Page Footnote Cover Page Footnote I would like to thank the good people from the Association for Education Finance and Policy (AEFP) who inspired me to return to this data by presenting glaring gaps in what is known about IDR – notably Mike Pierce of the Student Borrower Protection Center and Dr. Judith Scott-Clayton. Additionally, I thank Dr. Richard Herman for the incentives gift and Dr. Walter McMahon for guidance throughout the data collection process. Next, Dr. Brad Hershbein of the W.E. Upjohn Institute for early guidance on this study and Robert (Eddy) Conroy for helping me think through the implications for financial aid practitioners. Lastly, I thank Dr. Robert Kelchen of Seton Hall and Dr. Nick Hillman of the University of Wisconsin for providing extensive feedback on prior drafts - and Dr. Dan Fitzpatrick on elements of the revision.
This research article is available in Journal of Student Financial Aid: https://ir.library.louisville.edu/jsfa/vol49/iss2/3

Journal of Student Financial Aid Center for Economic Education at the University of Louisville Vol. 49, N2, 2020 1
Exploring IDR: A Comparison of Financial Situations and Behaviors Between Those in Traditional Student Loan Repayment and Those in Income Driven Repayment By: Daniel A. Collier This quantitative, exploratory study (N=266) examined: (1) financial differences between those enrolled in student-loan based Traditional and Income-Driven Repayment (IDR) schemes, (2) factors that link to IDR enrollment, and (3) whether IDR correlates to the likelihood of reporting to save zero dollars in savings and retirement and in being a homeowner. Descriptive tests indicated differences in loan and earnings-related measurements, and other financial differences, favoring those in traditional repayment. Logistic regression reporting Marginal Effects suggested enrollment in IDR correlated with student loan debt starting at $60,000 and upward (ME=0.41-0.59) and income (ME=0.52-0.36) - with lower-middle to middle-income earners being most likely enrolled (GAI $25,000-39,9999 and GAI $40,000-54,999). IDR enrollment was also correlated with being married (ME=-0.24), being male (ME=-0.20), and living in an urban cluster (ME=0.25). Furthermore, IDR enrollment correlated with a higher likelihood of claiming to save “zero” dollars per month (ME=0.25) but not with participation in monthly retirement savings or homeownership. Discussion leans on Rational Choice Theory and Permanent Income Hypotheses to help explain why individuals choose enrollment into IDR, calls for financial aid practitioners to provide counsel on the enrollment decision, and for additional research and caution as IDR is being examined for modification without a strong understanding of borrowers’ situations. Keywords: Student loan debt, savings and retirement, income-driven repayment, rational choice
ebate surrounding Income-Driven Repayment’s (IDR) viability and cost to the federal government remains a focal point for parties interested in overhauling elements of the federal student loan program. Proponents of IDR suggest the repayment scheme can protect borrowers from
economic shocks and helps the federal government stem delinquency or default rates (Hillman, 2013). Skeptics argue that IDR provides large subsidies for graduate degree earners, possessing higher than average debt with above-average incomes; thus, protects individuals who may not need safeguarding (Delisle, 2013). Emergent studies suggest skeptics may be partially correct, in that increased student debt-loads correlate with enrollment in IDR (Frotman & Gibbs, 2017) and that the scheme seems to provide generous subsidies for individuals with graduate and professional degrees (Brooks, 2018, Looney & Yannelis, 2018). However, skeptics’ stances are not fully founded, as possessing low to moderate yearly incomes is more strongly connected with enrollment in IDR than possessing higher incomes (Blagg, 2018).
Daniel A. Collier is a Researcher at the W.E. Upjohn Institute.
D
Collier: Exploring IDR: A Comparison of Financial Situations and Behaviors Between Those in Traditional Student Loan Repayment and Those in Income Driven Repayment
2 Journal of Student Financial Aid Center for Economic Education at the University of Louisville Vol. 49, N2, 2020
Another contentious point is that IDR costs the federal government too much. Citing increased engagement in IDR, the U.S Government Accountability Office (2016) predicts that over time IDR may cost the federal government up to 400% more than initial estimates. Although IDR costs have risen beyond initial predictions, arguably a positive net subsidy would not necessarily hurt the budget as the federal government could absorb such and the increased access to college resulting from expanded IDR programs are likely providing net benefit socio-economic returns not usually considered when debating the value of the repayment scheme (Brooks, 2018). The conversation surrounding total cost to the government is a crucial factor from which to develop or modify policy. Yet, these conversations are entertained while knowing little about the factors linking to individuals’ decision to enroll in IDR and the financial situations of borrowers in IDR. This study brings forth evidence that advances conversations surrounding IDR and gives borrowers a stronger voice in the debate by exploring the following research questions:
1. How are finances and financially-related behaviors of those in IDR different from those in
Traditional repayment? 2. How do demographic characteristics, total student loan debt, and annual gross earnings correlate with
enrollment in an IDR program? 3. Controlling for demographic variables, total student loan debt, and earnings, does a direct
relationship exist between IDR and reporting: (a) Zero dollars in savings per month, (b) Zero dollars in retirement savings per month, and (c) Homeownership?
Review of Literature
Student Loan Debt and Income-Driven Repayment Beliefs that student loan repayment should be adaptive to individuals’ earnings predates the modern student loan system (e.g. Friedman, 1955). Yet, policymakers cementing the current system rejected IDR, favoring a mortgage-like, fixed repayment scheme. The fixed repayment scheme was favored due to perceived complications regarding the tabulation of monthly repayments (Carlsson, 1970) and beliefs that IDR could destabilize systems keeping public institutions’ tuition low (Shireman, 2017). As the established financial aid system evolved and access widened, aid packages became increasingly reliant on student loans (Dynarski & Scott-Clayton, 2013). Simultaneously, influenced by economic factors and legally mandated obligations (Delaney & Doyle, 2011) and in recognition of the ability to push increased shares of the cost of college onto students and families, states’ investment per-student in postsecondary education declined. In combination, these actions have forced more families to borrow to pay for college, expanding aggregate and average student loan debt (Best & Best, 2014).
Across 44 million borrowers, aggregate student loan debt (SLD) has trended towards $1.5 trillion (Federal Reserve Bank of New York, 2018). Estimates indicate that nearly 70% of students graduate from four-year colleges possessing student loan debt, with an average balance of approximately $30,000 (Cochrane & Cheng, 2016). Individuals with graduate degrees are most likely to possess the highest balances with average debt calculated at approximately $57,000 (Delisle, Phillips, & van der Linde, 2014). Whereas the average debt loads provide preliminary context across borrowers, load burdens over $50,000 has more than doubled between 2000 to 2014 - with over 40 million borrowers in total owning more than half of all outstanding student loan debt. By quintile, the top 20-percent of borrowers by debt-load own 61% of outstanding debt with a median balance of approximately $62,000, while those residing in the 60th-80th percentile possess 20% of the outstanding balance with a median balance of just over $26,000 (Looney & Yannelis, 2018). The expansion of aggregate and average loan debt has brought discussions surrounding a student loan debt crisis (e.g. Elvery, 2016), with evolving research illustrating connections between SLD and various negative financial behaviors and situations – for example, the inability to place any money into savings (American Student Assistance, 2015), or build retirement related-savings (Elliot et al., 2013), and

Collier: Exploring IDR: A Comparison of Financial Situations and Behaviors Between Those in Traditional Student Loan Repayment and Those in Income Driven Repayment
Journal of Student Financial Aid Center for Economic Education at the University of Louisville Vol. 49, N2, 2020 3
reduced likelihood of homeownership (Chakrabarti, Haugwout, Lee, Scally, & van der Klaauw, 2017). Increasing debt and subsequent connections to poor financial and social health has prompted proponents from both major U.S. political parties to reexamine and revamp the federal student loan system (Shireman, 2017).
Development and implementation of IDR policies have resulted from compromise and remain a topic of
intense debate. For example, one of the earliest nationally implemented IDR schemes was enacted only when the Clinton administration agreed to not automatically place institutions into or promote the emerging Direct Loan system, which housed an IDR scheme, over the previous system which did not. Since the implementation of the Clinton era IDR scheme, additional programs have been generated under Republican (e.g. George Bush Jr. – Public Service Loan Forgiveness) and Democratic (e.g. Barack Obama - REPAYE) administrations (Shireman, 2017). A recent proposal, promoted by the Trump administration, intends to increase monthly repayment based on 12.5% (+2.5% for most IDR plans) of discretionary income, reduce loan forgiveness to 15 years (-5 years) for individuals with undergraduate degrees, and increase loan forgiveness to 30 years (up to 10 years for several IDR plans) for those with graduate degrees (Delisle & Holt, 2017). As is it stands, depending on the type of federal loan and years that borrowers assumed the debt, individuals have access to these IDR schemes: (1) Income-Based Repayment (IBR), (2) Income Contingent Repayment (ICR), (3) Pay As You Earn (PAYE), and (4) Revised Pay As You Earn (REPAYE)1 (U.S. Department of Education, 2018). The Public Service Loan Forgiveness (PSLF) benefit also exists but is not exclusive to an IDR plan. However, ED suggests IDR enrollment as in the standard repayment scheme individuals would simply repay loans by the time forgiveness would be achieved (U.S. Department of Education, 2018a).
Mimicking exit counseling in choosing repayment scheme, emergent research suggests many borrowers
still choose traditional repayment as it is the default scheme, despite IDR being a financially better choice with default protections built in (Cox, Kreisman, & Dynarski, 2018). As such, some borrowers find themselves mandated into IDR after defaulting (U.S. Department of Education, 2018a). However, recently IDR has expanded as more borrowers were granted access and made aware of the option. From 2011 to 2015, the total loan volume repaid through IDR increased by 625% from $7.1 to $51.5 billion dollars (U.S. Department of Education, 2018b). Across IDR programs over six-million borrowers are enrolled (Cheng & Thompson, 2017).
Whereas each repayment scheme has unique terms, IDR aims to be adaptive to borrowers’ varying
economic situations, ensuring repayment does not overburden the borrower (Hillman, 2013). IDR treats repayment similarly to taxation based on income and familial circumstances, like being married and having dependents (Brooks, 2018). The scant research exploring enrollment in IDR indicates that individuals with modest to moderate-income tend to enroll in IDR at higher rates than those with higher income (Blagg, 2018). Additionally, aggerate student loan debt seemingly correlates to decisions to enroll in IDR, as borrowers with higher debt are more likely to take advantage of the option (Frotman & Gibbs, 2017). Underscoring this research, although more people are enrolling in IDR, little is known about the enrollees’ characteristics and nuanced understandings of finances or associated situations are lacking (Hillman, 2015).
Financial Issues Associated with Student Loan Debt
Savings. Possessing debt not associated to property (unsecured debt) is correlated with an inability to save for emergencies, in part due to higher difficulties in covering monthly expenses (Grinstein-Weiss, Oliphan, Russell, & Roshara, 2015). As compared to individuals without SLD, those with SLD experience significantly lowered total net-worth, related to a weakened capacity to save and lower rates of
1 REPAYE was enacted just as data-collection for this study was finishing up. Therefore, it was not an option in the survey.
Collier: Exploring IDR: A Comparison of Financial Situations and Behaviors Between Those in Traditional Student Loan Repayment and Those in Income Driven Repayment
4 Journal of Student Financial Aid Center for Economic Education at the University of Louisville Vol. 49, N2, 2020
homeownership (Elliott, Grinstein-Weiss, & Nam, 2013). Illustrating SLD’s linkages with financial distress and savings, as balances rise so does the likelihood of being unable to generate $2,000 for emergencies (de Bassa Schersberg, Lusardi, & Yokaboski, 2014). Supplementing these findings, an American Student Assistance (2015) report found that nearly 50% of respondents with SLD conveyed they possess no emergency savings – meaning many are likely living paycheck-to-paycheck. However, as gross annual income (GAI) rose the percentage of those reporting to not possess emergency funds generally declined; 70% of those making under $25,000 cite having no emergency savings whereas 31% of those making $100,000 or more report such.
Retirement. Nationally 53% of Americans participate in any type of retirement savings plan, down 7%
from 2001 (Morrissey, 2016). The percentage of college-educated families with retirement savings plans stands at 76%, a 23% increase over those with “some” college and 33% increase over those with a high-school or GED education (Morrissey, 2016). Seemingly, possessing SLD does not strongly deter participation in retirement plans (Rutledge et al., 2018). Whereas SLD may not significantly relate to enrollment in retirement savings accounts, wealth accumulated for retirement is seemingly affected. Regarding the capacity to save enough money for retirement, households with SLD have half the amount ($25,000) in retirement savings as those without (Elliot et al., 2013). Although simply possessing SLD may be linked with retirement-related amounts saved, increases in SLD balances appear not to impact accumulated retirement wealth (Rutledge et al., 2018). While a link has been established between student loan debt and an inability to save, studies examining such, like those cited here, usually scrutinize differences between individuals with SLD to those without or by balance, leaving out enrollment in repayment schemes.
Homeownership. Generally, inverse relationships are found between possessing SLD and
homeownership among young adults (Houle & Berger, 2015). Prior research suggests possessing SLD and increased balances correlate with lower credit scores, driving many into less than optimal or subprime categories, and resulting in higher mortgage interest rates, increased chances of mortgage denial, and lower homeownership rates (Mezza, Ringo, Sherlund, & Sommer, 2016). Chakrabarti et al. (2017) illustrate that American adults between the ages of 20 to 33 who have graduated college with SLD lag behind those without SLD – at age 26, nearly 25% of college graduates without debt are homeowners, contrasted to the 18% of college graduates with debt. Graduates with debt remain behind into their 30’s. However, at age 33, graduates without debt have homeownership rates of 56%, compared to 52% for those with debt. For young adults, deviations are found in homeownership rates between individuals possessing under $25,000 and those with more than $25,000 in SLD. Again, this gap closed by age 32 when roughly 43% of both groups were homeowners (Chakrabarti et al., 2017). Likewise, for young adults in their 20s, increases of $1,000 in SLD delayed buying a home by 2.5 months. Yet, the effects of SLD on homeownership seemingly weakened as adults progressed into their 30s, which the authors attributed to the life-cycle of earnings as on average individuals in their 30s should be earning more than those in their 20s (Mezza et al., 2016). Income remains one of the strongest predictors of homeownership, nationally adults above the median family income have elevated rates of homeownership (78-80% since 2013; U.S. Census Bureau, 2018).
Guiding Framework
Rational Choice & Permanent Income Hypothesis This study is guided by Rational Choice Theory (RCT) and the Permanent Income Hypothesis (PIH). RCT suggests that choices and actions result from individuals applying known knowledge and social pressures to internal models of consequences connected with cost-benefit calculations, where individuals ultimately make what is personally believed to be the optimal choice (Becker, 1962). The Permanent Income Hypothesis, an extension of the Life-Cycle Hypothesis, posits choices and behaviors are predicated upon a bounded understanding of current and expected long-term income (Friedman, 1957). PIH is usually applied to
Collier: Exploring IDR: A Comparison of Financial Situations and Behaviors Between Those in Traditional Student Loan Repayment and Those in Income Driven Repayment
Journal of Student Financial Aid Center for Economic Education at the University of Louisville Vol. 49, N2, 2020 5
consumption habits, for higher education “consumption” is generally framed as the understanding that attending an institution should develop skills that ultimately lead to higher future earnings. Often, studies apply RCT to examining choices students and families make in deciding which institution to attend and choices made during college (e.g. Perna, 2006). This study applies these frameworks to post-college decisions about how to repay SLD, in that individuals will include into their cost-benefits calculations current and calculated future income along with perceived socio-economic outcomes when deciding whether to enroll in IDR repayment.
Critiques have been levied against both theories. First, PIH suggests individuals can generally predict stable future incomes. Economic shocks and lags in macroeconomic indicators can debase this assumption. Noting these critiques, Hall (1978) illustrates that individuals make savings and consumption choices relevant to their current income, not expected future income, stating, “any information available today about future income is already incorporated in today’s permanent income” (p. 986). Thus, decisions are modified only when “new” policy or events occur, changing current income and influencing predictors of future income. A dominant critique of RCT is that individuals may never have enough information to act “rationally.” Even when individuals may feel informed, asymmetrical information exists between individuals and stakeholders intending to benefit (Stiglitz, 2012). Furthermore, while individuals may be well informed, the influence of emotions and social pressures may confound rational decisions (Popa, 2015). For college, asymmetric information, emotions, and social pressures influence borrowing and default patterns (Yannelis, 2015), but little remains known about such.
Proponents of RCT contend the theory does not label individuals as “rational;” instead, RCT suggests
that individuals make rational decisions based on personal preferences, circumstances, and bounded knowledge (Popper, 1984). As individuals’ preferences are modified by new experiences or as circumstances change, so may the cost-benefit calculation (Shepsle & Bonchk, 1997). RCT labels all choices “rational,” encouraging explorations of factors that lead to and explain why each choice was made (DesJardins & Toutkoushian, 2005).
Sample The sample was generated via an online survey, promoted to several online student loan debt communities across popular social media platforms and relied upon snowballing recruitment. Participants accessed the survey from groups and discussion boards on: Facebook (n=161, 61%), Reddit (n=70, 26%), LinkedIn (n=6, 2%), and Quora (n=1, <1%). To gain the trust of group administrators, who promoted the survey to their respective communities, I agreed to the request that exact groups where participants were recruited remained anonymous. An additional 8% of the sample (n=22) reported they accessed the survey by referral, 1% (n=3) indicated they accessed the survey by an unspecified online platform, and an additional 1% (n=3) of participants did not provide any indication of how they became involved with the survey. I relied upon snowball sampling and external stakeholders to promote the survey in online forums to access an otherwise hard-to-engage population. Understandably my strategy and associated limitations of the online group or forum descriptions may hurt generalizability.
Data were collected between June and November in 2015. Participants were offered a $5.00 Amazon gift card for completion of the survey and entered a lottery-type drawing to win an additional $10.00 to $250.00. Along with demographic information, the survey captured self-reports of individuals’ (not household) student loan debt balances, monthly repayments, enrollment in repayment scheme, annual gross income, monthly savings and retirement, homeownership, monthly bills – excluding SLD, credit availability and debt-loads, and FICO score category.
Collier: Exploring IDR: A Comparison of Financial Situations and Behaviors Between Those in Traditional Student Loan Repayment and Those in Income Driven Repayment
6 Journal of Student Financial Aid Center for Economic Education at the University of Louisville Vol. 49, N2, 2020
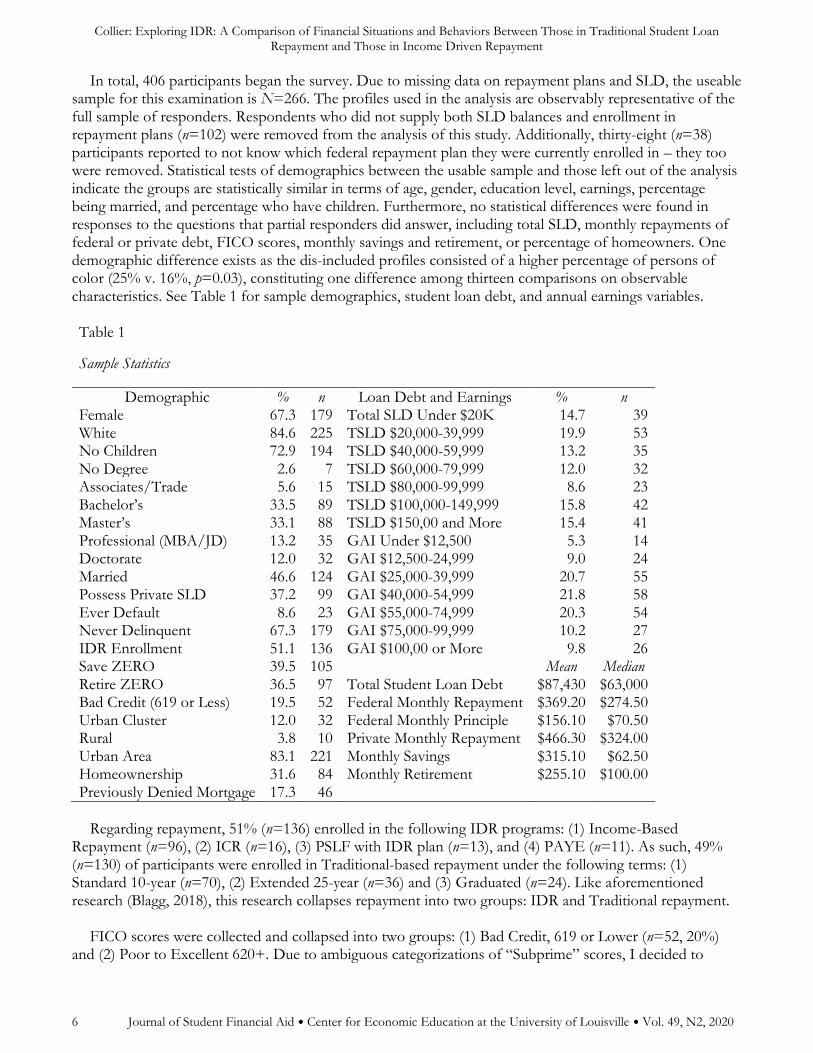
In total, 406 participants began the survey. Due to missing data on repayment plans and SLD, the useable sample for this examination is N=266. The profiles used in the analysis are observably representative of the full sample of responders. Respondents who did not supply both SLD balances and enrollment in repayment plans (n=102) were removed from the analysis of this study. Additionally, thirty-eight (n=38) participants reported to not know which federal repayment plan they were currently enrolled in – they too were removed. Statistical tests of demographics between the usable sample and those left out of the analysis indicate the groups are statistically similar in terms of age, gender, education level, earnings, percentage being married, and percentage who have children. Furthermore, no statistical differences were found in responses to the questions that partial responders did answer, including total SLD, monthly repayments of federal or private debt, FICO scores, monthly savings and retirement, or percentage of homeowners. One demographic difference exists as the dis-included profiles consisted of a higher percentage of persons of color (25% v. 16%, p=0.03), constituting one difference among thirteen comparisons on observable characteristics. See Table 1 for sample demographics, student loan debt, and annual earnings variables.
Table 1
Sample Statistics
Demographic % n Loan Debt and Earnings % n Female 67.3 179 Total SLD Under $20K 14.7 39 White 84.6 225 TSLD $20,000-39,999 19.9 53 No Children 72.9 194 TSLD $40,000-59,999 13.2 35 No Degree 2.6 7 TSLD $60,000-79,999 12.0 32 Associates/Trade 5.6 15 TSLD $80,000-99,999 8.6 23 Bachelor’s 33.5 89 TSLD $100,000-149,999 15.8 42 Master’s 33.1 88 TSLD $150,00 and More 15.4 41 Professional (MBA/JD) 13.2 35 GAI Under $12,500 5.3 14 Doctorate 12.0 32 GAI $12,500-24,999 9.0 24 Married 46.6 124 GAI $25,000-39,999 20.7 55 Possess Private SLD 37.2 99 GAI $40,000-54,999 21.8 58 Ever Default 8.6 23 GAI $55,000-74,999 20.3 54 Never Delinquent 67.3 179 GAI $75,000-99,999 10.2 27 IDR Enrollment 51.1 136 GAI $100,00 or More 9.8 26 Save ZERO 39.5 105 Mean Median Retire ZERO 36.5 97 Total Student Loan Debt $87,430 $63,000 Bad Credit (619 or Less) 19.5 52 Federal Monthly Repayment $369.20 $274.50 Urban Cluster 12.0 32 Federal Monthly Principle $156.10 $70.50 Rural 3.8 10 Private Monthly Repayment $466.30 $324.00 Urban Area 83.1 221 Monthly Savings $315.10 $62.50 Homeownership 31.6 84 Monthly Retirement $255.10 $100.00 Previously Denied Mortgage 17.3 46
Regarding repayment, 51% (n=136) enrolled in the following IDR programs: (1) Income-Based
Repayment (n=96), (2) ICR (n=16), (3) PSLF with IDR plan (n=13), and (4) PAYE (n=11). As such, 49% (n=130) of participants were enrolled in Traditional-based repayment under the following terms: (1) Standard 10-year (n=70), (2) Extended 25-year (n=36) and (3) Graduated (n=24). Like aforementioned research (Blagg, 2018), this research collapses repayment into two groups: IDR and Traditional repayment.
FICO scores were collected and collapsed into two groups: (1) Bad Credit, 619 or Lower (n=52, 20%)
and (2) Poor to Excellent 620+. Due to ambiguous categorizations of “Subprime” scores, I decided to
Collier: Exploring IDR: A Comparison of Financial Situations and Behaviors Between Those in Traditional Student Loan Repayment and Those in Income Driven Repayment
Journal of Student Financial Aid Center for Economic Education at the University of Louisville Vol. 49, N2, 2020 7
categorize scores of 619 and below as “Bad” - the lowest credit categorization based on the Federal Reserve Bank of New York (2018) quarterly reports on household debt and credit.
I also used the Zip Code Tabulation Area (ZCTA) relationship database to match collected residency zip-
codes with urbanicity classifications (U.S. Census Bureau, n.d.). ZCTAs are based upon census blocks, using 2010 census data to identify: (1) Urbanized Areas (e.g. Chicago, New York, Denver) - centers with at least 50,000 residents, (2) Urban Clusters (e.g. Abingdon, IL, Columbia Falls, MT, Marathon, FL) – consisting of between 2,500 and 50,000 residents, and (3) rural areas – zones with less than 2,500 residents. Regarding the sample, 83% (n=221) live in an Urbanized Area, 12% (n=32) live in an Urban Cluster, and 3.8% (n=10) live in a Rural Area. Urbanicity is included in this study as individuals’ finances and situations may be different across classifications. For example, in non-urbanized areas, job opportunities and wages have long been declining, driving college educated individuals towards urban areas (Kumar, 2018). Yet, non-urbanized area homeownership rates are considerably higher (Mazur, 2016). Regarding SLD, urban areas host higher balances and median incomes, while non-urbanized areas house higher delinquency rates (Vaghul & Steinbaum, 2015). Overall, living in an urban or rural setting impacts a multitude of financial and social outcomes. Furthermore, to my knowledge, studies incorporating urbanity as a correlate to enrolling in IDR are non-existent.
Analysis To answer Q1 two tests were used. To investigate descriptive differences, not controlling for other factors, between Traditional and IDR groups Chi-Square and Cramer’s V statistics were used for frequency data (Tables 2 and 3) and t-Tests for non-categorical data, with medians also reported (Table 4). As illustrated by Looney & Yannelis (2018) reporting medians are important to include in this type of research. To examine Q2 and Q3, binary logistic regressions were used to explore the likelihood that independent variables will correlate to the examined outcomes (Tables 5 and 6). This study reports outcomes using marginal effects calculated as Marginal Effects at the Means (dy/dx). Marginal effects (ME) are often used in economic studies and have gained application in the social sciences (Williams, 2012). An alternative to reporting odds-ratios, modeling and reporting marginal effects depicts changes of an outcome as a function of the change in treatment (Buis, 2010). Unlike odds ratios, when using Marginal Effects predicted changes to outcomes can produce a negative number, indicating a lowered likelihood of the outcome. The appendix houses confirmatory checks of each regression based upon ORs. Significance for this study is p≤0.05; however, tables denote significance for up to p≤0.10 as such may be important for researchers developing studies to pay closer attention to.
Limitations This study possesses several notable limitations. First, the sample is not nationally representative and may not be strongly generalizable to broader populations of student loan debt holders. The sample was generated from online spaces where individuals promoted a general concern over their debts and the issue of SLD – including income-driven repayment. As compared to individuals not associated with such groups these participants may be more knowledgeable of repayment options available and more financially distressed. In addition to this difference in sample frame, the respondent sample exhibits elevated loads of SLD with a high percentage of the sample previously engaged in graduate school. Although unique based upon average balances, Looney and Yannelis (2018) contend this sample deserves increased attention to better understand current student loan policy and to shape future policy.
The usable sample size of 266 is another limitation of this study. However, as is discussed, many findings in this study align with research using larger sample sizes, using population-representative samples, and with exploratory studies. Although these linkages do not indicate that the respondent sample is representative,

Collier: Exploring IDR: A Comparison of Financial Situations and Behaviors Between Those in Traditional Student Loan Repayment and Those in Income Driven Repayment
8 Journal of Student Financial Aid Center for Economic Education at the University of Louisville Vol. 49, N2, 2020
these connections signal that the sample size is suitable for a descriptive, exploratory study that brings to light previously-unavailable information on an understudied topic. Furthermore, this dataset was collected in 2015 and may not describe current trends. However, given the lack of research on this topic, this exploratory study still gives researchers valuable insight into the lives of borrowers in income-driven repayment and can be used to frame future studies collecting more recent data.
Finally, this study was constrained by two analytical limitations. First, I collapsed ethnic groups into a
person of color categorization labeled “Persons of Color” due to limitations with sample size of individual ethnic groups – the largest sample sizes of ethnic groups are as follows: (1) Hispanic (n=14), (2) African American (n=12), (3) Mixed Race (n=8) and Other (n=8). Second, this study relies on self-reported data, which could be problematic concerning SLD, as many underestimate amounts owed (Andruska, Hogarth, Fletcher, Forbes & Wohlgemuth, 2014). To help stem inaccurate reporting of SLD and earnings, the survey prompted individuals to explore loan statements and prior repayment history and use data from paychecks or from the IRS when reporting financial information. However, this approach is not quite as strong as obtaining 1040s and associated student loan debt records – which, the IRB was reluctant to approve. With limitations notated, the following discussion highlights how study findings support or conflict with previous studies.
Findings & Discussion
Q1: Descriptive Differences between Traditional and IDR Repayment Groups
Finances. Differences emerged in financial situations and behaviors, in every instance favoring individuals in traditional repayment. A higher percentage of those in IDR (54% v. 31%) claimed not to be able to contribute to monthly savings. Additionally, the average and median amount placed into monthly savings was different between Traditional (M=$437, Med=$140) and IDR (M=$197, Med=$0). Next, a higher percentage of those in IDR (50%) claimed to place zero dollars per month into retirement with average monthly contributions (M=$138, Med=$13) also significantly less than the traditional (M=$374, Med=$200). With just 30% of those in traditional repayment citing the inability to place money into retirement savings, the Traditional group mimics previous national findings of college-educated participation in retirement savings (Morrissey, 2016), while the IDR group does not.
Furthermore, a lower portion of participants in IDR (30% v. 43%) were homeowners. Once again, the
traditional repayment group homeownership rate aligns with expected rates, given the average age of the sub-group (36 years old) whereas the IDR group is well below (Chakrabarti et al., 2017). A higher percentage in IDR (41% v. 21%) claimed to have been previously denied a mortgage and almost triple the percentage of those in IDR (32% v. 11%) possessed “bad” credit scores. Potentially reflecting differences in FICO scores, participants in IDR had access to about half the credit (M=$12,182, Med=$10,000) as those in Traditional repayment (M=$22,786, Med=$15,000).
Student loan debt. Although the IDR group’s federal student loan debt (M=$91,667, Med=$74,000) was
over double that of the Traditional group (M=$42,317, Med=$29,500), the average monthly payments on federal loans were statistically equal at $341 (Med=$250) and $399 (Med=$300) respectively. These monthly repayments are near the average repayment ($351) calculated via data from the Federal Reserve Bank of New York and strengthen the case that for the average borrower a crisis regarding only federal repayment may not be emerging (Elvery, 2016). However, for those with combined federal and private loan payments another story emerges, a story that deserves stronger research-based focuses.
Nearly half in IDR (46%) possessed private debt, paying an average of $456 (Med=$300) per month,
totaling a combined average monthly repayment of about $800 for all student loan debt – combined

Collier: Exploring IDR: A Comparison of Financial Situations and Behaviors Between Those in Traditional Student Loan Repayment and Those in Income Driven Repayment
Journal of Student Financial Aid Center for Economic Education at the University of Louisville Vol. 49, N2, 2020 9
monthly repayments for those in traditional repayment is about $880. Only 59% in IDR indicated “never” being delinquent in monthly repayments and 15% indicated that their student loans were in default at the time of participation in the survey. In comparison, of the Traditional group: (1) 29% possessed private debt, (2) 78% were “never” delinquent, and (3) 2% claimed loans were currently in default. The higher percentage of respondents enrolled in IDR reporting delinquency and having loans in default could be the result of mandated enrollment in IDR after experiencing default. Missing an opportunity, the instrument only asked if loans were currently in default, not if the borrower had ever defaulted or if enrollment in IDR was mandated. Not capturing such may confound elements of the guiding framework and should be included in future studies.
Finally, differences were found in the monthly amount placed towards the loan principle between IDR (M=$109, Med=$3.50) and Traditional (M=$208, Med=$126) repayment groups. Paralleling prior national trends (Frotman & Gibbs, 2017), nearly half of the participants in IDR in this sample had non-decreasing balances. Therefore, strengthening the assertation that IDR should be viewed more similarly to taxation and traditional debt, as for many the balances will never be paid down (see Brooks, 2018). Skeptics opposing current IDR schemes may fairly point to the pervasiveness of non-decreasing balances as an example as to why the federal government is disadvantaged by the scheme. Yet, as many in IDR report strong financial struggles - and as will be further discussed (Table 5), IDR enrollees may not necessarily be the “savvy” higher earners and loophole seekers previously suggested (see Delisle, 2013).
Table 2 – Chi Square Tests
Categorical Demographic and Annual Gross Income Traditional IDR Chi Square Test
N % Count N % Count X2 Df V p
Gender Female 130 61.5 80 135 73.3 99 4.20 1 0.13 * Non-White (PoC) 130 14.6 19 136 16.2 22 0.12 1 0.02 No Dependents 130 73.1 95 136 72.8 99 0.00 1 0.03 Married 130 53.8 70 136 40.0 54 5.34 1 0.14 *
Education No Degree 130 2.3 3 136 2.9 4 9.10 5 0.19 Associates/Trade 4.6 6 6.6 9 Bachelors 41.5 54 25.7 35 Masters 27.7 36 38.2 52 Professional (JD/MBA) 10.8 14 15.4 21 Doctorate 13.1 17 11.0 15 Residency Urbanicity Urbanized Area 129 86.0 111 134 82.1 110 4.64 2 0.13 + Urban Cluster 8.5 11 15.7 21 Rural Area 5.4 7 2.0 3
Ann. Gross Income Less than $12,500 127 4.7 6 131 6.1 8 11.76 6 0.21 + $12,500-24,999 9.4 12 9.2 12 $25,000-39,999 16.5 21 26.0 34 $40,000-54,999 19.7 25 25.2 34 $55,000-74,999 21.3 27 20.6 27 $75,000-99,999 13.4 17 7.6 10 $100,000 or More 15.0 19 5.3 7
+ p=≤0.10, *p=≤0.05, ** p=≤0.01, ***p=≤0.001

Collier: Exploring IDR: A Comparison of Financial Situations and Behaviors Between Those in Traditional Student Loan Repayment and Those in Income Driven Repayment
10 Journal of Student Financial Aid Center for Economic Education at the University of Louisville Vol. 49, N2, 2020
Table 4 - Independent t-test
Non-Categorical Demographic, Financial, and Student Loan Debt Variables
Traditional Repayment IDR t-Test Statistics N Mean
(Median) SD N Mean
(Median) SD t df p
Demographics Age 130 34.91
(32.00) 10.36 136 35.49
(33.00) 9.29 -
0.48 264
Monthly Savings 112 $437.28
($140.00) 976.88 125 $196.80
($0.00) 517.13 2.42 244 *
Monthly Retirement 120 $374.19
($200.00) 930.66 122 $137.98
($12.50) 242.13 2.71 240 **
Monthly Bills (Sans SLD) 96 $2,879.06
($2,120.00) 3464.02 95 $2,229.87
($1,943.00) 1444.59 1.69 189 +
Credit Limit 118 $22,785.60
($15,000.00) 24564.87 120 $12,182.60
($10,000.00) 13465.67 4.14 236 ***
Credit Debt 121 $7,514.51
($3,000.00) 28429.59 125 $4,616.02
($2,000.00) 6737.71 1.12 244
Federal Loan Debt 126 $42,316.67
($29,500.00) 45509.36 135 $91,666.56
($74,000.00) 70018.64 -
6.70 259 ***
Fed Loan Monthly Payment
127 $398.65 ($300.00)
357.42 135 $341.48 ($250.00)
504.95 1.05 260
Fed Loan Monthly Applied Principle
110 $208.07 ($125.50)
246.19 122 $109.27 ($3.50)
383.84 2.31 230 *
Private Loan Debt 37 $48,441.89
($37,000.00) 43008.96 60 $47,117.50
($47,120.00) 47117.50 -
0.82 95
Private Loan Monthly Payment
36 $482.72 ($383.50)
353.04 60 $456.40 ($300.00)
600.53 0.24 94
+ p=≤0.10, *p=≤0.05, ** p=≤0.01, ***p=≤0.001
Table 3 – Chi Square Tests
Categorical Explorations of Savings, Homeownership & Credit, and Student Loan Debt
Traditional IDR Chi Square Test N % Count N % Count X2 df V p
Cannot Contribute to Monthly Savings 121 30.6 37 125 54.4 68 14.26 1 0.24 *** Cannot Contribute to Monthly Retirement
120 30.0 36 122 50.0 61 10.08 1 0.20 **
Previously Denied Mortgage 83 20.5 17 71 40.8 29 7.56 1 0.22 ** FICO – “Bad” Credit 118 11.0 13 124 31.5 39 14.97 1 0.25 *** Possess Private Loan SLD 130 28.5 37 136 45.6 62 8.34 1 0.18 ** “Never” Delinquent 129 77.5 100 134 59.0 79 10.42 1 0.19 *** SLD Currently in Default 129 2.3 3 134 14.9 20 13.07 1 0.23 *** Homeowner 113 43.4 49 115 30.4 35 4.09 1 0.13 *
+ p=≤0.10, *p=≤0.05, ** p=≤0.01, ***p=≤0.001

Collier: Exploring IDR: A Comparison of Financial Situations and Behaviors Between Those in Traditional Student Loan Repayment and Those in Income Driven Repayment
Journal of Student Financial Aid Center for Economic Education at the University of Louisville Vol. 49, N2, 2020 11
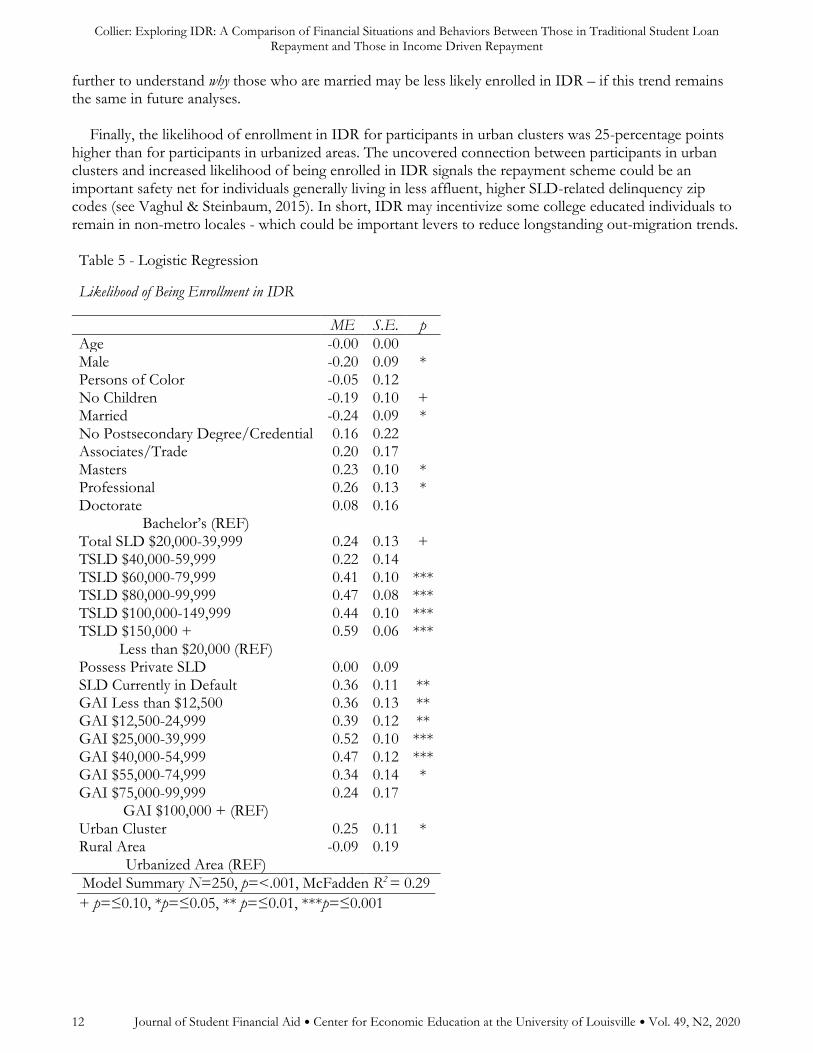
Q2: Factors Correlating to Enrollment in IDR As compared to those with Bachelor’s degrees, participants with Master’s and Professional (MBA/JD) degrees were more likely than Bachelor’s degree holders to be enrolled in IDR, at 23- and 26-percentage points respectively, supporting evidence that those with graduate degrees may be more engaged with IDR programs (e.g. Brooks, 2018; Delisle, 2013). When controlling for the same factors, Professional degrees became non-significant in confirmatory models based upon ORs whereas having a Master’s degree remains a significant predictor in both analyses.
Further shoring recently findings (Frotman & Gibbs, 2017), compared to participants with $20,000 or less in SLD, starting at total SLD $60,000-79,999 (ME=0.41), in a linear-like fashion, as total SLD increased so did likelihood of being enrolled in IDR (ME=0.47-0.59). Next, compared to participants earning GAI $100,000 or more, earning groups lower than GAI $75,000 exhibited a higher likelihood of enrollment in IDR, with participants earning between GAI $25,000-39,999 (ME=0.52) and GAI $40,000-54,999 (ME=0.47) most likely to be enrolled. The remaining earning groups were between 34- to 39-percentage points more likely to be enrolled in IDR, mirroring Blagg’s (2018) finding that lower- to middle-income earners seem to enroll at higher rates. Confirmatory checks illustrate the lowest earning group, GAI $12,500 or less fails the check, an unfortunate finding considering these individuals may most need the protections offered by IDR. Echoing tenants of PIH, the evidence presented supports the conclusion that enrollment into IDR may be strongly connected with current income and perceived capacity to currently (or in the future) repay the debt.
Additionally, as compared to females, males’ probability of enrollment in IDR was 20-percentage points
lower. Prior research highlights that females: (1) are more likely to hold graduate degrees (Perry, 2016), (2) possess higher levels of student loan debt (Becker, 2017), and (3) generally earn less than men (Hegewisch, Phil, & Williams-Baron, 2017). In part, due to these issues, as compared to men, a higher percentage of women are more likely to predict future repayment difficulty during college (Fox, Bartholomae, Letkiewicz, & Montalto, 2017) and report feeling their debt and financial situations are “unmanageable” (Marquit, 2018). In combination, these established economic issues may influence psycho-social beliefs that controlling for SLD and income may not fully capture, potentially affecting female participants to perceive IDR as the best available choice. Here, the results presented supports Miller’s (2017) assertation that IDR may be a critical safety-net for women. However, this finding may also be a product of the sample being more proactive and knowledgeable about repayment options, given the sampling technique. To my knowledge, examinations of IDR enrollment and gender is limited, requiring more attention – especially as changes to IDR are discussed.
I also found married (ME=-0.24) participants correlated to a lower likelihood of enrollment in IDR.
Another concern is that married individuals use tax-based loopholes to enroll in IDR and take advantage of subsidies (Delisle, 2013). My findings suggest married participants were not linked with such behavior. Connecting to RCT and PIH, the combined income of married borrowers possibly allowed married participants to comfortably remain in traditional based repayment. Or because some IDR policies consider joint income in calculating monthly repayment rates, those married may not see much benefit in IDR. In multivariate analysis predicting monthly federal repayment amounts, I found being married increased federal SLD monthly payments by over $200. Beyond the increased monthly repayment, additional factors not explicitly captured here may factor into married participants’ decisions. For example, couples who aim to separately file taxes may generate calculations between IDR benefits and losses in tax-related advantages reserved for couples - or, participants may be unaware of loopholes available. Again, due to the sampling strategy, I find the last theorization highly unlikely. Current and future borrowers need not make these calculations, as REPAYE has eliminated the separate filing option (Shafroth, 2015). However, for previously implemented IDR programs housing these loopholes, this consideration may be important to examine
Collier: Exploring IDR: A Comparison of Financial Situations and Behaviors Between Those in Traditional Student Loan Repayment and Those in Income Driven Repayment
12 Journal of Student Financial Aid Center for Economic Education at the University of Louisville Vol. 49, N2, 2020
further to understand why those who are married may be less likely enrolled in IDR – if this trend remains the same in future analyses.
Finally, the likelihood of enrollment in IDR for participants in urban clusters was 25-percentage points
higher than for participants in urbanized areas. The uncovered connection between participants in urban clusters and increased likelihood of being enrolled in IDR signals the repayment scheme could be an important safety net for individuals generally living in less affluent, higher SLD-related delinquency zip codes (see Vaghul & Steinbaum, 2015). In short, IDR may incentivize some college educated individuals to remain in non-metro locales - which could be important levers to reduce longstanding out-migration trends.
Table 5 - Logistic Regression
Likelihood of Being Enrollment in IDR
ME S.E. p
Age -0.00 0.00 Male -0.20 0.09 * Persons of Color -0.05 0.12 No Children -0.19 0.10 + Married -0.24 0.09 * No Postsecondary Degree/Credential 0.16 0.22 Associates/Trade 0.20 0.17 Masters 0.23 0.10 * Professional 0.26 0.13 * Doctorate 0.08 0.16
Bachelor’s (REF) Total SLD $20,000-39,999 0.24 0.13 + TSLD $40,000-59,999 0.22 0.14 TSLD $60,000-79,999 0.41 0.10 *** TSLD $80,000-99,999 0.47 0.08 *** TSLD $100,000-149,999 0.44 0.10 *** TSLD $150,000 + 0.59 0.06 ***
Less than $20,000 (REF) Possess Private SLD 0.00 0.09 SLD Currently in Default 0.36 0.11 ** GAI Less than $12,500 0.36 0.13 ** GAI $12,500-24,999 0.39 0.12 ** GAI $25,000-39,999 0.52 0.10 *** GAI $40,000-54,999 0.47 0.12 *** GAI $55,000-74,999 0.34 0.14 * GAI $75,000-99,999 0.24 0.17
GAI $100,000 + (REF) Urban Cluster 0.25 0.11 * Rural Area -0.09 0.19
Urbanized Area (REF)
Model Summary N=250, p=<.001, McFadden R2 = 0.29
+ p=≤0.10, *p=≤0.05, ** p=≤0.01, ***p=≤0.001
Collier: Exploring IDR: A Comparison of Financial Situations and Behaviors Between Those in Traditional Student Loan Repayment and Those in Income Driven Repayment
Journal of Student Financial Aid Center for Economic Education at the University of Louisville Vol. 49, N2, 2020 13
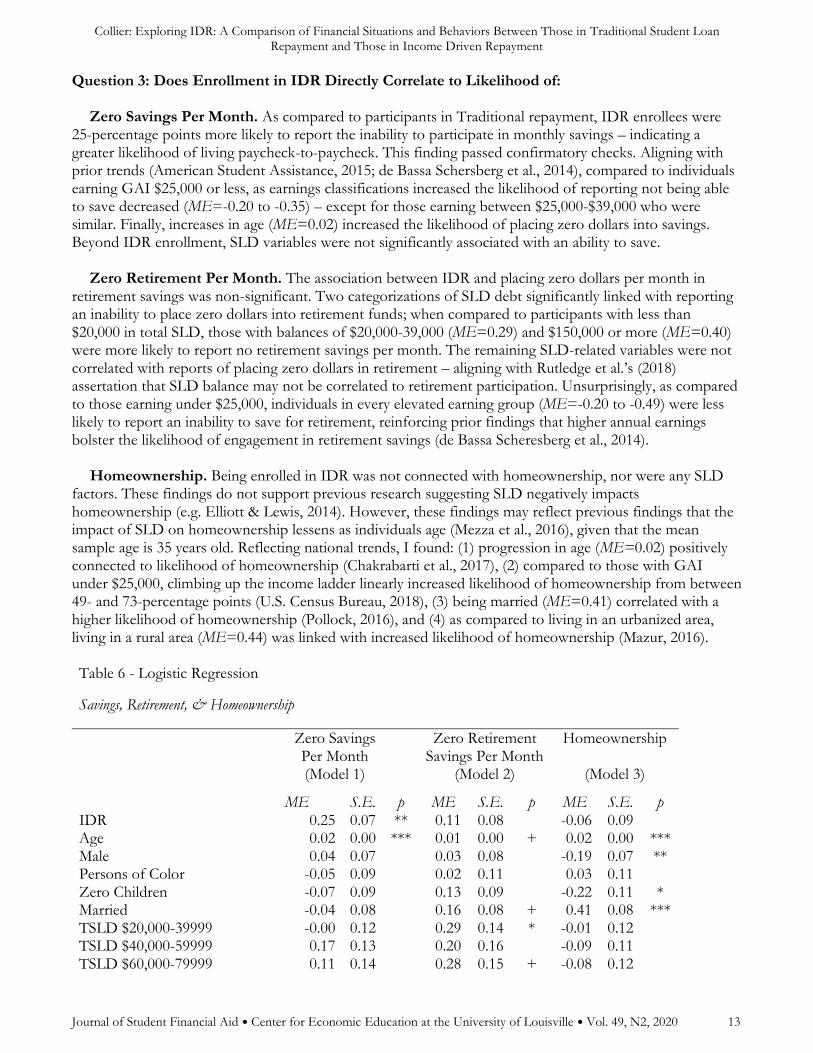
Question 3: Does Enrollment in IDR Directly Correlate to Likelihood of:
Zero Savings Per Month. As compared to participants in Traditional repayment, IDR enrollees were 25-percentage points more likely to report the inability to participate in monthly savings – indicating a greater likelihood of living paycheck-to-paycheck. This finding passed confirmatory checks. Aligning with prior trends (American Student Assistance, 2015; de Bassa Schersberg et al., 2014), compared to individuals earning GAI $25,000 or less, as earnings classifications increased the likelihood of reporting not being able to save decreased (ME=-0.20 to -0.35) – except for those earning between $25,000-$39,000 who were similar. Finally, increases in age (ME=0.02) increased the likelihood of placing zero dollars into savings. Beyond IDR enrollment, SLD variables were not significantly associated with an ability to save.
Zero Retirement Per Month. The association between IDR and placing zero dollars per month in
retirement savings was non-significant. Two categorizations of SLD debt significantly linked with reporting an inability to place zero dollars into retirement funds; when compared to participants with less than $20,000 in total SLD, those with balances of $20,000-39,000 (ME=0.29) and $150,000 or more (ME=0.40) were more likely to report no retirement savings per month. The remaining SLD-related variables were not correlated with reports of placing zero dollars in retirement – aligning with Rutledge et al.’s (2018) assertation that SLD balance may not be correlated to retirement participation. Unsurprisingly, as compared to those earning under $25,000, individuals in every elevated earning group (ME=-0.20 to -0.49) were less likely to report an inability to save for retirement, reinforcing prior findings that higher annual earnings bolster the likelihood of engagement in retirement savings (de Bassa Scheresberg et al., 2014).
Homeownership. Being enrolled in IDR was not connected with homeownership, nor were any SLD
factors. These findings do not support previous research suggesting SLD negatively impacts homeownership (e.g. Elliott & Lewis, 2014). However, these findings may reflect previous findings that the impact of SLD on homeownership lessens as individuals age (Mezza et al., 2016), given that the mean sample age is 35 years old. Reflecting national trends, I found: (1) progression in age (ME=0.02) positively connected to likelihood of homeownership (Chakrabarti et al., 2017), (2) compared to those with GAI under $25,000, climbing up the income ladder linearly increased likelihood of homeownership from between 49- and 73-percentage points (U.S. Census Bureau, 2018), (3) being married (ME=0.41) correlated with a higher likelihood of homeownership (Pollock, 2016), and (4) as compared to living in an urbanized area, living in a rural area (ME=0.44) was linked with increased likelihood of homeownership (Mazur, 2016).
Table 6 - Logistic Regression
Savings, Retirement, & Homeownership
Zero Savings Per Month (Model 1)
Zero Retirement Savings Per Month
(Model 2)
Homeownership
(Model 3)
ME S.E. p ME S.E. p ME S.E. p IDR 0.25 0.07 ** 0.11 0.08 -0.06 0.09 Age 0.02 0.00 *** 0.01 0.00 + 0.02 0.00 *** Male 0.04 0.07 0.03 0.08 -0.19 0.07 ** Persons of Color -0.05 0.09 0.02 0.11 0.03 0.11 Zero Children -0.07 0.09 0.13 0.09 -0.22 0.11 * Married -0.04 0.08 0.16 0.08 + 0.41 0.08 *** TSLD $20,000-39999 -0.00 0.12 0.29 0.14 * -0.01 0.12 TSLD $40,000-59999 0.17 0.13 0.20 0.16 -0.09 0.11 TSLD $60,000-79999 0.11 0.14 0.28 0.15 + -0.08 0.12

Collier: Exploring IDR: A Comparison of Financial Situations and Behaviors Between Those in Traditional Student Loan Repayment and Those in Income Driven Repayment
14 Journal of Student Financial Aid Center for Economic Education at the University of Louisville Vol. 49, N2, 2020
TSLD $80,000-99999 -0.04 0.14 0.18 0.18 -0.09 0.12 TSLD $100,000-150999 0.12 0.13 0.11 0.15 0.06 0.15 TSLD $150,000 + 0.05 0.14 0.40 0.14 ** -0.12 0.12
TSLD < 20K (REF) Possess Private Loans 0.06 0.08 0.08 0.08 -0.02 0.09 GAI $25,000-39999 -0.12 0.11 -0.20 0.10 * 0.08 0.17 GAI $40,000-54999 -0.20 0.10 + -0.41 0.07 *** 0.49 0.16 ** GAI $55,000-74999 -0.29 0.10 ** -0.41 0.07 *** 0.67 0.12 *** GAI $75,000-99999 -0.35 0.08 *** -0.40 0.06 *** 0.73 0.09 *** GAI $100,000+ -0.25 0.09 * -0.49 0.06 *** 0.64 0.14 ***
GAI <$25,000 (REF) Urban Cluster -0.06 0.10 0.10 0.12 0.25 0.16 Rural Area 0.06 0.20 -0.12 0.16 0.44 0.19 *
Urbanized Area (REF) FICO “Bad” Credit -0.03 0.11
Model Summaries
N=240, p=<.001
McFadden R2 = .17
N=236, p=<.001
McFadden R2=.21
N=218, p=<.001
McFadden R2=.44
+ p=≤0.10, *p=≤0.05, ** p=≤0.01, ***p=≤0.001
Future Research
This study is a small step towards understanding the factors that are correlated with enrollment in IDR, how those in IDR and Traditional based repayment may differ, and whether enrollment in IDR correlates to examined financially-related behavior and outcomes. More studies, especially those using nationally represented data, are needed to better understand characteristics of these groups of borrowers and disaggregate the individual Traditional and IDR programs to explore the finite nuances of each scheme. Collapsing all the repayment schemes into just two categories is likely problematic and future studies should aim to be more adaptable in expanding the individual schemes. Next, with research suggesting that people of color are more egregiously harmed by SLD (Scott-Clayton & Li, 2016), forthcoming research should aim to include larger samples of persons of color. Furthermore, additional research should attempt to include participants not associated with SLD-focused groups or forums to understand the factors that influence IDR enrollment among borrowers not receiving information or reinforcement from online groups.
Implications for Practice and Policy
This study’s findings illustrate that enrollment in IDR appears to be linked to student loan debt and income (Table 5). However, recent evidence illustrates that despite IDR being a better situational option, many borrowers remain in traditional repayment simply because it is the default scheme; even when presented with additional information related to earnings and repayment in exit counseling (Cox et al., 2018). Cox and associates’ findings suggest in the time after leaving college that borrowers engage in the exit counseling, borrowers may not have enough information or experience to choose an optimal repayment scheme. Such trends present opportunities for practitioners to develop proactive interventions to help students recognize what may be their most advantageous choice before leaving college.
For example, practitioners could access financial aid records and, as my findings suggest, target graduate students with higher debt-loads who are expected to be moderate to lower earners for one-on-one or group interventions on the protections and drawbacks of choosing IDR. Potentially a more personal experience conveying the realities of debt to income (ability to pay) and what advantages IDR could offer, like generating manageable monthly repayment, may help individuals make better choices directly out of college.
Collier: Exploring IDR: A Comparison of Financial Situations and Behaviors Between Those in Traditional Student Loan Repayment and Those in Income Driven Repayment
Journal of Student Financial Aid Center for Economic Education at the University of Louisville Vol. 49, N2, 2020 15
Additionally, an email or text campaign could help students in obtaining critical information to make a more optimal decision on repayment scheme enrollment. Recent research has illustrated nudges can influence student behaviors connected to financial aid (Castleman, Meyer, Sullivan, Hartog, & Miller, 2017). Theoretically, a well-designed nudging plan may encourage students to seek more information regarding IDR and possibly encourage increased virtual or face-to-face interactions with financial aid practitioners. Furthermore, employing this type of intervention may present an ideal opportunity for practitioners and researchers to collaborate to measure intervention effects.
Beyond debt and income calculations, IDR appears to be an important safety-net for female borrowers.
Therefore, interventions aimed at coaching female borrowers on the features and protections of IDR may ease the reality of repayment difficulties faced by women (see Becker, 2017). Possibly, interventions on student loan repayment may ease female students’ elevated stress correlated with perceptions of difficulties to repay post-college (see Fox, et al., 2017). Likely, lessening these perceptions would ease female college students’ stress and make for an overall better collegiate experience – and could potentially, positively influence college performance and persistence rates.
Next, in accordance to my findings, practitioners could also be influential in helping to revitalize and in
stemming student loan default rates in non-urbanized areas - as IDR appears to be a financial safety-net for borrowers living in these locales. Again, non-urbanized areas are locales where opportunities have long been declining (Kumar, 2018) and student loan default rates tend to be elevated (Vaghul & Steinbaum, 2015). Therefore, I see potential for financial aid practitioners to attend campus-sponsored career fairs and partner with business based in non-metro areas to coach students considering employment outside of metro areas about the financial safety IDR could offer and possible benefits of living in a lower cost-of-living zone – like increased chance of homeownership (Mazur, 2016). To my knowledge, the correlations found between IDR and living in non-metro areas in this study are unique. Consequently, I promote caution in interpreting this finding and call for future, confirmatory testing.
Furthermore, descriptive data show that IDR enrollees face struggles when compared to those in
traditional repayment. While descriptive differences remain, and require further examination, multivariate models controlling for loan debt and income amongst other factors suggest enrollment in IDR is not correlated with participation in retirement savings and homeownership. More consistently earnings were amongst the strongest correlates. However, when controlling for these factors a significant relationship remains between IDR enrollment and the inability to contribute to monthly savings (See Table 6) – indicating IDR enrollees are more likely to live paycheck to paycheck. Of course, it would be easy to suggest to borrowers to simply obtain a higher paying job. However, such a suggestion would likely ignore wider economic and social constraints - including individual borrowers’ current socio-economic situations, desires to engage with certain career pathways, and other personal preferences and emotions as suggested by RCT. While enrollment in IDR may be an optimal choice for many, as suggested by differences in financial variables collected, serious financial struggles likely remain for many enrollees.
With more research along the same vein, we should be capable of developing a stronger understanding of
the financial situations and behaviors of those in IDR. Eventually, stronger findings could help practitioners relay better information to borrowers so that these individuals may incorporate the knowledge when choosing a repayment scheme. Overall, we shockingly know very little about the borrowers who engage IDR. To build stronger repayment schemes and combat future modifications that may unjustly harm borrowers, we must be more intentional in combining research and practitioner efforts. Stronger collaborations between practitioners and researchers could generate more effective outreach and policies to coach borrowers on benefits and drawbacks of existing repayment schemes and bring forth the voices of these borrowers in larger policy conversations.
Collier: Exploring IDR: A Comparison of Financial Situations and Behaviors Between Those in Traditional Student Loan Repayment and Those in Income Driven Repayment
16 Journal of Student Financial Aid Center for Economic Education at the University of Louisville Vol. 49, N2, 2020
Conclusion
A prominent takeaway of this study is that while those in IDR likely have considerably more federal student loan debt, the repayment scheme protects these borrowers by equalizing monthly repayment to levels that those in traditional repayment plans pay. Understandably, some may see the totality of these findings and suggest IDR is a costly and potentially unfair subsidy. Such arguments anchor Senators Mike Enzi’s and Lamar Alexander’s prior request for the CBO to tabulate data on IDR stating, “We are troubled by the financial state of IDR plans… we are concerned whether these policies are sustainable” (2018, p.1) and the Trump proposal (Delisle & Holt, 2017). However, those concerns may be missing the counternarrative this study presents.
First, although individuals in IDR are more likely to have Masters’ or Professional degrees, this research supports recent studies finding that IDR may consist of more moderate- and low-earners who need the security IDR provides. My findings begin to debase suppositions that highly paid individuals are generally being subsidized via widespread inclusion. Relatedly, although IDR may be a “better” choice that provides some financial protections, many enrollees still report deep financial struggles. Universal modifications to IDR should consider how changes could affect an “average” enrollee and not be overly concerned with “savvy” outliers - who have long been conjured to dismantle various social supports for those in need. If a policy like the Trump proposal is accepted, the federal government is expected to benefit - as IDR enrollees would pay a higher monthly repayment and, for graduate degree holders, over a longer duration. While long-term subsidies remain in place for many borrowers who may achieve forgiveness via IDR, individuals’ everyday financial situations may become more distressed than reported here.
As studies examining the borrowers enrolled in IDR remain extraordinarily limited, I do not believe
policymakers have enough information to generate decisions that strike appropriate balances between costs to government and the recognition of how changes could impact enrollees’ situations and behaviors – and who would be most affected by changes. Although a complete picture may never be obtained, the debate over IDR schemes must include more studies with more finite details of borrowers when examining the total value of IDR, as a deeper conversation exists with more at stake than existing knowledge may allow. Therefore, if anything this study highlights the absolute need for more research on the experiences of borrowers enrolled in IDR.

Collier: Exploring IDR: A Comparison of Financial Situations and Behaviors Between Those in Traditional Student Loan Repayment and Those in Income Driven Repayment
Journal of Student Financial Aid Center for Economic Education at the University of Louisville Vol. 49, N2, 2020 17
Nexus: Connecting Research to Practice
• Practitioners could access students’ records and invite graduate students who have assumed large debt loads to coaching workshops on IDR, while enrolled in college. Furthermore, practitioners could develop text/email-based nudges to convey information and encourage engagement with financial aid.
• IDR may be a crucial safety-net for female students and borrowers. Stronger outreach to female students and alumni could help ease distress related to perceptions of repayment while enrolled in college and the realities after leaving.
• IDR may also be an important safety-net for borrowers not residing in cities or associated suburbs. These areas have experienced a high-degree of out-migration, and residents possess lower relative incomes and high student loan default rates. Therefore, practitioners could coach borrowers interested in assuming jobs in non-metro areas of the safety that IDR may provide to ease borrowers’ financial situations and possible benefits of living in non-metro areas – like increased chance of homeownership, which could aid in revitalizing communities outside of urbanized areas.
• We still know very little about borrowers in IDR; therefore, practitioners and researchers must come together in collaboration to capture more, stronger data and share findings to inform practice and give voice to borrowers in conversations on IDR policy.
Collier: Exploring IDR: A Comparison of Financial Situations and Behaviors Between Those in Traditional Student Loan Repayment and Those in Income Driven Repayment
18 Journal of Student Financial Aid Center for Economic Education at the University of Louisville Vol. 49, N2, 2020
References American Student Assistance. (2015). Life delayed: The impact of student debt on the daily lives of Americans.
Retrieved from https://www.asa.org/wp-content/uploads/2017/06/life_delayed_whitepaper_2015.pdf
Andruska, E., Hogarth, J., Fletcher, C., Forbes, G., & Wohlgemuth, D. (2014). Do you know what you owe?
Students’ understanding of their student loans. Journal of Student Financial Aid, 44(2). Becker, A. (2017). Women hold majority of college degrees and debt – and take longer to pay it off. The American
Association of University Women. Retrieved from https://www.aauw.org/research/deeper-in-debt/
Becker, G. (1962). Investment in human capital: A theoretical analysis. Journal of Political Economy, 70(5,
Part2), 9-49. Best, J., & Best, E. (2014). The student loan mess: How good intentions created a trillion-dollar problem. Berkley, CA:
University of California Press. Blagg, K. (2018). Who uses income-drive student loan repayment? Urban Institute. Retrieved from
https://www.urban.org/urban-wire/who-uses-income-driven-student-loan-repayment Brooks, J.R. (2018). The case for more debt: Expanding college affordability by expanding income-driven
repayment. Utah Law Review (Forthcoming). Retrieved from https://papers.ssrn.com/sol3/Delivery.cfm/SSRN_ID3171724_code238438.pdf?abstractid=3171724&mirid=1
Buis, M.L. (2010). Stata tip 87: Interpretation of interactions in nonlinear models. The Stata Journal, 10(2),
305-308. doi.org/10.1177/1536867x1001000211 Carlsson, R.J. (1970). A federal program of student loans. The American Journal of Economics, 29(3), 263-276.
doi:10.1111/j.1536-7150.1970.tb03312.x Castleman, B.L., Meyer, K.E., Sullivan, Z., Hartog, W.D., & Miller, S. (2017). Nudging students beyond the
FAFSA: The impact of university outreach on financial aid behaviors and outcomes. Journal of Student Financial Aid, 47(3), 4-27. https://publications.nasfaa.org/cgi/viewcontent.cgi?article=1637&context=jsfa
Chakrabarti, R., Haughwout, A., Lee, D., Scally, J., & van der Klaauw, W. (2017). Press briefing on household
debt, with focus on student loan debt. Federal Reserve Bank of New York. Retrieved from https://www.newyorkfed.org/medialibrary/media/press/PressBriefing-Household-Student-Debt-April32017.pdf
Cheng, D., & Thompson, J. (2017). Make it simple, keep it fair: A proposal to streamline and improve income-drive
repayment of federal student loans. The Institute for College Access & Success. Retrieved from https://ticas.org/sites/default/files/pub_files/make_it_simple_keep_it_fair.pdf
Cochrane, D., & Cheng, D. (2016). Student debt and the class of 2015: 11th Annual Report. The Institute for
College Access & Success. Retrieved from https://ticas.org/sites/default/files/pub_files/classof2015.pdf

Collier: Exploring IDR: A Comparison of Financial Situations and Behaviors Between Those in Traditional Student Loan Repayment and Those in Income Driven Repayment
Journal of Student Financial Aid Center for Economic Education at the University of Louisville Vol. 49, N2, 2020 19
Cox, J.C., Kreisman, D., & Dynarski, S. (2018). Designed to fail: Effects of the default option and information complexity on student loan repayment (No. 25258). National Bureau of Economic Research. Retrieved from https://www.nber.org/papers/w25258
Cunningham, A.F., & Kienzl, G.S. (2011). Delinquency: The untold story of student loan borrowing (ED517424).
Institute for Higher Education Policy. de Bassa Scheresberg, C., Lusardi, A., & Yakoboski, P. (2014). College-educated millennials: An overview off their
personal finances. TIAA-CREF Institute. Retrieved from https://www.tiaacrefinstitute.org/public/pdf/gflec_overview_millennials_personal_finances_feb2014.pdf
Delaney, J.A., & Doyle, W.R. (2011). State spending on higher education: Testing the balance wheel over
time. Journal of Education Finance, 36(4), 343-368. Delisle, J. (2013). Beware savvy borrowers using income-based repayment. New America.
https://www.newamerica.org/education-policy/edcentral/beware-savvy-borrowers-using-income-based-repayment/
Delisle, J., & Holt, A. (2017). Winners and losers in President Trump’s student loan plan. Center on Children and
Families at Brookings. Retrieved from https://www.brookings.edu/wp-content/uploads/2017/08/ccf_20170803_delisleloanwinnerslosers.pdf
Delisle, J., Phillips, O., van der Linde, R. (2014). The graduate student debt review: The state of graduate student
borrowing. New America Education Policy Program. Retrieved from https://s3.amazonaws.com/s3.documentcloud.org/documents/1096326/gradstudentdebtreview.pdf
DesJardins, S. L., & Toutkoushian, R. K. (2005). Are students really rational? The development of rational
thought and its application to student choice. In Higher education: Handbook of theory and research (pp. 191-240). Springer, Dordrecht.
Dynarski, S., & Scott-Clayton, J. (2013). Financial aid policy: Lessons from research. The Future of Children,
23(1), 67-91. doi:10.1353/foc.2013.0002 Elliott, W., Grinstein-Weiss, M., & Nam, I. (2013). Student debt and declining retirement savings. Washington
University in St. Louis. Retrieved from https://csd.wustl.edu/publications/documents/wp13-34.pdf Elliott, W., & Lewis, M. (2014). The student loan problem in America: It is not enough to say, “students will eventually
recover.” Lawrence, KS: Assets and Education Initiative (AEDI). Retrieved from https://aedi.ku.edu/sites/aedi.ku.edu/files/docs/publication/CD/reports/R2.pdf
Elvery, J. (2016). Is there a student loan crisis? Not in payments. Forefront: New Ideas on Economic Policy from the
Federal Reserve Bank of Cleveland. Retrieved from https://clevelandfed.org/newsroom-and-events/publications/forefront/ff-v7n02/ff-20160516-v7n0204-is-there-a-student-loan-crisis.asp
Enzi, M.B., & Alexander, L. (2018, July 11). CBO letter IDR and forgiveness.
https://www.budget.senate.gov/imo/media/doc/CBO%20letter%20IDR%20and%20Forgiveness.pdf

Collier: Exploring IDR: A Comparison of Financial Situations and Behaviors Between Those in Traditional Student Loan Repayment and Those in Income Driven Repayment
20 Journal of Student Financial Aid Center for Economic Education at the University of Louisville Vol. 49, N2, 2020
Federal Reserve Bank of New York (2018). Quarterly report on household debt and credit. Retrieved from https://www.newyorkfed.org/medialibrary/interactives/householdcredit/data/pdf/HHDC_2018Q1.pdf
Federal Student Aid. (n.d.). Income-driven plans. Retrieved from https://studentaid.ed.gov/sa/repay-
loans/understand/plans/income-driven Fox, J.J., Bartholomae, S., Letkiewicz, J.C., & Montalto, C.P. (2017). College student debt and anticipated
repayment difficulty. Journal of Student Financial Aid, 47(2), 111-135. Friedman, M. (1955). The role of government in public education. In Robert A. Solo (Ed.) Economics and the
Public Interest. New Brunswick, NJ: Rutgers University Press. Friedman, M. (1957). The permanent income hypothesis. In A theory of the consumption function (pp. 20-37).
Princeton University Press. Frotman, S., & Gibbs, C. (2017). Too many student loan borrowers struggling, not enough benefiting from affordable
repayment options. Consumer Financial Protection Bureau. Retrieved from https://www.consumerfinance.gov/about-us/blog/too-many-student-loan-borrowers-struggling-not-enough-benefiting-affordable-repayment-options/
Grinstein-Weiss, M., Oliphant, J., Russell, B.D., & Boshara, R. (2015). Does unsecured debt decrease savings?
Evidence from the refund to saving initiative. Washington University in St. Louis. Retrieved from https://csd.wustl.edu/Publications/Documents/RB15-16.pdf
Hall, R. (1978). Stochastic implications of the life cycle-permanent income hypothesis: Theory and evidence.
Journal of Political Economy, 86(6), 971-987. doi.org/10.1086/260724 Hegewisch, A., Phil, M., & Williams-Baron, E. (2018). The gender wage gap: 2017 earnings differences by race and
ethnicity. Institute for Women’s Policy Research. Retrieved from https://iwpr.org/publications/gender-wage-gap-2017-race-ethnicity/
Hillman, N. (2013). Reforming repayment: Using income-related loans to reduce default. American Enterprise Institute
for Public Policy Research. Retrieved from http://www.aei.org/files/2013/06/21/-kelly-hillmannick-conference_085349110877.pdf
Hillman, N.W. (2015). Borrowing and repaying federal student loans. Journal of Student Financial Aid, 45(3),
35-48. Houle, J.N., & Berger, L. (2015). Is student loan debt discouraging homeownership among young adults?
Social Service Review, 89(4), 589-621. doi:10.1086/684587 Kumar, D. (2018). Rural America is losing young people: Consequences and solutions. University of Pennsylvania.
Retrieved from https://publicpolicy.wharton.upenn.edu/live/news/2393-rural-america-is-losing-young-people-
Looney, A., & Yannelis, C. (2018). Borrowers with large balances: Rising student debt and failing repayment rates.
Brookings Institute. Retrieved from https://www.brookings.edu/wp-content/uploads/2018/02/es_20180216_looneylargebalances.pdf
Collier: Exploring IDR: A Comparison of Financial Situations and Behaviors Between Those in Traditional Student Loan Repayment and Those in Income Driven Repayment
Journal of Student Financial Aid Center for Economic Education at the University of Louisville Vol. 49, N2, 2020 21
Marquit, M. (2018). Survey: Women feel saddled with ‘unmanageable’ student loan debt and fears of losing household income. Student Loan Hero. Retrieved from https://studentloanhero.com/featured/survey-women-feel-saddled-unmanageable-student-loan-debt-fears-losing-household-income/
Mazur, C. (2016). Homes on the range: Homeownership rates are higher in rural America. Census Blogs, U.S.
Census Bureau. Retrieved from https://www.census.gov/newsroom/blogs/random-samplings/2016/12/homes_on_the_range.html
Mezza, A.A., Ringo, D.R., Sherlund, S.M., & Sommer, K. (2016). On the effect of student loans on access to
homeownership. Board of Governors of the Federal Reserve System. Retrieved from https://www.federalreserve.gov/econresdata/feds/2016/files/2016010pap.pdf
Miller, K. (2017). Student debt through the gender lens. Outlook (Summer). Retrieved from
https://www.aauw.org/2017/09/01/student-debt-through-the-gender-lens/ Morrissey, M. (2016). The state of American retirement: How 401(k)s have failed most American workers. Economic
Policy Institute. Retrieved from https://www.epi.org/publication/retirement-in-america/ Perna, L. W. (2006). Studying college access and choice: A proposed conceptual model. In Higher Education:
Handbook of Theory and Research (pp. 99-157). Springer, Dordrecht. Perry, M.J. (2016). Women earned majority of doctoral degrees in 2015 for 7th straight year and outnumber men in grad
school 135 to 100. American Enterprise Institute. Retrieved from http://www.aei.org/publication/women-earned-majority-of-doctoral-degrees-in-2015-for-7th-straight-year-and-outnumber-men-in-grad-school-134-to-100/?utm_source=feedburner&utm_medium=email&utm_campaign=Feed%3A+aei-ideas%2Fcarpe-diem+%28AEIdeas+%C2%BB+Carpe+Diem%29
Pollock, A.J. (2016). Home ownership rates: It depends on whether you are married. Housing Finance
International, 13-14. Popa, F. (2015). Motivations to contribute to public goods: Beyond rational choice economics. Environmental
Policy and Governance, 25(4), 230-242. doi:10.1002/eet.1684 Popper, K.R. (1994). The myth of the framework: In defense of science and rationality. M.A. Nutturno (Ed.). New
York, NY: Routledge. Scott-Clayton, J. & Li, J. (2016). Black-white disparity in student loan debt more than triples after
graduation. Brookings. Retrieved from https://www.brookings.edu/research/black-white-disparity-in-student-loan-debt-more-than-triples-after-graduation/
Shafroth, A. (2015). The revised pay as you earn (REPAYE) plan is now available. Student Loan Borrower
Assistance. Retrieved from http://www.studentloanborrowerassistance.org/the-revised-pay-as-you-earn-repaye-plan-is-now-available/
Shepsle, K.A., and Bonchek, M.S. (1997). Analyzing Politics: Rationality, Behaviors, and Institutions. New York:
W.W. Norton & Company.

Collier: Exploring IDR: A Comparison of Financial Situations and Behaviors Between Those in Traditional Student Loan Repayment and Those in Income Driven Repayment
22 Journal of Student Financial Aid Center for Economic Education at the University of Louisville Vol. 49, N2, 2020
Shireman, R. (2017). Learn now, pay later: A history of income-contingent student loans in the United States. The Annals of the American Academy, 671, 184-201. doi:10.1177/0002716217701673
Stiglitz, J.E. (2012). The price of inequality: How today’s divided society endangers our future. New York, NY: W.W.
Norton & Company. U.S. Census Bureau. (2018). Quarterly residential vacancies and homeownership, first quarter 2018. Retrieved from
https://www.census.gov/housing/hvs/files/currenthvspress.pdf U.S. Census Bureau. (n.d.). 2010 census urban and rural classification and urban area criteria. Retrieved from
https://www.census.gov/geo/reference/ua/urban-rural-2010.html U.S. Department of Education. (2015). Income-driven repayment plan enrollment jumps, delinquency rates drop in new
student loan data. Retrieved from https://www.ed.gov/news/press-releases/income-driven-repayment-plan-enrollment-jumps-delinquency-rates-drop-new-student-loan-data
U.S. Department of Education. (2018a). How to repay your loans: Getting out of default. Retrieved from
https://studentaid.ed.gov/sa/repay-loans/default/get-out#loan-rehab U.S. Department of Education. (2018b). Repayment plans: Income-driven plans. Retrieved from
https://studentaid.ed.gov/sa/repay-loans/understand/plans/income-driven U.S. Government Accountability Office. (2016). Federal student loans: Education needs to improve its income driven
repayment plan budget estimates (GAO-17-22). Retrieved from https://www.gao.gov/assets/690/681064.pdf
Vaghul, K., & Steinbaum, M. (2015). An introduction to the geography of student debt. Washington Center for
Equitable Growth. Retrieved from https://equitablegrowth.org/an-introduction-to-the-geography-of-student-debt/
Williams, R. (2012). Using margins command to estimate and interpret adjusted predictions and marginal
effects. The Stata Journal, 12(2), 308-331. doi:10.1177/1536867x1201200209 Yannelis, C. (2015). Asymmetric information in student loans. New York University.
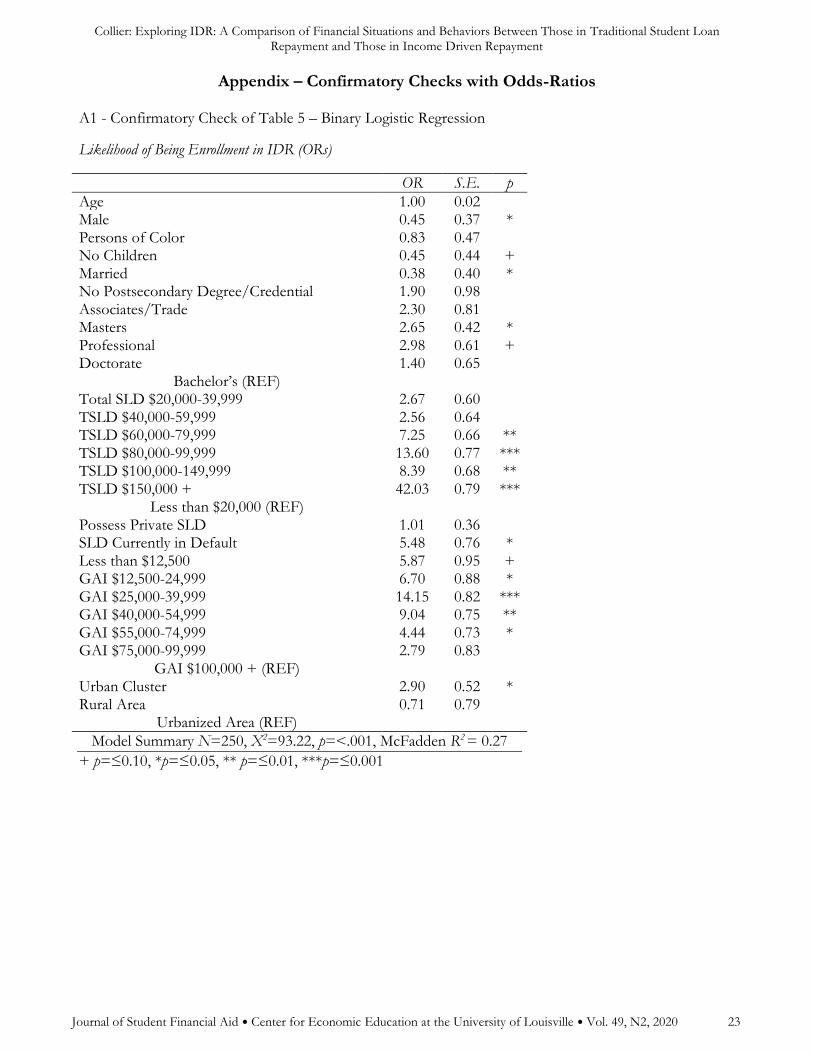
Collier: Exploring IDR: A Comparison of Financial Situations and Behaviors Between Those in Traditional Student Loan Repayment and Those in Income Driven Repayment
Journal of Student Financial Aid Center for Economic Education at the University of Louisville Vol. 49, N2, 2020 23
Appendix – Confirmatory Checks with Odds-Ratios
A1 - Confirmatory Check of Table 5 – Binary Logistic Regression
Likelihood of Being Enrollment in IDR (ORs)
OR S.E. p
Age 1.00 0.02 Male 0.45 0.37 * Persons of Color 0.83 0.47 No Children 0.45 0.44 + Married 0.38 0.40 * No Postsecondary Degree/Credential 1.90 0.98 Associates/Trade 2.30 0.81 Masters 2.65 0.42 * Professional 2.98 0.61 + Doctorate 1.40 0.65
Bachelor’s (REF) Total SLD $20,000-39,999 2.67 0.60 TSLD $40,000-59,999 2.56 0.64 TSLD $60,000-79,999 7.25 0.66 ** TSLD $80,000-99,999 13.60 0.77 *** TSLD $100,000-149,999 8.39 0.68 ** TSLD $150,000 + 42.03 0.79 ***
Less than $20,000 (REF) Possess Private SLD 1.01 0.36 SLD Currently in Default 5.48 0.76 * Less than $12,500 5.87 0.95 + GAI $12,500-24,999 6.70 0.88 * GAI $25,000-39,999 14.15 0.82 *** GAI $40,000-54,999 9.04 0.75 ** GAI $55,000-74,999 4.44 0.73 * GAI $75,000-99,999 2.79 0.83
GAI $100,000 + (REF) Urban Cluster 2.90 0.52 * Rural Area 0.71 0.79
Urbanized Area (REF)
Model Summary N=250, X2=93.22, p=<.001, McFadden R2 = 0.27
+ p=≤0.10, *p=≤0.05, ** p=≤0.01, ***p=≤0.001
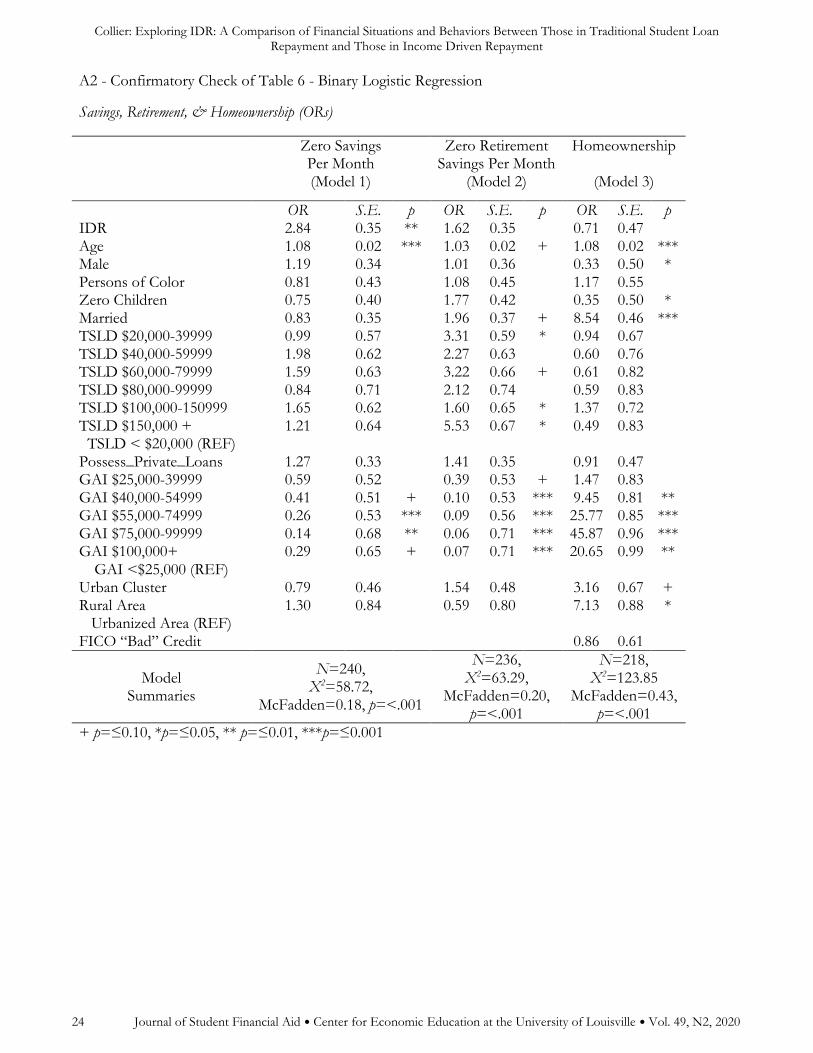
Collier: Exploring IDR: A Comparison of Financial Situations and Behaviors Between Those in Traditional Student Loan Repayment and Those in Income Driven Repayment
24 Journal of Student Financial Aid Center for Economic Education at the University of Louisville Vol. 49, N2, 2020
A2 - Confirmatory Check of Table 6 - Binary Logistic Regression
Savings, Retirement, & Homeownership (ORs)
Zero Savings Per Month (Model 1)
Zero Retirement Savings Per Month
(Model 2)
Homeownership
(Model 3)
OR S.E. p OR S.E. p OR S.E. p IDR 2.84 0.35 ** 1.62 0.35 0.71 0.47 Age 1.08 0.02 *** 1.03 0.02 + 1.08 0.02 *** Male 1.19 0.34 1.01 0.36 0.33 0.50 * Persons of Color 0.81 0.43 1.08 0.45 1.17 0.55 Zero Children 0.75 0.40 1.77 0.42 0.35 0.50 * Married 0.83 0.35 1.96 0.37 + 8.54 0.46 *** TSLD $20,000-39999 0.99 0.57 3.31 0.59 * 0.94 0.67 TSLD $40,000-59999 1.98 0.62 2.27 0.63 0.60 0.76 TSLD $60,000-79999 1.59 0.63 3.22 0.66 + 0.61 0.82 TSLD $80,000-99999 0.84 0.71 2.12 0.74 0.59 0.83 TSLD $100,000-150999 1.65 0.62 1.60 0.65 * 1.37 0.72 TSLD $150,000 + 1.21 0.64 5.53 0.67 * 0.49 0.83
TSLD < $20,000 (REF) Possess_Private_Loans 1.27 0.33 1.41 0.35 0.91 0.47 GAI $25,000-39999 0.59 0.52 0.39 0.53 + 1.47 0.83 GAI $40,000-54999 0.41 0.51 + 0.10 0.53 *** 9.45 0.81 ** GAI $55,000-74999 0.26 0.53 *** 0.09 0.56 *** 25.77 0.85 *** GAI $75,000-99999 0.14 0.68 ** 0.06 0.71 *** 45.87 0.96 *** GAI $100,000+ 0.29 0.65 + 0.07 0.71 *** 20.65 0.99 **
GAI <$25,000 (REF) Urban Cluster 0.79 0.46 1.54 0.48 3.16 0.67 + Rural Area 1.30 0.84 0.59 0.80 7.13 0.88 *
Urbanized Area (REF) FICO “Bad” Credit 0.86 0.61
Model Summaries
N=240, X2=58.72,
McFadden=0.18, p=<.001
N=236, X2=63.29,
McFadden=0.20, p=<.001
N=218, X2=123.85
McFadden=0.43, p=<.001
+ p=≤0.10, *p=≤0.05, ** p=≤0.01, ***p=≤0.001