Embed Size (px)
Citation preview

Exploring Health System and Country Performance on
Improving Health Conditions Around the Globe
Dean T. JamisonUniversity of California, Los Angeles
andFogarty International Center
U.S. National Institutes of Health
1

Overview
1. Institutional Performance (brief)
2. Existing Studies at the Country Level “Good Health at Low Cost” China health finance study
3. Example: Country Performance in Reducing IMR
4. Example: Efficiency of Resource Use in the OECD2
Explaining Performance Variation1. Resource Availability
($$, # of providers, education, experience of provider…)
2. Productivity in Use of Health Resources(greater health impact per unit of resource)
3. Contextual Factors(environmental factors, health status of population, SES of population)
***7
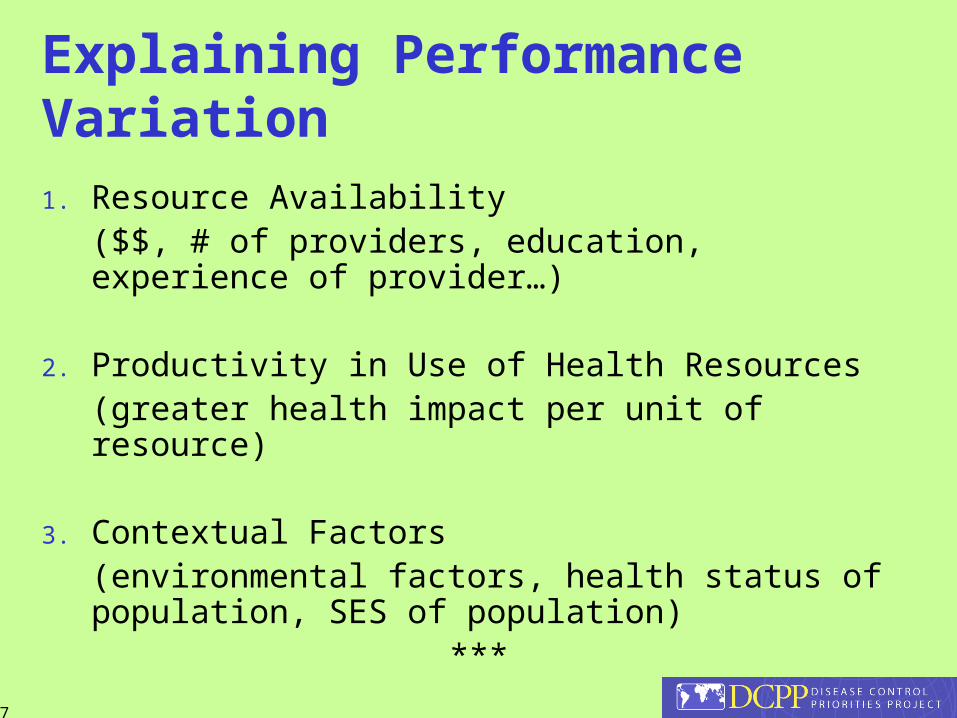
Measuring Performance at Different Levels
Institutional PerformanceHealth outcomes controlling for contextual factors
Institutional ProductivityHealth outcome responsiveness to resource availability controlling for contextual factors
Country PerformanceHealth outcomes controlling for contextual factors
‘Health System Productivity’Health outcome responsiveness to resource availability controlling for contextual factors
6

REPORT OF THE CALIFORNIA HOSPITALS OUTCOMES PROJECT
Volume One:Study Overview and Results Summary
May 1996
Pete Wilson, GovernorState of California
Sandra R. Smoley, R.N., SecretaryHealth and Welfare Agency
David Werdegar, MD, MPH, DirectorOffice of Statewide Health Planning and
Development
Prof. Hal Luft, Principal Investigator3

Institutional Performance: AMI of California Hospitals
4
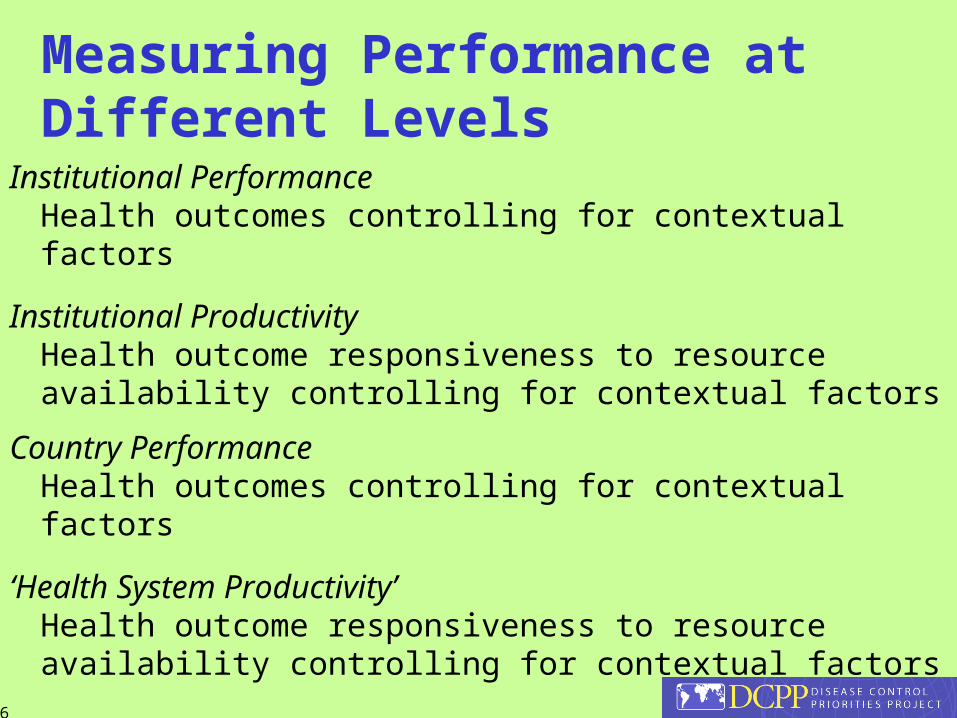
New York State Bypass Surgeons, 1991-93
SurgeonObserved
Mortality Rate (%)
Risk-adjusted Mortality Rate (%)
Borja, A.Ferraris, V.Statewide averageBennett, E.
3.773.23
2.851.45
4.212.66
2.851.61
Source: Marshall & Spiegelhalter (2001)
5

Infant mortality rate related to income
Source: World Health Report 1999 (WHO)
8
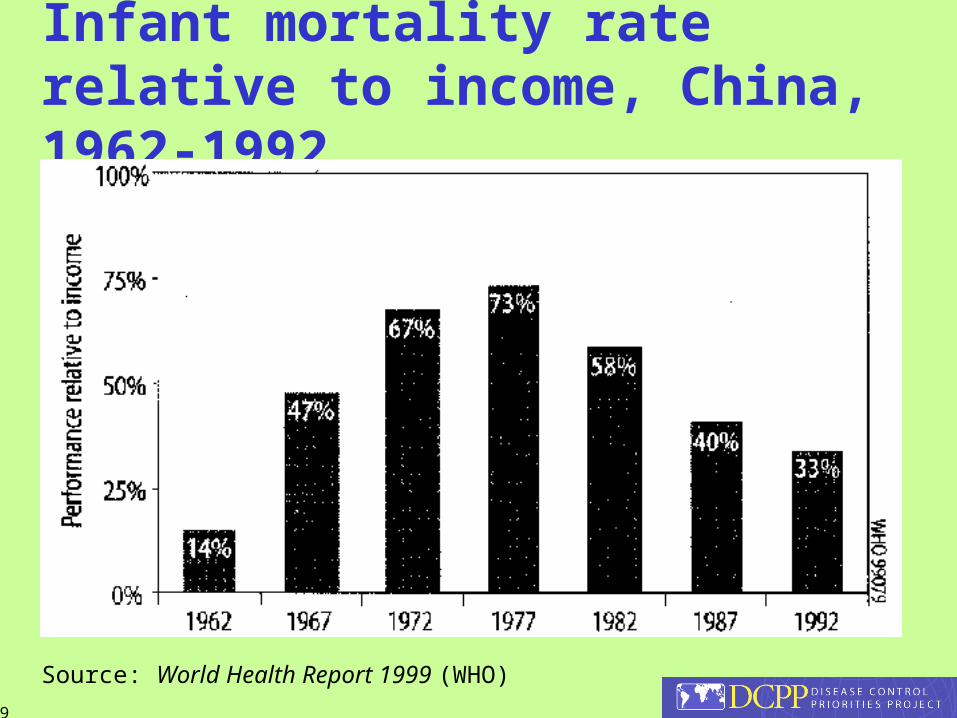
Infant mortality rate relative to income, China, 1962-1992
Source: World Health Report 1999 (WHO)
9

10

11

Disease Control Priorities Project
Working Paper No. 14October 22, 2003
Why Has Infant Mortality Decreased at Such Different Rates in Different Countries?Dean T. JamisonUniversity of California, Los AngelesU.S. National Institutes of Health
Martin E. SandbuColumbia University
Jia WangUniversity of California, Los Angeles
12

The Simplest ModelsCommon intercept across countries
1. yit = ao + a1xit + a2t + error term
Country-specific intercept (or fixed effect)
2. yit = aoi + a1xit + a2t + error term
Country-specific intercept and slope
3. yit = aoi + a1xit + a2it
13

What Happens When You Take First Differences?Equation 1 or 2 gives:
4. yit+1 – yit = a1(xit+1 – xit) + a2[(t + 1) - t)]
The constant term now effects the growth rate in mortality not the level.
Equation 3 gives:
5. yit+1 – yit = a1xi + a2i
The constant term is now a country-specific growth rate.14
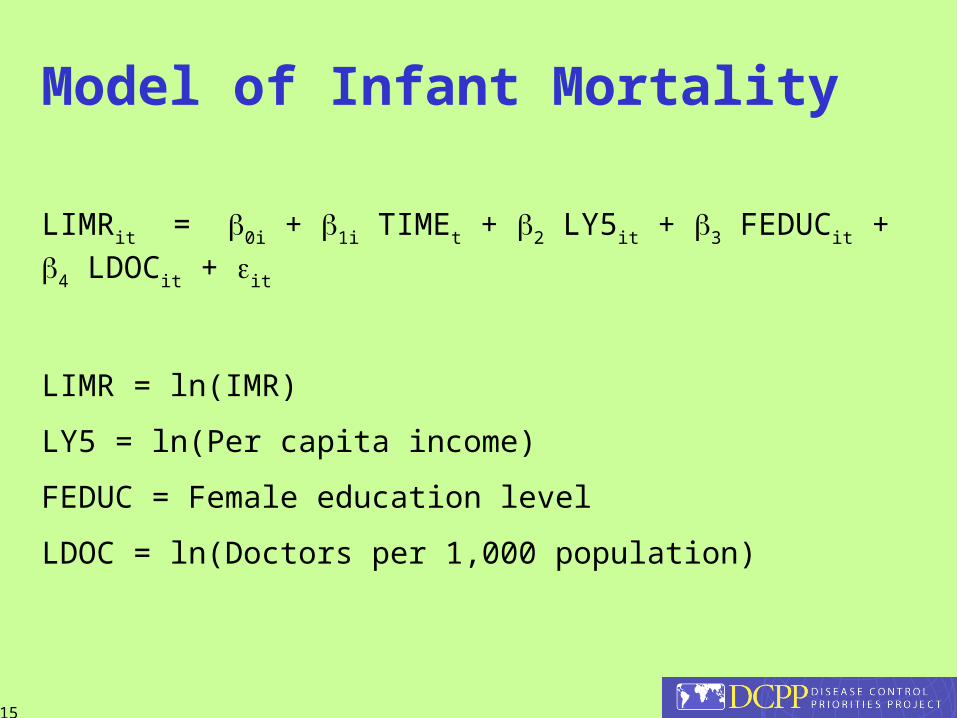
Model of Infant Mortality
LIMRit = 0i + 1i TIMEt + 2 LY5it + 3 FEDUCit + 4 LDOCit + it
LIMR = ln(IMR)
LY5 = ln(Per capita income)
FEDUC = Female education level
LDOC = ln(Doctors per 1,000 population)
15

Assessing technical progress
0i = 00 + 01 TROPICSi + 02 COASTALi + 0i
1i = 10 + 11 TROPICSi + 12 COASTALi + 1i
16

Definition of terms
0i: Country- specific, unobserved effects on level of IMR
1i: Country-specific, unobserved effects on rate of
technical progress in reducing IMR
Total country-specific effect, 1962- 87 ( IMR as % of predicted), for country i:
100 x exp (0i + 25 1i)
17
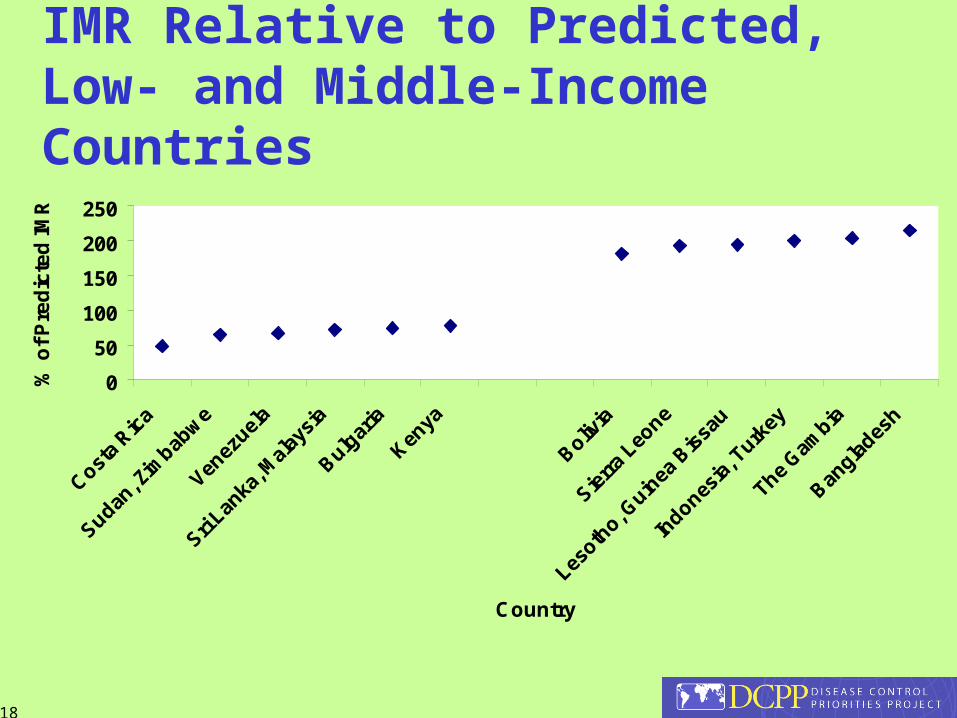
IMR Relative to Predicted, Low- and Middle-Income Countries
0
50
100
150
200
250
Costa
Rica
Sudan, Z
imbab
we
Venez
uela
Sri Lan
ka, M
alay
sia
Bulgar
ia
Kenya
Bolivia
Sierra
Leo
ne
Lesoth
o, Guin
ea B
issa
u
Indones
ia, T
urkey
The Gam
bia
Bangla
desh
Country
% o
f P
red
icte
d IM
R
18
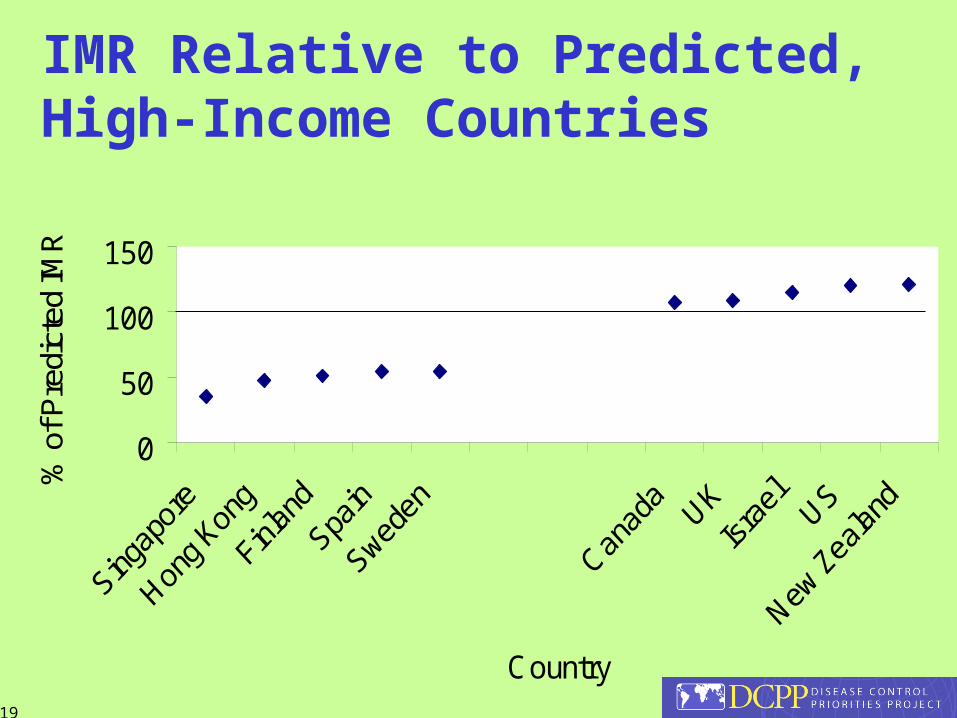
IMR Relative to Predicted, High-Income Countries
0
50
100
150
Country
% o
f Pre
dict
ed IM
R
19

20

21
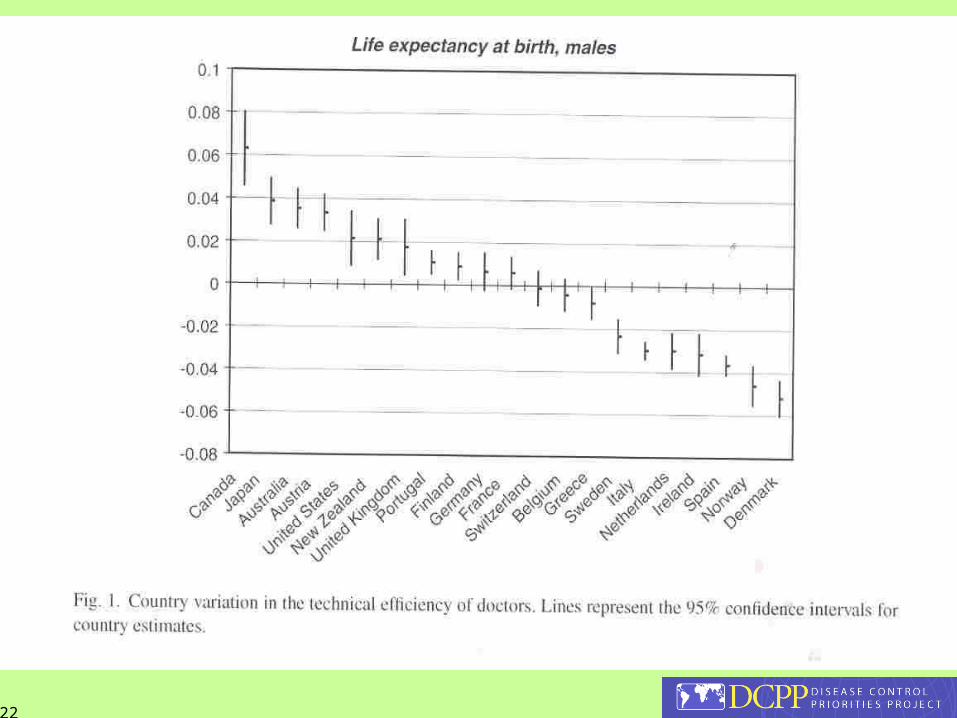
22
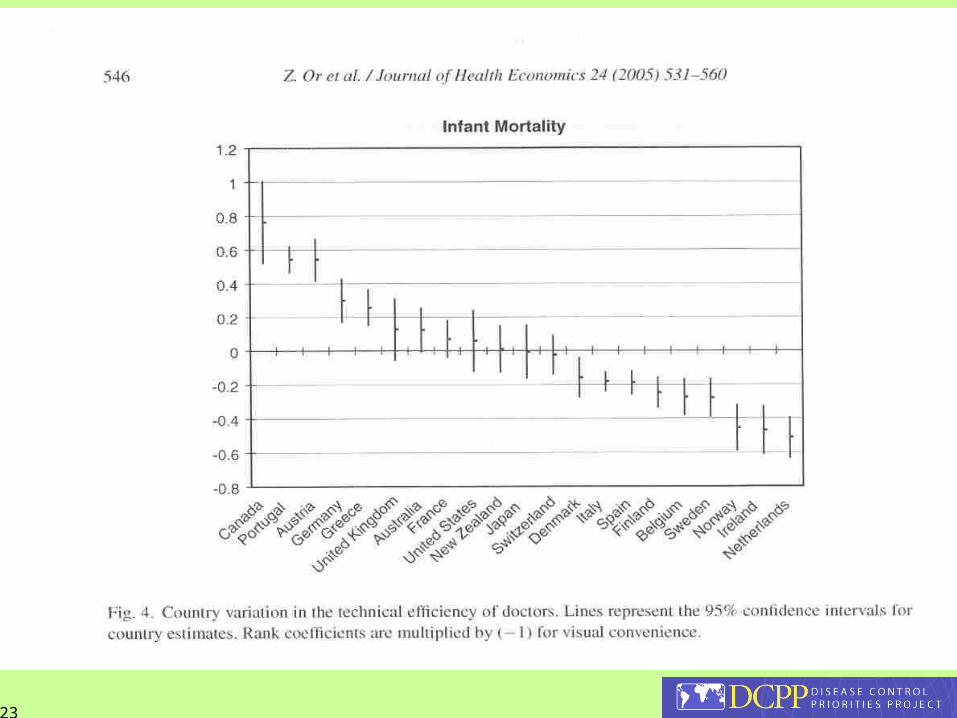
23