Embed Size (px)
Citation preview

Exploring environmental genetic diversity with similarity networks
Philippe Lopez UMR CNRS 7138 Evolution Paris Seine
Université Pierre et Marie Curie – Paris, France

Why look at environmental data ?
Cultivable organisms
Genomics Complete genomes
103 to 104 genes
<1% of diversity
Is environmental diversity just ‘more of the same’ ?
Communities
Metagenomics Short fragments 106 to 108 reads
>99% of diversity
Great Plate Anomaly
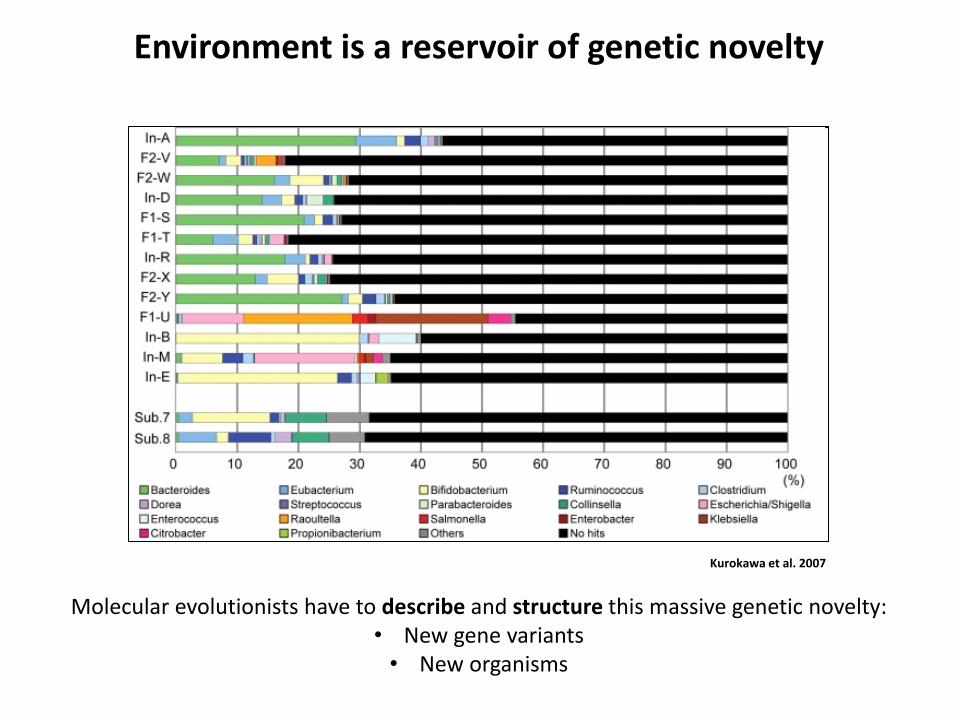
Kurokawa et al. 2007
Environment is a reservoir of genetic novelty
Molecular evolutionists have to describe and structure this massive genetic novelty: • New gene variants • New organisms

Why alternative approaches are needed for such data
Can the environmental diversity be described and structured by an alternative approach that is faster and more inclusive than phylogenetic trees/networks ?
• Typically millions of sequences for one sample
• Assessment of homology can be difficult: • Extreme divergence
• Introgressive processes

Node
individual sequences
Edge
connects two nodes that show some significant
shared property
Exploring a new datatype : sequence similarity networks
• Efficient way of displaying and analyzing diversity • Usually fast assessment of similarity • Quadratic complexity
Can easily accommodate millions of objects
Sequence similarity networks are a mapping of sequences resemblances for given rules
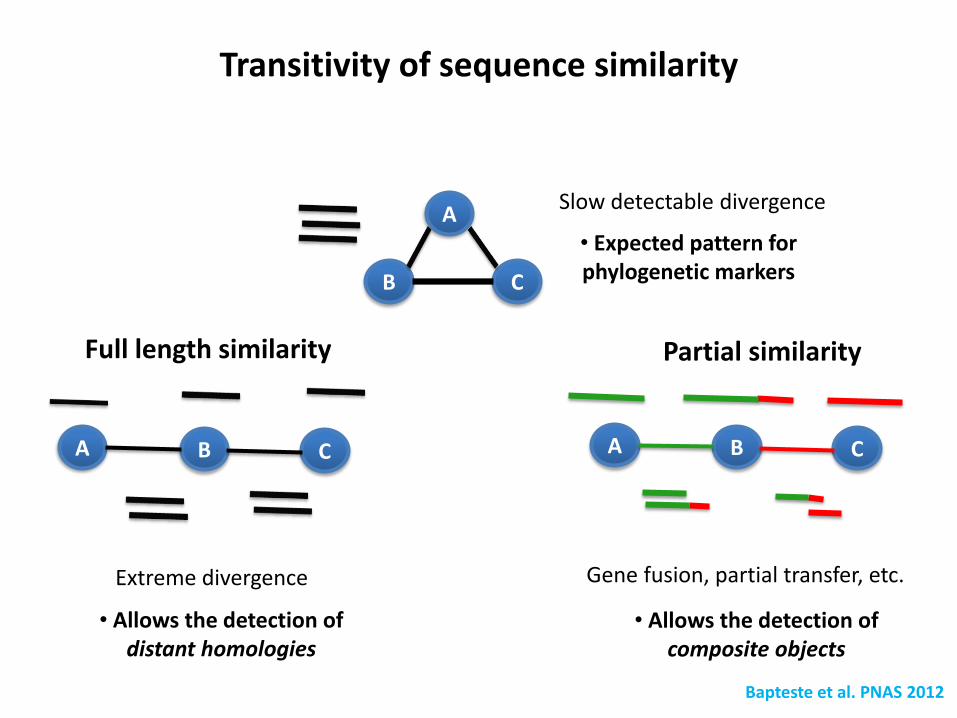
Full length similarity Partial similarity
A B C
• Allows the detection of distant homologies
• Allows the detection of composite objects
Gene fusion, partial transfer, etc.
A B C
Transitivity of sequence similarity
Extreme divergence
Bapteste et al. PNAS 2012
A
C B
Slow detectable divergence
• Expected pattern for phylogenetic markers
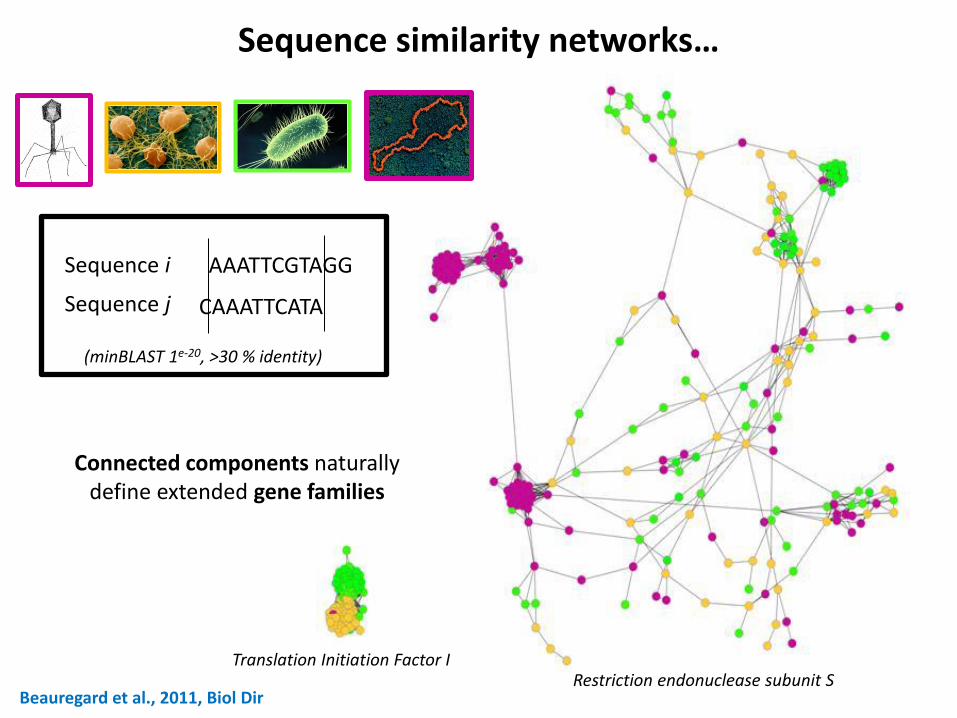
Beauregard et al., 2011, Biol Dir
Sequence similarity networks…
(minBLAST 1e-20, >30 % identity)
AAATTCGTAGG
CAAATTCATA
Sequence i
Sequence j
Restriction endonuclease subunit S Translation Initiation Factor I
Connected components naturally define extended gene families
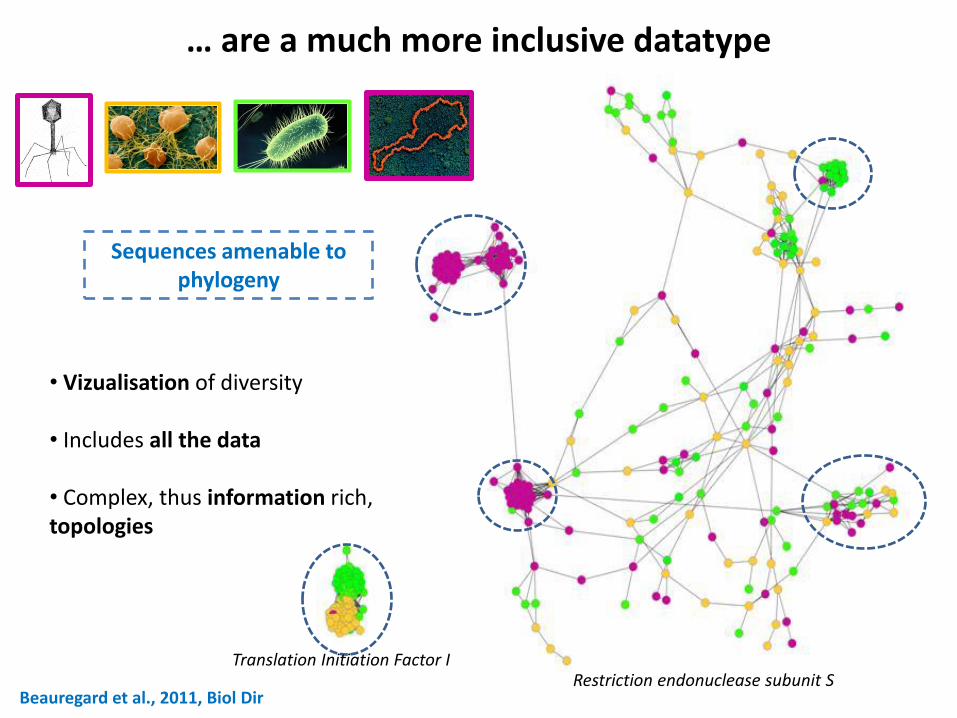
Beauregard et al., 2011, Biol Dir
… are a much more inclusive datatype
Restriction endonuclease subunit S
• Vizualisation of diversity • Includes all the data • Complex, thus information rich, topologies
Sequences amenable to phylogeny
Translation Initiation Factor I

Networks can be mathematically described by graph theory
New datatype in which to look for regularities and singularities
Connected components: • Diameter • Clustering coefficient • Minimum spanning tree
Nodes : • Degree • Closeness, betweenness • Articulation points
Groups of nodes (colored by function, lifestyle, taxonomy,…): • Modularity • Conductance, assortativity
These measures allow a fine description of the networks and thus potentially rich comparisons

Atkinson et al., 2009, PLoS One
Beaudet et al., 2013, GBE
Similarity networks are not phylogenetics, but…
Sequence similarity networks are a mapping of sequences resemblances for given rules If sequences evolved along a tree, node clusters correspond to clades

Similarity networks and environmental data
1) Visualizing and structuring diversity Ecological study of marine ciliates
2) Screening for gene families of interest Mobilization in the human gut microbiome
3) Screening for highly divergent sequences Environmental variants of Domain signature sequences
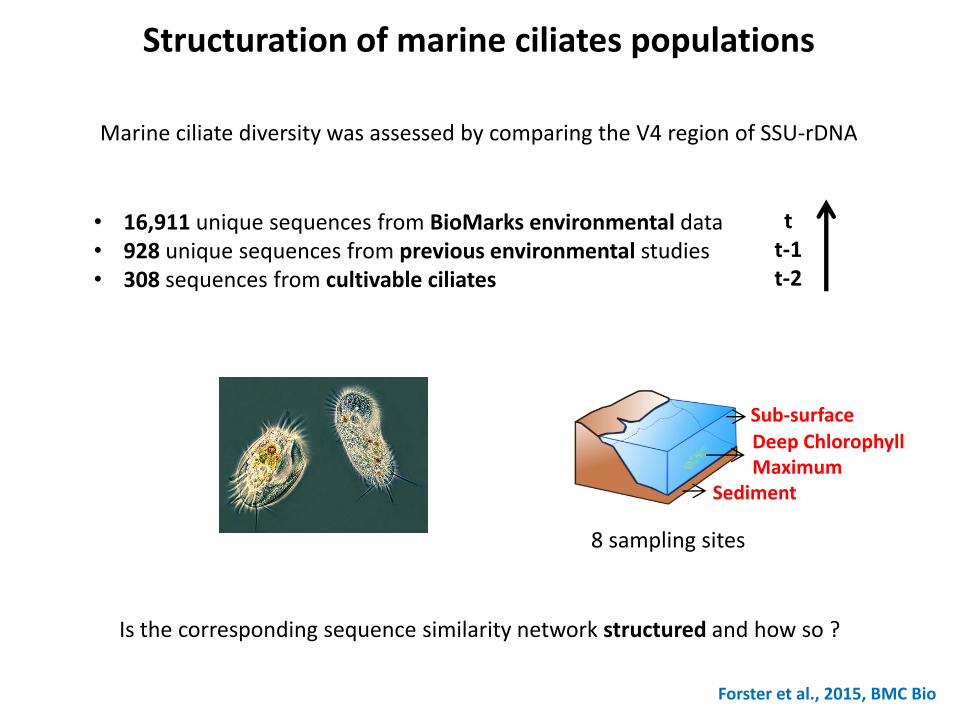
Structuration of marine ciliates populations
Forster et al., 2015, BMC Bio
Sub-surface
Deep Chlorophyll Maximum
Sediment
8 sampling sites
Marine ciliate diversity was assessed by comparing the V4 region of SSU-rDNA
• 16,911 unique sequences from BioMarks environmental data • 928 unique sequences from previous environmental studies • 308 sequences from cultivable ciliates
Is the corresponding sequence similarity network structured and how so ?
t t-1 t-2
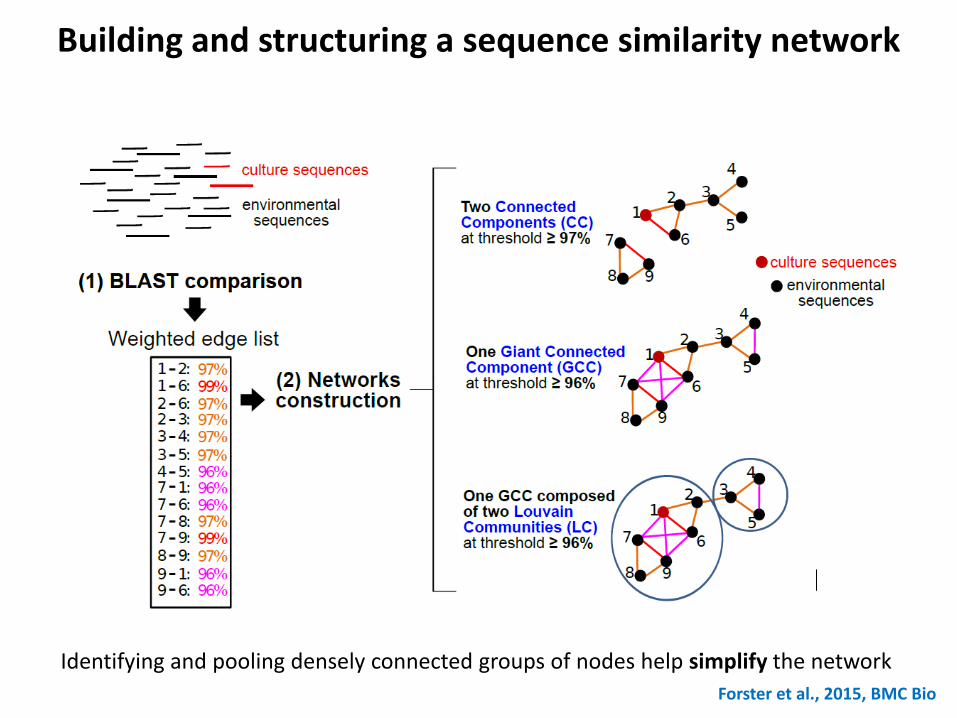
Building and structuring a sequence similarity network
Identifying and pooling densely connected groups of nodes help simplify the network
Forster et al., 2015, BMC Bio
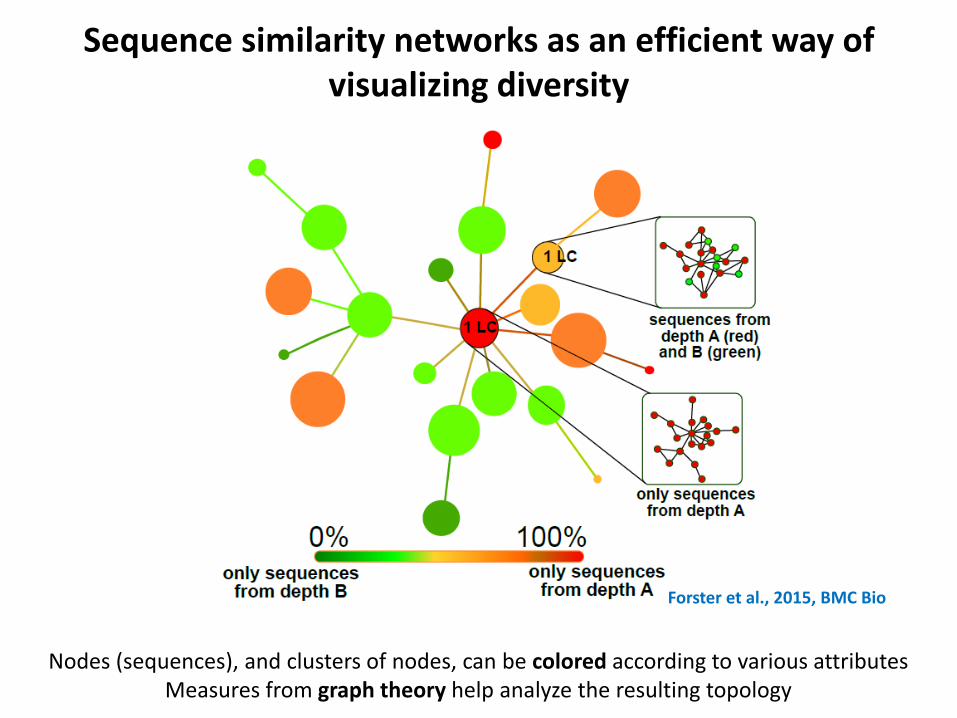
Sequence similarity networks as an efficient way of visualizing diversity
Nodes (sequences), and clusters of nodes, can be colored according to various attributes Measures from graph theory help analyze the resulting topology
Forster et al., 2015, BMC Bio

Environmental ciliate diversity is largely underestimated
Forster et al., 2015, BMC Bio
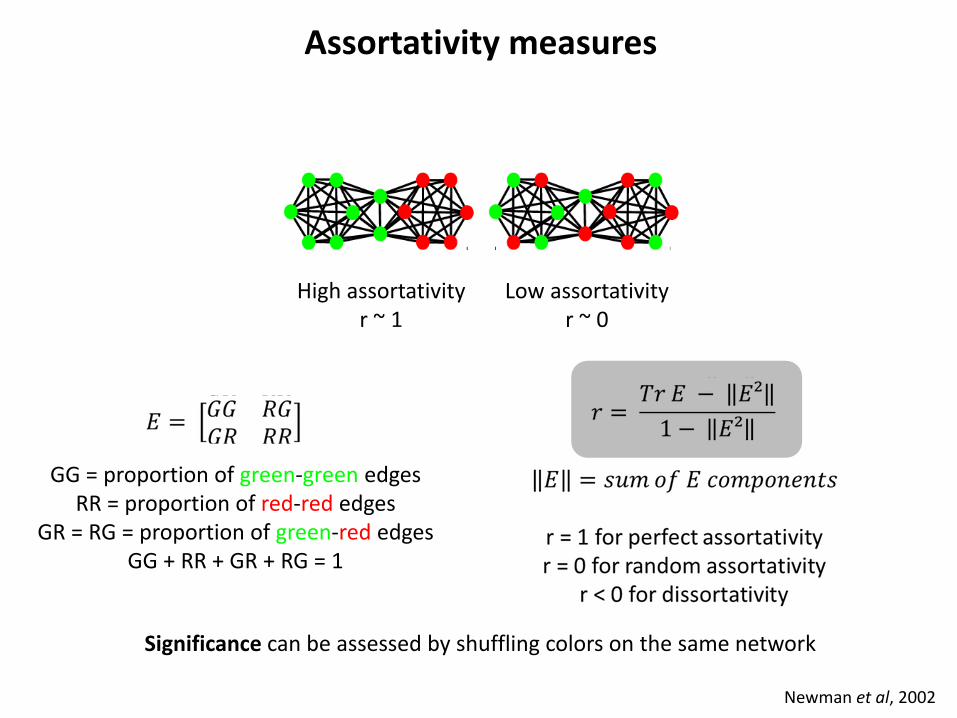
Assortativity measures
Newman et al, 2002
High assortativity r ~ 1
Low assortativity r ~ 0
GG = proportion of green-green edges RR = proportion of red-red edges
GR = RG = proportion of green-red edges GG + RR + GR + RG = 1
Significance can be assessed by shuffling colors on the same network

Ciliate diversity is strongly structured
Forster et al., 2015, BMC Bio
Each of the 3 habitats show significant assortativity
About half of the 8 investigated locations show significant assortativity
Ciliates are thus not globally dispersed but structured by habitat and geographical location
SSN are an efficient and extremely scalable alternative for rRNA diversity surveys
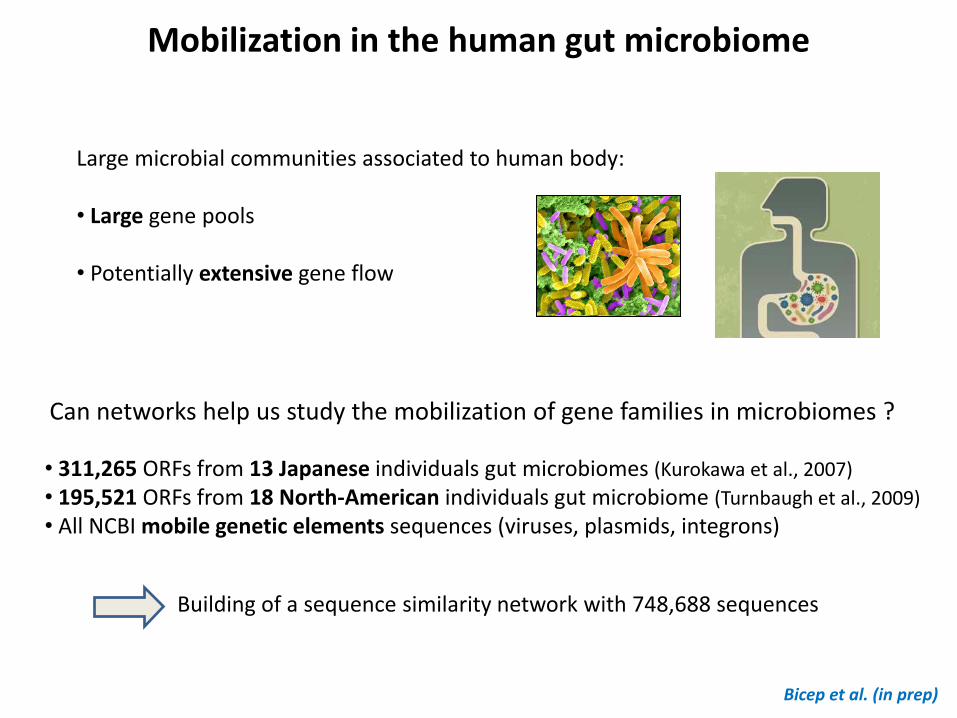
Mobilization in the human gut microbiome
Large microbial communities associated to human body: • Large gene pools • Potentially extensive gene flow
Can networks help us study the mobilization of gene families in microbiomes ?
• 311,265 ORFs from 13 Japanese individuals gut microbiomes (Kurokawa et al., 2007)
• 195,521 ORFs from 18 North-American individuals gut microbiome (Turnbaugh et al., 2009)
• All NCBI mobile genetic elements sequences (viruses, plasmids, integrons)
Building of a sequence similarity network with 748,688 sequences
Bicep et al. (in prep)
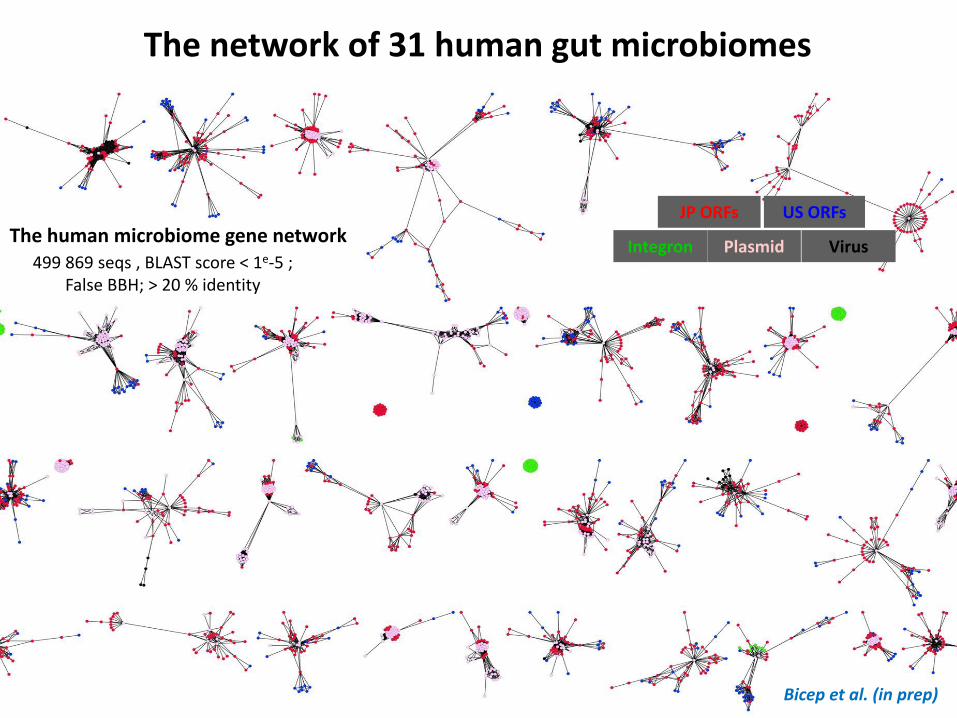
The human microbiome gene network Plasmid Integron Virus
JP ORFs US ORFs
499 869 seqs , BLAST score < 1e-5 ; False BBH; > 20 % identity
The network of 31 human gut microbiomes
Bicep et al. (in prep)
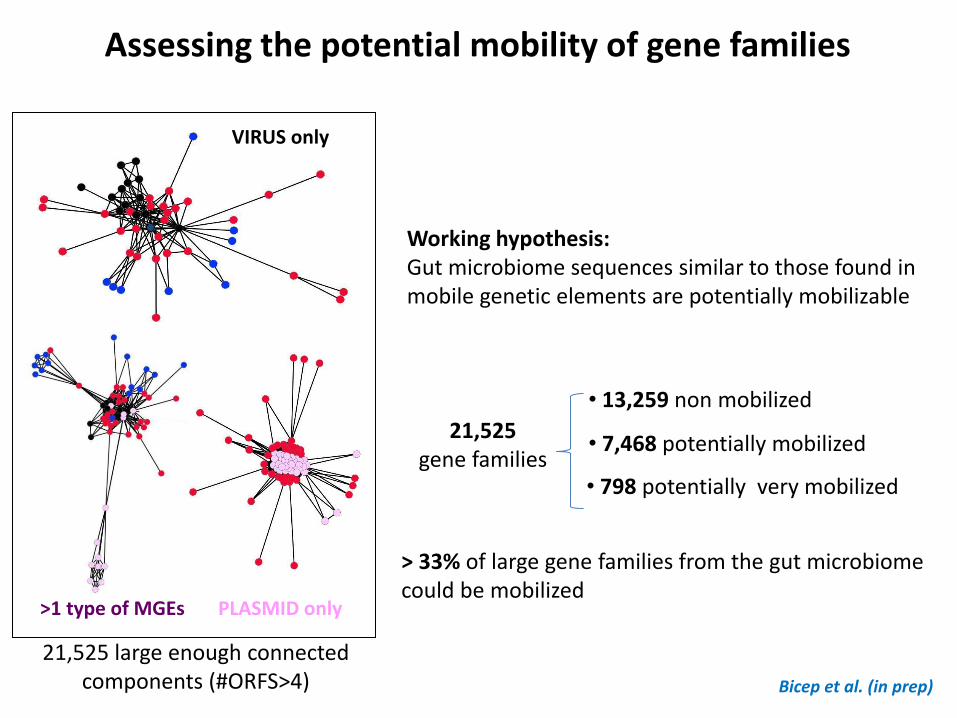
>1 type of MGEs
VIRUS only
PLASMID only
• 13,259 non mobilized
• 7,468 potentially mobilized
• 798 potentially very mobilized
> 33% of large gene families from the gut microbiome could be mobilized
21,525 large enough connected components (#ORFS>4)
21,525 gene families
Assessing the potential mobility of gene families
Bicep et al. (in prep)
Working hypothesis: Gut microbiome sequences similar to those found in mobile genetic elements are potentially mobilizable

# #
#
#
*
* +
+ +
+ +
+
Hypergeometric test, Bonferroni correction, p-value < 0.01
non mobilized
potentially mobilized
potentially very mobilized
(J) Translation; (K) Transcription; (L) Replication and repair; (V) Defense mechanisms; (C) Energy production and conversion; (E) Amino Acid metabolism and transport; F) Nucleotide metabolism and transport; (G)
Carbohydrate metabolism and transport; (H) Coenzyme metabolism; (P) Inorganic ion transport and metabolism; (R) General Functional Prediction only; (S) Function Unknown.
Gut microbiome mobile genes are functionally biased
Bicep et al. (in prep)

Mobile genes are widespread both in microbes and humans
# of microbial host genera (assessed by MGRAST)
# of microbial host phyla (assessed by MGRAST)
>= 4 >= 4
non mobilized
potentially mobilized
potentially very mobilized
Mann Whitney Wilcoxon test, a = 0.01
# of human hosts Bicep et al. (in prep)

Exploring the functioning of large microbial communities
Screening of a very large sequence dataset: • ‘useful’ functions are preferentially mobilized • gene flow within but also between microbiomes
Further developments: • Comparison of the various individuals microbiomes : coloring the nodes by individuals and exploiting their topological relationships • Very scalable protocol : investigating more recent (and thus much larger) datasets
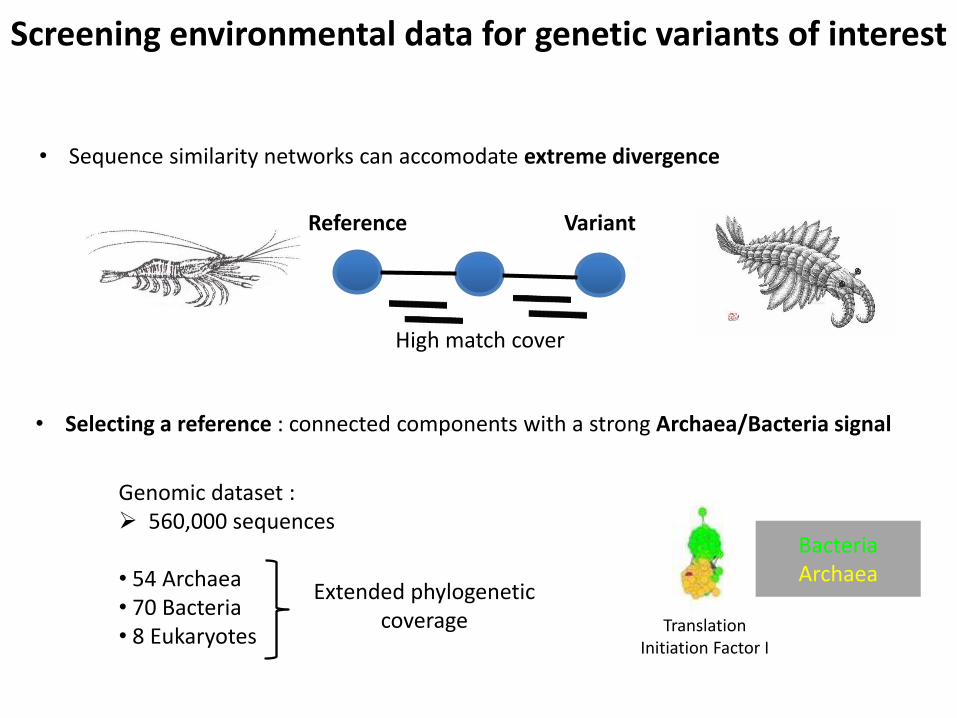
Screening environmental data for genetic variants of interest
• Sequence similarity networks can accomodate extreme divergence
Reference Variant
High match cover
• Selecting a reference : connected components with a strong Archaea/Bacteria signal
Genomic dataset : 560,000 sequences
• 54 Archaea • 70 Bacteria • 8 Eukaryotes
Extended phylogenetic coverage Translation
Initiation Factor I
Bacteria Archaea
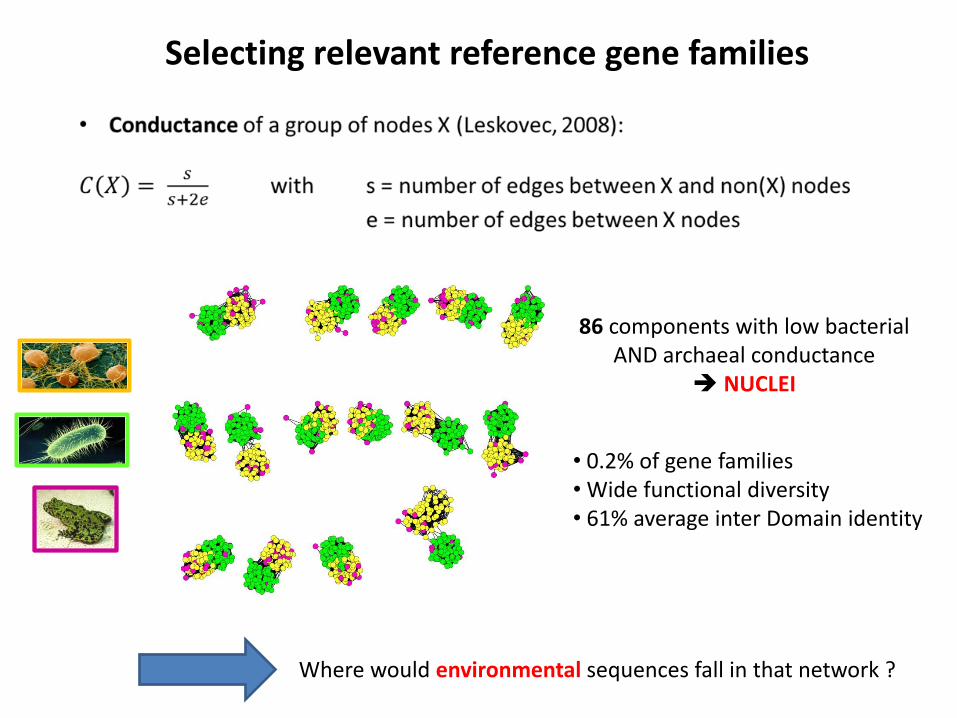
Selecting relevant reference gene families
86 components with low bacterial AND archaeal conductance
NUCLEI
• 0.2% of gene families • Wide functional diversity • 61% average inter Domain identity
Where would environmental sequences fall in that network ?
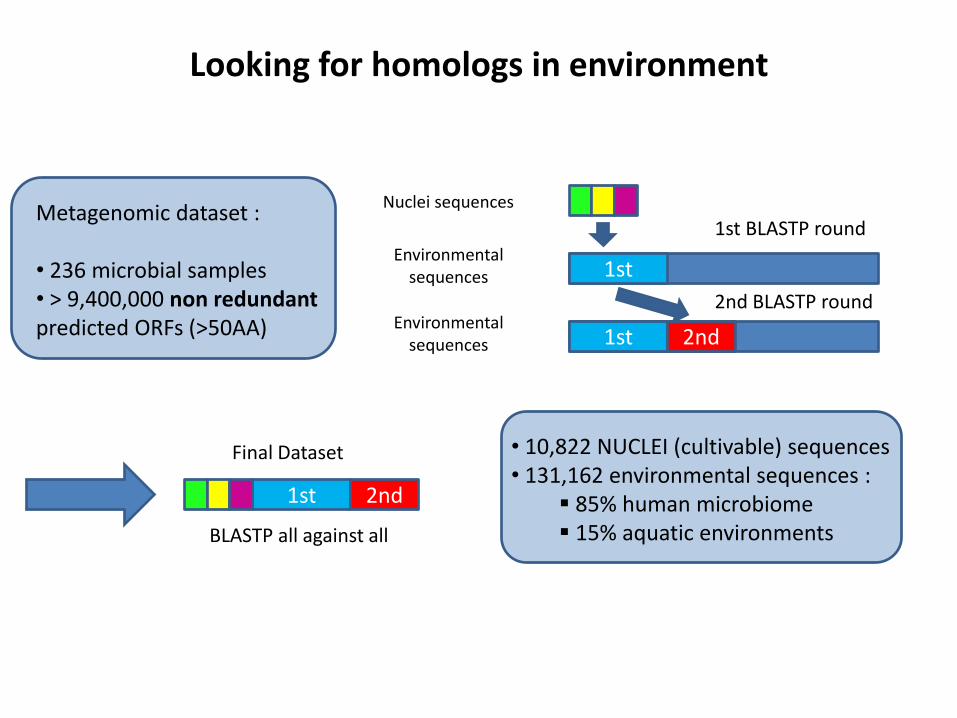
Looking for homologs in environment
Metagenomic dataset : • 236 microbial samples • > 9,400,000 non redundant predicted ORFs (>50AA)
Nuclei sequences
Environmental sequences
Environmental sequences
1st
1st 2nd
1st BLASTP round
2nd BLASTP round
1st 2nd
Final Dataset
BLASTP all against all
• 10,822 NUCLEI (cultivable) sequences • 131,162 environmental sequences :
85% human microbiome 15% aquatic environments
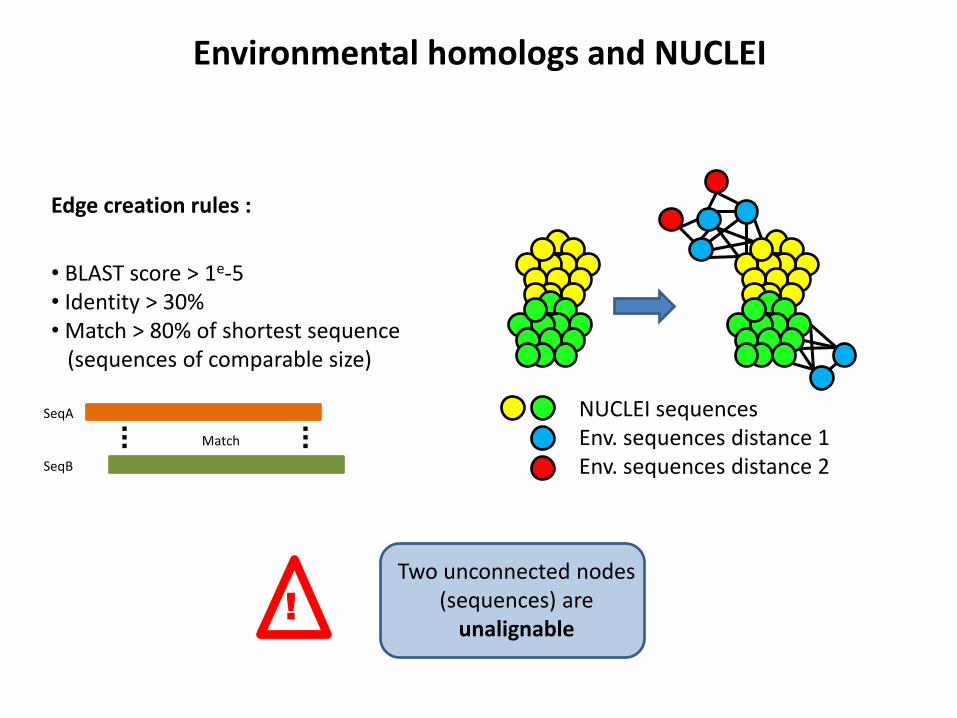
Environmental homologs and NUCLEI
Edge creation rules :
• BLAST score > 1e-5 • Identity > 30% • Match > 80% of shortest sequence (sequences of comparable size)
SeqA
SeqB
Match
NUCLEI sequences Env. sequences distance 1 Env. sequences distance 2
!
Two unconnected nodes (sequences) are
unalignable

Maltose ABC transporters
Proof of concept
At least two types of divergent and highly
divergent Maltose ABC Transporters in the
environment
Archaea
Env. sequences distance 2 Bacteria
Env. sequences distance 1
What’s the divergence between these sequences and those of cultured organisms ?
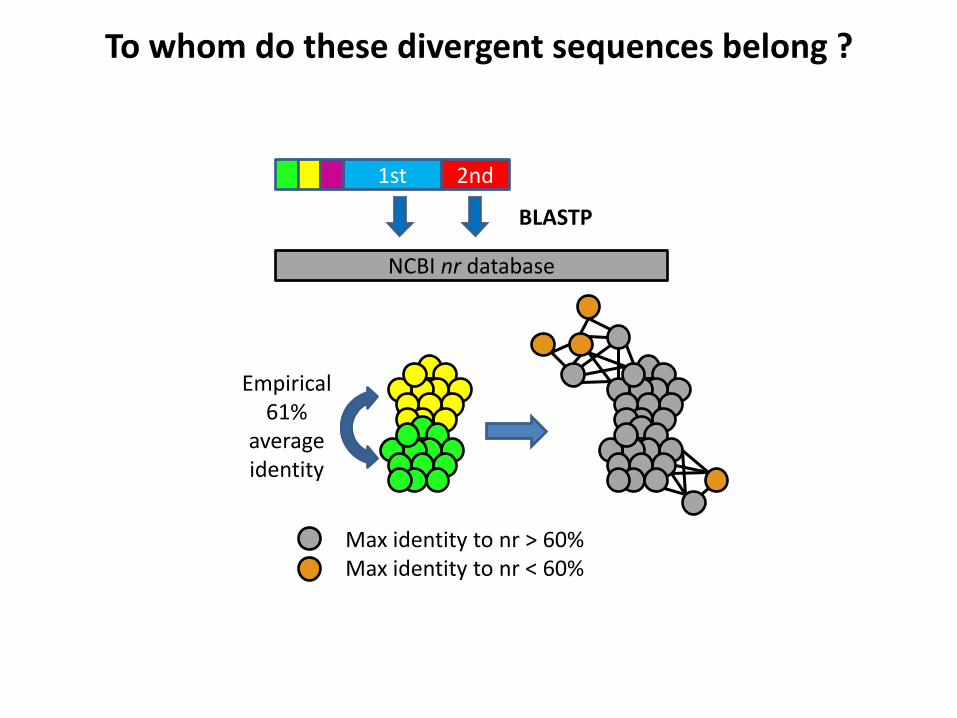
To whom do these divergent sequences belong ?
1st 2nd
NCBI nr database
BLASTP
Max identity to nr > 60% Max identity to nr < 60%
Empirical 61%
average identity
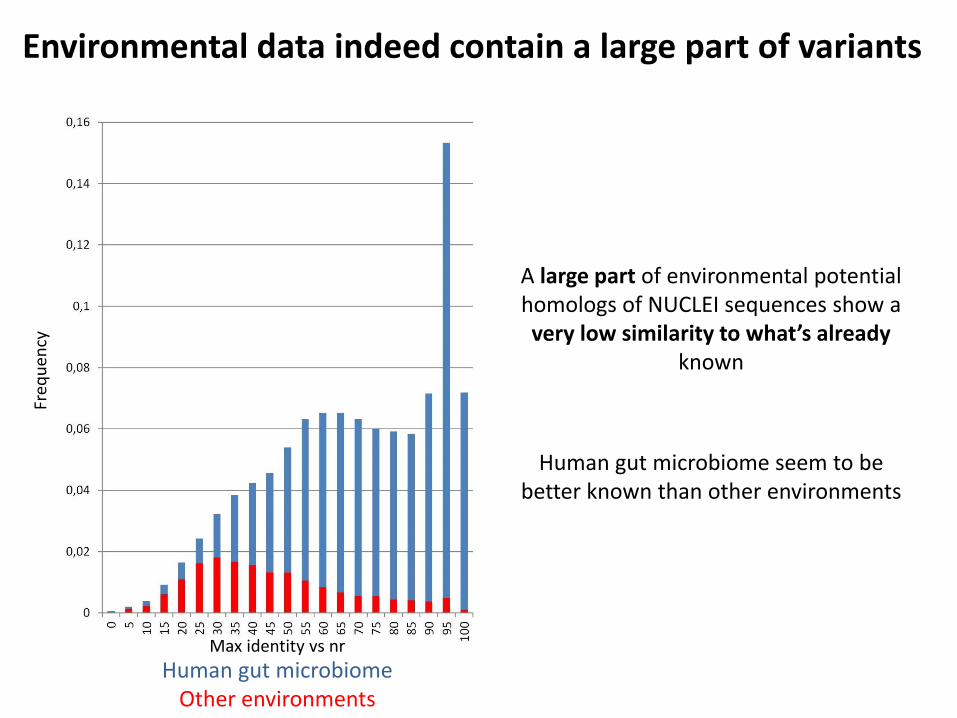
Environmental data indeed contain a large part of variants
Max identity vs nr
Freq
uen
cy
Human gut microbiome Other environments
A large part of environmental potential homologs of NUCLEI sequences show a very low similarity to what’s already
known
Human gut microbiome seem to be better known than other environments

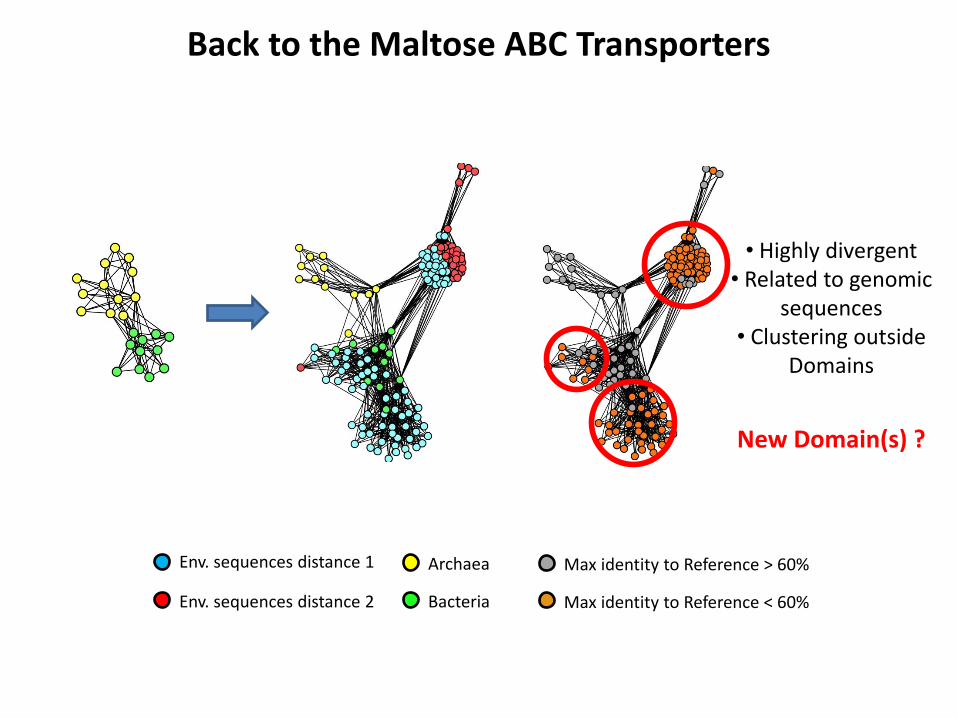
Back to the Maltose ABC Transporters
Env. sequences distance 2
Env. sequences distance 1 Archaea
Bacteria
Max identity to Reference > 60%
Max identity to Reference < 60%
Env. sequences distance 2
Env. sequences distance 1 Archaea
Bacteria
Max identity to Reference > 60%
Max identity to Reference < 60%
• Highly divergent • Related to genomic
sequences • Clustering outside
Domains
New Domain(s) ?
Back to the Maltose ABC Transporters

Some compelling examples
DUF167 Cobalamine Phosphate
Synthase
Archaea
Bacteria Max identity to Reference > 60%
Max identity to Reference < 60% Eukaryotes
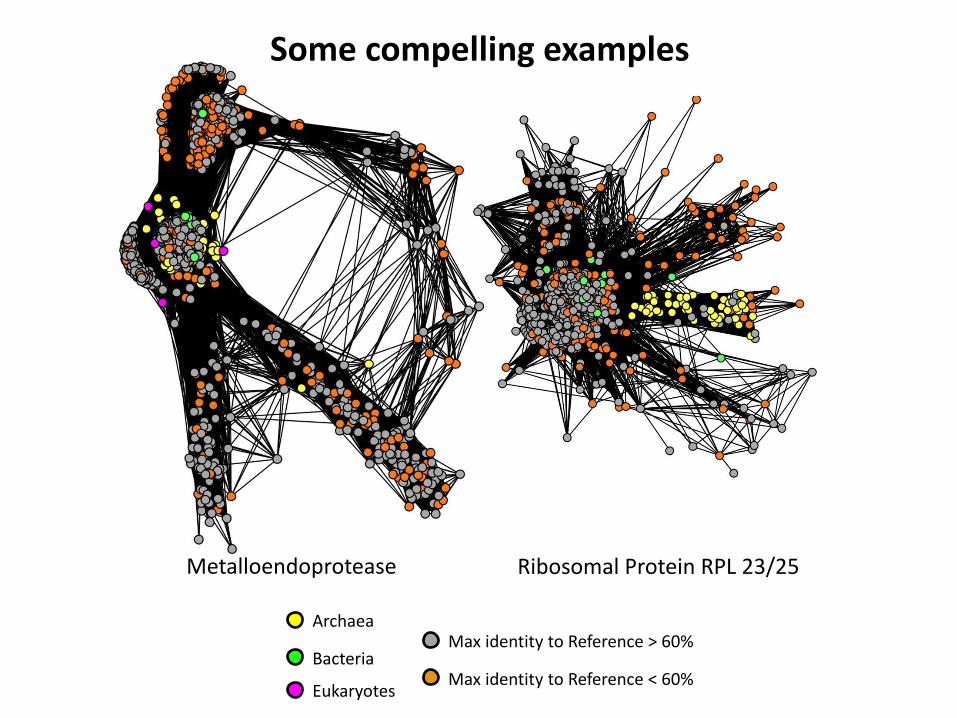
Some compelling examples
Metalloendoprotease Ribosomal Protein RPL 23/25
Archaea
Bacteria Max identity to Reference > 60%
Max identity to Reference < 60% Eukaryotes
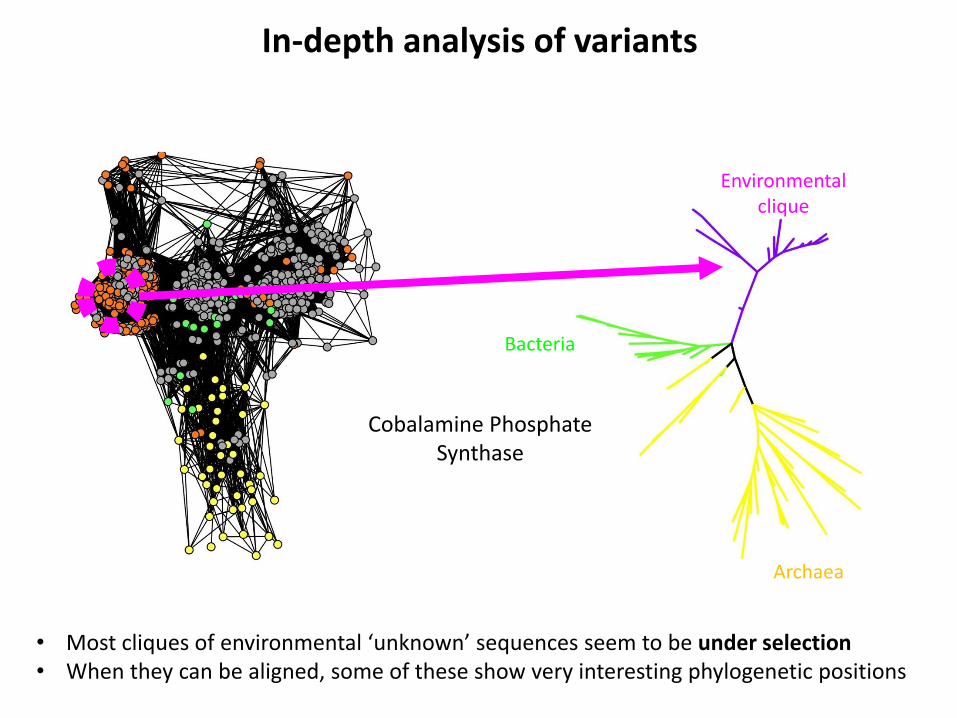
In-depth analysis of variants
• Most cliques of environmental ‘unknown’ sequences seem to be under selection • When they can be aligned, some of these show very interesting phylogenetic positions
Cobalamine Phosphate Synthase
Environmental clique
Bacteria
Archaea

What are these sequences ?
• Metagenomic sequencing errors / frameshifts ? 80% covering constraint Clusters in networks • Viral sequences ? Only ‘microbial’ metagenomes NCBI nr database already contains viruses If so, where do they come from ? Explanation for similarity AND isolation ? • Sequences from genuine cellular organisms ?
Let’s look for them !
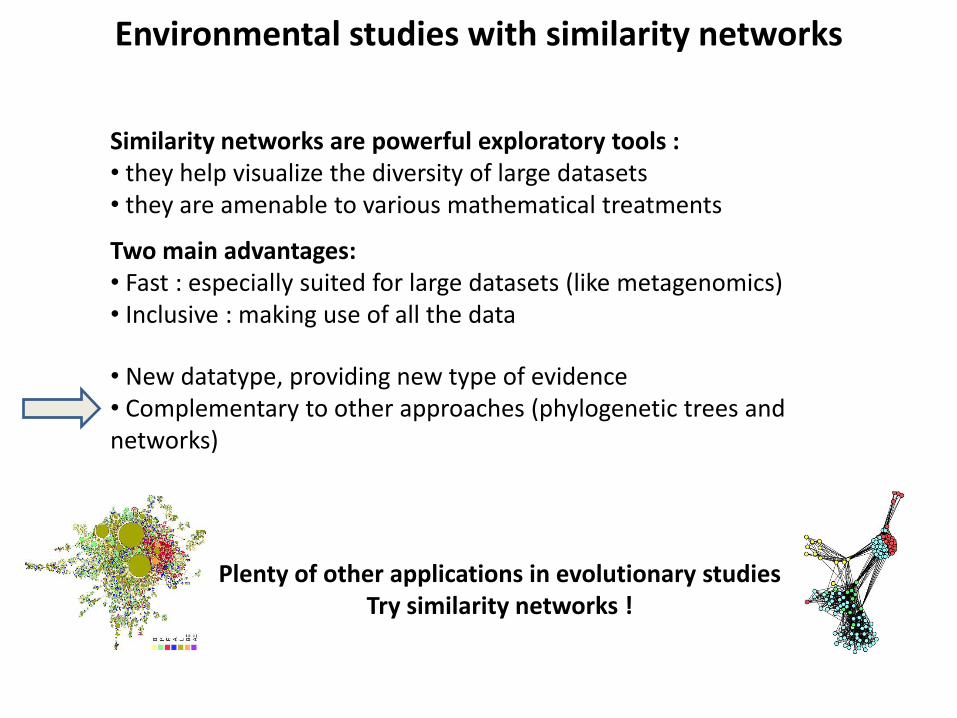
Environmental studies with similarity networks
Similarity networks are powerful exploratory tools : • they help visualize the diversity of large datasets • they are amenable to various mathematical treatments
Two main advantages: • Fast : especially suited for large datasets (like metagenomics) • Inclusive : making use of all the data
• New datatype, providing new type of evidence • Complementary to other approaches (phylogenetic trees and networks)
Plenty of other applications in evolutionary studies Try similarity networks !
Many thanks to my excellent coworkers
• Eric Bapteste • Eduardo Corel • Cédric Bicep
• Pierre-Alain Jachiet • Raphaël Meheust
• Jananan Pathmanathan • Chloé Vigliotti • Sukithar Rajan
Many thanks to the organizers ! Thank you !

Similarity networks built on metagenomics reads
> 90 % ID > 80% cover
Some connected components exhibit the standard ‘laminar’ topology
~200 bp
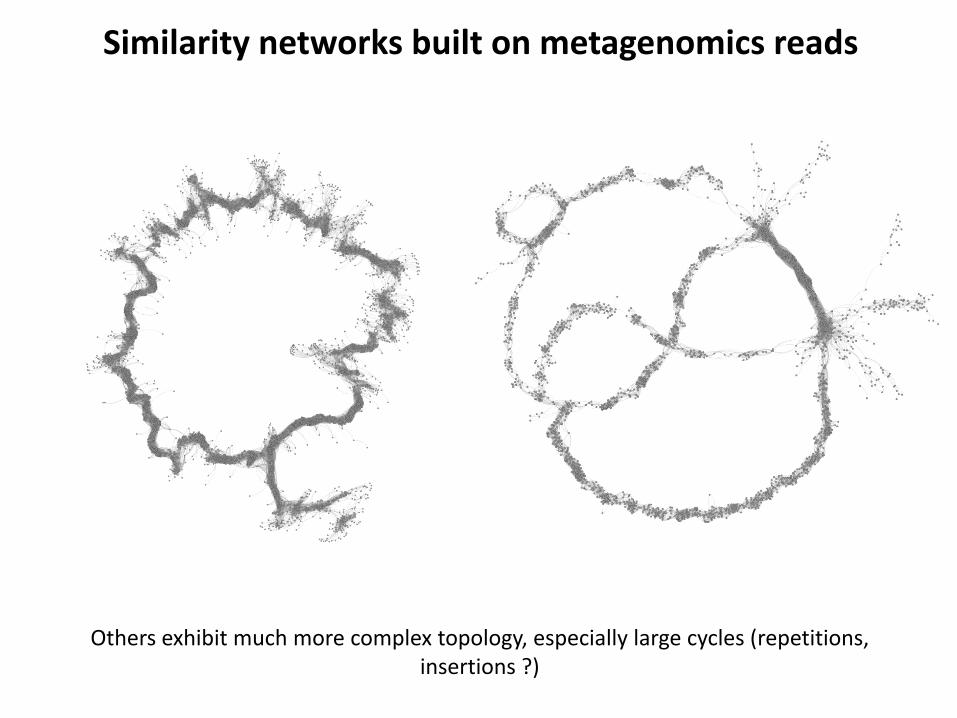
Similarity networks built on metagenomics reads
Others exhibit much more complex topology, especially large cycles (repetitions, insertions ?)
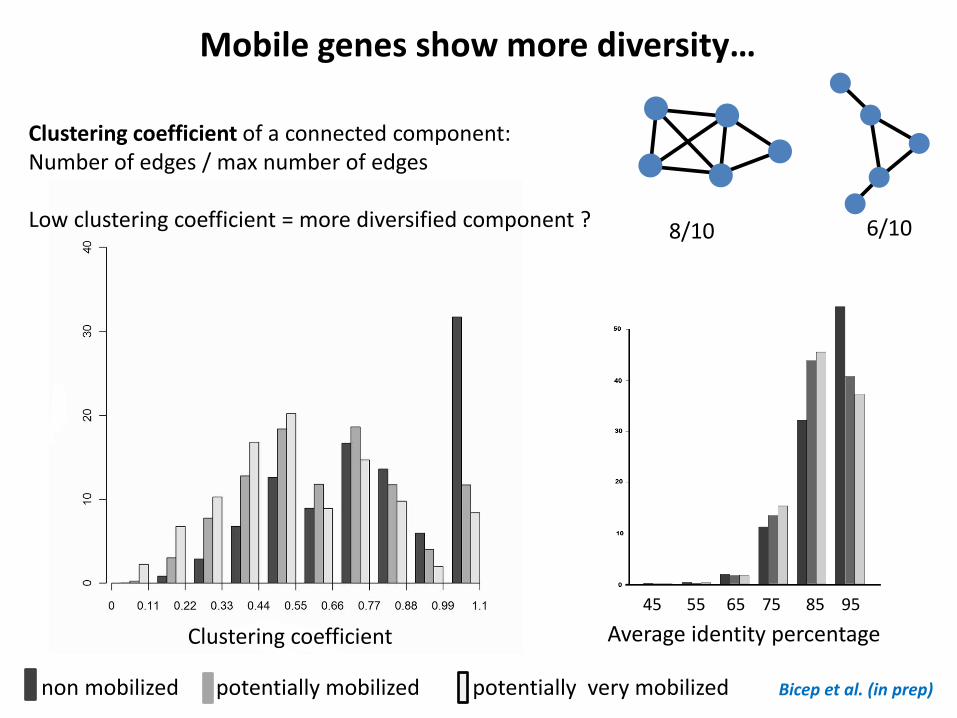
Clustering coefficient Average identity percentage
Bicep et al. (in prep)
Mobile genes show more diversity…
Clustering coefficient of a connected component: Number of edges / max number of edges Low clustering coefficient = more diversified component ? 8/10 6/10
non mobilized potentially mobilized potentially very mobilized
45 55 65 75 85 95
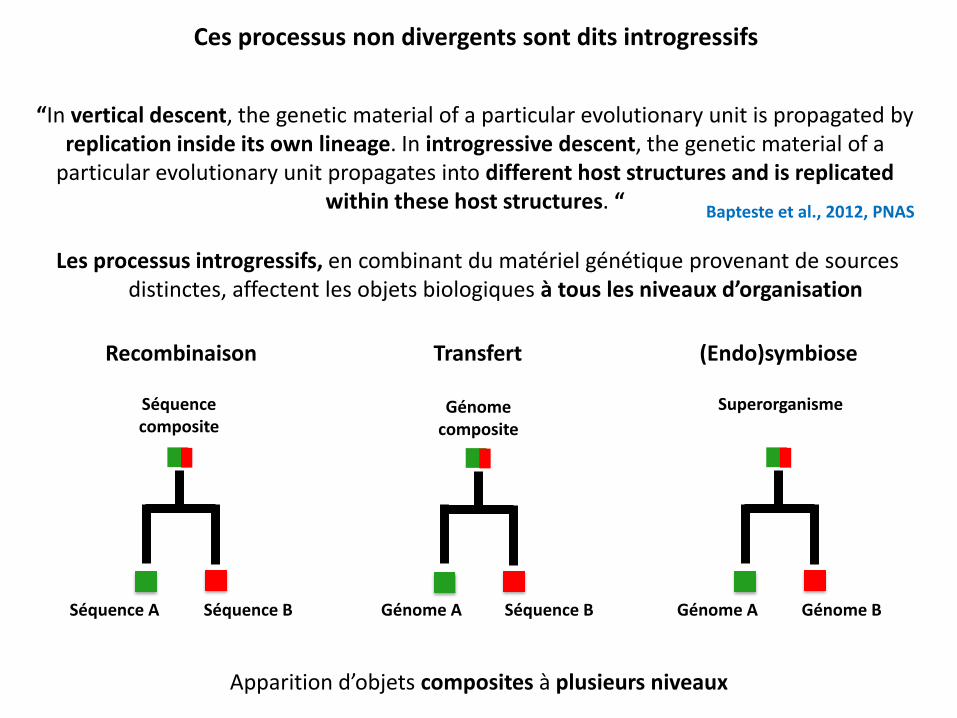
Les processus introgressifs, en combinant du matériel génétique provenant de sources distinctes, affectent les objets biologiques à tous les niveaux d’organisation
“In vertical descent, the genetic material of a particular evolutionary unit is propagated by replication inside its own lineage. In introgressive descent, the genetic material of a
particular evolutionary unit propagates into different host structures and is replicated within these host structures. “ Bapteste et al., 2012, PNAS
Ces processus non divergents sont dits introgressifs
Séquence A Séquence B Séquence B Génome A Génome A Génome B
Recombinaison Transfert (Endo)symbiose
Séquence composite
Génome composite
Superorganisme
Apparition d’objets composites à plusieurs niveaux
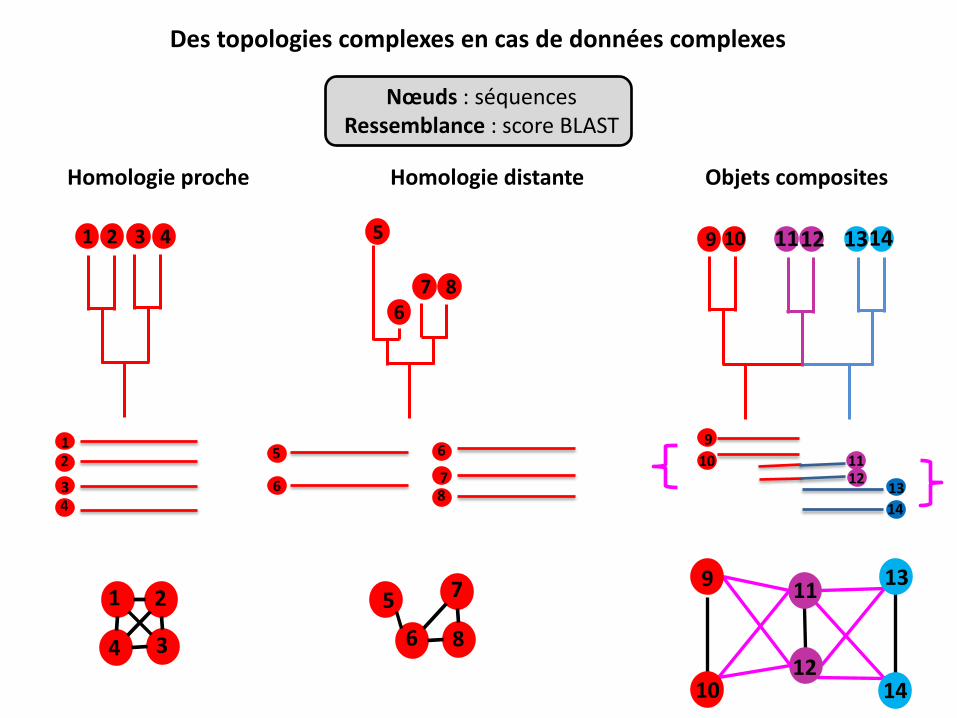
Homologie proche Homologie distante
1 2 3 4
1 2
3 4
5
6 7 8
5
6
6
7 8
Objets composites
9 10 11 12 14 13
9
10 11 12
13
14
1 2
3 4
5
6
7
8
9
10 14
13 11
12
Des topologies complexes en cas de données complexes
Nœuds : séquences Ressemblance : score BLAST

Composante connexe du réseau de reads
> 90 % ID > 80% cover
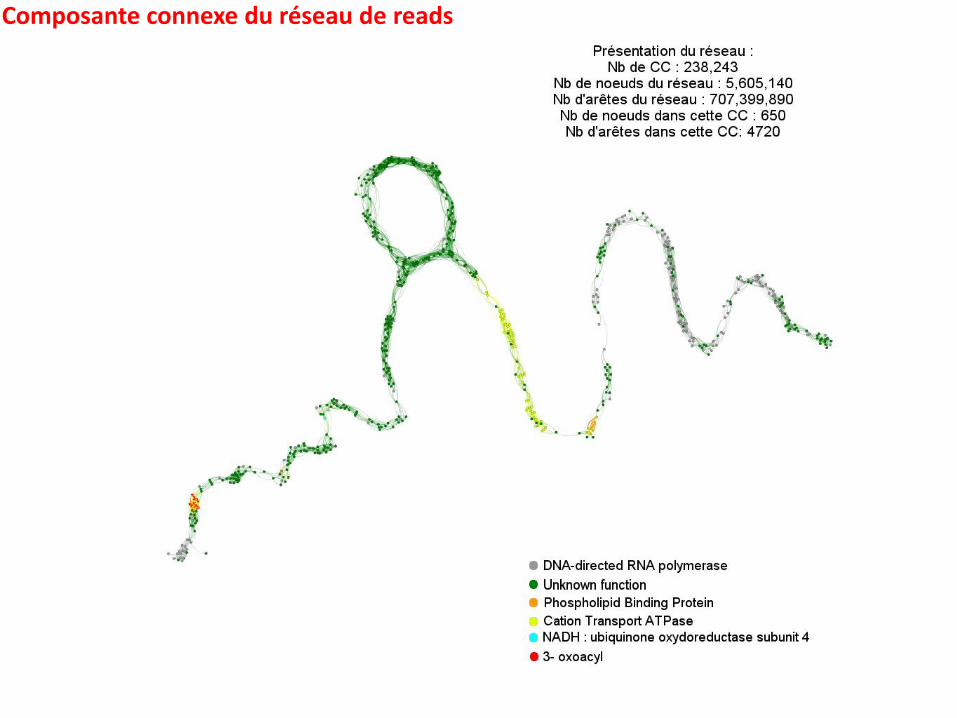
Composante connexe du réseau de reads

A fast and inclusive description of diversity
Can these new datatypes be useful for evolutionary studies ?

L’histoire évolutive du vivant est donc sans doute bien plus complexe qu’un arbre
Multitude d’objets, de types d’objets et de processus évolutifs
plasmides virus cellules virus
Comment décrire, structurer et expliquer une telle diversité ?

Sequences aligned and treed with PhyML; dN/dS ratio estimated with PAML
d
>= 2
Mobile genes are under the same selection
non mobilized
potentially mobilized
potentially very mobilized
Bicep et al. (in prep)
dN/dS