Embed Size (px)
Citation preview
Exploring Drivers’ Seated Position Method Development within Automotive Ergonomics
NADJA LEJON
HENRIK THORSÉN
Master of Science Thesis in the Master Degree Programs
Industrial Design Engineering and Product Development
Department of Product- and Production Development
Division of Design & Human Factors
CHALMERS UNIVERSITY OF TECHNOLOGY
Gothenborg, Sweden 2013

Exploring Drivers’ Seated Position Method Development within Automotive Ergonomics
Department of Product- and Production Development
Division of Design & Human Factors
NADJA LEJON
HENRIK THORSÉN
CHALMERS UNIVERSITY OF TECHNOLOGY
Gothenborg, Sweden 2013
Master of Science Thesis
SUPERVISOR/EXAMINER: LARS-OLA BLIGÅRD
Master of Science Thesis PPUX05
Exploring Drivers’ Seated Position
Method Development within Automotive Ergonomics
Master of Science Thesis in the Master Degree Program, Industrial Design Engineering
© Nadja Lejon& Henrik Thorsén
Chalmers University of Technology
SE-412 96 Goteborg, Sweden
Telefon +46(0) 31-772 1000
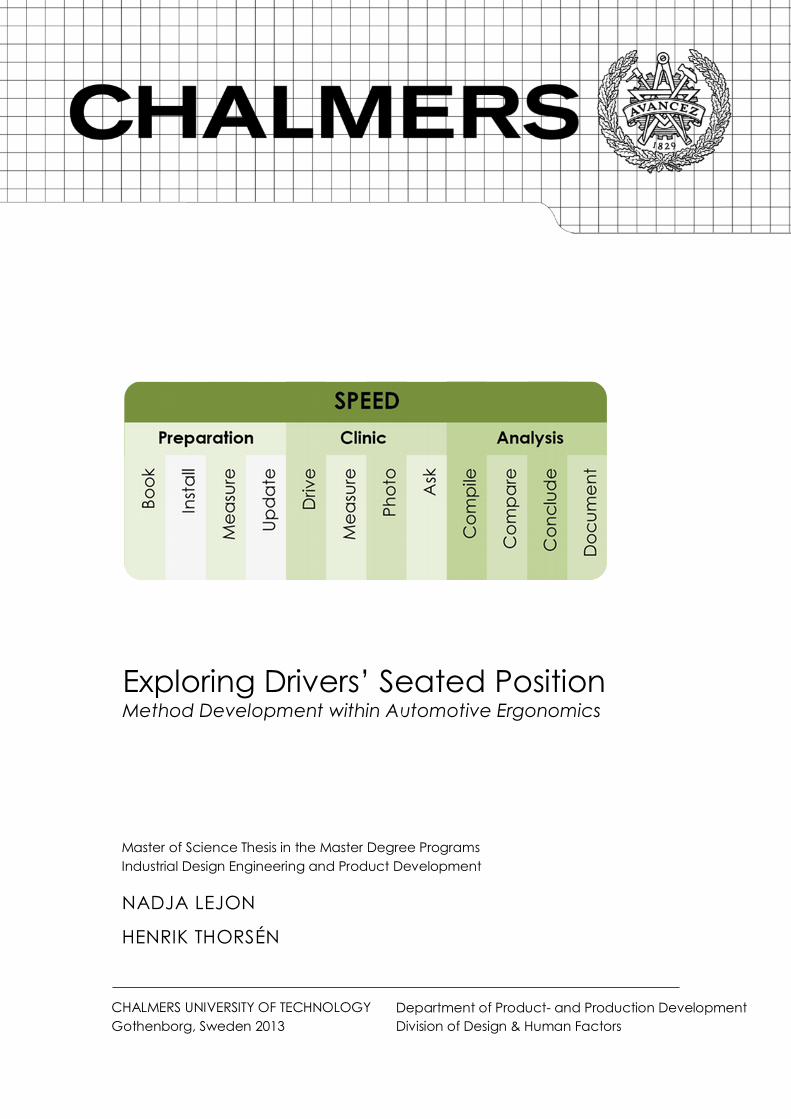
Cover: The phases of SPEED
Print: Repro Service Chalmers
i
Foreword
Completing this master thesis has been a rewarding journey where
many aspects of seated position for driving have been investigated.
Numerous interviews have been held with interesting and kind people
who have been generous with their time and knowledge. We have
learned that there are many parameters that affect the seated position,
and the new awareness now makes the adjustment of seat and steering
wheel to a time consuming task whenever we are to drive.
We especially want to thank the Ergonomics department at Volvo Cars
Corporation for all help and feedback along the project, and send a
special thank you to the supervisors of the project; Magnus Jerksjö and
Pernilla Nurbo. We would also like to thank the departments of Crash
and Safety, Seat, Measuring and Equipment who have been of great
support when developing the method. We would also like to thank Erik
Kristiansson for guidance with statistics at the Statistics department at
Chalmers University of Technology.
Last but not least we want to thank our examiner and supervisor from
Chalmers, Lars-Ola Bligård, who has been a great support for the
method development of SPEED.
Nadja Lejon and Henrik Thorsén, Göteborg, 27 May of 2013

ii
iii
Abstract
The Master Thesis project “Exploring Drivers’ Seated Position –
Method Development within Automotive Ergonomics” by Nadja Lejon
and Henrik Thorsén was carried out at the department of Product and
Production Development at Chalmers University of Technology. The
project has been conducted in cooperation with the Ergonomics
department at Volvo Car Corporation in Gothenburg.
Volvo is expanding in Asia and to make it possible to develop cars for
the wider range of drivers it is necessary to evaluate and understand
how and why drivers are positioned the way they are. If an early
evaluation of the car’s ergonomics is made, including information about
reference points for the seated person, problems can be visualized to
allow potential design changes before expenses go up.
The purpose of this Master Thesis is to develop a method that should
give answer to how and why people sit the way they sit when driving, and
be applicable to all of Volvo’s car models. The method will be used by
different people at the Ergonomics department why repeatability and
usability are important factors to consider as well as time. Finally the
method is used for evaluation of one car model, a Volvo XC60.
The developed method is called SPEED, Seated Position Evaluation
from Elicited Data, and consists of three phases; preparation, clinic and
analysis. The clinic is conducted while driving and the analysis is divided
into basic and further analysis where some results shown in the basic
analysis are coordinates for eye point, heel point, H-point and distance
between head and headrest. To complete SPEED, instructions, a
compilation document, a questionnaire and a coordinates program are
included.
Keywords: H-point, heel point, eye point, seated position, method
development and automotive ergonomics

iv
v
Glossary
Key word Explanation
Anthropometrics The study concerned with the measurements of the proportions, size and weight of the human body.
CAN bus CAN bus is a vehicle bus standard designed to allow microcontrollers and devices to communi-cate with each other within a vehicle without a host computer.
CATIA Computer Aided Design (CAD) software used by VCC.
Clinic A field evaluation with chosen test participants. DiCE Diagnostic Communication Equipment. For
example used to diagnose and troubleshoot Volvo vehicles from and including model year 1999.
Eyellipse The distribution of drivers’ eye locations. Eye point Reference point of the driver’s eye location Eye tracking An eye tracker is a device for measuring eye
positions and eye movement. A popular variant uses video images from which the eye position is extracted.
Excel Computing software from Microsoft used for handling data and performing analyses.
GGD DHA A program developed by VCC. A diagnose tool where one can see for example seat motor steps.
GoPro GoPro is a company producing cameras that can be used in various environments and can for example have adhesive mounts.
Heel point A SAE defined point where the heel touches the floor.
H-point A point corresponding to the pivot centre of the human torso and upper leg.
Manikin Full size model of a human, digital in CATIA or physical, which can be adjusted to represent the different percentiles.
Occupant packaging
Occupant and interior packaging involves: determining the necessary amount of vehicle interior space for the customer, arranging interior and structural components in order to enhance the performance of the customer, and increasing overall satisfaction, comfort, accommodation and safety for all occupants (SAE International, 2013).
vi
Photoshop Adobe Photoshop is a graphics editing program from Adobe Systems.
RAMSIS RAMSIS is a CAD tool for ergonomics design and analysis of vehicle interiors and working places. It can be used for e.g. analysis of visibility, comfort and ergonomics.
SgRP A specific H-point used by manufacturers as a design reference point, which establishes the rearmost normal design driving or riding position of each seating position. In this point all modes of adjustment, horizontal, vertical and tilt, are included.
SIMCA Statistics software. Testkliniklistan A list with employees at VCC and their measured
anthropometrics. VCC Short for Volvo Car Corporation. VESC Short for Volvo Engineering Student Concept, a
program initiated providing summer job and master thesis at VCC.
Wide angle A wide-angle lens has smaller focal length than normal lenses. More of the scene is included in the photograph.
vii
Contents
Foreword ...................................................................................................i
Abstract ................................................................................................... iii
Glossary ................................................................................................... v
1 Introduction ................................................................................... 11
1.1 Purpose ................................................................................. 12
1.2 Goal ...................................................................................... 12
1.3 Vision ..................................................................................... 12
1.4 Outline of thesis..................................................................... 13
2 Theory ............................................................................................ 17
2.1 SAE Standards ....................................................................... 17
2.2 Parameters for seated position ............................................ 19
2.3 Clinic ..................................................................................... 23
2.4 Seated position clinics at VCC Ergonomics ......................... 25
2.5 Summary of theory ............................................................... 27
3 Process/method ............................................................................ 29
3.1 Needfinding .......................................................................... 30
3.2 Assumptions .......................................................................... 31
3.3 Overall design ....................................................................... 31
3.4 Detailed design .................................................................... 31
3.5 Description of SPEED ............................................................. 31
3.6 Evaluation of SPEED .............................................................. 32
3.7 Result of SPEED in XC60 ........................................................ 32
4 Needfinding .................................................................................. 33
4.1 User needs ............................................................................ 33
4.2 VCC Ergonomics’ needs ...................................................... 34
4.3 Further external needs .......................................................... 34
4.4 Delimitations ......................................................................... 35
5 Assumptions .................................................................................. 37
5.1 Assumption: Comfort is a factor ........................................... 37
5.2 Assumption: Reachability is a factor .................................... 38
5.3 Assumption: Visual references are a factor ......................... 38
viii
5.4 Assumption: Anthropometrics is a factor ............................. 39
5.5 Assumption: Limitations of the car is a factor ...................... 40
5.6 Assumption: Personal attitude is a factor ............................ 40
5.7 Summary of assumptions ...................................................... 42
6 Overall design ............................................................................... 43
6.1 Evaluation of concepts ........................................................ 44
6.2 Test approach ...................................................................... 45
6.3 Instructions ............................................................................ 46
6.4 Standardisation ..................................................................... 47
6.5 Summary of overall design ................................................... 48
7 Detailed design ............................................................................. 49
7.1 Retrieving H-point ................................................................. 49
7.2 Retrieving Eye point .............................................................. 53
7.3 Retrieving steering wheel position........................................ 56
7.4 Heel point.............................................................................. 57
7.5 Drive route ............................................................................ 58
7.6 Test participants .................................................................... 59
7.7 Questionnaire ....................................................................... 59
7.8 Analysis .................................................................................. 62
7.9 Tools used for SPEED ............................................................. 64
7.10 Summary detailed design .................................................... 65
8 Description of SPEED ..................................................................... 67
8.1 Preparation ........................................................................... 67
8.2 Clinic ..................................................................................... 69
8.3 Analysis .................................................................................. 71
9 Evaluation of SPEED ...................................................................... 73
10 Result of SPEED in XC60 ................................................................. 77
10.1 Assumption: Comfort is a factor ........................................... 77
10.2 Assumption: Reachability is a factor .................................... 78
10.3 Assumption: Visual references are a factor ......................... 79
10.4 Assumption: Anthropometrics is a factor ............................. 80
10.5 Assumption: Limitations of the car is a factor ...................... 84
10.6 Assumption: Personal attitude is a factor ............................ 84
10.7 Summary of result in XC60 .................................................... 85
11 Recommendations ....................................................................... 87
12 Discussion ...................................................................................... 89
ix
12.1 Result discussion .................................................................... 89
12.2 Method and process discussion ........................................... 92
12.3 Lessons learned .................................................................... 95
13 Conclusion .................................................................................... 97
14 References .................................................................................... 99
14.1 Literature ............................................................................... 99
14.2 Oral resources ...................................................................... 100
15 Appendix...................................................................................... 101

10
11
1 Introduction
In the future, Volvo Car Corporation’s (VCC)1 market share in Asia will
increase meanwhile body measures such as height and weight will
continue to increase in Europe and USA leading to a wider span in user
anthropometrics. To make it possible to develop cars for this wider
range of drivers it is necessary to evaluate and understand how and why
drivers are positioned the way they are. With information about
reference points of the driver such as H-point2 and eye point3 validation
and verification can be done of human modelling programs such as
RAMSIS4 where digital manikins are positioned. Making changes to a
design is more expensive the further the process has come. With the
possibility of early evaluations potential problems can be visualized and
changed before expenses go up.
A previous master thesis at VCC (Bergström and Grahn, 2003)
investigated with clinics5 if there is a difference to how people position
themselves in cars in different environments; car driven on road, car in
car park and mock-up. Their conclusion was that the seated position
differs between the environments but that control questions and
simulations to some extent reduce the difference in seat adjustments.
With Bergström and Grahn’s work as a base this master thesis was
formed. This thesis is conducted by two VESC6 students, Nadja and
Henrik (in this report referred to as ‘the team’) who has worked one
summer at VCC Ergonomics7 . The educational background is from
Chalmers University of Technology Master Programmes Industrial
Design Engineering (IDE) and Product Development (PD) with focus
on Human Factors Engineering (HFE).
Different parameters are connected to the driver’s seating position,
such as the primary controls (steering wheel, gear shift, pedals) and also
the field of sight, comfort, manoeuvring and ability to reach other
functions. VCC Ergonomics expected that the seated positioning in
cars can depend on body measures, personal preferences and type of
1 Volvo Car Corporation will hereafter be shortened VCC 2 H-point, see glossary on page v 3 Eye point, see glossary on page v 4 RAMSIS, see glossary v 5 Clinic, see glossary on page v 6 VESC, Volvo Engineering Student Concept, see glossary on page v 7 Department 91320 Craftsmanship and Ergonomics will be referred to
as VCC Ergonomics in the text.
12
car. The exact reason behind the positioning is however not known why
this master thesis aims to develop a method for finding out why and
how people sit the way they sit when driving a Volvo car.
1.1 Purpose
The purpose of this master thesis is to elicit information about how
people sit when driving and why they sit the way they do. The
information will be used for comparing car models and the different
seating options they provide as well as provide VCC Ergonomics with
information that can be used to validate and develop their computer
aided evaluations with RAMSIS. To enable seated position in RAMSIS
different tasks are set for the manikins to do and with more information
from real seated positions this method can be more exact in its
predictions of seated position.
VCC Ergonomics has measured cars to find out H-point and eye points
for manikin positioning and comparison between cars but an effective
and efficient way of doing these measurements does not exist. Earlier
measurements have been time consuming but consistent to enable
comparison. A new method is needed because a vast amount of
measurements have been done earlier and some have been irrelevant.
For more efficient comparisons a repeatable method is necessary, which
collects important data without taking too much valuable time from the
employees at VCC Ergonomics.
1.2 Goal
The goal of this master thesis is to develop a method for VCC
Ergonomics to use for finding out how and why people sit the way they
sit when driving different car models. The result from using the method
will be data to use for validation and verification of human modelling
programs, such as RAMSIS, and for comparing car models to each
other.
1.3 Vision
This master thesis should primary result in a method, which two
summer employees who have completed 4th year of a technical
13
education including ergonomics should be able to use; for gathering of
data and for executing a basic analysis of the seated positions. A
secondary goal is to deliver a result of an analysis made on the car
model Volvo XC60 with the developed method.
The method should include a description of its purpose and what is
needed in order to perform it. This involves preparation of the car,
prepare and book participants to the clinic, gathering and compilation
of data and finally an analysis of the result. The method should allow a
Seat Position Evaluation from Elicited Data, why the method hereafter
will be referred to as SPEED.
VCC Ergonomics should with the developed method be able to analyse
the driver’s positioning in all of their cars and understand how and why
people sit as they do.
1.4 Outline of thesis
In this thesis a method for evaluation of seated position is developed. A
literature study was conducted and the result from it and the initial
interviews and workshops formed assumptions regarding seated
position. The assumptions then served as a base for the development of
the method and the coming analysis of the result. Throughout the
project evaluations have been made and finally the method was used on
Volvo XC60.
In the theory chapter, chapter 2, information about SAE standards are
found with information about important points such as H-point, eye
point and heel point. Findings from previous clinics, master theses and
dissertations regarding seated positions are listed according to
categories of comfort, reachability, visual references, anthropometrics,
limitations of the car and car model. Clinics are explained in general and
for how they are conducted at VCC Ergonomics with information
about use of instructions, environment for the studies, equipment that
is used, selection of test participants and the use of questionnaires.
The Human factors process of which this thesis has been conducted is
explained in chapter 3. The different stages of the process are explained
and an adaption of the process to fit this thesis is described. The stages
of the process form the structure of this report and include needfind-
ing, assumptions, overall design, detailed design, a description of the
developed method SPEED, an evaluation of SPEED and the result
from the commissioning in Volvo XC60. Parallel throughout the
project evaluations and documentations are made.
14
In chapter 4 the needs of primary and secondary users are noted and
delimitations for the thesis are listed. The primary users are employees
at VCC Ergonomics that will be the test leaders for SPEED and analyse
the result. The secondary users are the test participants that will attend
the clinics. Important needs from VCC Ergonomics are that the time
for completion of SPEED is 160 man hours or less and that each test
participant will finish their participation in 45 minutes. Another need is
that the method elicits information about SAE points for each test
participant. The delimitations concern type of car, programs that are to
be used and the level of detail for the instructions.
Assumptions regarding what affect the seated position and possible
ways of measuring the impact of the different factors on the seated
positions are described in chapter 5. The assumptions are sorted into
categories of comfort, reachability, visual references, anthropometrics,
limitations of the car and personal attitude.
The overall design of the developed method SPEED is described in
chapter 6. In this chapter the evaluation of concepts and the evaluation
approach is described, the test approach with the early conditions for
SPEED is set out and means for standardisation is listed. SPEED is
divided into three parts; preparation, clinic and analysis. The clinic shall
be performed while driving and objective measurements, subjective
questions and observation of behaviour will elicit information regarding
how and why people sit the way they sit when driving.
More detailed information about the testing of different potential
methods and tools are described in chapter 7. This chapter describes
how to elicit information about H-point position and back inclination
from the car’s computer system and CATIA drawings. It is described
how to retrieve eye point position, steering wheel position and distance
between head and neckrest, through the use of GoPro cameras,
Photoshop and pixel analysis as well as how to retrieve information
about heel point position. Further on this chapter describes the
selection of test participants and the three stature groups that were
formed, how the questionnaire was formed and how the analysis was
divided.
In chapter 8 SPEED is described in short bullet points concerning
preparation, clinic and analysis.
An evaluation of SPEED can be found in chapter 9. The time used for
the method as a whole and for each test participant, the usability of the
instructions, the equipment that has been used and the quality of the
result and found connections have been evaluated.

15
The result from using the method in Volvo XC60 can be found in
chapter 10 where the result is divided into the assumption categories as
well answering the questions of how and why. Scores and priorities for
different parameters in the car are shown in tables divided into the
three stature groups and diagrams of H-point, eye point and heel point
position is shown.
Finally the thesis is discussed in chapter 11 regarding result, design and
the quality of the elicited data as well as the process of developing the
method SPEED.

16
17
2 Theory
In this chapter information about SAE standards are explained with
information about important points such as H-point, eye point and heel
point. Findings from previous clinics, master theses and dissertations
regarding seated positions are listed according to categories of comfort,
reachability, visual references, anthropometrics, limitations of the car
and car model. Clinics are explained in general and for how they are
conducted at VCC Ergonomics with information about use of
instructions, environment for the studies, equipment that is used,
selection of test participants and the use of questionnaires.
The theory used for this work regards existing automotive standards,
SAE standards, and previous research regarding driving position, how
to perform a clinic (user study) and how this is utilized at VCC
Ergonomics.
2.1 SAE Standards
The automotive industry uses certain standards when developing and
designing cars due to laws and requirements that have to be fulfilled.
Ghikas (2013) describes The society of Automotive Engineers International
(SAE) as an organisation that develops standards for engineering
industries such as the aerospace, automotive and commercial vehicle
industry. It provides over 1600 standards relating to the design of cars,
where a number of ergonomic standards useful for occupant packaging8
are included. These standards are recommendations for the initial
package and must be remade with human evaluations in the actual
architecture and for the preferred market. Especially since the SAE
standards are more applicable to the U.S. population (Ghikas, 2013).
With help of standards that normally are used for the automotive
industry, e.g. the H-point (SAE J826), The Driver’s Eye Range (SAE
J941), Driver and Passenger Head Position (SAE J1052), it is possible
to develop vehicle seating packages that describe levels of accommoda-
tion (90, 95 and 99 per cent) (Peacock, 1993). The standards of higher
importance for VCC when creating the occupant packaging are H-point
(SAE J826), eye point and eyellipse (SAE J941).
8 Occupant packaging, see glossary on page v
18
2.1.1 H-point (SAE J826)
The H-point is the point on the human body that work as a pivot
centre of the torso and thigh (Peacock, 1993). The point provides a
landmark showing where people sit in the seat. The H-point is created
by using an H-point manikin with the weight of a 50th percentile male
and the length of 95th percentile male legs. By using this manikin a
reliable design reference point can be established that takes the
deflection of the seat into account. When the physical manikin is
positioned in the car it makes it possible to locate the H-point relative
the physical seat and also to relate the physical seat with a virtual
geometry. Because of the adjustable seat the H-point can have a
number of different positions and the extremes of these are creating the
seat movement envelope. To have one consistent reference point for
occupant packaging, one specific design H-point is selected and called
the seating reference point (SgRP) (Ghikas, 2013), see Figure 2.1.
SgRP
SgRP is a specific H-point used for definition and description of both
the occupant package and the vehicle dimension, leading to that many
factors related to occupant and requirements refers to the SgRP
(Ghikas, 2013). Since SgRP makes the relationship between the physical
and virtual environment possible it also provides a consistent method
for comparisons between the company’s own cars and competitors’
cars.
2.1.2 Eye point and eyellipse (SAE J941)
Locations of eye points are represented with the use of eyellipses, which
help forming the vehicle’s architecture ensuring that the driver has a
sufficient visual field (Ghikas, 2013). Eyeellipses are outer limits of
envelopes that are formed in both side and plan view by an infinite
number of planes dividing the eye positions, leading to P per cent are
on one side and 100-P per cent are on the other side, see Figure 2.2.
Since the data is normally distributed this results in ellipses by statistical
definition. Each individual plane represents accommodation for the
selected 99 or 95 per cent of the users. A proper application of the
eyellipse includes drawing sight lines from the eyellipse to points of
interest according to a vision task. Using this procedure ensures the car
being configured to ensure that 99 (or 95 per cent depending on which
eyellipse is employed) per cent of the drivers will be accommodated
(Peacock, 1993).
2.1.3 Heel point (SAE J1517)
The accelerator heel point is the lowest point at the intersection of the
manikin heel and the depressed floor covering with the shoe on the
19
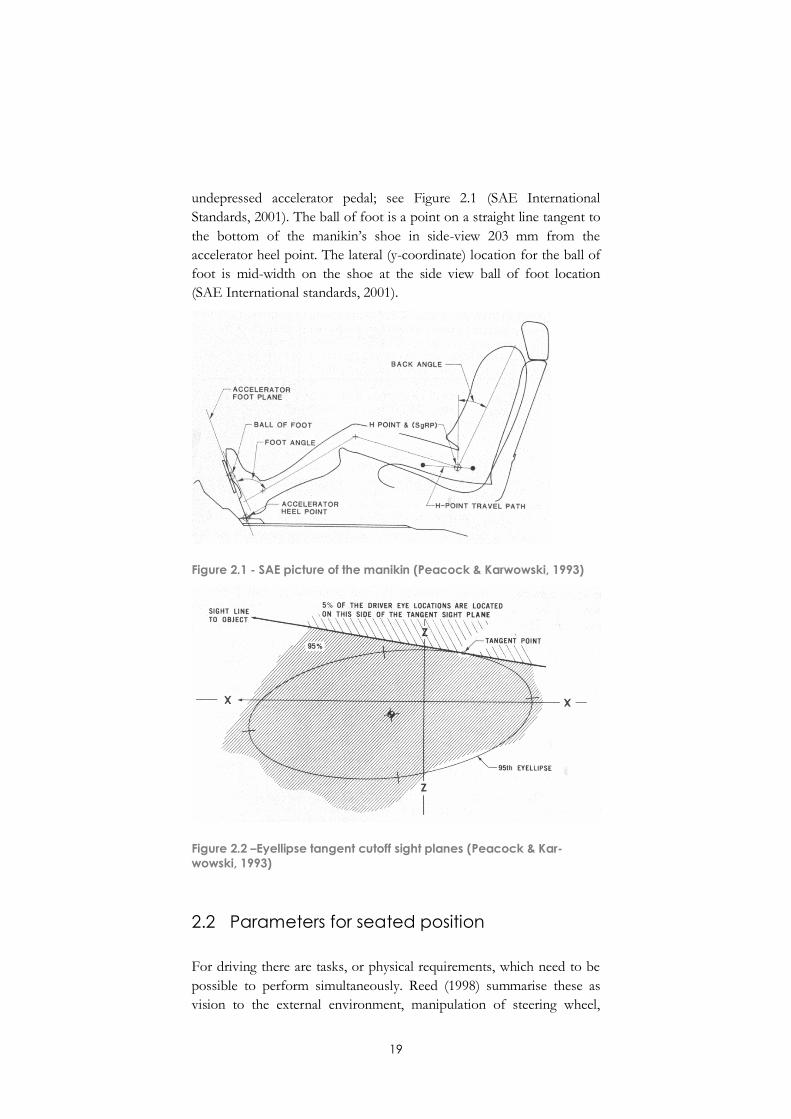
undepressed accelerator pedal; see Figure 2.1 (SAE International
Standards, 2001). The ball of foot is a point on a straight line tangent to
the bottom of the manikin’s shoe in side-view 203 mm from the
accelerator heel point. The lateral (y-coordinate) location for the ball of
foot is mid-width on the shoe at the side view ball of foot location
(SAE International standards, 2001).
Figure 2.1 - SAE picture of the manikin (Peacock & Karwowski, 1993)
Figure 2.2 –Eyellipse tangent cutoff sight planes (Peacock & Kar-
wowski, 1993)
2.2 Parameters for seated position
For driving there are tasks, or physical requirements, which need to be
possible to perform simultaneously. Reed (1998) summarise these as
vision to the external environment, manipulation of steering wheel,
20
manipulation of pedal controls, vision to internal displays and
manipulation of shifters and other hand controls. These factors can be
considered as comfort, reachability, visual references, anthropometry
and limitations of the car.
2.2.1 Comfort
Earlier clinics VCC Ergonomics have indicated that comfort is a factor
for seated position, often in combination with limitations of the car.
Test participants in earlier seated position clinics were asked to rank the
importance of vision, reachability, roominess and personal attitude in
the context of seat comfort. Very tall or very short people can for
example experience discomfort regarding leg roominess, which could be
compensated through adjustments of the seat into a different position
than what would be ideal. There have also been situations where test
participants have adjusted the seat to a position not optimal for them
because of the seat belt chafing their neck 9 . According to Ghikas
(2013), a comfortable driving position is when primary and secondary
controls can be reached and operated comfortably, displays are easily
seen and when the all-round vision out of the vehicle is good.
2.2.2 Reachability
Test participants in earlier seated position clinics by VCC Ergonomics
were asked to rank the importance of reach of primary controls such as
pedals, steering wheel, controls and gear shift. The reachability to the
pedals was said to be the most important factor for seated position.
Bhise (2012) supports the theory about reachability being important
when the occupant packaging is developed.
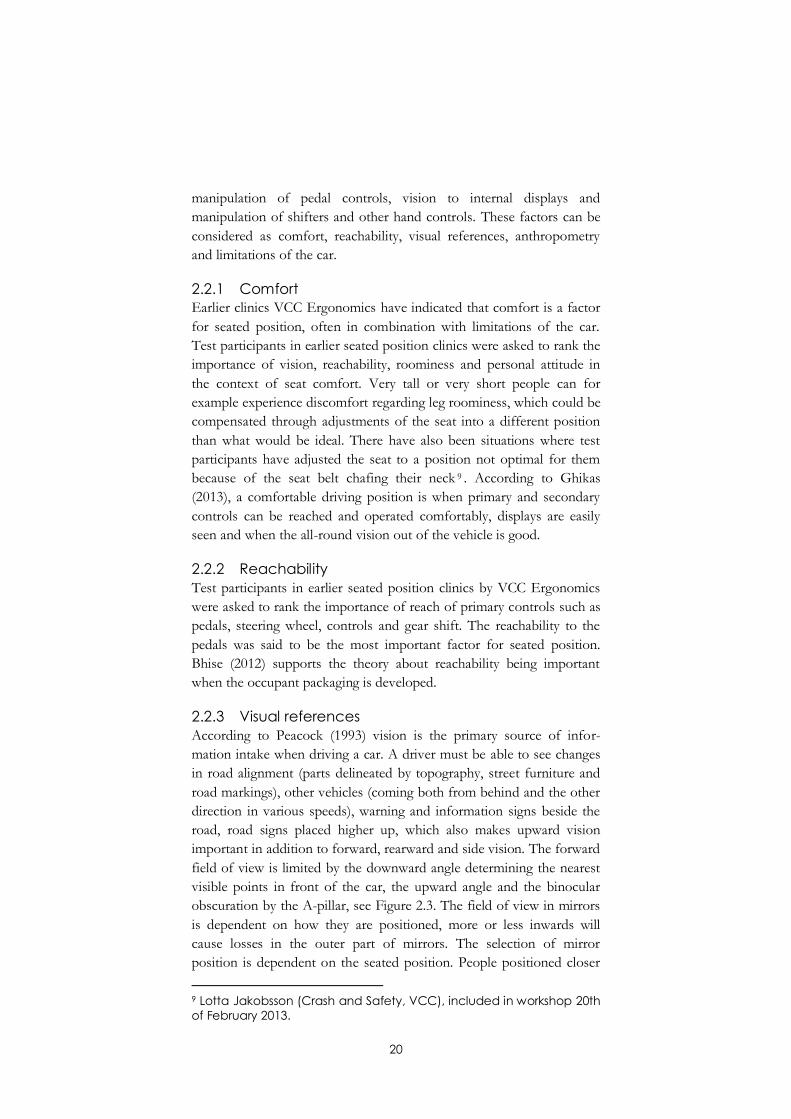
2.2.3 Visual references
According to Peacock (1993) vision is the primary source of infor-
mation intake when driving a car. A driver must be able to see changes
in road alignment (parts delineated by topography, street furniture and
road markings), other vehicles (coming both from behind and the other
direction in various speeds), warning and information signs beside the
road, road signs placed higher up, which also makes upward vision
important in addition to forward, rearward and side vision. The forward
field of view is limited by the downward angle determining the nearest
visible points in front of the car, the upward angle and the binocular
obscuration by the A-pillar, see Figure 2.3. The field of view in mirrors
is dependent on how they are positioned, more or less inwards will
cause losses in the outer part of mirrors. The selection of mirror
position is dependent on the seated position. People positioned closer
9 Lotta Jakobsson (Crash and Safety, VCC), included in workshop 20th
of February 2013.
21
to the windshield will turn the mirrors more inward which leads to a
higher loss of sight.
Figure 2.3 - Specification of the driver’s forward field of view (Peacock
and Karwowski, 1993)
2.2.4 Anthropometrics
Many SAE-standards are based on anthropometry10 and is considered
when designing and evaluating cars. According to a study performed by
Park et al. (2000), short people prefer to sit closer to the steering wheel
compared to tall people. The result of the study also implies that shorter
people preferred to heighten the bottom cushion to get a better vision
and for easier handling of the steering wheel. From analysing earlier
seated position clinics by VCC Ergonomics it can be strengthened that
shorter people choose to position themselves more forward and
upward towards the windshield. Earlier clinics also show that the field
of view is dependent on eye location, which is dependent on the
selected seat position which in its turn is dependent on the stature
height.
According to Jangwoon Park (2013), female drivers move their upper
body towards the steering wheel because of their shorter arm-length.
Females, who also have a shorter sitting height, therefore moves the
upper body towards the steering wheel to get enough view angle. Park’s
research also showed that men have a tendency to sit more inclined and
women sit more erect and that men have their knees more bent than
women. This could be because the women used in their studies were
the shortest and no men had the same stature height as the women.
According to Jonsson (2009) who has investigated seated positions,
there are no connections between men and women that have the same
stature.
In another study the limited connection between gender and seated
position is supported by Matthew Reed (1998). In his tests a difference
was seen between men and women’s back inclination; however the hip-
to-eye angles were not significantly different between men and women.
10 Anthropometrics, see glossary on page v
22
It should also be noted that there has been no overlap between the
groups in stature or other anthropometric variables. Therefore it cannot
be determined whether the differences are because of gender or if it is
because of the anthropometric differences. Reed continues by saying
that results implying differences between genders can rather be
attributed to anthropometric differences.
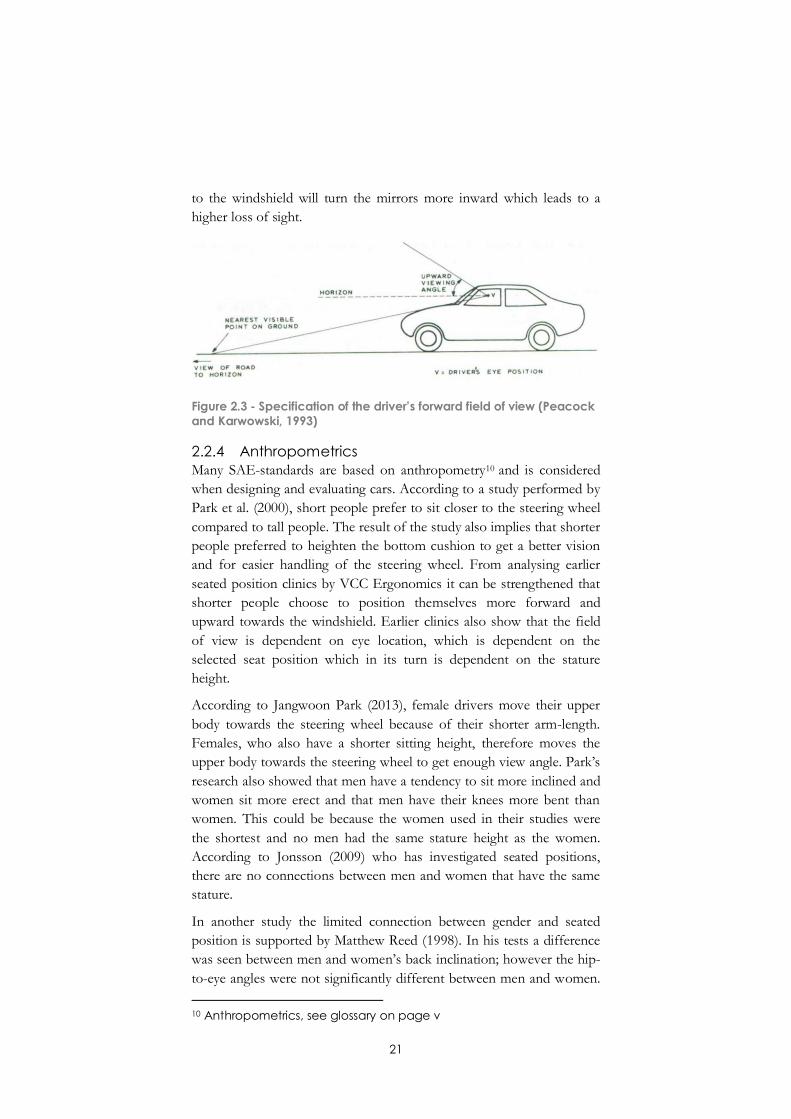
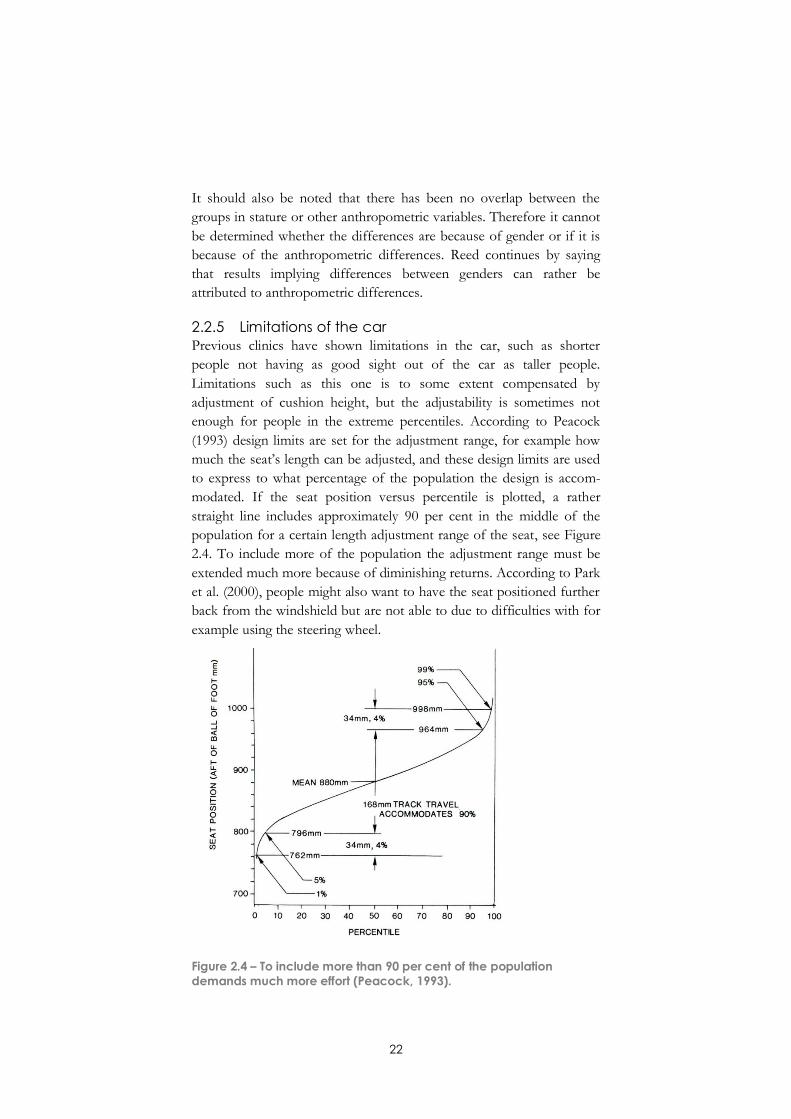
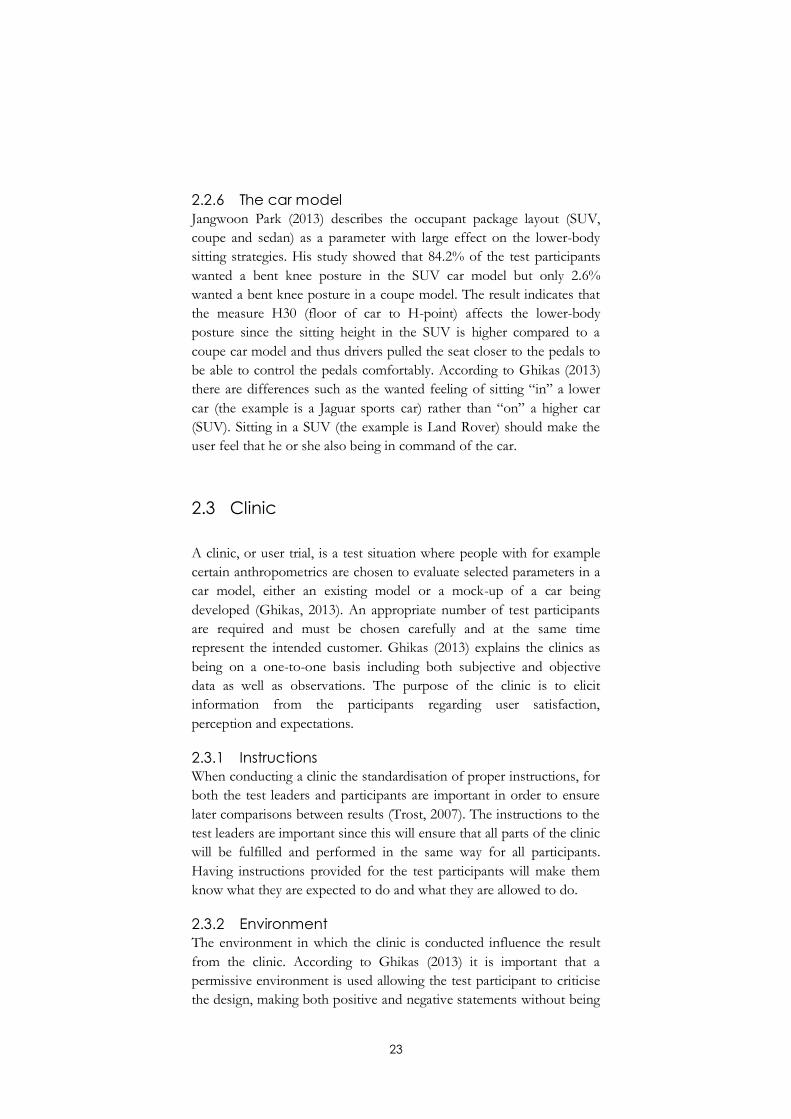
2.2.5 Limitations of the car
Previous clinics have shown limitations in the car, such as shorter
people not having as good sight out of the car as taller people.
Limitations such as this one is to some extent compensated by
adjustment of cushion height, but the adjustability is sometimes not
enough for people in the extreme percentiles. According to Peacock
(1993) design limits are set for the adjustment range, for example how
much the seat’s length can be adjusted, and these design limits are used
to express to what percentage of the population the design is accom-
modated. If the seat position versus percentile is plotted, a rather
straight line includes approximately 90 per cent in the middle of the
population for a certain length adjustment range of the seat, see Figure
2.4. To include more of the population the adjustment range must be
extended much more because of diminishing returns. According to Park
et al. (2000), people might also want to have the seat positioned further
back from the windshield but are not able to due to difficulties with for
example using the steering wheel.
Figure 2.4 – To include more than 90 per cent of the population
demands much more effort (Peacock, 1993).
23
2.2.6 The car model
Jangwoon Park (2013) describes the occupant package layout (SUV,
coupe and sedan) as a parameter with large effect on the lower-body
sitting strategies. His study showed that 84.2% of the test participants
wanted a bent knee posture in the SUV car model but only 2.6%
wanted a bent knee posture in a coupe model. The result indicates that
the measure H30 (floor of car to H-point) affects the lower-body
posture since the sitting height in the SUV is higher compared to a
coupe car model and thus drivers pulled the seat closer to the pedals to
be able to control the pedals comfortably. According to Ghikas (2013)
there are differences such as the wanted feeling of sitting “in” a lower
car (the example is a Jaguar sports car) rather than “on” a higher car
(SUV). Sitting in a SUV (the example is Land Rover) should make the
user feel that he or she also being in command of the car.
2.3 Clinic
A clinic, or user trial, is a test situation where people with for example
certain anthropometrics are chosen to evaluate selected parameters in a
car model, either an existing model or a mock-up of a car being
developed (Ghikas, 2013). An appropriate number of test participants
are required and must be chosen carefully and at the same time
represent the intended customer. Ghikas (2013) explains the clinics as
being on a one-to-one basis including both subjective and objective
data as well as observations. The purpose of the clinic is to elicit
information from the participants regarding user satisfaction,
perception and expectations.
2.3.1 Instructions
When conducting a clinic the standardisation of proper instructions, for
both the test leaders and participants are important in order to ensure
later comparisons between results (Trost, 2007). The instructions to the
test leaders are important since this will ensure that all parts of the clinic
will be fulfilled and performed in the same way for all participants.
Having instructions provided for the test participants will make them
know what they are expected to do and what they are allowed to do.
2.3.2 Environment
The environment in which the clinic is conducted influence the result
from the clinic. According to Ghikas (2013) it is important that a
permissive environment is used allowing the test participant to criticise
the design, making both positive and negative statements without being
24
judged by the experimenter. Bergström and Grahn (2003) showed in
their thesis that there is a difference to how people position themselves
in cars depending on if they drive or if they are parked. Therefore a
clinic that aims for deciding a seated position should be performed
while driving for best precision.
2.3.3 Equipment
The equipment used in the clinic depends on what is evaluated; it varies
between just questionnaires to advanced cameras tracking a test
participant’s movements. Some types of evaluations require the car to
be measured, to get all data of the car in use, to compare the measure-
ments with nominal data from drawings.
Using photographs for evaluation of seated positions is a valid and
reliable indicator of the underlying spine (Niekerk et al, 2008). A study
made of 39 high school students show that photographs proved to be
accurate in angle compared with the radiographs made simultaneously
of a seated position. In the study they used retro-reflective markers on
certain anatomical points, which were used to calculate the sagittal head
angle, the cervical angle, the protraction/retraction shoulder angle, the
arm angle and the thoracic angle. The results from the study indicated
that relevant data could be collected from one photograph only to
provide an accurate representation of the spinal posture for that
individual.
2.3.4 Test participants
To accommodate a large population and to be user centred is difficult
and the manufacturer needs to consider different parameters of their
users, included in the anthropometrics. The users, called test partici-
pants, will have their anthropometrics measured making it possible to
understand the human variation and provide guidance for the
ergonomic evaluations and design (Ghikas, 2013). Depending on what
is evaluated different test participants are chosen to participate, often
the extreme percentiles from short female to tall male, this to ensure
that the car fits everyone.
2.3.5 Questionnaire
The question formulation in a questionnaire is important in order to
retrieve the desired information. How to create a questionnaire is
described in Enkätboken (Trost, 2007). The questions in a questionnaire
should be easily understood; negations, complicated words and leading
questions should be avoided and questions relating to the same area
should be clustered together. There should be just one question per
question to avoid confusion; ranking of different parameters should be
done separately on a scale and not in comparison to each other. Open
25
questions are difficult to compare to each other but offer qualitative
data. The questionnaire should have an open question at the end for the
test participant to speak his/her mind.
Standardisation of questions and tasks are important for the possibility
of comparing the results. Subjective scales can only be validated for
intra-personal comparisons (Coehlo and Dahlman, 2000) why the
objective measurements are a necessary complement to subjective
answers from test participants.
2.4 Seated position clinics at VCC Ergonomics
Seated position clinics at VCC Ergonomics are conducted by one or
two test leaders. When VCC Ergonomics use this type of evaluation,
they select test participants from Testkliniklistan 11 , a list of people
working at VCC whose anthropometrics have been measured. The
clinic is prepared with subjective questions, observation of behaviour
and objective measurements. It is documented with photos and written
answers and the collected data is compiled and potential statistic
connections are established.
2.4.1 Test participants
The test participants in VCC Ergonomics’ clinics are chosen from
Testkliniklistan, The anthropometrics of each person is noted before the
clinic and can therefore be used for analysis of the result. The test
participants are selected based on percentiles of height and represent
both men and women. Measures such as leg length and arm length may
come to be analysed in a later stage. Earlier clinics have had 60 test
participants, where 20 have been < 20%ile women, 20 between 35%ile
women - 85%ile men and the last 20 have been > 90%ile men. The
number of test participants has been chosen by experience from
previous clinics and because the result becomes statistically good
enough with that amount of people.
2.4.2 Instructions
Initial instructions to test participants regarding location, conditions and
time are sent via e-mail. Instructions to what to do during the clinic are
told by a test leader.
11 Testkliniklistan, see glossary on page v
26
2.4.3 Environment
Seated position clinics are performed while driving. All test participants
drive the same route and stop the car four times. Then the test leader
reset the seat to the starting position and the test participant set it in a
comfortable position.
2.4.4 Equipment
Before a seated position clinic the car is measured by the Crash Test
Preparation at VCC, especially certain points of interest, such as seat
height, the seat adjustment area, steering wheel and hood in order to
establish a coordinate system to compare with the CAD drawings of the
car. Information about the seat settings for a power driven seat is
retrieved from the CAN bus12.
To retrieve H-point values from the information from the CAN bus
VCC has calculated a formula, which takes two inflexible points on the
seat and creates a triangle with the H-point being the third point. This is
not time efficient due to a lot of measuring needs to be done and VCC
Ergonomics are not satisfied with this method. To elicit the back
inclination of the seat, information is read from the CAN-bus and then
translated into a degree of inclination. The result of this measuring is
presented as numbers, which is difficult to understand due to lack of
references, such as the extreme positions.
To measure where the steering wheel is positioned, the steering wheel
has been equipped with two measuring tapes on the side, in x- and z-
direction. These measuring tapes gives measures that later are put in a
formula created by the VCC Ergonomics department. This formula
then recalculates these two measures to coordinates in x- and z-
direction. When the team looked into data from previous seated
position clinics, it was difficult to follow how the data was elicited,
which lead to problems understanding what had been done and for
comparing the results.
A camera was used to locate eye location and the inclination of the
back. The camera was always put in a position at the passenger seat to
the right of the driver, giving a profile picture of the driver. Different
cameras have been used and for each new setup a remote control
program or hardware is needed. A problem with the camera equipment
is that it is old and not gives photographs of high quality. Therefore a
new setup needs to be configured.
12 CAN bus, see glossary on page v
27
For extraction of eye points from photos Photoshop13 analysis has been
used. During the measurement of the car photos of a square have been
taken and its position been measured in many positions. These photos
have then been combined in Photoshop and equations been made for
coordinate extraction after pixel analysis.
For analysis of results CATIA, Excel 14 and Photoshop are used.
Questionnaires and questions are printed and filled out together with
test participant and the test leader.
2.4.5 Questionnaire
In earlier seated position clinics subjective data was gathered through
questionnaires where the test participants were asked to rate different
features, some of them were to be compared and rated with each other.
Both the team’s earlier experiences and theory according to Enkätboken
(Trost, 2007), proved this to not be a good way and a way of hinder test
participants to value different parameters equally. The test participants
were also asked yes or no questions as well as open questions, which
was combined with parameters for the test leader to observe.
2.5 Summary of theory
For evaluating seated position SAE points such as H-point, heel point
and eye point are important to establish. Findings from previous clinics,
master theses and dissertations regarding seated positions have been
listed according to categories of comfort, reachability, visual references,
anthropometrics, limitations of the car and car model and serve as base
for coming assumptions, found in chapter 5. Literature has shown the
importance of detailed instructions to enable standardisation. The basic
structure of clinics at VCC Ergonomics serves as base for the
development for SPEED with instructions, environment, test
participants and questionnaire.
13 Photoshop, see glossary on page v 14 Excel, see glossary on page v

28
29
3 Process/method
The Human factors process of which this thesis has been conducted is
explained in this chapter. The different stages of the process are
explained and an adaption of the process to fit this thesis is described.
The stages of the process form the structure of this report and include
needfinding, assumptions, overall design, detailed design, a description
of the developed method SPEED, an evaluation of SPEED and the
result from the commissioning in Volvo XC60. Parallel throughout the
project evaluations and documentations are made.
For the development of SPEED an iterative process based on the
developing process of human machine systems as described by Bligård
(2011) was used. The process is used within Human Factors Engineer-
ing (HFE) for designing effective machines to suit human needs and
abilities. The team consider this process suitable for developing and
designing the method for VCC because of the needs for an easy to
understand usage for beginner users. The team also uses this process
with the reason that it is thought to help going through the work
thoroughly and finding potential problems early in the process.
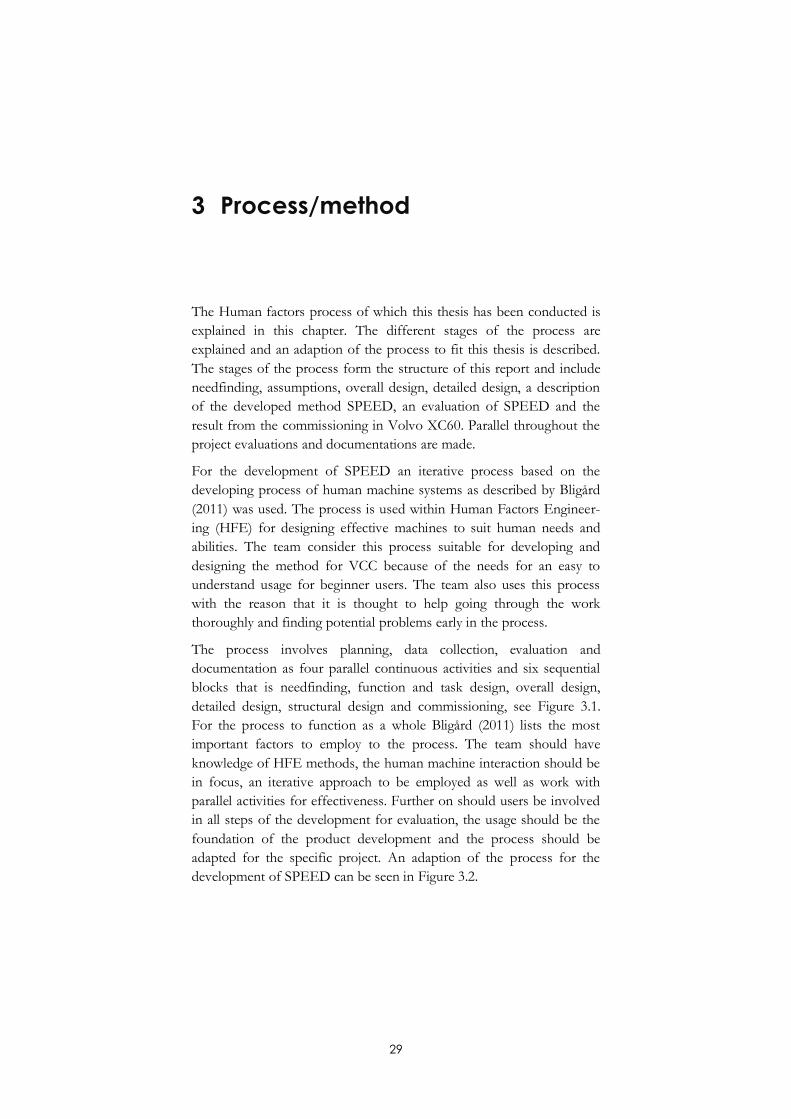
The process involves planning, data collection, evaluation and
documentation as four parallel continuous activities and six sequential
blocks that is needfinding, function and task design, overall design,
detailed design, structural design and commissioning, see Figure 3.1.
For the process to function as a whole Bligård (2011) lists the most
important factors to employ to the process. The team should have
knowledge of HFE methods, the human machine interaction should be
in focus, an iterative approach to be employed as well as work with
parallel activities for effectiveness. Further on should users be involved
in all steps of the development for evaluation, the usage should be the
foundation of the product development and the process should be
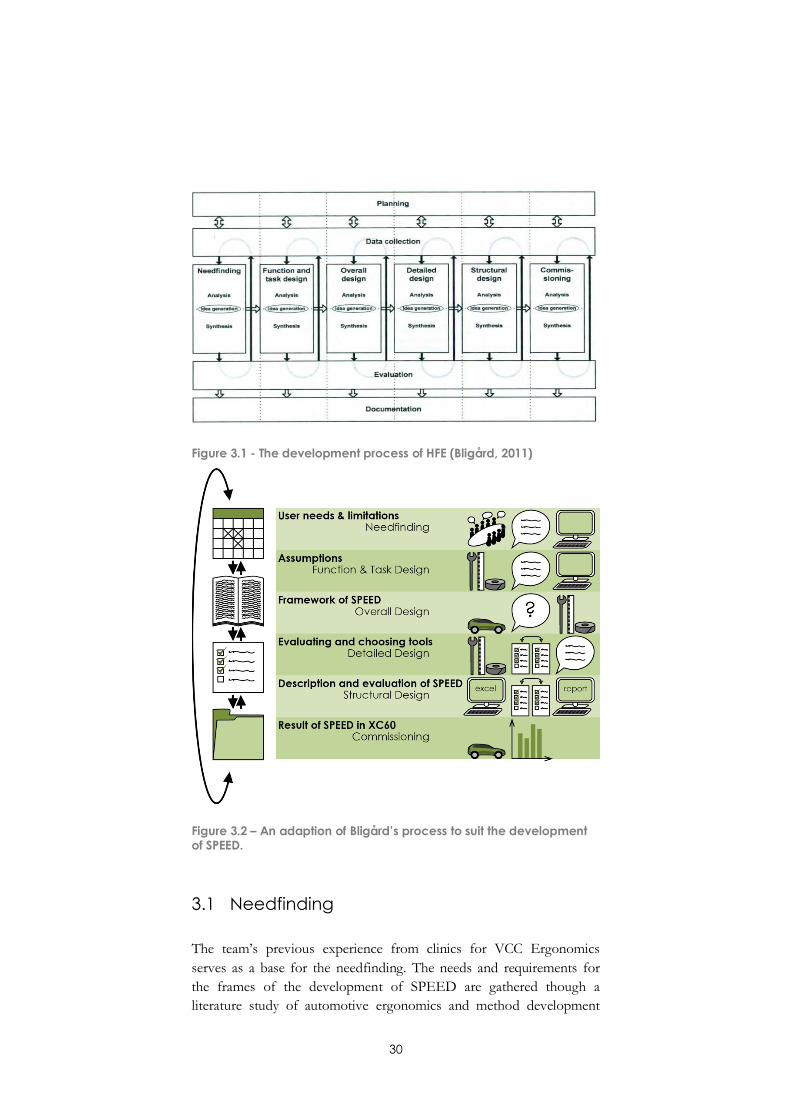
adapted for the specific project. An adaption of the process for the
development of SPEED can be seen in Figure 3.2.
30
Figure 3.1 - The development process of HFE (Bligård, 2011)
Figure 3.2 – An adaption of Bligård’s process to suit the development of SPEED.
3.1 Needfinding
The team’s previous experience from clinics for VCC Ergonomics
serves as a base for the needfinding. The needs and requirements for
the frames of the development of SPEED are gathered though a
literature study of automotive ergonomics and method development
31
including creating questionnaires. Interviews, workshops and literature
provide information about how to gather data about reference points in
the car and on the test participants.
3.2 Assumptions
Assumptions are made to allow falsifying and/or strengthen the
importance of different ideas. The assumptions derive from workshops
at VCC Ergonomics and within the team. The assumptions are
supported by theory and can be measured in different ways.
3.3 Overall design
The questions and measurements that will be used for SPEED will be
investigated early in the process and validated through evaluations with
users. This includes evaluations including deeper interviews to elicit
much data, evaluations using the actual method and comparing these to
each other. The evaluations also include letting students act as test
leaders using SPEED and provide feedback on the method. Questions
and measurements that give reliable results will be developed to a
detailed design that will be further investigated to later be developed to
the final design of the method.
3.4 Detailed design
The detailed design is based on the overall design and results from
evaluations. By investigating and evaluating different tools and the
quality of the provided data, tools and questions will be chosen for the
final design of SPEED.
3.5 Description of SPEED
From the detailed design the team combines the final result and a
summary of how SPEED is performed will be presented in this section.
The chapter highlights the main parts, all from the process of booking
the car to when the result is analysed.
32
3.6 Evaluation of SPEED
The method will be performed on one car model for this work and the
team will afterwards compile a result describing how well SPEED
worked. The result will give an answer to whether the team’s assump-
tions were correct. Analysis of the data will provide the team with
information regarding whether all questions asked are necessary and if
they provide the information that the team want to elicit. Method
evaluations are done in smaller scale during the overall design but when
performing the evaluation in larger scale the team can get more
information about how the method works and recommendations for
future work can be compiled.
3.7 Result of SPEED in XC60
The clinic included in the method will be performed during two weeks
with several Volvo employees as test participants. During this clinic the
team members will act as test leaders and follow the instructions which
are included in the method.
After the commissioning of SPEED the outcome is to be analysed,
giving answers about the specific car used in the work, and the
correlations that were found between the car, test participants and the
seated position.
33
4 Needfinding
In this chapter the needs of primary and secondary users are noted and
delimitations for the thesis are listed. The primary users are employees
at VCC Ergonomics that will be the test leaders for SPEED and analyse
the result. The secondary users are the test participants that will attend
the clinics. Important needs from VCC Ergonomics are that the time
for completion of SPEED is 160 man hours or less and that each test
participant will finish their participation in 45 minutes. Another need is
that the method elicits information about SAE points for each test
participant. The delimitations concern type of car, programs that are to
be used and the level of detail for the instructions.
For SPEED there are different user groups and stakeholders. The main
users are people working at VCC Ergonomics who will use SPEED,
acting as test leaders in the clinic and performing the basic analysis. This
includes both summer employees and people employed at the
department. Secondary users are test participants attending the clinics.
The stakeholders are VCC Ergonomics who invest in this work.
Another department at VCC with interests in the result of the method
and their needs are listed in chapter 4.3.
4.1 User needs
It should be easy and intuitive to use the method SPEED. Previous
clinics have shown that these evaluations can be difficult to compare
and understand. Therefore it is needed to standardise and have
explanations of the whole method structure; all equipment and
questions. Another reason for having a high level of standardisation is
to deliver the same result independent of who is using SPEED.
Instructions should be provided to ensure that future users are able to
understand completely how the method is built up and what is needed
to change it and how this could done. Due to short preparation time it
should be a short learning curve and difficult to do wrong.
It is important that the instructions regarding the method’s structure, all
measurements and questions are adapted to the knowledge that the
main users possess.
34
4.2 VCC Ergonomics’ needs
For VCC Ergonomics it is also important to provide instructions of
what needs to be done. Some parts included in the method have to be
prepared and booked before the summer employees arrive. The
equipment is being bookable for anyone at VCC and certain equipment
is more popular and rare than other.
To understand where people sit in the car information regarding H-
point, eye point, heel point and a point describing the steering wheel
position needs to be in the result. VCC Ergonomics also want to know
why people sit the way they do, which leads to a need of retrieving
qualitative data from test participants regarding their position. This data
need to contain subjective thoughts of different parameters in the car,
how these affect the test participant when deciding position and how
well they are in the car used in the clinic. Subjective thoughts about the
seated position; if it is comfortable, if there are limitations in the
positioning, how easy a comfortable position is found should be
elicited. VCC Ergonomics want to use this information for setting their
future requirements.
VCC Ergonomics has expressed the need of using test participants
from Testkliniklistan and that short, medium stature and tall people
should be represented. This to ensure that conclusions can be made
regarding peoples’ stature. To enable test participants to participate in
the clinic, VCC Ergonomics stated a need regarding the time used for
the clinic to be maximum 45 minutes. Due to economics and time
available for clinics, VCC Ergonomics has a need for a time constraint
for the whole method of 160 man hours.
4.3 Further external needs
Another department interested in the method is the VCC Crash and
Safety department that expressed a need of having a camera filming the
clinic. This was due to their interest in finding out why people sit the
way they do in different traffic situations, and the need to see changes
in the drivers’ position over time. VCC Crash and Safety also expressed
needs regarding the headrest, to find out if it is used, if people want to
use it and the distance between the driver’s head and headrest.
35
4.4 Delimitations
The team has together with VCC Ergonomics set frames and
delimitations for this project, which have to be considered:
When SPEED is developed and used in this work it will con-
sider one car model, Volvo XC60, with automated gearbox and
a motorized seat.
SPEED shall be possible to apply to all Volvo’s car models.
The tools required for the development of the method and
using it should be available for VCC’s Ergonomics department.
SPEED shall later be possible to use by summer employees,
master students who have completed the 4th year of their edu-
cation at university and have knowledge about mathematics
and ergonomics.
SPEED will require knowledge of Microsoft Excel and
CATIA.
Test participants for the clinic will be taken from Testkliniklistan
provided by VCC Ergonomics.
SPEED shall not require intervention on the car.
The instructions and the questions posed within SPEED will
be in Swedish.
SPEED will not consider the seat’s lumbar support.

36
37
5 Assumptions
Assumptions regarding what affect the seated position and possible
ways of measuring the impact of the different factors on the seated
positions are described in this chapter. The assumptions are sorted into
categories of comfort, reachability, visual references, anthropometrics,
limitations of the car and personal attitude.
From the results of the literature study and the workshops held at VCC
Ergonomics, assumptions regarding seated position were made. The
assumptions and how to measure them are listed below. The team
assumes that seated positions depend on comfort, reachability, visual
references, anthropometrics, limitations of the car and personal attitude.
Some of these have been investigated by VCC Ergonomics and are
considered important to include in this type of evaluations. Other
assumptions are built on theory and previous experience. Earlier
evaluations of seated position have contributed with basic assumptions
that form the base for the following assumptions. There is a comfort
zone in which an individual can sit comfortably; the starting position of
the steering wheel has effects on how the seat is positioned and the
seated position depends on the car model.
The assumptions will be the base during the analysis and evaluation of
the results, both results of SPEED itself and the result when using it in
Volvo XC60.
5.1 Assumption: Comfort is a factor
1) How one experiences comfort regarding some or all of
the following influence the seated position: foot support,
arm rest, seat belt, leg roominess and neck rest.
5.1.1 How to measure
The measurement of comfort can be investigated through interviews
with subjective questions and through a ranking list, where the test
participant can rank the importance of the different factors separately in
a questionnaire.
Keywords: Questionnaire
38
5.2 Assumption: Reachability is a factor
2) The reachability to functions such as pedals, steering
wheel and controls, affect the seated position.
5.2.1 How to measure
The importance of reachability to certain functions can be measured
through a ranking list in a questionnaire. By using the same setting of
the seat and steering wheel one can see if people set the seat in the same
position every time if they perform multiple settings. The heel point
position could be retrieved by taking photos of the feet.
As explained in chapter 2.4.4 the steering wheel can be calculated by
using measuring tapes. Another method could be to use photographs to
locate the position of the steering wheel.
5.3 Assumption: Visual references are a factor
3) The visual references outside the car, hood height, lanes,
traffic and mirrors affect the seated position.
4) Visual references inside the car such as windshield, rear-
view mirror and dashboard affect the seated position.
5.3.1 How to measure
The importance of different visual references can be measured through
a ranking list in a questionnaire. Photographs can be taken continuously
when driving for comparison of potential differences in postures for
varied driving. For analysis in CATIA the establishment of eye points
are important.
An eye tracking15 device can be used for analysing the eye movements
of the test participants when doing the settings for the seat and steering
wheel. Unconscious priorities regarding visual references can be spotted
if the device is configured. At a workshop held with VCC Crash and
Safety (workshop 20th of February 2013) it was said, that if correctly
calibrated it would be possible to establish eye points with the eye
tracking device.
15 Eye tracking, see glossary on page v
Keywords: Photographs, questionnaire, measure steering wheel

39
The eye points can also be retrieved by taking photos from the side and
extract the coordinates after analysis in Photoshop.
To get more information regarding visual references a varied drive
route can be used, including both small and big roads as well as
crossings and roundabouts. Standardisation of the instructions and the
drive route, with for example GPS, minimise the influence of the driver.
5.4 Assumption: Anthropometrics is a factor
5) The seated position varies between people with different
anthropometric measurements.
5.4.1 How to measure
To measure the importance of anthropometrics all test participants
have had their anthropometrics measured prior to the clinic, according
to conventional static measurements because of the repeatability they
allow. Analysis of the settings of the seat and steering wheel as well as
eye point, heel point and H-point compared to the anthropometrics
would show if anthropometrics is a factor to the seated position.
The settings of the seat can be measured manually with a ruler or by
retrieving information from the CAN bus in the car by connecting a
computer and measuring equipment. The connection to the CAN bus
enables that motor activity from the seat can be elicited from the car.
As described in chapter 2.1.1 the SAE way of deciding the H-point is by
using a manikin. Based on the SAE method, an H-point can be
referenced to the seat and an estimated H-point for a driver can
therefore be retrieved by knowing the position of the driver’s seat. The
position of the seat can be measured in the physical car, be compared
with the seat in CATIA and after the comparison seat motor activity
can be translated to an H-point.
Keywords: Eye tracking, questionnaire, photographs, Photoshop, CATIA,
drive route, GPS
Keywords: Measure seat settings, DiCE, CAN bus, analysis, and
anthropometric analysis.
40
5.5 Assumption: Limitations of the car is a factor
6) Limitations of the car such as sight considering A-pillars,
hood height and roof height affect the seated position.
7) The adjustment range of the seat and steering wheel af-
fect the seat adjustment.
5.5.1 How to measure
The importance of different limitations can be elicited through a
questionnaire. Questions about how the test participant would sit if
adjusting the seat differently can give indications to whether they would
prefer to sit differently than they do and if the adjustment range is
sufficient. Eye tracking can be used to visualise what the test partici-
pants look at and for how long, when setting the seat and steering
wheel as well as for driving.
According to Reed (1998) the steering wheel position is very important
as by moving it forward by 100 mm the response is to move the seat
forward with about 45 mm, accounting for half of the change in
steering wheel position. To reduce the potential effects of the steering
wheel position on the settings, the steering wheel should be placed in
the middle of its adjustment range before each setting.
If the back and the backrest are measured the correlation between the
inclination of the backrest and the actual back inclination can be
analysed. Information about inclination of the backrest can be retrieved
from the CAN bus or, if precision is not prioritised, by using a digital
inclination meter. A way of measuring back inclination is by taking
photographs in the same angle for all participants and analyse them in
Photoshop with references, for example the shape of the window, tape
markings in car and on test participant and the settings of the seat.
5.6 Assumption: Personal attitude is a factor
8) Personal style and attitude affect the seated position.
9) People prioritise differently depending on personal pref-
erence regarding comfort, vision and reachability.
Keywords: Eye tracking, steering wheel position, questionnaire.
41
5.6.1 How to measure
The test participants can be asked about their personal style for driving
to see whether there is a correlation to their answers and the settings
they make to the seat and steering wheel. The test participants could
also be asked to explain their seated position and how they would like
to sit in the car. Unconscious thoughts of the positions could be
retrieved by using pictures for choosing ones position.
Keywords: Pictures of seated positions, personal style.

42
5.7 Summary of assumptions
1) How one experiences comfort regarding some or all of the
following influence the seated position: foot support, arm rest,
seat belt, leg roominess and neck rest.
2) The reachability to functions such as pedals, steering wheel and
controls, affect the seated position.
3) The visual references outside the car, hood height, lanes, traffic
and mirrors affect the seated position.
4) Visual references inside the car such as windshield, rear-view
mirror and dashboard affect the seated position.
5) The seated position varies between people with different an-
thropometric measurements.
6) Limitations of the car such as sight considering A-pillars, hood
height and roof height affect the seated position.
7) The adjustment range of the seat and steering wheel affect the
seat adjustment.
8) Personal style and attitude affect the seated position.
9) People prioritise differently depending on personal preference
regarding comfort, vision and reachability.
43
6 Overall design
In this chapter the overall design of the developed method SPEED is
described as well as the evaluation of concepts and the evaluation
approach. The test approach with the early conditions for SPEED is set
out and means for standardisation is listed. SPEED is divided into three
parts; preparation, clinic and analysis. The clinic shall be performed
while driving and objective measurements, subjective questions and
observation of behaviour will elicit information regarding how and why
people sit the way they sit when driving.
From the start of the project it was decided that the method would
include a clinic in which test participants drive and their settings and
seated positions are measured and documented, and that they would be
asked questions. The exact measurements, questions and documenta-
tion to be included in SPEED were based on the assumptions from
chapter 5 and further developed and evaluated in three evaluation
sessions described in chapter 6.1. The main priorities during the
development were usability, time and relevance of the acquired result.
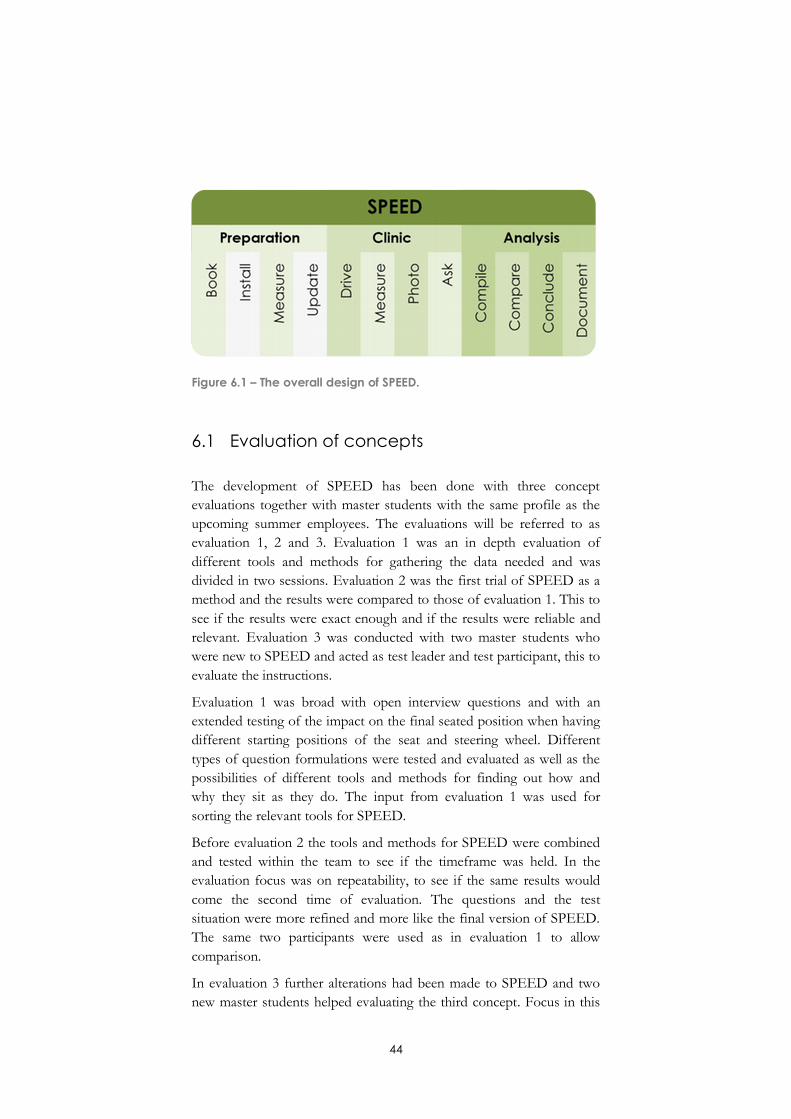
SPEED as a method includes preparations, a clinic and analysis, see
Figure 6.1. In the preparation phase equipment and appointments will
be booked, the equipment will be installed, the car will be measured and
the documents and programs included in SPEED will be updated.
During the clinic a number of test participants will drive a car making
three sessions of settings of seat and steering wheel. The settings will be
measured, the test participants’ postures will be photographed and they
are asked questions. The elicited data will then be compiled and
analysed through comparisons between parameters, some conclusions
will be made and afterwards be documented. The analysis will be
divided into a basic analysis and a further analysis. Three documents
and a program will be created and will provide the means for complet-
ing SPEED; the SPEED Coordinates program, the SPEED Compila-
tion document and the SPEED Instruction document.
44
Figure 6.1 – The overall design of SPEED.
6.1 Evaluation of concepts
The development of SPEED has been done with three concept
evaluations together with master students with the same profile as the
upcoming summer employees. The evaluations will be referred to as
evaluation 1, 2 and 3. Evaluation 1 was an in depth evaluation of
different tools and methods for gathering the data needed and was
divided in two sessions. Evaluation 2 was the first trial of SPEED as a
method and the results were compared to those of evaluation 1. This to
see if the results were exact enough and if the results were reliable and
relevant. Evaluation 3 was conducted with two master students who
were new to SPEED and acted as test leader and test participant, this to
evaluate the instructions.
Evaluation 1 was broad with open interview questions and with an
extended testing of the impact on the final seated position when having
different starting positions of the seat and steering wheel. Different
types of question formulations were tested and evaluated as well as the
possibilities of different tools and methods for finding out how and
why they sit as they do. The input from evaluation 1 was used for
sorting the relevant tools for SPEED.
Before evaluation 2 the tools and methods for SPEED were combined
and tested within the team to see if the timeframe was held. In the
evaluation focus was on repeatability, to see if the same results would
come the second time of evaluation. The questions and the test
situation were more refined and more like the final version of SPEED.
The same two participants were used as in evaluation 1 to allow
comparison.
In evaluation 3 further alterations had been made to SPEED and two
new master students helped evaluating the third concept. Focus in this
45
evaluation was the understandability of the instructions, the usability of
the technique and the interaction between test leader and test
participant.
6.2 Test approach
For deciding the test approach for SPEED an important factor has
been time, without compromising on the gathering of data for finding
out how and why people sit when driving. To find out how people sit
test participants will drive during the clinic. To keep the test situation as
realistic as possible different traffic environments should be included in
the drive route. Measuring of the settings of seat and steering wheel will
be done and the seated position will be documented. Documenting the
position does not answer the question of why they sit as they do so
additional questions to the test participants is needed. The different
tools and methods that can be used for eliciting the data needed are
further described and evaluated in chapter 7.
Because of the limited man hours allowed for the clinic, see chapter 4.2,
it was soon decided there would only be one test leader during the
clinic. To save time, reduce the work load for the test leader and to
achieve a more standardised clinic it was decided that the questions
would be read and answered directly on the computer by the test
participant in the SPEED Compilation document. Additional benefits
of this are that the amount of printed papers will be reduced and that
the compilation of data will be easier done than what have been the
cases in earlier clinics, described in chapter 2.4. After evaluation 1,
described more thoroughly in chapter 6.1, it was decided that SPEED
would include objective measurements to answer how people sit,
subjective questions to answer why people choose their seated position
and observation of behavior to show how people act while driving.
6.2.1 Objective measurements
The most important points to find out according to VCC Ergonomics
are H-point, eye point, heel point and the distance between head and
neck rest. Therefore these points will be elicited from the clinic. Prior to
the clinic the car and the installed equipment will be measured by VCC
Crash Test Preparation to allow comparison with CATIA models and
drawings. All calculations to coordinates will be performed in the
SPEED Coordinates program made in Excel.
46
6.2.2 Subjective questions
Open questions and ranking lists will allow gathering of qualitative and
quantitative data. This can be used for obtaining deeper knowledge of
why people position them as they do as well as comparing subjects with
quantitative data. Questions about comfort, reachability, vision,
priorities, ratings and personal style will be asked. Different scales and
question formulations were evaluated in evaluation 1, evaluation 2 and
together with VCC Ergonomics and more about that can be seen in
chapter 7.7.
6.2.3 Observation of behaviour
To reduce the workload for the test leader during the clinic, observation
will be done afterwards with videos of the test participants’ settings and
driving. Cameras that take still photos also allow some observation of
behaviour in certain traffic situations. From the photos and video the
test leader can observe the behaviour of the test participant to see if
something triggers a change in posture and if certain functions in the
car are used, e.g. arm rests. Situations that will be documented are
junctions, highway and parking.
6.3 Instructions
To allow replication of SPEED for other car models instructions will
be provided in the SPEED Instruction document. The starting point
was from the team’s own experience of being a summer employees at
VCC Ergonomics. The instructions should be written so anyone with
the required background (master students with ergonomic background)
is able to complete SPEED with assistance from someone at VCC
Ergonomics. The usability of the test leader instructions have been
tested in evaluation 3. The instructions for the method should:
Be in Swedish
Provide explanatory pictures and checklists
Instruct what needs to be prepared early
List the equipment needed
Instruct how updates and alterations to documents can be done
Include instructions needed for booking test participants
Instruct how the clinic is performed
Instruct how compilation of result and analysis is done
Include instructions to test participants
47
The fonts were chosen to be easy to read; the headers are san serif
(Century Gothic) to be easily separated visually from the body and the
body is serif (Garamond) to be easily read, and is consistent throughout
the report, instructions and documents. Bullet lists are provided when a
quick overview is needed and deeper explanations where something
more complicated needs to be done. The chapters are to be divided
depending on underlying context and ease finding the right information.
6.4 Standardisation
The results from evaluation 1 and evaluation 2, described briefly in
chapter 6.1, showed that the settings of the seat vary each time and that
the starting point for the seat did not matter for the final setting. For
SPEED the seat and steering wheel should have the same starting point
for all test participant and all three setting sessions, this to allow a
standardised test setup. The seat’s starting point is to be furthest back,
with lowest height and with lowest tilt. The back inclination should be
in a position where no one will sit comfortably to force everyone to
adjust it. The steering wheel should be in the middle of the adjustment
range.
Evaluations of previous measurements from seated position clinics
showed that there were no significant differences between the mean
value of H-point and the four different settings that the test participants
did between each driving. There was no connection or differences in
between setting 1&2, 2&3 and 3&4. The conclusion was therefore that
more sessions of adjusting the seat and steering wheel would not lead to
a more “exact” or “true” position but rather that either of the positions
was good enough for driving. Moreover previous clinics and evaluation
1 and 2 showed that people found a comfortable position faster and
easier after a few sessions because of recognition of buttons and the
rest of the car. It was therefore decided that there would be three
sessions of setting the seat and steering wheel and that the values from
the third setting would be analysed in the basic analysis.
For comparing driving in different situations the route should be
prepared for driving on highway, in junctions and on parking lot. The
route shall be the same for all test participants for a standardised
environment.
48
6.5 Summary of overall design
SPEED is divided into three parts; preparation, clinic and analysis.
Documents and programs will be provided for this method, including
the SPEED Coordinates program, the SPEED Compilation document
and the SPEED Instruction document. The clinic will be conducted
while driving according to a drive route and the test participants will
answer questions in a questionnaire. Three driving sessions will take
place and the set and steering wheel are to be reset to a starting point
before each new session. The means of eliciting information are
objective measurements, subjective questions and observation of
behaviour.
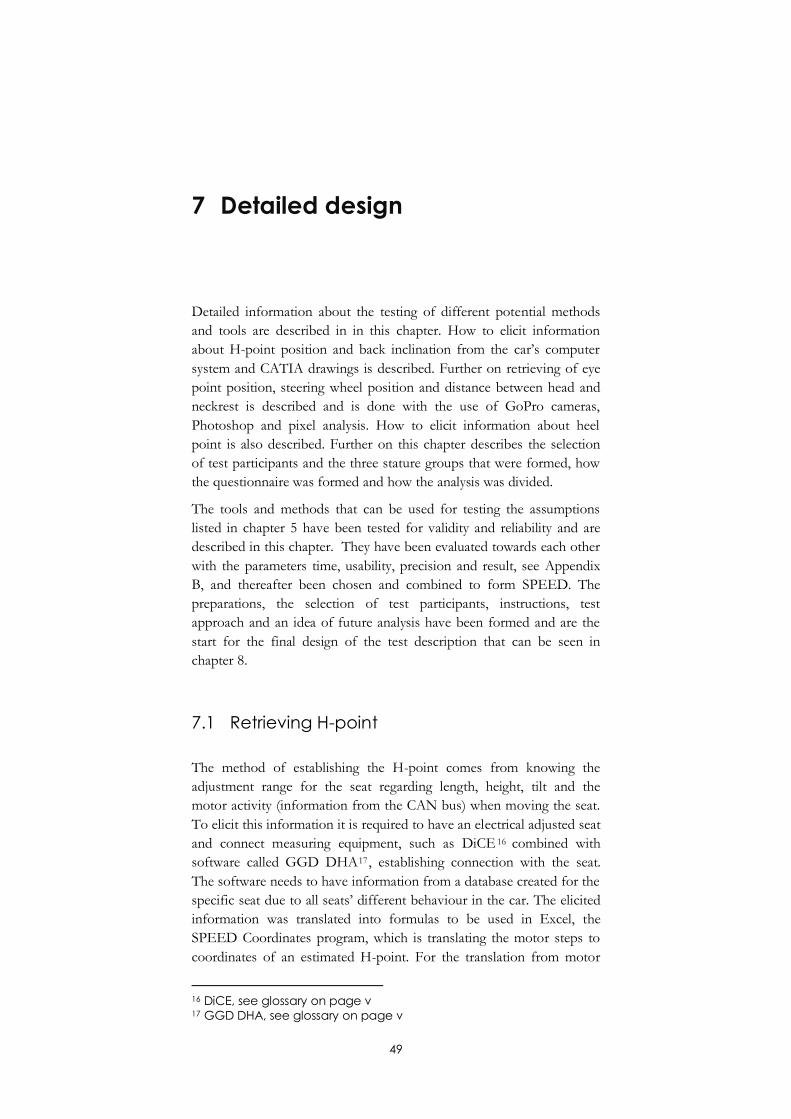
49
7 Detailed design
Detailed information about the testing of different potential methods
and tools are described in in this chapter. How to elicit information
about H-point position and back inclination from the car’s computer
system and CATIA drawings is described. Further on retrieving of eye
point position, steering wheel position and distance between head and
neckrest is described and is done with the use of GoPro cameras,
Photoshop and pixel analysis. How to elicit information about heel
point is also described. Further on this chapter describes the selection
of test participants and the three stature groups that were formed, how
the questionnaire was formed and how the analysis was divided.
The tools and methods that can be used for testing the assumptions
listed in chapter 5 have been tested for validity and reliability and are
described in this chapter. They have been evaluated towards each other
with the parameters time, usability, precision and result, see Appendix
B, and thereafter been chosen and combined to form SPEED. The
preparations, the selection of test participants, instructions, test
approach and an idea of future analysis have been formed and are the
start for the final design of the test description that can be seen in
chapter 8.
7.1 Retrieving H-point
The method of establishing the H-point comes from knowing the
adjustment range for the seat regarding length, height, tilt and the
motor activity (information from the CAN bus) when moving the seat.
To elicit this information it is required to have an electrical adjusted seat
and connect measuring equipment, such as DiCE 16 combined with
software called GGD DHA17 , establishing connection with the seat.
The software needs to have information from a database created for the
specific seat due to all seats’ different behaviour in the car. The elicited
information was translated into formulas to be used in Excel, the
SPEED Coordinates program, which is translating the motor steps to
coordinates of an estimated H-point. For the translation from motor
16 DiCE, see glossary on page v 17 GGD DHA, see glossary on page v
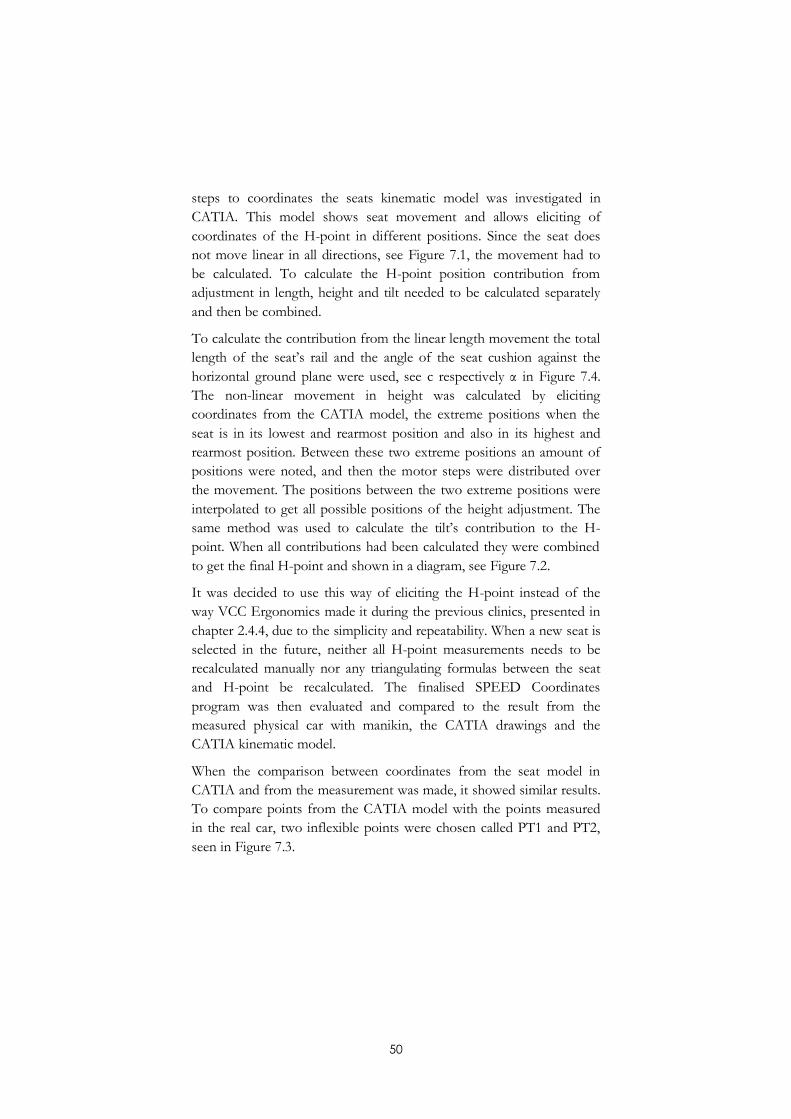
50
steps to coordinates the seats kinematic model was investigated in
CATIA. This model shows seat movement and allows eliciting of
coordinates of the H-point in different positions. Since the seat does
not move linear in all directions, see Figure 7.1, the movement had to
be calculated. To calculate the H-point position contribution from
adjustment in length, height and tilt needed to be calculated separately
and then be combined.
To calculate the contribution from the linear length movement the total
length of the seat’s rail and the angle of the seat cushion against the
horizontal ground plane were used, see c respectively α in Figure 7.4.
The non-linear movement in height was calculated by eliciting
coordinates from the CATIA model, the extreme positions when the
seat is in its lowest and rearmost position and also in its highest and
rearmost position. Between these two extreme positions an amount of
positions were noted, and then the motor steps were distributed over
the movement. The positions between the two extreme positions were
interpolated to get all possible positions of the height adjustment. The
same method was used to calculate the tilt’s contribution to the H-
point. When all contributions had been calculated they were combined
to get the final H-point and shown in a diagram, see Figure 7.2.
It was decided to use this way of eliciting the H-point instead of the
way VCC Ergonomics made it during the previous clinics, presented in
chapter 2.4.4, due to the simplicity and repeatability. When a new seat is
selected in the future, neither all H-point measurements needs to be
recalculated manually nor any triangulating formulas between the seat
and H-point be recalculated. The finalised SPEED Coordinates
program was then evaluated and compared to the result from the
measured physical car with manikin, the CATIA drawings and the
CATIA kinematic model.
When the comparison between coordinates from the seat model in
CATIA and from the measurement was made, it showed similar results.
To compare points from the CATIA model with the points measured
in the real car, two inflexible points were chosen called PT1 and PT2,
seen in Figure 7.3.
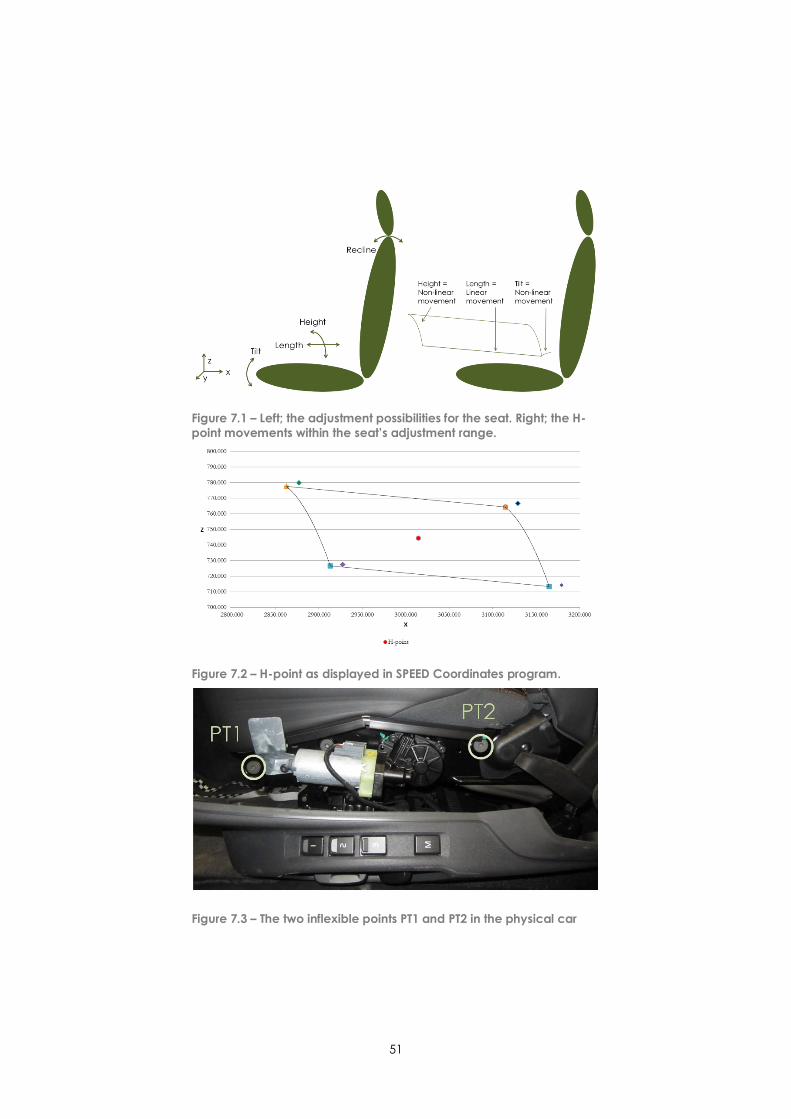
51
Figure 7.1 – Left; the adjustment possibilities for the seat. Right; the H-
point movements within the seat’s adjustment range.
Figure 7.2 – H-point as displayed in SPEED Coordinates program.
Figure 7.3 – The two inflexible points PT1 and PT2 in the physical car
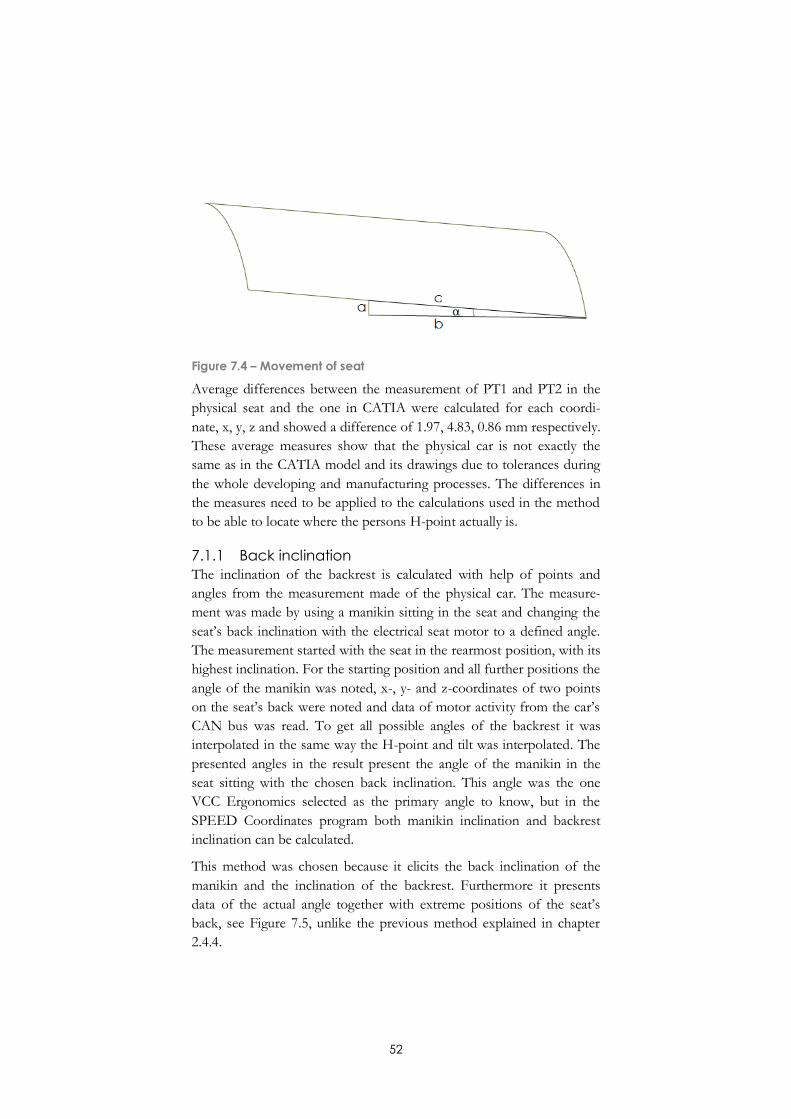
52
Figure 7.4 – Movement of seat
Average differences between the measurement of PT1 and PT2 in the
physical seat and the one in CATIA were calculated for each coordi-
nate, x, y, z and showed a difference of 1.97, 4.83, 0.86 mm respectively.
These average measures show that the physical car is not exactly the
same as in the CATIA model and its drawings due to tolerances during
the whole developing and manufacturing processes. The differences in
the measures need to be applied to the calculations used in the method
to be able to locate where the persons H-point actually is.
7.1.1 Back inclination
The inclination of the backrest is calculated with help of points and
angles from the measurement made of the physical car. The measure-
ment was made by using a manikin sitting in the seat and changing the
seat’s back inclination with the electrical seat motor to a defined angle.
The measurement started with the seat in the rearmost position, with its
highest inclination. For the starting position and all further positions the
angle of the manikin was noted, x-, y- and z-coordinates of two points
on the seat’s back were noted and data of motor activity from the car’s
CAN bus was read. To get all possible angles of the backrest it was
interpolated in the same way the H-point and tilt was interpolated. The
presented angles in the result present the angle of the manikin in the
seat sitting with the chosen back inclination. This angle was the one
VCC Ergonomics selected as the primary angle to know, but in the
SPEED Coordinates program both manikin inclination and backrest
inclination can be calculated.
This method was chosen because it elicits the back inclination of the
manikin and the inclination of the backrest. Furthermore it presents
data of the actual angle together with extreme positions of the seat’s
back, see Figure 7.5, unlike the previous method explained in chapter
2.4.4.
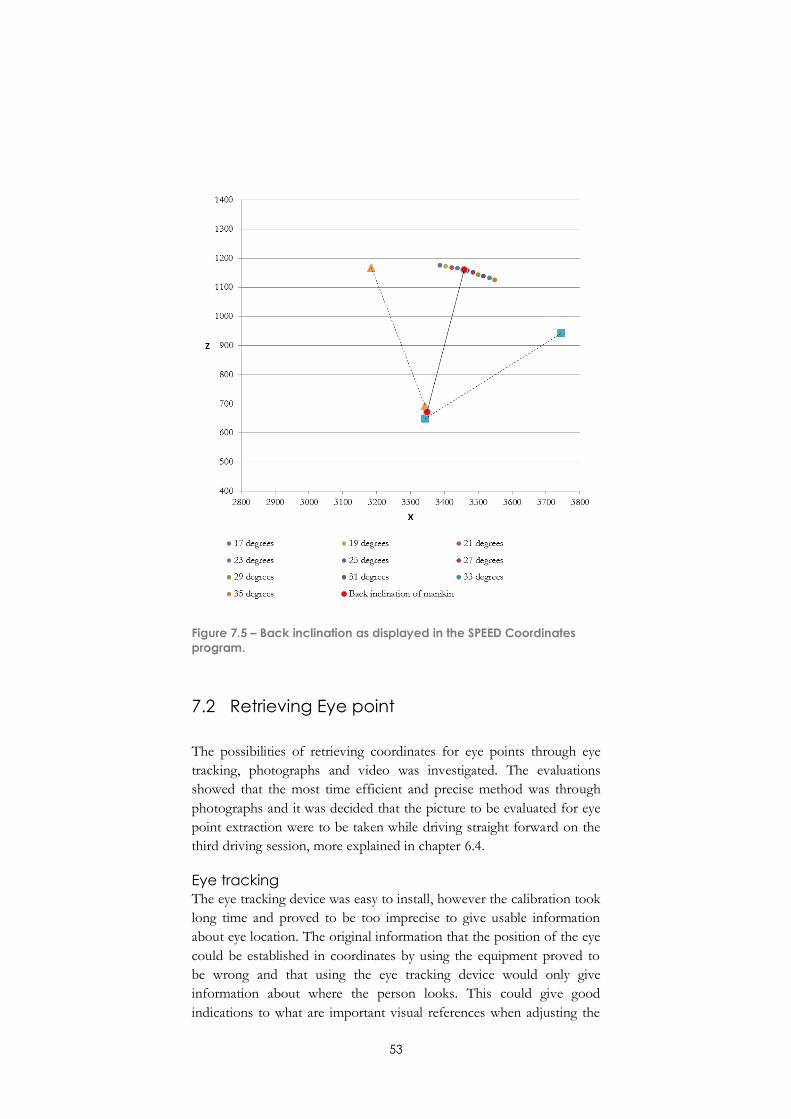
53
Figure 7.5 – Back inclination as displayed in the SPEED Coordinates
program.
7.2 Retrieving Eye point
The possibilities of retrieving coordinates for eye points through eye
tracking, photographs and video was investigated. The evaluations
showed that the most time efficient and precise method was through
photographs and it was decided that the picture to be evaluated for eye
point extraction were to be taken while driving straight forward on the
third driving session, more explained in chapter 6.4.
Eye tracking
The eye tracking device was easy to install, however the calibration took
long time and proved to be too imprecise to give usable information
about eye location. The original information that the position of the eye
could be established in coordinates by using the equipment proved to
be wrong and that using the eye tracking device would only give
information about where the person looks. This could give good
indications to what are important visual references when adjusting the
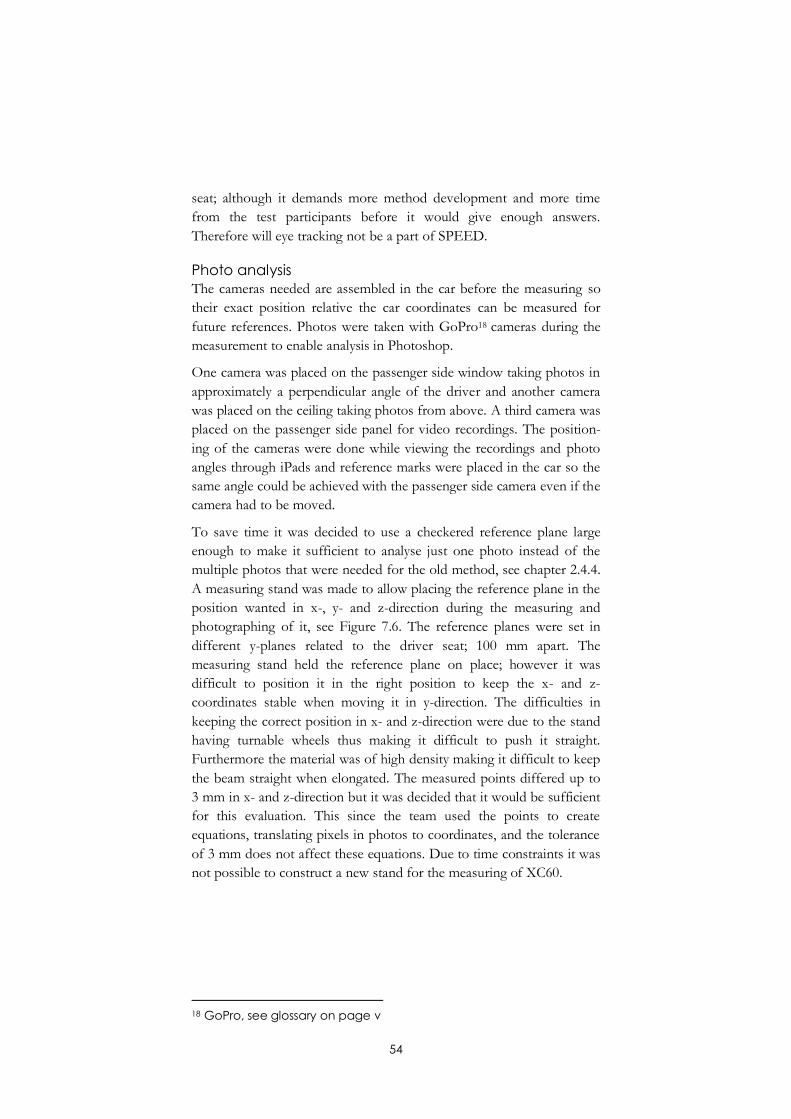
54
seat; although it demands more method development and more time
from the test participants before it would give enough answers.
Therefore will eye tracking not be a part of SPEED.
Photo analysis
The cameras needed are assembled in the car before the measuring so
their exact position relative the car coordinates can be measured for
future references. Photos were taken with GoPro18 cameras during the
measurement to enable analysis in Photoshop.
One camera was placed on the passenger side window taking photos in
approximately a perpendicular angle of the driver and another camera
was placed on the ceiling taking photos from above. A third camera was
placed on the passenger side panel for video recordings. The position-
ing of the cameras were done while viewing the recordings and photo
angles through iPads and reference marks were placed in the car so the
same angle could be achieved with the passenger side camera even if the
camera had to be moved.
To save time it was decided to use a checkered reference plane large
enough to make it sufficient to analyse just one photo instead of the
multiple photos that were needed for the old method, see chapter 2.4.4.
A measuring stand was made to allow placing the reference plane in the
position wanted in x-, y- and z-direction during the measuring and
photographing of it, see Figure 7.6. The reference planes were set in
different y-planes related to the driver seat; 100 mm apart. The
measuring stand held the reference plane on place; however it was
difficult to position it in the right position to keep the x- and z-
coordinates stable when moving it in y-direction. The difficulties in
keeping the correct position in x- and z-direction were due to the stand
having turnable wheels thus making it difficult to push it straight.
Furthermore the material was of high density making it difficult to keep
the beam straight when elongated. The measured points differed up to
3 mm in x- and z-direction but it was decided that it would be sufficient
for this evaluation. This since the team used the points to create
equations, translating pixels in photos to coordinates, and the tolerance
of 3 mm does not affect these equations. Due to time constraints it was
not possible to construct a new stand for the measuring of XC60.
18 GoPro, see glossary on page v
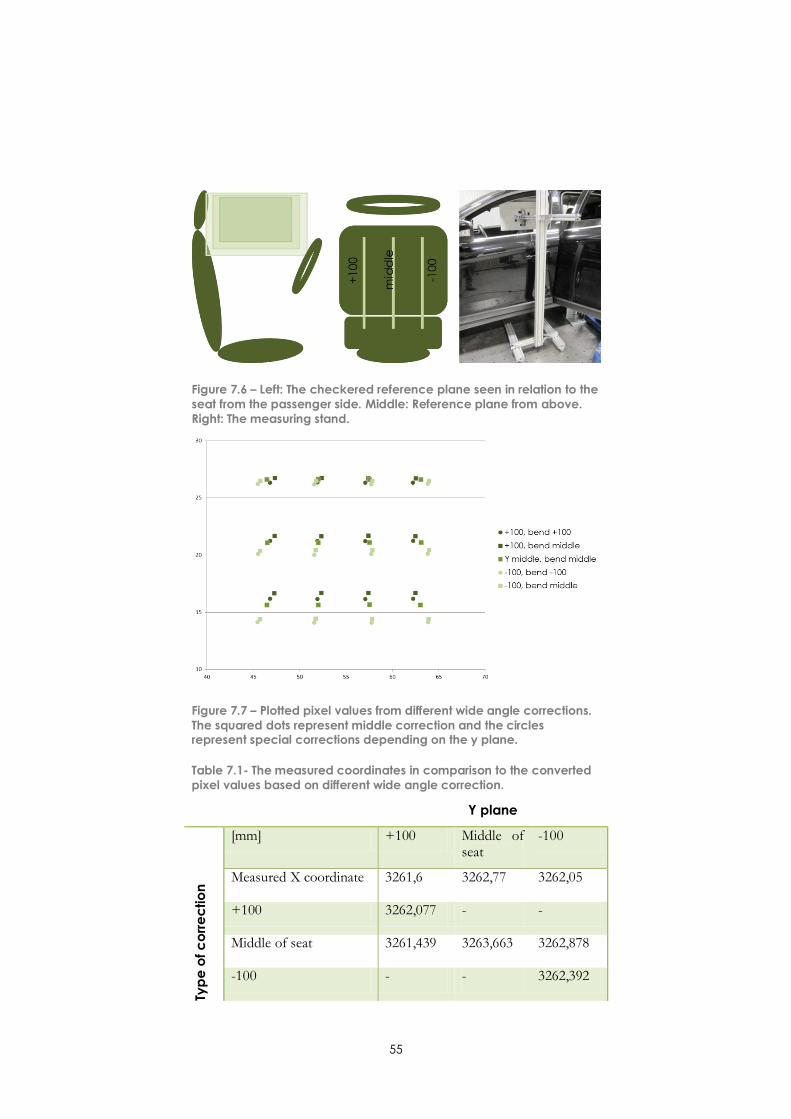
55
Figure 7.6 – Left: The checkered reference plane seen in relation to the
seat from the passenger side. Middle: Reference plane from above.
Right: The measuring stand.
Figure 7.7 – Plotted pixel values from different wide angle corrections.
The squared dots represent middle correction and the circles represent special corrections depending on the y plane.
Table 7.1- The measured coordinates in comparison to the converted
pixel values based on different wide angle correction.
Y plane
Typ
e o
f c
orr
ec
tio
n
[mm] +100 Middle of seat
-100
Measured X coordinate 3261,6 3262,77 3262,05
+100 3262,077 - -
Middle of seat 3261,439 3263,663 3262,878
-100 - - 3262,392
56
Depending on where the eyes are located in y-direction the pixel values
give different coordinates. Therefore different formulas were created in
the SPEED Coordinates program where the pixel values were
connected to the measured coordinates for each of the measured y-
planes. For testing its reliability, fisheye removing was used separately
for the different y-planes and compared to the result from when using
the same degree of fisheye removing independent on y-plane, see Figure
7.7. The result showed that the formulas to convert the pixel values to
coordinates gave a difference of on average 1 mm between the different
wide angle19 corrections, see Table 7.1. This lead to the decision that all
photos taken with the side camera can be altered with the same fisheye
removing and still give an exact location of eye point if the pixel value is
converted with different formulas depending on which y-plane the eye
is located.
In the SPEED Coordinates program the pixel values extracted from
Photoshop are inserted and converted through the formulas and
interpolation to a coordinate. The original thought was that one would
chose different formulas depending on the eyes position in y-direction,
something that would be seen in the pictures from the roof camera.
This is something that would work if all test participants had their heads
on the same height. The angle of the roof camera combined with the
different heights of test participants did however make it difficult to see
the y-position of the head as the camera view in some cases only
showed the test participants hair. This was seen too late in the making
of SPEED so another solution should be made for the next car
evaluation. It was decided, after discussions with VCC Ergonomics, that
the eye point to be analysed in the basic analysis were from driving
straight forward. Thus is the eye points analysed from driving straight
from the third session of driving. For the basic analysis it is sufficient to
use the formula for the y-plane in the middle of the seat as most people
sit in the middle of the seat when driving straight forward. For further
analysis of seated positions in other traffic situations the other y-planes
need to be used and the method therefore be more developed.
7.3 Retrieving steering wheel position
The previous method of finding out steering wheel position has been
difficult to use, see chapter 2.4.4. Therefore a new way of finding out
the position was developed by the team where the middle point of the
steering wheel was in focus.
19 Wide angle, see glossary on page v
57
A crash test sticker was placed in the centre of the steering wheel and
its centre was measured and photographed in five positions; the four
extreme positions and in a middle position. Thereafter the checkered
reference plane was measured and photographed in the same way as for
the eye point. The fisheye effect was reduced in relation to the y-plane
in the middle of the seat, the same that is used for retrieving eye point
position. The photographs were then analysed in Photoshop and the
pixel values were converted to coordinates in the SPEED Coordinates
program.
The converted values from the photos were compared with the
measured values. This showed that there was a tolerance level up to 4.1
mm in z-direction and up to 8.5 mm in x-direction. The reason for the
larger difference in x-direction could depend on the fisheye effect on
the camera used and the angle of the camera as it is not perpendicular
to the steering wheel. Another reason for the inaccuracy could be that
the measured points on the reference plane were too far apart and that
better accuracy could be achieved if the squares were smaller. Whether
this tolerance level is considered to be acceptable or not depend on the
required accuracy and usability the method should have. The new
method is of high usability but deliver a result presenting if test
participants have adjusted the steering wheel to any extreme position.
Comparing the new method to the previous method used by the
Ergonomics department, the previous deliver more correct results but is
of higher complexity and is more time consuming. Depending on what
accuracy the Ergonomics department want to have in future evalua-
tions, decides which of the two methods to use.
7.4 Heel point
The heel point position is easiest retrieved through photographs
because the area below the steering wheel and instrument panel is
hiding the feet thus making it impossible to observe feet position for a
test leader. Different camera positions were tried and the conclusion
was that it was easiest to determine heel position when the camera was
placed directly behind the feet with a grid on the floor mat.
The first position for the camera was from the left, see the left photo in
Figure 7.8, where the stripes only allowed the x-position of the heel to
be determined. To allow finding out the heel position in y-direction as
well a grid was attached to the floor mat and other placements of
cameras were investigated. The best accuracy of the pictures was
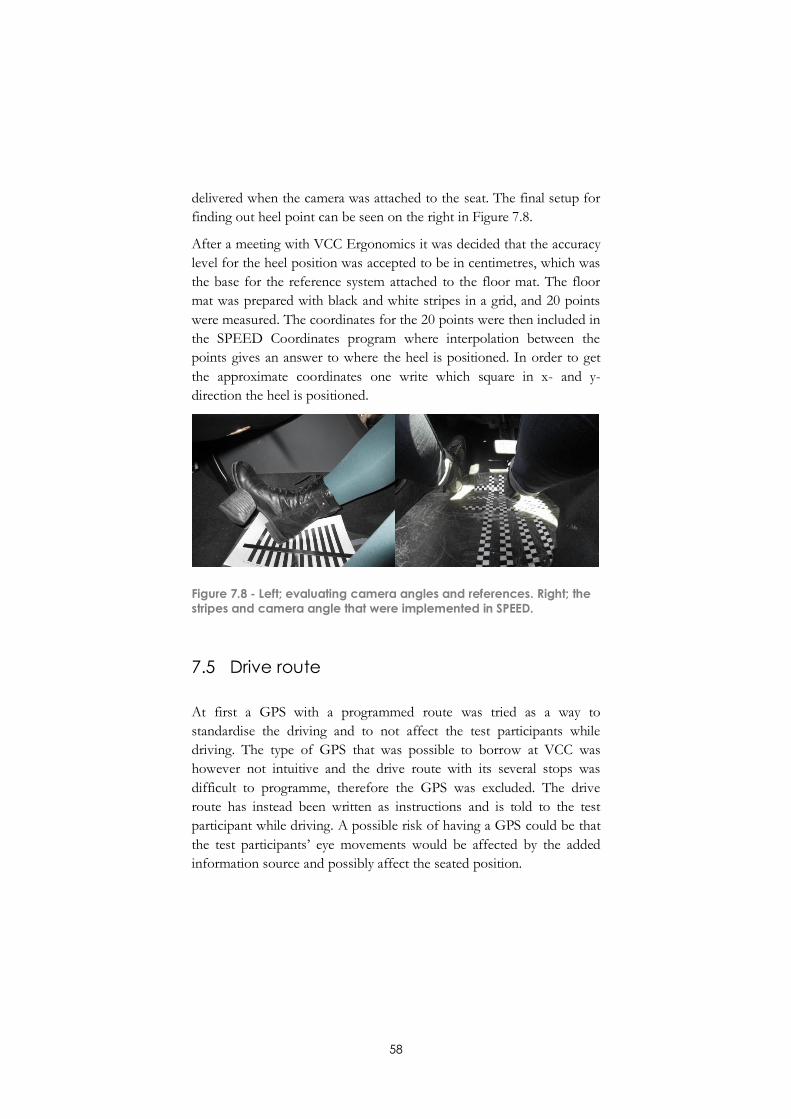
58
delivered when the camera was attached to the seat. The final setup for
finding out heel point can be seen on the right in Figure 7.8.
After a meeting with VCC Ergonomics it was decided that the accuracy
level for the heel position was accepted to be in centimetres, which was
the base for the reference system attached to the floor mat. The floor
mat was prepared with black and white stripes in a grid, and 20 points
were measured. The coordinates for the 20 points were then included in
the SPEED Coordinates program where interpolation between the
points gives an answer to where the heel is positioned. In order to get
the approximate coordinates one write which square in x- and y-
direction the heel is positioned.
Figure 7.8 - Left; evaluating camera angles and references. Right; the
stripes and camera angle that were implemented in SPEED.
7.5 Drive route
At first a GPS with a programmed route was tried as a way to
standardise the driving and to not affect the test participants while
driving. The type of GPS that was possible to borrow at VCC was
however not intuitive and the drive route with its several stops was
difficult to programme, therefore the GPS was excluded. The drive
route has instead been written as instructions and is told to the test
participant while driving. A possible risk of having a GPS could be that
the test participants’ eye movements would be affected by the added
information source and possibly affect the seated position.
59
7.6 Test participants
The selection of test participants is made from Testkliniklistan.
According to Erik Kristiansson20 the best from a statistical view would
be to have a totally randomised selection to get a representation of the
entire population. However, since one important reason for making the
analysis of cars is to provide information for future requirement
specifications it is of essence that the critical groups are represented.
Kristiansson therefore suggested that there could be three groups of
test participants, short (shorter than 10%ile women), normal (either in
the middle span or people from the whole range of heights) and tall
(taller than 90%ile men). For the method it would be better to have
fewer setting sessions and more test participants if there is a need to
prioritise the time.
Before deciding the selection of test participants, interviews were held
with people at Design and Human Factors at Chalmers 21 . This
department of Chalmers performs clinics themselves and helps VCC
with some of their clinics. Design and Human Factors at Chalmers
mostly performs qualitative studies and analyses and has used between
6 and 30 persons in their clinics.
The final selection of test participants was to have three groups of 46
short, medium statured and tall people with 15, 16 and 15 people in
each. The reason for choosing this number of people is because of the
benefits of having more people for statistical purposes but having few
enough to manage to complete the clinic within the time frame. In the
medium heighted group there are 8 women and 8 men. In the short
group women of 20%ile or shorter are included; in the tall group men
taller than 90%ile are represented and in the medium heighted group
both men and women are equally represented with women taller than
20%ile and men shorter than 90%ile. The reason for choosing the
larger height span for the short group than what Kristiansson suggested
is because of the limited amount of short people in Testkliniklistan.
7.7 Questionnaire
The questionnaire was developed with input from evaluation 1 and
sought after being easy to fill out on the computer. The questions were
20 Erik Kristiansson (Matematisk statistik, Chalmers), interviewed 21st of
February 2013. 21 Pontus Wallgren and Ida Hansson (Design and Human Factors,
Chalmers) interviewed 28th of February 2013.
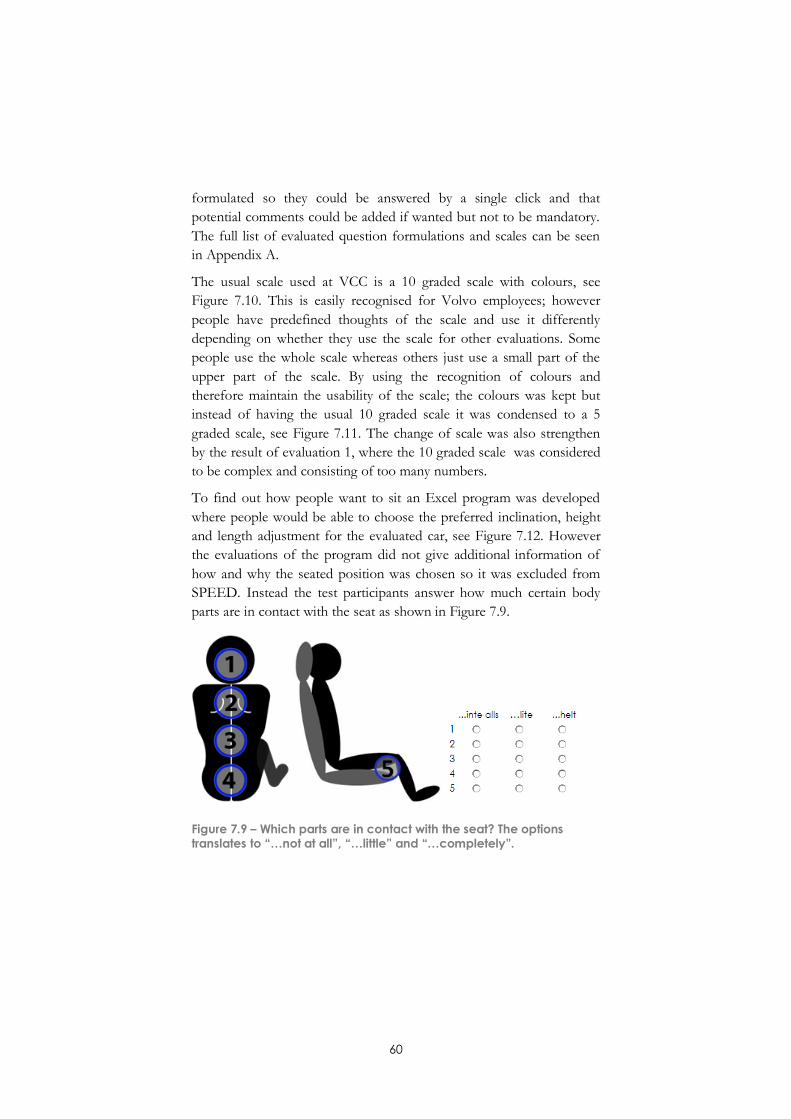
60
formulated so they could be answered by a single click and that
potential comments could be added if wanted but not to be mandatory.
The full list of evaluated question formulations and scales can be seen
in Appendix A.
The usual scale used at VCC is a 10 graded scale with colours, see
Figure 7.10. This is easily recognised for Volvo employees; however
people have predefined thoughts of the scale and use it differently
depending on whether they use the scale for other evaluations. Some
people use the whole scale whereas others just use a small part of the
upper part of the scale. By using the recognition of colours and
therefore maintain the usability of the scale; the colours was kept but
instead of having the usual 10 graded scale it was condensed to a 5
graded scale, see Figure 7.11. The change of scale was also strengthen
by the result of evaluation 1, where the 10 graded scale was considered
to be complex and consisting of too many numbers.
To find out how people want to sit an Excel program was developed
where people would be able to choose the preferred inclination, height
and length adjustment for the evaluated car, see Figure 7.12. However
the evaluations of the program did not give additional information of
how and why the seated position was chosen so it was excluded from
SPEED. Instead the test participants answer how much certain body
parts are in contact with the seat as shown in Figure 7.9.
Figure 7.9 – Which parts are in contact with the seat? The options translates to “…not at all”, “…little” and “…completely”.
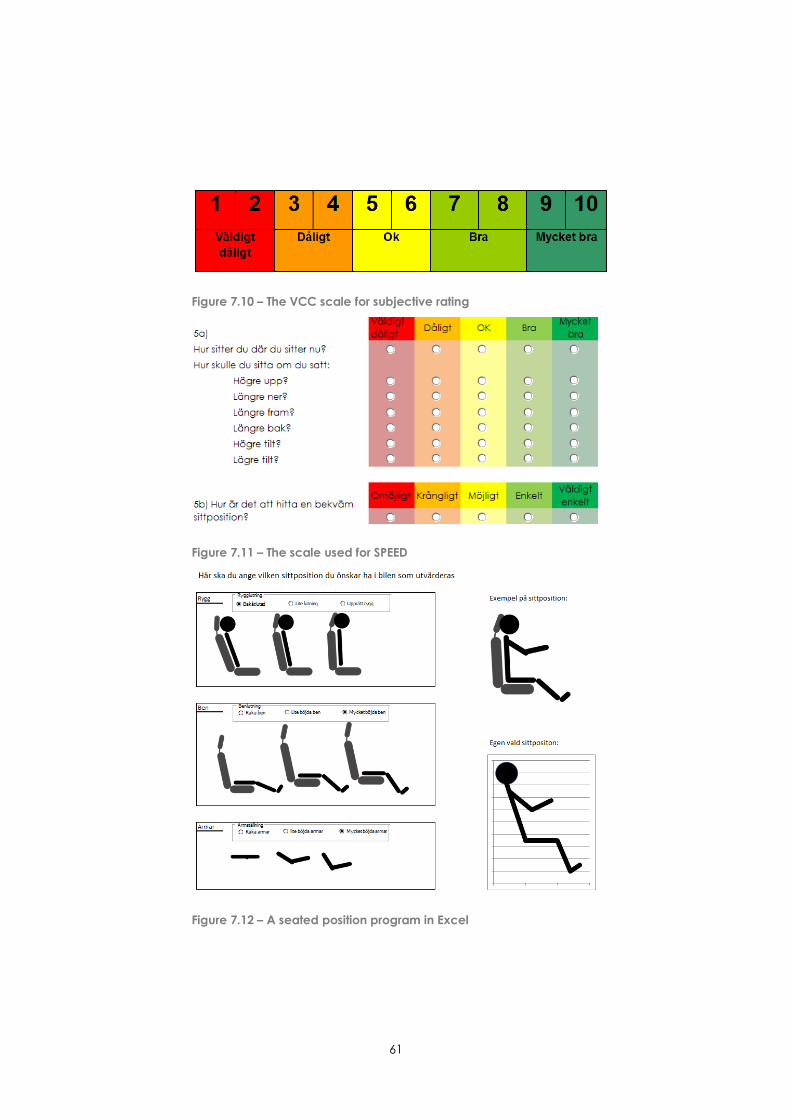
61
Figure 7.10 – The VCC scale for subjective rating
Figure 7.11 – The scale used for SPEED
Figure 7.12 – A seated position program in Excel
62
7.8 Analysis
The analysis of the result will be divided in two parts, basic analysis and
further analysis. The basic analysis will include the most basic
information from the objective measurements and subjective questions.
Further analysis will not be a part of the method and are for VCC
Ergonomics to complete when they want more information about a
specific person and his or her seated position and opinions. What
should be analysed have been discussed both with VCC Ergonomics
and VCC Crash and Safety. The analysis is made with consideration to
the team’s assumptions, listed in chapter 5.7, since those are seen as
most important to investigate together with the possibility of comparing
the different car models in a later stage. The parameters that are to be
presented in the basic analysis and the parameters that will be saved for
further analysis can be seen below in Table 7.2.
For comparisons of parameters and to get statistics of the result
Microsoft Excel will be used, both since the program makes it possible
compiling all data and is sufficient enough to perform the basic analysis.
To be able to compare the parameters regression analysis will be used
to find correlations. The analysis is made by plotting two parameters;
draw a linear curve of the plotted values so a value of correlation can be
elicited. This type of analysing was used due to recommendations from
Erik Kristiansson, and also because of its easy way of showing the
correlations.
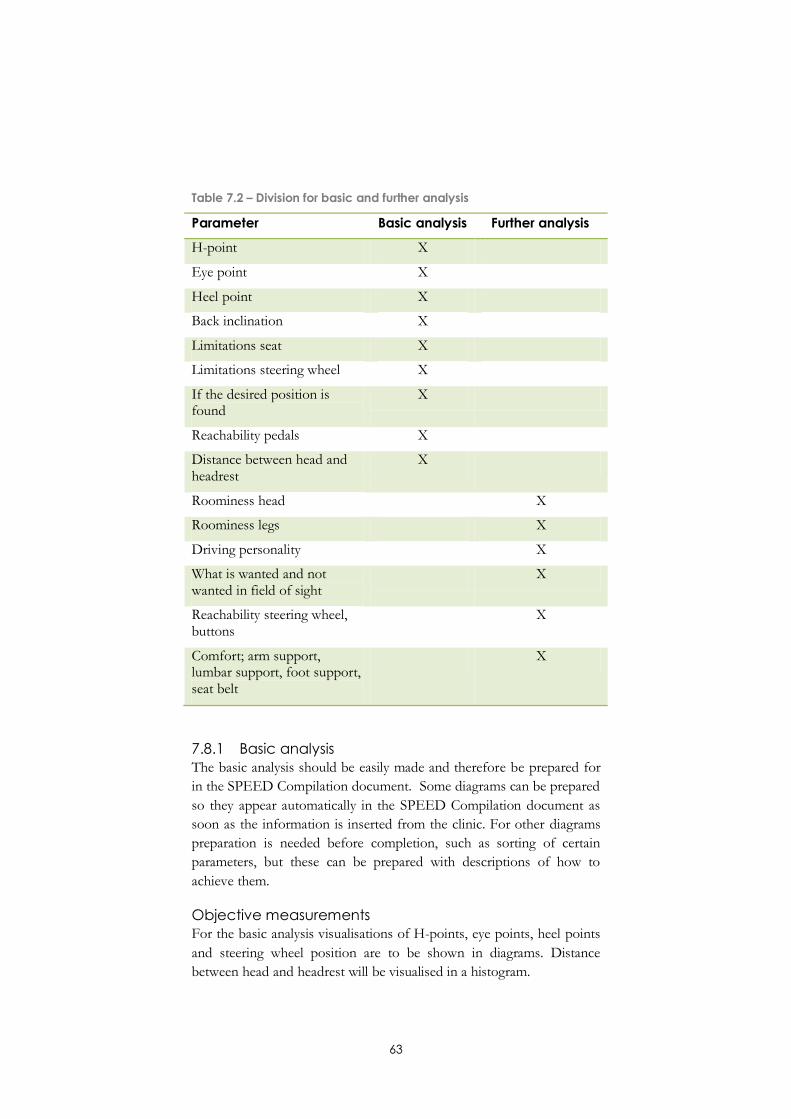
63
Table 7.2 – Division for basic and further analysis
Parameter Basic analysis Further analysis
H-point X
Eye point X
Heel point X
Back inclination X
Limitations seat X
Limitations steering wheel X
If the desired position is found
X
Reachability pedals X
Distance between head and headrest
X
Roominess head X
Roominess legs X
Driving personality X
What is wanted and not wanted in field of sight
X
Reachability steering wheel, buttons
X
Comfort; arm support, lumbar support, foot support, seat belt
X
7.8.1 Basic analysis
The basic analysis should be easily made and therefore be prepared for
in the SPEED Compilation document. Some diagrams can be prepared
so they appear automatically in the SPEED Compilation document as
soon as the information is inserted from the clinic. For other diagrams
preparation is needed before completion, such as sorting of certain
parameters, but these can be prepared with descriptions of how to
achieve them.
Objective measurements
For the basic analysis visualisations of H-points, eye points, heel points
and steering wheel position are to be shown in diagrams. Distance
between head and headrest will be visualised in a histogram.

64
Subjective questions
A presentation of potential limitations of adjustment capabilities of the
seat and steering wheel are to be included and in that case also present
the stature of those people. The basic analysis will also show results in
form of charts displaying how comfortable the test participants feel for
different settings, the importance of certain parameters in the particular
car when setting their seat position and what they think of the same
parameters in the car. The answers of these limitations and parameters
will be analysed in a first stage because they give a subjective answer on
why people choose their seated position.
Observation of behaviour
No observed behaviour will be included in the basic analysis.
7.8.2 Further analysis
Further analysis is going to be made by VCC Ergonomics when certain
situations or individual scores from a specific test participant are
evaluated. The further analysis can include reading test participants’
comments and correlations between them and their rating as well as
comparing more specific body measures. Observation of behaviour will
be further analysed by VCC Crash and Safety. The filmed material will
also be available for VCC Ergonomics to be used when performing
further analysis.
7.9 Tools used for SPEED
The potential tools and methods for SPEED evaluated in this chapter
has been rated regarding time consumption, usability, precision and the
result that they give. The complete list of tools can be seen in a matrix
in Appendix B. The tools chosen for SPEED had high scores in most
of the categories and contribute to relevant result and can be seen in
Table 7.3. Some equipment was built for SPEED, for example the
measuring stand described in chapter 7.2. To ease the commissioning of
SPEED two aid equipment were built; one to ease the handling of
iPads and one to ease the computer usage for the test participants, see
Figure 7.13.
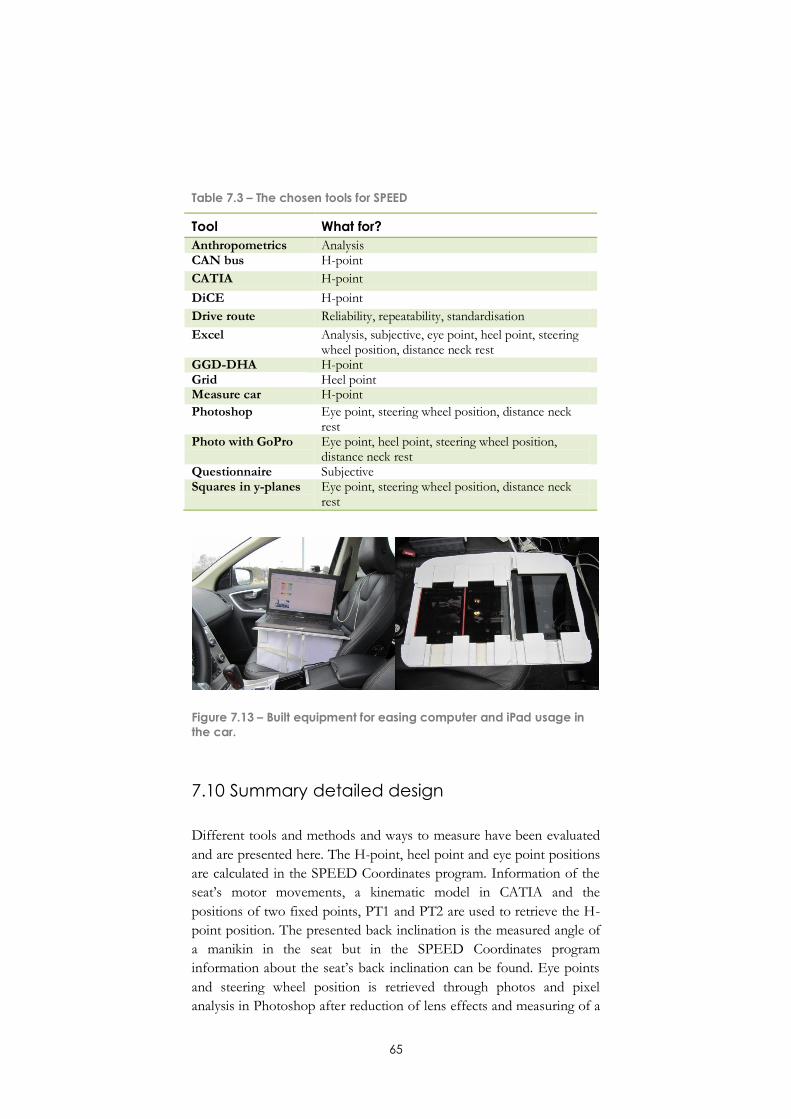
65
Table 7.3 – The chosen tools for SPEED
Tool What for?
Anthropometrics Analysis CAN bus H-point
CATIA H-point
DiCE H-point
Drive route Reliability, repeatability, standardisation
Excel Analysis, subjective, eye point, heel point, steering wheel position, distance neck rest
GGD-DHA H-point Grid Heel point Measure car H-point
Photoshop Eye point, steering wheel position, distance neck rest
Photo with GoPro Eye point, heel point, steering wheel position, distance neck rest
Questionnaire Subjective Squares in y-planes Eye point, steering wheel position, distance neck
rest
Figure 7.13 – Built equipment for easing computer and iPad usage in
the car.
7.10 Summary detailed design
Different tools and methods and ways to measure have been evaluated
and are presented here. The H-point, heel point and eye point positions
are calculated in the SPEED Coordinates program. Information of the
seat’s motor movements, a kinematic model in CATIA and the
positions of two fixed points, PT1 and PT2 are used to retrieve the H-
point position. The presented back inclination is the measured angle of
a manikin in the seat but in the SPEED Coordinates program
information about the seat’s back inclination can be found. Eye points
and steering wheel position is retrieved through photos and pixel
analysis in Photoshop after reduction of lens effects and measuring of a

66
checkered reference plane. The heel point is retrieved through photo
analysis and inserting the visual input from the grid in the SPEED
Coordinates program. The test participants to be included in the clinic
are divided into three stature groups with 15 people in each. There are
short women in the short group, medium to tall women and short to
medium men in the medium group and tall men in the tall group. The
analysis of the result is divided into basic and further analysis and will
be made in Excel.
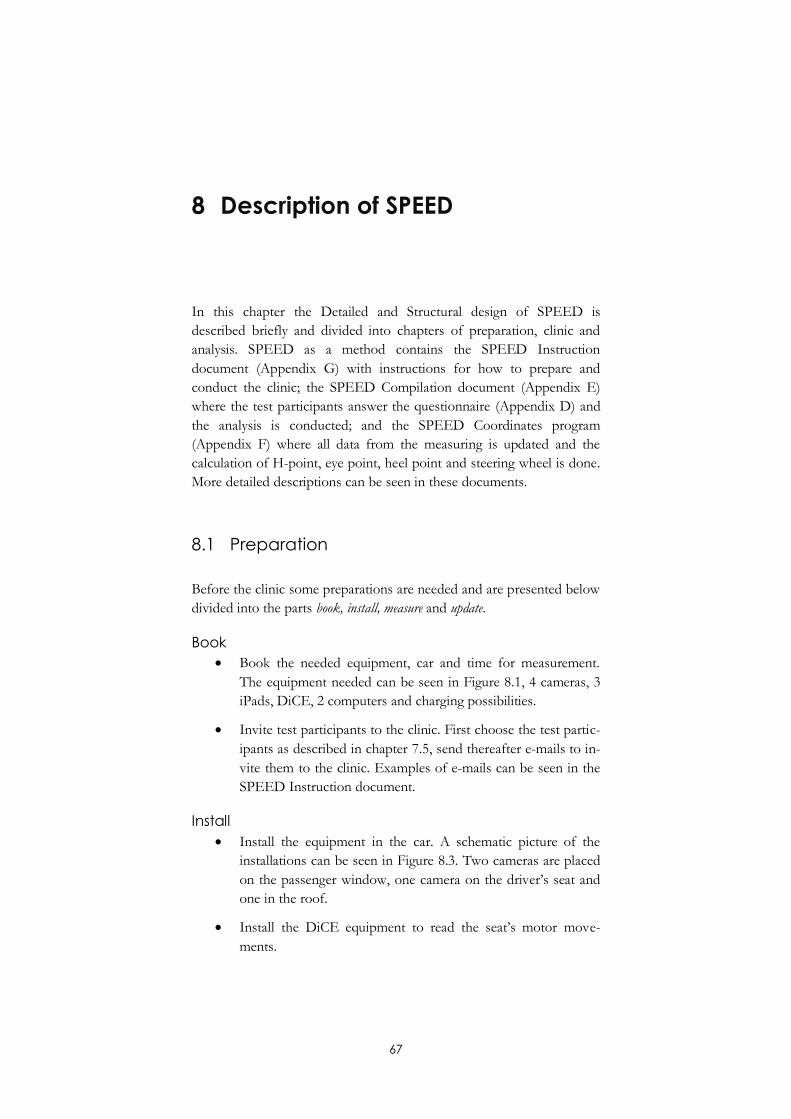
67
8 Description of SPEED
In this chapter the Detailed and Structural design of SPEED is
described briefly and divided into chapters of preparation, clinic and
analysis. SPEED as a method contains the SPEED Instruction
document (Appendix G) with instructions for how to prepare and
conduct the clinic; the SPEED Compilation document (Appendix E)
where the test participants answer the questionnaire (Appendix D) and
the analysis is conducted; and the SPEED Coordinates program
(Appendix F) where all data from the measuring is updated and the
calculation of H-point, eye point, heel point and steering wheel is done.
More detailed descriptions can be seen in these documents.
8.1 Preparation
Before the clinic some preparations are needed and are presented below
divided into the parts book, install, measure and update.
Book
Book the needed equipment, car and time for measurement.
The equipment needed can be seen in Figure 8.1, 4 cameras, 3
iPads, DiCE, 2 computers and charging possibilities.
Invite test participants to the clinic. First choose the test partic-
ipants as described in chapter 7.5, send thereafter e-mails to in-
vite them to the clinic. Examples of e-mails can be seen in the
SPEED Instruction document.
Install
Install the equipment in the car. A schematic picture of the
installations can be seen in Figure 8.3. Two cameras are placed
on the passenger window, one camera on the driver’s seat and
one in the roof.
Install the DiCE equipment to read the seat’s motor move-
ments.
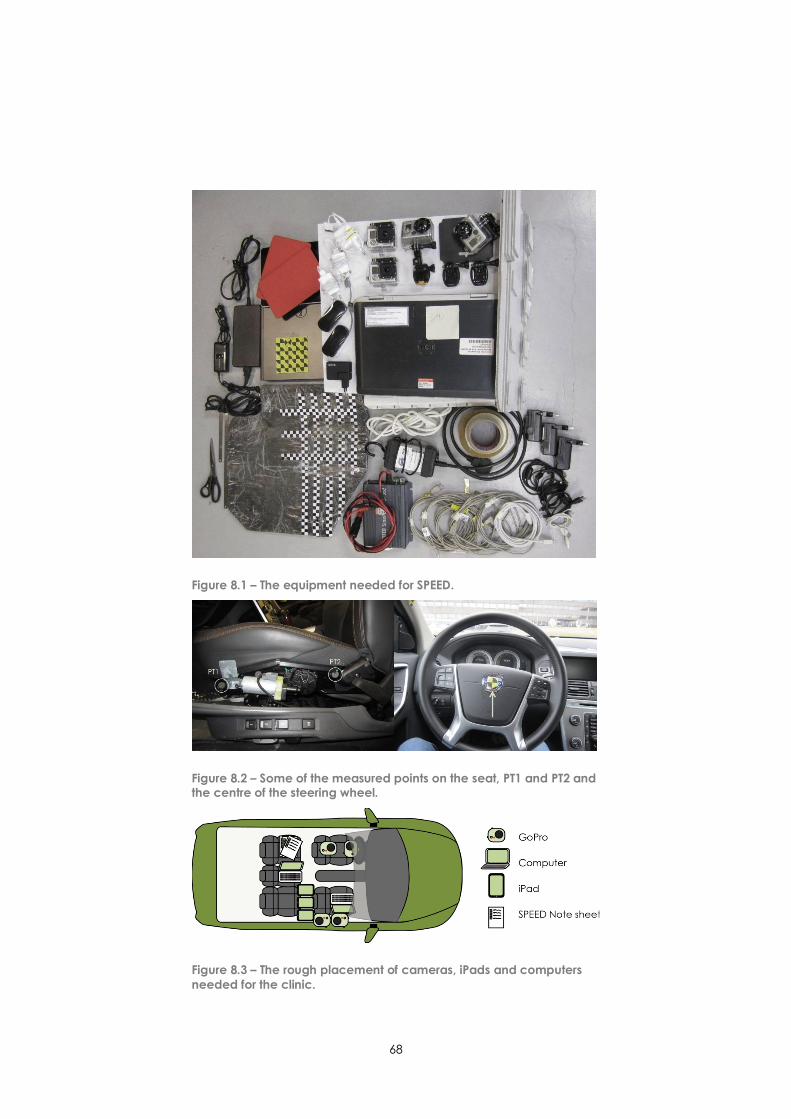
68
Figure 8.1 – The equipment needed for SPEED.
Figure 8.2 – Some of the measured points on the seat, PT1 and PT2 and the centre of the steering wheel.
Figure 8.3 – The rough placement of cameras, iPads and computers
needed for the clinic.
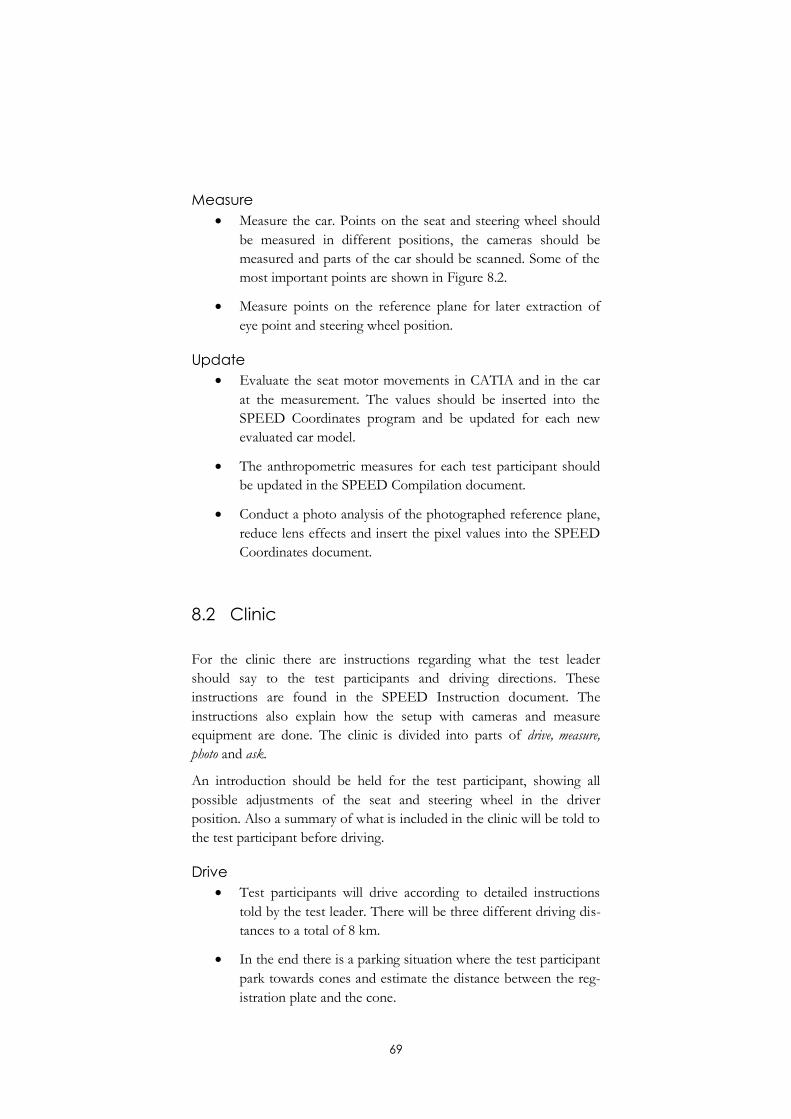
69
Measure
Measure the car. Points on the seat and steering wheel should
be measured in different positions, the cameras should be
measured and parts of the car should be scanned. Some of the
most important points are shown in Figure 8.2.
Measure points on the reference plane for later extraction of
eye point and steering wheel position.
Update
Evaluate the seat motor movements in CATIA and in the car
at the measurement. The values should be inserted into the
SPEED Coordinates program and be updated for each new
evaluated car model.
The anthropometric measures for each test participant should
be updated in the SPEED Compilation document.
Conduct a photo analysis of the photographed reference plane,
reduce lens effects and insert the pixel values into the SPEED
Coordinates document.
8.2 Clinic
For the clinic there are instructions regarding what the test leader
should say to the test participants and driving directions. These
instructions are found in the SPEED Instruction document. The
instructions also explain how the setup with cameras and measure
equipment are done. The clinic is divided into parts of drive, measure,
photo and ask.
An introduction should be held for the test participant, showing all
possible adjustments of the seat and steering wheel in the driver
position. Also a summary of what is included in the clinic will be told to
the test participant before driving.
Drive
Test participants will drive according to detailed instructions
told by the test leader. There will be three different driving dis-
tances to a total of 8 km.
In the end there is a parking situation where the test participant
park towards cones and estimate the distance between the reg-
istration plate and the cone.
70
Measure
Measure equipment such as DiCE and a computer for reading
the seat position needs to be connected to the car’s CAN-bus.
The GoPro cameras need to be put in correct position and
connected to the Apple iPads which will be the remote con-
trols.
The motor steps are measured after the first, second and third
driving session. First and second reading will be made during
the stop after first and second driving and the third reading
while driving the third route. All readings are noted using the
SPEED Note sheet.
Measure the distance between the car and the cones for the
parking situation.
Photo
Photos are taken when driving straight ahead, standing by
traffic lights in intersections and at the parking situation. Pho-
tos should be taken during the two first situations for all three
settings if possible, by using three iPads controlling the GoPro
cameras.
Observed behaviour such as if the person is changing position
during driving can be noted on the SPEED Note sheet.
One of the cameras is filming with the purpose of observing
the test participants’ behaviour in different situations.
Ask
Notes are to be written for all three settings regarding how they
position themselves, using the SPEED Note sheet, found in
Appendix C.
The test participant answer questions regarding their current
seated position when the car stands still after driving route one,
two and three. After route three more questions regarding oth-
er parameters in the car and a parking situation are asked. All
questions will be answered in a computer standing in the front
passenger seat.
71
8.3 Analysis
The analysis is divided into basic and further analysis. Further analysis is
for VCC Ergonomics to decide in a later stage. How to conduct a basic
analysis is explained below. The analysis of the result will be made in
the SPEED Compilation document, where data from all test partici-
pants is gathered. In this document there are diagrams and charts
prepared for the basic analysis. In the SPEED Compilation document
all data available about the test participants will be included from
Testkliniklistan, to have all body measures available. Selected parameters
shown in Table 7.2 will be shown in diagrams.
Compile
All motor steps are put in each individual test participant sheet
in the SPEED Compilation document and then converted to
coordinates by copy and paste in the SPEED Coordinates pro-
gram to later be pasted back into the SPEED Compilation
document.
The photos are to be moved to a computer and sorted by
situation and setting, thereafter remove fisheye effect with Pho-
toshop using predefined actions. Then a selection of photos is
made and the eye points analysed with help of Photoshop and
the SPEED Coordinates program, thereafter to be put into the
SPEED Compilation document.
The position of the steering wheel is elicited through photos
with the same procedure as eye points.
The heel points are analysed with photos of the test partici-
pant’s feet and in the SPEED Coordinates program. The test
leader will manually look in the photos where the heel of the
right foot is located and put this location in SPEED Coordi-
nates program, which in return gives coordinates and that are
pasted into SPEED Compilation document.
Compare
In the SPEED Compilation document diagrams, tables and
charts are prepared and appear automatically. Through the dia-
grams and the displayed mean and median values of priorities
and scores parameters can be compared.
Conclude
From the charts and colour coordinated tables conclusions can
be made in combination with analysis of the comments.

72
Document
The result is to be documented and presented, with help of
diagrams and the results from the created charts along with
some written conclusions. For this documentation VCC uses
Powerpoint.
73
9 Evaluation of SPEED
An evaluation of SPEED can be found in this chapter. The time used
for the method as a whole and for each test participant has been
evaluated as well as the usability of the instructions, the equipment that
has been used and the quality of the result and the found connections.
SPEED has provided a Seated Position Evaluation from Elicited Data
and delivers versatile information about how people sit when they drive.
The elicited points enable making virtual manikins with the same body
measures as the test participants and position these in the virtual car
model. The team has found correlations between people’s anthropome-
try and their answers on the subjective questions, the reasons behind
the positioning, and thereby why they sit as they sit. How test
participants are positioned is clearly answered by the use of SPEED.
Why test participants sit as they sit is answered and further analyses of
other car models can validate the existing correlations and extract more
correlations. It was discovered that people of the same stature can sit
completely different when driving but be equally happy about their
position. The clinics are easy to lead and complete and take little time
for the test participants.
SPEED as a whole demands a lot of technical equipment that need to
be installed in the car. With detailed instructions to the equipment and
how to use and install it in the car the team believes that the usability is
sufficient and that the amount of gathered data justify the work that is
needed. During the clinics it was discovered that some instructions were
unnecessary and redundant, for instance the driving instructions. Many
VCC employees know about the area and how to drive there, but
instructions are useful for new users of the method and in case test
participants do not have knowledge about the geographical area. With
the SPEED documents and programs the handling of data, alterations
and commissioning should go fast enough. A rough estimation of how
many man hours the different steps of SPEED should take can be
found in Table 9.1. It is based on that two summer employees’ work
together and divide work tasks in-between themselves and that they get
initial support from VCC Ergonomics. A complete evaluation of how
much time it takes to conduct a full clinic using SPEED is possible next
time a car is evaluated.
74
The clinic when using the SPEED method takes between 43 and 47
minutes per test participant. On average the 45 minutes that were put as
a limit for the time consumption. Many test participants expressed
liking of the clinic and that it was fast and easy to complete. That the
test participants were satisfied with the easy clinic compensates the fact
that not all the answers about why they sat as they did were obtained.
When more car models are evaluated in a later stage, conclusions might
be drawn about this matter in further analyses. One cannot be sure that
the question why would be answered even if the test approach had been
different because of the subconscious nature of setting the seat.
There were some technical issues during the clinic. In the beginning of
the clinics the cameras kept running out of battery why extra equipment
was installed in the car to allow charging the cameras continuously. This
means that there is more equipment to install, however the reduced
time and effort during the clinics compensate the initial extra work
needed. The problems that arose for the team have been documented
so these will not be repeated for future SPEED users.
All clinics were held with help of one test leader and it worked well.
Due to created tools, such as the aid for the iPads described in chapter
7.9, it was easy to handle equipment during the clinics and to switch
between different tasks.
All the parameters that were compared to each other in the analysis can
be seen in Table 9.2. In the table the connections between parameters
are defined as Yes or No. If the connection says yes it means the team
saw at least a weak connection. A connection between two parameters
should, according to VCC Ergonomics, have at least a R2 value of 0.7 to
be considered as valid. Connections between parameters that have R2
less than 0.7 are in some cases considered as weak connections. These
parameters have been compared pairwise, and in some cases the results
have also been divided in the three stature groups. The analyses have
been made in Excel but if a more thorough analysis in another program,
such as SIMCA22, more connections might be seen. This will be a topic
for further evaluation. After the XC60 clinic some further alterations
were made to the instructions and the placement of the roof camera has
been questioned. The camera placement will be an issue of further
investigation and should be altered or excluded for the next clinic.
22 SIMCA, see glossary on page v
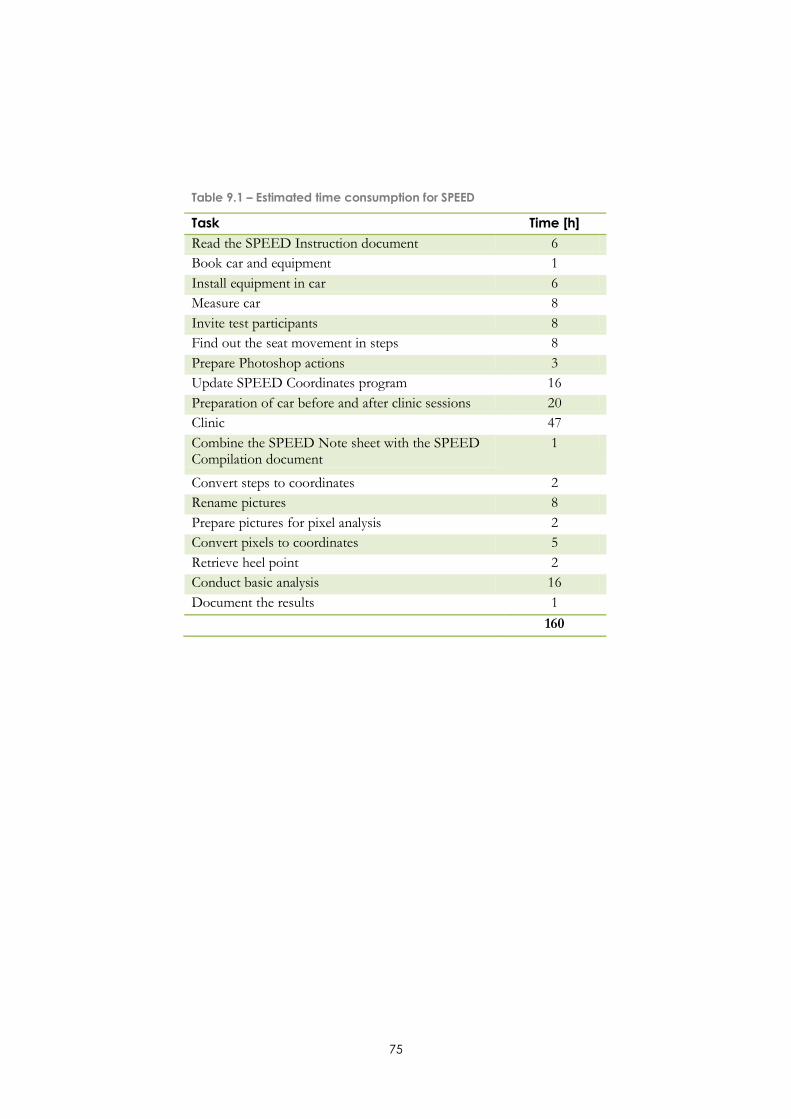
75
Table 9.1 – Estimated time consumption for SPEED
Task Time [h]
Read the SPEED Instruction document 6
Book car and equipment 1
Install equipment in car 6
Measure car 8
Invite test participants 8
Find out the seat movement in steps 8
Prepare Photoshop actions 3
Update SPEED Coordinates program 16
Preparation of car before and after clinic sessions 20
Clinic 47
Combine the SPEED Note sheet with the SPEED Compilation document
1
Convert steps to coordinates 2
Rename pictures 8
Prepare pictures for pixel analysis 2
Convert pixels to coordinates 5
Retrieve heel point 2
Conduct basic analysis 16
Document the results 1
160
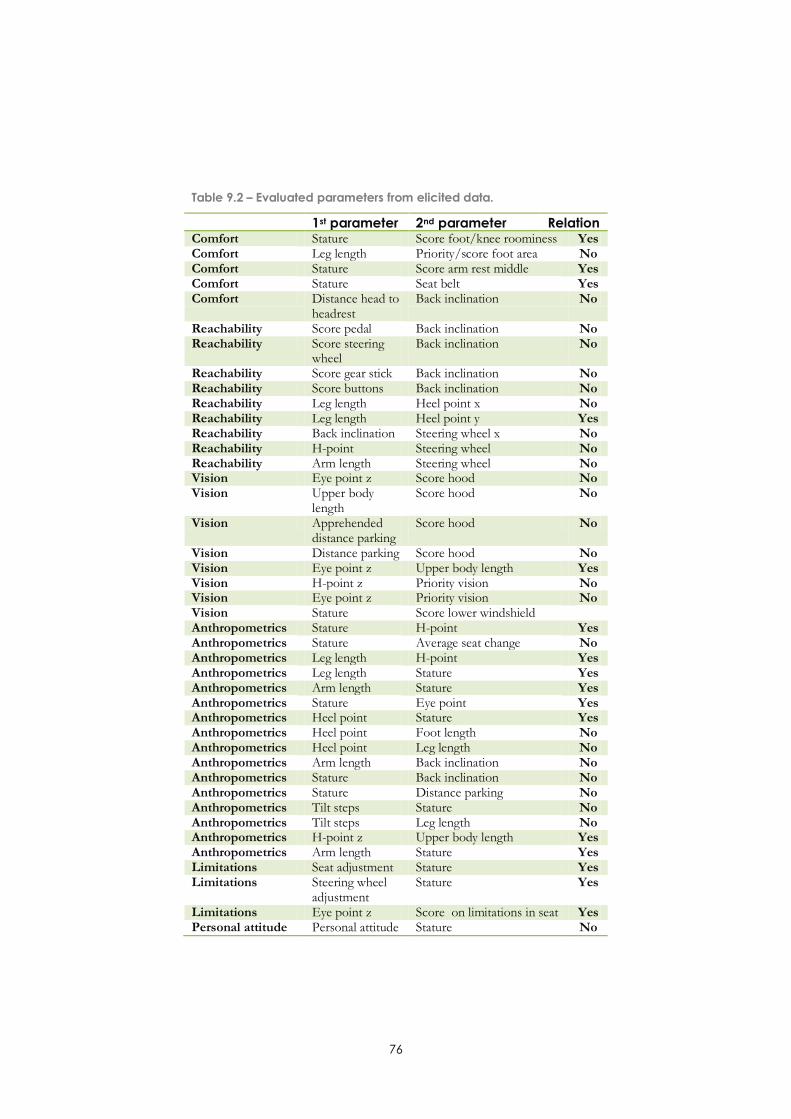
76
Table 9.2 – Evaluated parameters from elicited data.
1st parameter 2nd parameter Relation Comfort Stature Score foot/knee roominess Yes Comfort Leg length Priority/score foot area No Comfort Stature Score arm rest middle Yes Comfort Stature Seat belt Yes Comfort Distance head to
headrest Back inclination No
Reachability Score pedal Back inclination No Reachability Score steering
wheel Back inclination No
Reachability Score gear stick Back inclination No Reachability Score buttons Back inclination No Reachability Leg length Heel point x No Reachability Leg length Heel point y Yes Reachability Back inclination Steering wheel x No Reachability H-point Steering wheel No Reachability Arm length Steering wheel No Vision Eye point z Score hood No Vision Upper body
length Score hood No
Vision Apprehended distance parking
Score hood No
Vision Distance parking Score hood No Vision Eye point z Upper body length Yes Vision H-point z Priority vision No Vision Eye point z Priority vision No Vision Stature Score lower windshield Anthropometrics Stature H-point Yes Anthropometrics Stature Average seat change No Anthropometrics Leg length H-point Yes Anthropometrics Leg length Stature Yes Anthropometrics Arm length Stature Yes Anthropometrics Stature Eye point Yes Anthropometrics Heel point Stature Yes Anthropometrics Heel point Foot length No Anthropometrics Heel point Leg length No Anthropometrics Arm length Back inclination No Anthropometrics Stature Back inclination No Anthropometrics Stature Distance parking No Anthropometrics Tilt steps Stature No Anthropometrics Tilt steps Leg length No Anthropometrics H-point z Upper body length Yes Anthropometrics Arm length Stature Yes Limitations Seat adjustment Stature Yes Limitations Steering wheel
adjustment Stature Yes
Limitations Eye point z Score on limitations in seat Yes Personal attitude Personal attitude Stature No
77
10 Result of SPEED in XC60
The result from using the method in Volvo XC60 can be found in this
chapter where the result is divided into assumption categories as well
answering the questions of how and why. Scores and priorities for
different parameters in the car are shown in tables divided into the
three stature groups and diagrams of H-point, eye point and heel point
position is shown.
For this work SPEED as a whole has been used for evaluating Volvo
XC60. The results from XC60 have been evaluated towards the
assumptions listed in chapter 5 and is displayed here. Scores ranges
from 1 to 5 where 1 means either “very bad”, “impossible” or “not at
all” whereas 5 mean “very good”, “very easy” or “very much”.
10.1 Assumption: Comfort is a factor
1) How one experiences comfort regarding some or all of the
following influence the seated position: foot support, arm rest,
seat belt, leg roominess and neck rest.
The result from the questionnaire shows that comfort has little
influence on the positioning, see Table 10.1. Foot and knee roominess
does however affect the seated position for tall men (scores: 3.4 and
3.5) whereas medium statured (scores: 3 and 2.8) and short women
(scores: 2.7 and 3) were not affected as much. There has not been any
connection observed between leg length and the priority or scoring of
foot support and foot roominess.
The arm rests, both in the door and in the centre, have about the same
average points and do not seem to be important for either of the groups
(score around 2). Shorter do not reach the arm rest in the centre and
one reason can be the support on the side of the seat.
The comfort of the seat belt is most important for short people but the
scores do not differ a lot between the groups (scores: short 2.7, medium
2.5 and tall 1.9), which indicates that other factors are more important
and prioritized than the seatbelt.
On the question “is the neck rest where you want to have it when you
drive” 25 answered yes and 22 answered no. Three of those who said
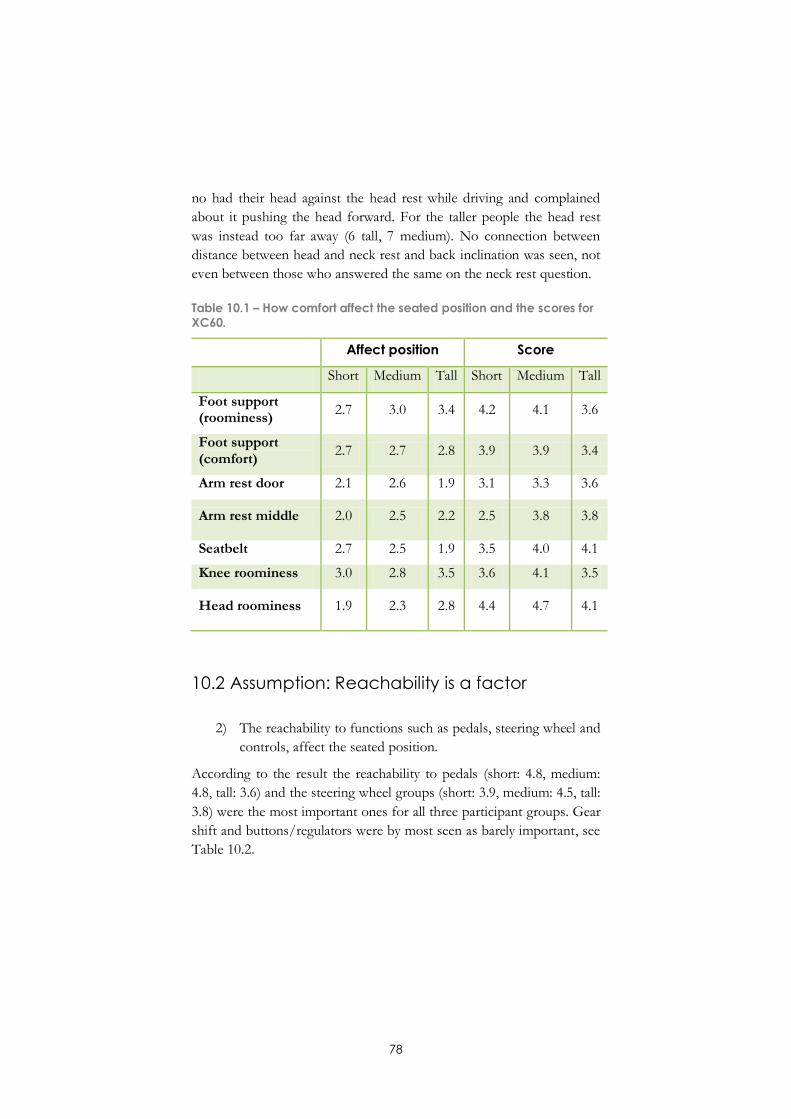
78
no had their head against the head rest while driving and complained
about it pushing the head forward. For the taller people the head rest
was instead too far away (6 tall, 7 medium). No connection between
distance between head and neck rest and back inclination was seen, not
even between those who answered the same on the neck rest question.
Table 10.1 – How comfort affect the seated position and the scores for
XC60.
Affect position Score
Short Medium Tall Short Medium Tall
Foot support (roominess)
2.7 3.0 3.4 4.2 4.1 3.6
Foot support (comfort)
2.7 2.7 2.8 3.9 3.9 3.4
Arm rest door 2.1 2.6 1.9 3.1 3.3 3.6
Arm rest middle 2.0 2.5 2.2 2.5 3.8 3.8
Seatbelt 2.7 2.5 1.9 3.5 4.0 4.1
Knee roominess 3.0 2.8 3.5 3.6 4.1 3.5
Head roominess 1.9 2.3 2.8 4.4 4.7 4.1
10.2 Assumption: Reachability is a factor
2) The reachability to functions such as pedals, steering wheel and
controls, affect the seated position.
According to the result the reachability to pedals (short: 4.8, medium:
4.8, tall: 3.6) and the steering wheel groups (short: 3.9, medium: 4.5, tall:
3.8) were the most important ones for all three participant groups. Gear
shift and buttons/regulators were by most seen as barely important, see
Table 10.2.
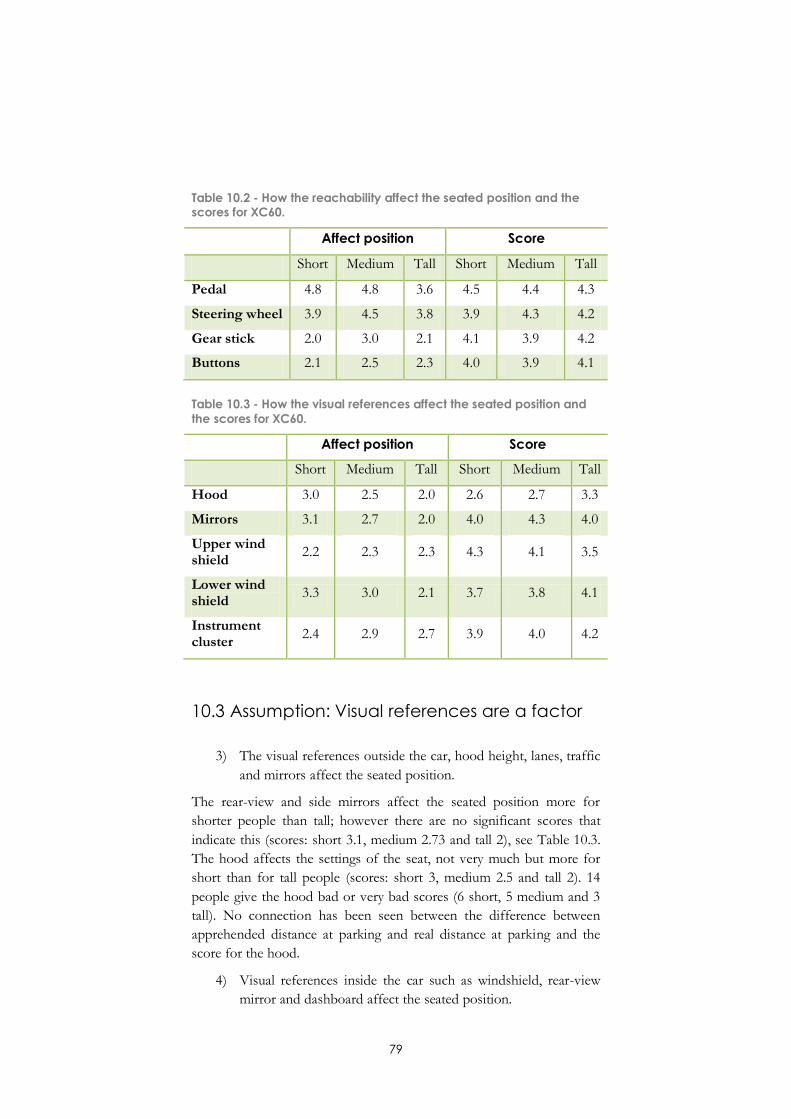
79
Table 10.2 - How the reachability affect the seated position and the scores for XC60.
Affect position Score
Short Medium Tall Short Medium Tall
Pedal 4.8 4.8 3.6 4.5 4.4 4.3
Steering wheel 3.9 4.5 3.8 3.9 4.3 4.2
Gear stick 2.0 3.0 2.1 4.1 3.9 4.2
Buttons 2.1 2.5 2.3 4.0 3.9 4.1
Table 10.3 - How the visual references affect the seated position and
the scores for XC60.
Affect position Score
Short Medium Tall Short Medium Tall
Hood 3.0 2.5 2.0 2.6 2.7 3.3
Mirrors 3.1 2.7 2.0 4.0 4.3 4.0
Upper wind shield
2.2 2.3 2.3 4.3 4.1 3.5
Lower wind shield
3.3 3.0 2.1 3.7 3.8 4.1
Instrument cluster
2.4 2.9 2.7 3.9 4.0 4.2
10.3 Assumption: Visual references are a factor
3) The visual references outside the car, hood height, lanes, traffic
and mirrors affect the seated position.
The rear-view and side mirrors affect the seated position more for
shorter people than tall; however there are no significant scores that
indicate this (scores: short 3.1, medium 2.73 and tall 2), see Table 10.3.
The hood affects the settings of the seat, not very much but more for
short than for tall people (scores: short 3, medium 2.5 and tall 2). 14
people give the hood bad or very bad scores (6 short, 5 medium and 3
tall). No connection has been seen between the difference between
apprehended distance at parking and real distance at parking and the
score for the hood.
4) Visual references inside the car such as windshield, rear-view
mirror and dashboard affect the seated position.
80
Those who put low scores on the lower edge of the windshield were
short or medium statured women (4) and it is less important for taller
people (scores: short 3.3, medium 3 and tall 2). The scores of the top
edge of the windshield do not seem to have any connections to the
groups and have an average score of 2.28, see Table 10.3.
10.4 Assumption: Anthropometrics is a factor
5) The seated position varies between people with different an-
thropometric measurements.
The result from the evaluations regarding H-point, eye point and heel
point show that there are differences among people with different
anthropometrics, in this case stature, when it comes to their decision of
driving position.
The H-point varies between the three groups, which can be seen in
Figure 10.1. Shorter people often put the seat higher up and more
forward while taller people put the seat lower and further back. In these
two cases it is often seen to be some of the extreme positions, putting
the seat in its highest or lowest position and also for taller persons in
the rearmost position. People of medium stature are more varied and
can put the seat in its highest as well as in its lowest position. Connec-
tions are also found when comparing H-point with test participants’
total leg length. People with longer legs choose to sit further back and
down compared to those with shorter legs.
All three groups have said that they sit well at all three setting sessions
and the lowest score of 3.8 have been given by the tall group with a
total average of about 4.1, see Table 10.4. The average difference
between the three settings is 11.53 mm in x-direction and 4.13 in z-
direction.
The eye point result shows that all of the shorter people in this
evaluation have their eyes more forward than taller people and those of
medium stature are in between and are overlapping the other two
groups, see Figure 10.2. It is also seen that it is not the shortest
(woman, 146 cm) test participant having the eye point most forward, it
is a woman of 157.8 cm. The difference in x-led is 95 mm.
Another correlation was investigated regarding eye points. The team
thought that if all eye points of shorter people who thought they should
sit better at a higher position and those of taller people who thought
they should sit better at a lower position were discarded, the remaining
eye points would represent an area where test participants would prefer
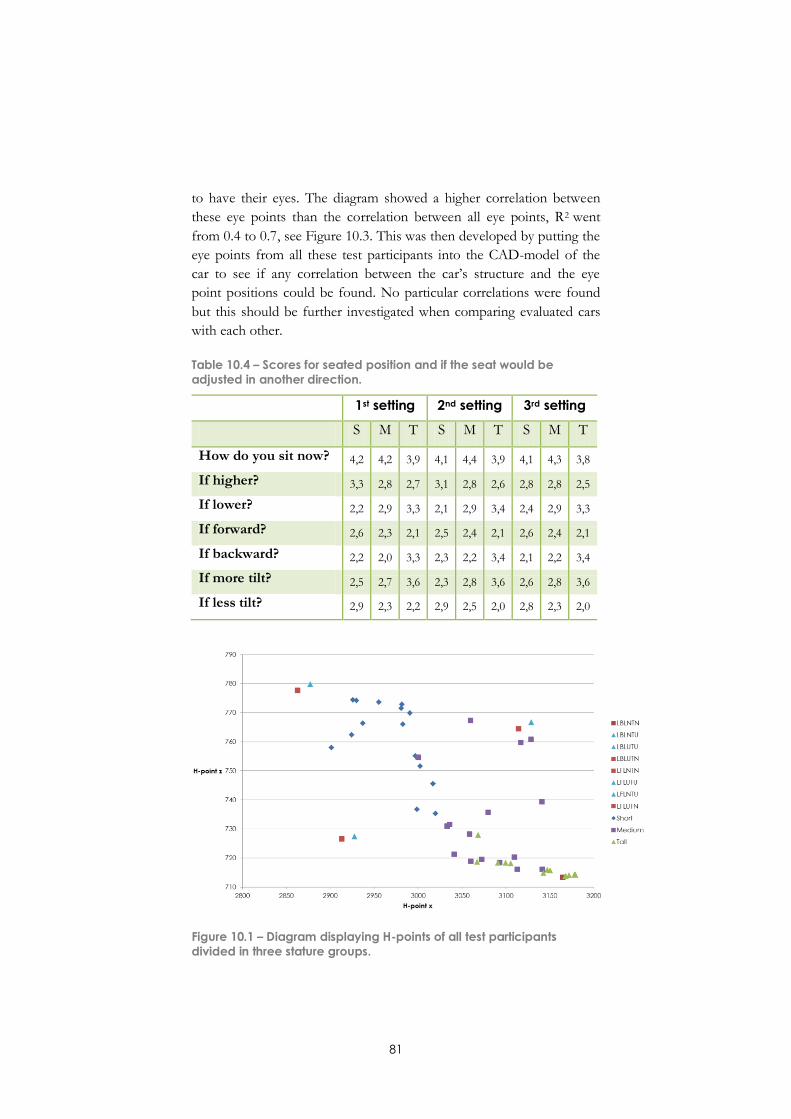
81
to have their eyes. The diagram showed a higher correlation between
these eye points than the correlation between all eye points, R2 went
from 0.4 to 0.7, see Figure 10.3. This was then developed by putting the
eye points from all these test participants into the CAD-model of the
car to see if any correlation between the car’s structure and the eye
point positions could be found. No particular correlations were found
but this should be further investigated when comparing evaluated cars
with each other.
Table 10.4 – Scores for seated position and if the seat would be
adjusted in another direction.
1st setting 2nd setting 3rd setting
S M T S M T S M T
How do you sit now? 4,2 4,2 3,9 4,1 4,4 3,9 4,1 4,3 3,8
If higher? 3,3 2,8 2,7 3,1 2,8 2,6 2,8 2,8 2,5
If lower? 2,2 2,9 3,3 2,1 2,9 3,4 2,4 2,9 3,3
If forward? 2,6 2,3 2,1 2,5 2,4 2,1 2,6 2,4 2,1
If backward? 2,2 2,0 3,3 2,3 2,2 3,4 2,1 2,2 3,4
If more tilt? 2,5 2,7 3,6 2,3 2,8 3,6 2,6 2,8 3,6
If less tilt? 2,9 2,3 2,2 2,9 2,5 2,0 2,8 2,3 2,0
Figure 10.1 – Diagram displaying H-points of all test participants
divided in three stature groups.
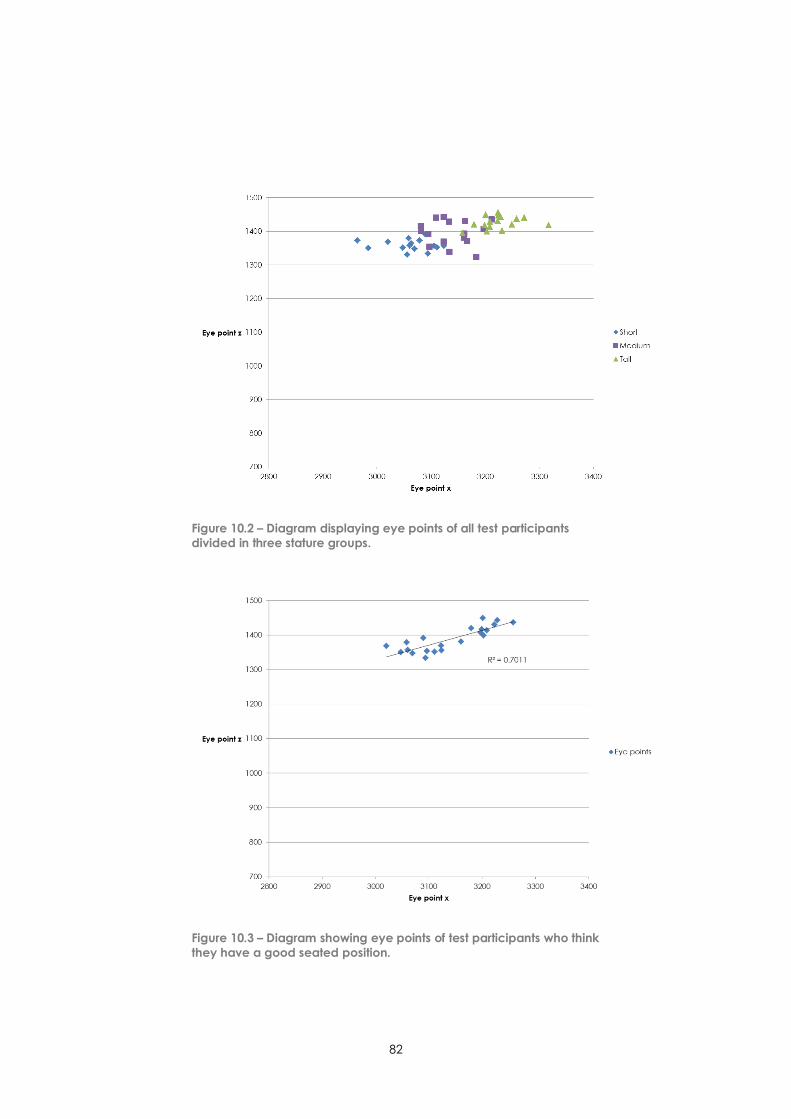
82
Figure 10.2 – Diagram displaying eye points of all test participants
divided in three stature groups.
Figure 10.3 – Diagram showing eye points of test participants who think
they have a good seated position.
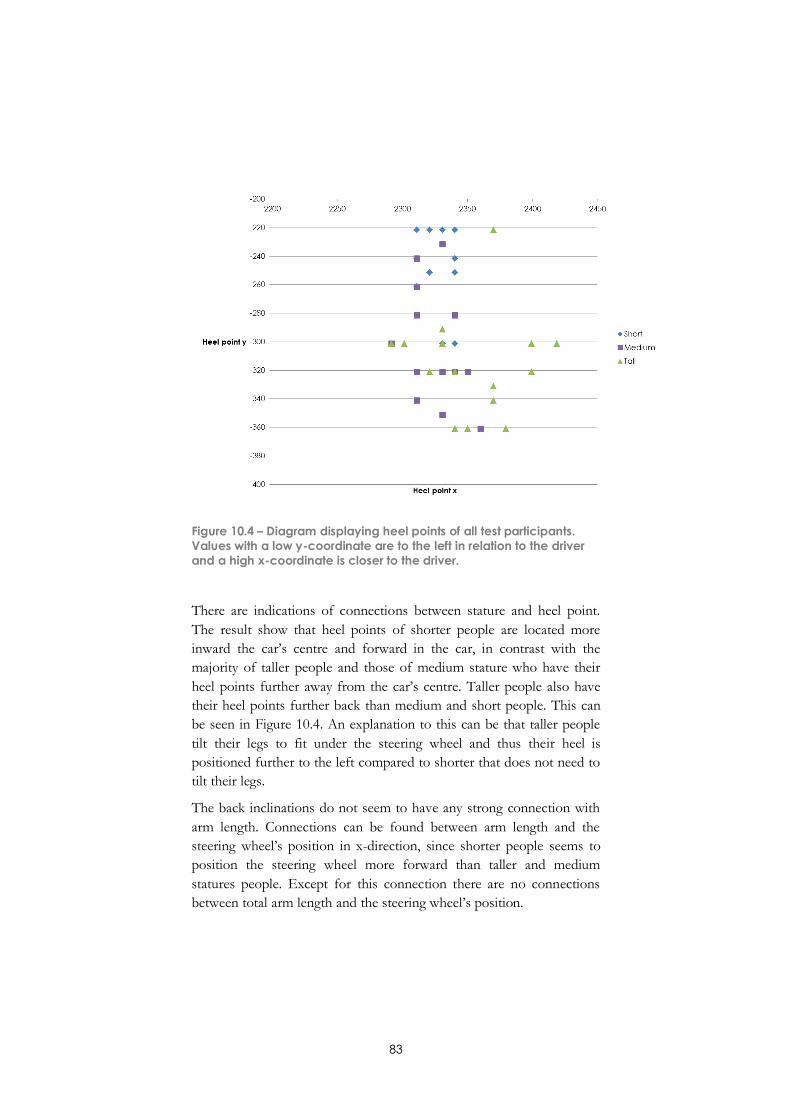
83
Figure 10.4 – Diagram displaying heel points of all test participants.
Values with a low y-coordinate are to the left in relation to the driver
and a high x-coordinate is closer to the driver.
There are indications of connections between stature and heel point.
The result show that heel points of shorter people are located more
inward the car’s centre and forward in the car, in contrast with the
majority of taller people and those of medium stature who have their
heel points further away from the car’s centre. Taller people also have
their heel points further back than medium and short people. This can
be seen in Figure 10.4. An explanation to this can be that taller people
tilt their legs to fit under the steering wheel and thus their heel is
positioned further to the left compared to shorter that does not need to
tilt their legs.
The back inclinations do not seem to have any strong connection with
arm length. Connections can be found between arm length and the
steering wheel’s position in x-direction, since shorter people seems to
position the steering wheel more forward than taller and medium
statures people. Except for this connection there are no connections
between total arm length and the steering wheel’s position.
84
10.5 Assumption: Limitations of the car is a factor
6) Limitations of the car such as sight considering A-pillars, hood
height and roof height affect the seated position.
These factors affect the seated position. Especially shorter test
participants have mentioned that they adjusted themselves higher
because of the hood height.
7) The adjustment range of the seat and steering wheel affects the
seat adjustment.
This clinic shows that the adjustment range of XC60 was too narrow to
satisfy the short and the tall. Of those who answered no to the question
“do you sit where you want to sit?” five have been short, six tall and
two medium statured men. The tall want to adjust themselves further
back, three want to have more tilt (thigh support) and four want to
adjust themselves further downwards. The short want to adjust
themselves further up (3) for better sight over the hood and more tilt
downwards (3).
The adjustment range for the steering wheel also seemed to be too
small for XC60. Four short commented that they would want to adjust
the steering wheel further from themselves and downwards. Tall people
wanted it closer to them and further up to avoid contact with knees.
Medium statured men wanted it further down and closer. Three have
commented that they would like to adjust the angle of the steering
wheel.
Many test participants adjusted the steering wheel but did this after they
had adjusted the seat. Depending on how much they adjust the steering
wheel they sometimes have to adjust the seat again to match the two
settings.
10.6 Assumption: Personal attitude is a factor
8) Personal style and attitude affect the seated position.
Many of the test participants feel comfortable, safe, relaxed and in
control of the car, independent of where they sit. The result shows that
a person can feel in a certain way but be positioned differently than
others that feel the same. There are no tall test participants that feel
“sporty” or “speedy” and no short test participants feel precautious.
Overall participants have answered very similar between the groups as
well as between genders, see Table 10.5.
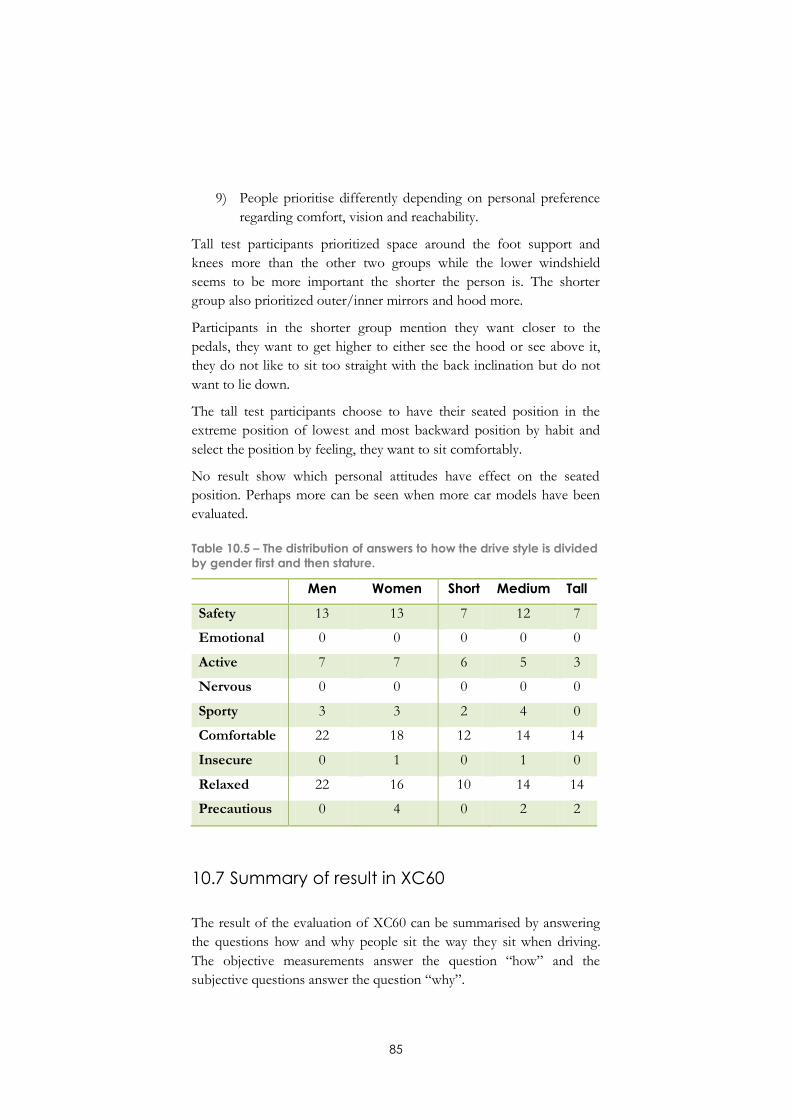
85
9) People prioritise differently depending on personal preference
regarding comfort, vision and reachability.
Tall test participants prioritized space around the foot support and
knees more than the other two groups while the lower windshield
seems to be more important the shorter the person is. The shorter
group also prioritized outer/inner mirrors and hood more.
Participants in the shorter group mention they want closer to the
pedals, they want to get higher to either see the hood or see above it,
they do not like to sit too straight with the back inclination but do not
want to lie down.
The tall test participants choose to have their seated position in the
extreme position of lowest and most backward position by habit and
select the position by feeling, they want to sit comfortably.
No result show which personal attitudes have effect on the seated
position. Perhaps more can be seen when more car models have been
evaluated.
Table 10.5 – The distribution of answers to how the drive style is divided
by gender first and then stature.
Men Women Short Medium Tall
Safety 13 13 7 12 7
Emotional 0 0 0 0 0
Active 7 7 6 5 3
Nervous 0 0 0 0 0
Sporty 3 3 2 4 0
Comfortable 22 18 12 14 14
Insecure 0 1 0 1 0
Relaxed 22 16 10 14 14
Precautious 0 4 0 2 2
10.7 Summary of result in XC60
The result of the evaluation of XC60 can be summarised by answering
the questions how and why people sit the way they sit when driving.
The objective measurements answer the question “how” and the
subjective questions answer the question “why”.
86
10.7.1 How people sit
H-point and seat adjustments depend on stature, tall participants adjust
the seat down and back and short participants adjust themselves
forward and upward, see Figure 10.1. The extreme percentiles tend to
use the whole adjustment range and are restricted by the limits. Short
people and those who want to have a better visual view want to sit
higher than possible and tall people want to sit lower and/or further
back than is possible.
The eye points also depend on stature where tall participants have their
eye points both higher and further back than short participants, see
Figure 10.2. When removing the eye points of those who would sit
better elsewhere the eye points strive to be on a line, with an R2 value of
0.7, see Figure 10.3.
Tall test participants have their heel points further to the left than short
people. Short people have their heels closer to the pedals and in roughly
the same y-coordinate as the pedal, see Figure 10.4.
10.7.2 Why people choose their seated position
Test participants expressed that reachability to pedals and steering
wheel are the most important parameters for the seated position. The
visual references affected the seated position for a number of people
who explained that they wanted to have control and feel in control of
the surroundings by seeing more over the hood. Others felt more
comfortable when sitting low and had the seat in the lowest position
independent of stature height. The limited adjustment range affects the
seated position.
Why people strive for having their eye points on this line should be
further evaluated. The distance to the headrest varies between the test
participants and half of them experienced that it was not placed the way
they wanted to. Some wanted to be closer to it and some wanted the
opposite.
A reason for the placement of heel point could be that short people
cannot reach the pedal unless they are placed close in y-direction and
that tall people have feet big enough to flip their foot from the break to
the gas without moving the foot. Another reason could be that tall
people cannot fit their long legs under the steering wheel without
bending the leg and that the heel therefore needs to be placed further to
the left. This should be further evaluated.
87
11 Recommendations
Recommendations for future analysing and for VCC Ergonomics are
listed below.
The reference grid should have smaller squares to enable
making better transforming between pixel coordinates to car
coordinates, especially because of the smaller adjustment area
of the steering wheel. The squares should also be on both sides
of the sheet, making it easier to put in the correct position on
the measuring stand.
The measuring stand used for holding the reference plane
should be improved to allow more exact positioning and be-
come more stable.
The measurement area of heel points should be resized and
made larger. Some test participants had their heels in the very
outer area of the measured points.
For the measurement it is recommended to include a measur-
ing of how much the seat’s tilt function affect the H-point on
the manikin sitting in SRP.
During the clinic it is recommended to have a smaller comput-
er in the front seat for test participants to use. This will make it
easier to move and handle for test participants.
A new version of Excel, version 2010 or later, should be in-
stalled on the CAN computer. This allows the test leader to
work with the SPEED Compilation document and transfer
notes from the clinic while test participants answer other ques-
tions on their own. This because notes might also be difficult
to interpret when they are not fresh and newly written.
VCC Ergonomics should use analyse programs such as
MiniTab or SIMCA to analyse the results further and see corre-
lations between more parameters at the same time.
Further analysis should be made regarding eye point position in
relation to the estimated line.
VCC should discuss VCC Crash and Safety whether the video recording
show any relevant data and are necessary to include in the method.

88
89
12 Discussion
This chapter discusses the final result of SPEED, the design and how
the methods and tools worked during the development. The develop-
ment process, the priorities during the work and the consequences of
different choices will also be discussed. The team will consider the
benefit of the method to its need of usability.
12.1 Result discussion
This work has resulted in a method, named SPEED, which includes
complete instructions of how the method is performed, Excel programs
for calculations of specific points, prepared documents and programs
for evaluations and for analysing results. The evaluations of the clinic
and the clinic instructions with master students proved that it was easy
to perform the clinic and that the instructions were sufficient. In this
stage the method SPEED gives answers to how people sit when driving
but not as much about why people sit the way they do.
12.1.1 Design
The design of SPEED was to be simple and the need for a high
usability was specified. The whole method and its instructions are made
and written by the team, who also has experience as summer employees
of VCC Ergonomics, which leads to the instructions being easy to
understand and not too advanced. The instructions are based on the
level of knowledge the team had before they started working as summer
employees. For an example the instructions also includes names and
contact information of people that are to be contacted and prepared
lists and instructions of what these people should do to contribute.
To keep the method’s usability high, including time efficiency and easy
understanding some tools that were investigated early in the process,
such as eye tracking, was excluded. Keeping usability in mind when
developing SPEED might have restricted the team. If the method was
for someone working at VCC Ergonomics with good knowledge of
everything that needs to be done, not as much time would have been
put to write clear instructions for every procedure.
90
Due to the time constraint of 45 minutes per test participant and 160
hours in total for preparation, clinic and analysis, certain parameters
cannot be investigated. If it was possible to have test participants for
more than 45 minutes more data and situations could be investigated.
All data elicited in the method cannot be analysed due to constraints in
programs and in time. One example is when only the third setting is
analysed in the current method. Maybe other connections could be
found if time was put to analyse the other settings as well.
Since the method is not supposed to measure the seat comfort, due to
this being VCC Seating Comfort’s area of expertise, the team tried to
not have this included in the method. Comfort is something that is
individual and very difficult to measure. The team decided that the
method should include instructions for the test participants to put the
seat in a position where they want to have it when driving. The
information elicited from the method is the objective measurements of
where test participants sit and also how good they think their seated
position is.
The team’s choices during the development have had effects on how
the method became. One example, mentioned in chapter 7, is whether
the team was to use eye tracking or not. In the first stage eye tracking
seemed to be a good tool, the possibilities were discussed in several
meetings. The tool seemed very easy to handle in the beginning and it
was decided to use it together with all test participants and to help the
team measuring eye points. During the development of SPEED the use
of this tool went from using it on all test participants, to use it only on a
few and at last to not use it at all.
In evaluations of this tool the team could determine that it could not be
used for eliciting eye points, calibration was time consuming and if not
calibrated correctly it was inaccurate when showing where the eye was
resting. Therefore eye tracking was discarded. By discarding this
method the team had to go back and use another method, measuring
eye points with help of photographs. When the eye tracking device was
correctly calibrated it did however show where the eye rested, areas of
interests could be programmed and information about how many times
and for how long the eye rested in the area of interest. If the method of
eye tracking was further developed tacit knowledge about why people
adjust themselves could be elicited by being able to see what they look
at when adjusting themselves. Possible sight targets could then be
observed and included as a task for RAMSIS.
Because of the limited time frame there was a balance act between the
quality level and the time. If more time had been available a more exact
position of the steering wheel could be established by developing an
91
additional method whereas now the position is elicited simultaneously
with the eye point. This was a conscious decision for saving time yet
gain “good enough” result because even if the exact position is elicited
the rough placement of the steering wheel is gained. Another reason for
wanting to keep the method easy to use is the level of competence of
the user. The users of SPEED could be an experienced employee at
VCC Ergonomics but could as well be a summer employee why the
method should be adapted for the knowledge of the inexperienced user.
This means that the complication level of computer programs should
be kept to minimum and detailed instructions to be included. The more
detailed information that is to be elicited the more accuracy and
preparations are needed and thus decreasing the level of usability.
12.1.2 Elicited data
The method elicit much information, including measurements of where
test participants sit, their subjective thought of different parameters in
the car and these parameters’ contribution to their seated position. One
problem with the previous method was that a lot of data were gathered
but not used. This is a problem with the new method, but since the
team was not supposed to make the further analysis, parameters can
later be seen as unnecessary.
The team has understood that the information regarding where and
how people position themselves is to some part silence knowledge and
is therefore difficult to elicit. Test participants are describing this as
“deciding the position by feeling” and cannot clearly describe why. But
yet the team has made success when it comes to understand where
people sit and also being able to find correlations between different
groups and certain parameters. The method is successful since it can
show where people sit and also show correlations and information of
what is important to them when it comes to finding a comfortable
seated position in the specific car being evaluated.
The information elicited from SPEED has been compared with
information from deeper evaluations with other master thesis workers
at VCC. Comparing these types of evaluations showed results that
strengthen SPEED’s elicited data. The same data was possible to elicit
and was elicited from both evaluations.
In comparison with the previous method, which had the test partici-
pants answering to a test leader who later wrote down the answers,
SPEED is developed in a way where test participants answers the
questions directly on a computer. Now test participants do not have to
formulate answers to a test leader. This way test participants answer
themselves and they seem to feel free to write what they want. The way
92
of answering questions directly was also appreciated by the test
participants evaluating SPEED in an early stage.
The video recordings have not yet been analysed. The camera recording
the clinic often malfunctioned due to its low battery capacity. Since
VCC Ergonomics are not interested in behaviour, which is the camera’s
purpose for VCC Crash and Safety, the time used to install and handle
the camera can be put on other things during the clinic if it does not
give any relevant information.
12.1.3 Sustainable development
SPEED is developed to be used for all cars made by VCC to investigate
information from different types of cars and then compare this
information. The method will enable to make changes early in the
developing process of a new car, to give information of where and how
people want to sit. When having this information early in the develop-
ing process, VCC can reduce developing costs to material and time put
on development, when making changes before the process have gone
too far. It will prevent some late changes, which often are expensive.
The method is made to fit all type of VCC’s cars and it is adaptable to
future features in the cars. Since the method includes instructions of
how it is built it will be easy to change if conditions change. SPEED
uses less printed pages than previous methods. There will only be one
sheet printed per test participant and instructions for the test leader.
The rest of the method is performed digitally.
12.2 Method and process discussion
As described in chapter 3, a defined development process has been
used for the work. The process has helped the team structure the work
and not forget important stages in the development process. The
process stated was an outline and was adapted to this work. Same stages
in the process were kept but the order and the names of the parts were
changed, explained in chapter 3.
The process was conducted in a way which can be seen as a funnel,
where the team started with much information during the needfinding
stage. In this first stage investigations of previous clinics and literature
studies were conducted. After the needfinding the team could narrow
the work and had better knowledge of what was important and thereby
assumptions could be created. Assumptions were created to falsify and
strengthen parameters affecting the seated position, later these were set
as base for further developing and analysis. The work was more
93
narrowed when the concept generation started and led to the final
method SPEED with a commissioning in Volvo XC60. The use of
SPEED was the last part of the work and thereby the outer end and tip
of the funnel. Along the project the team has had continuous
documentation and evaluations which have helped eliciting correct
information and structure the work during the whole process.
12.2.1 Needfinding
Needfinding was the first part in the process where all needs for the
project were to be listed. The needs came from literature regarding car
evaluations, automotive ergonomics and looking into previous clinics
and methods used at VCC. The car manufacturers that the team looked
into seemed to do similar things and elicit similar information from
seated evaluations in a wide aspect. There were no problems finding
literature on the subject and VCC had literature and documentations
from investigations.
VCC Ergonomics expressed needs from the beginning regarding the
basic structure of the method, such as the total time it should take. As
explained earlier in chapter 7, the team developed a proposal for which
questions and measurements were important to elicit in the clinic and
then discussed these during several workshops with VCC Ergonomics
and Crash and Safety. The needs set from VCC did not constrain the
team too much, it did not hinder the team in the evaluations but as in
many cases time was an important need. The time constraint governed
how much was possible to perform in the clinics, which in turn limited
how much information was possible to elicit.
If more time was available an interview could be combined with the
questionnaire to elicit more qualitative data. The information gained
from interviews should answer to why the seated position is chosen
more in detail even if the information wanted to some extent is tacit
knowledge for the test participant and therefore difficult to express.
Additional information in combination with more time to analyse the
result with e.g. SIMCA, to compare multiple parameters to each other,
could result in more reliable data and more clear answers to how people
sit when driving and why.
12.2.2 Assumptions
The next stage in the process was to write down and discuss what could
be of importance for positioning in cars. The team discussed what
parameters could affect the choice of seated position based on earlier
clinics. The use of assumptions provided structure for the development.
It was easy to strengthen that all sections were covered and that the
questionnaire elicits information regarding all assumptions.
94
Some assumptions were confirmed and for some of the assumptions no
correlations could be found. The team found different types of
correlations, both strong and weak. Indications of correlations were
also found, for example it could be seen that taller people positioned
their feet differently than shorter people. Indications such as this one
could be elicited and strengthened with help of all the different
documented data, such as measurements, comments and also photos
taken during the clinics.
Some of the assumptions were seen as not strengthened and some were
not possible to investigate due to only one car model being evaluated in
this work. The team felt that these assumptions should not be discarded
because correlations might be found in other car models and when
comparing evaluations of different car models. This is for VCC to
investigate in the further evaluations.
12.2.3 Overall design
In the section of overall design the framework for the method was
designed, deciding the big parts that were to be included. The design of
the method and the framework was compared to the assumptions
helping the team not to forget any important parts. The evaluations
gave valuable information regarding what was important both regarding
questions and measurements and instructions for how the method is to
be performed.
12.2.4 Detailed design
For the detailed design the team evaluated all tools that had potential
for the method. This was a rewarding part of the process since the team
came in contact with different departments at VCC and could look into
several interesting methods and tools. The team could in this stage of
the process eliminate tools that did not yield the sought result.
Continuous evaluations were held to keep the usability of the method
on track and to ensure the correct information were elicited. Because
the evaluations were held with master thesis workers of the sought
profile it could be ensured that the method was evaluated and
developed for future summer workers.
12.2.5 Commissioning
The result of the commissioning can be seen in chapter 10, where the
result of Volvo XC60 is presented. Using the method in XC60 worked
well and all equipment were easy to install. The time for the clinics was
enough and people thought it worked well to perform the method,
questions were understood and the instructions were sufficient.
95
12.2.6 Supervising
The team has had one supervisor at Chalmers, Lars-Ola Bligård, and
two supervisors and VCC Ergonomics, Magnus Jerksjö and Pernilla
Nurbo. The supervisor at Chalmers has helped the team in the
developing process and been of great support regarding keeping focus
on the method development. The team had continues meetings almost
every week with the supervisors at VCC Ergonomics. The regular
meetings have helped the team stay on track and also understand how
things are done at VCC, in what order particular parts of the method
need to be done.
12.3 Lessons learned
When conducting this work the team has got insight of being at a large
company, especially the importance of timing to be able to keep
deadlines. Booking of equipment and appointments need to be done
early due to lack of resources when many people desire to use the same
equipment. The team has also learned about method developing, its
similarities with product development including concept generations,
iterations of processes and evaluations.
In order to extract and display the wanted information the team has
learned how to use Excel, Photoshop and VCC specific software and
written detailed instructions to how to use these. Extracting the H-point
position proved to be more difficult than expected and demanded
involvement from different departments at VCC.
If this work was to be done now with the information that was learned
the same process would be used because of the structured work flow it
allowed. A few things would be altered, for example the development
of the “animated” choosing of preferred seated position would be
reduced or removed completely because of the time it consumed and
the limited use and benefit it would offer even if completed. Additional-
ly the camera placed in the roof would have been placed in another
location to fully utilize the benefits of the measurements of the
reference plane in y-direction. This to allow a more exact coordinate
position for other traffic situations, where the head is likely to be placed
sideways unlike when driving straight ahead.

96
97
13 Conclusion
The result of this work is a method, SPEED, which includes instruc-
tions of how the method is performed, documents for the test leader,
excel programs calculating objective measurements and a prepared
compilation document for analysing the result. VCC stated a need for
an easy performed method that everyone at VCC Ergonomics should
be able to use. To be sure that the instructions suits the employees all
instructions have been made regarding the kind of knowledge the team
had before being summer employees at VCC Ergonomics.
The final method, SPEED, is definitely usable for eliciting the
important and wanted information that VCC Ergonomics asked for in
the beginning; how a driver’s seated position is and why it is that way.
The team feels that SPEED shows how people sit and why they have
chosen their individual seated position. To find more answers of why
test participants sit the way they do further analysis is needed as well as
comparisons to other car models.
The result of the evaluations made in SPEED gives a basic analysis
which shows correlations between different groups of stature and
parameters in the car. The correlations that have been found are some
of those correlations that VCC Ergonomics was certain about but also
new interesting correlations that they have not seen before. Anthropo-
metric measurements affect the settings of the seat and steering wheel
hence affecting the eye point and H-point. New findings regarding eye
point (the test participants strived to have their eyes on a line) and heel
point position (the position in y-direction depended on stature) are for
VCC Ergonomics to further analyse.
SPEED is an easy performed method with high usability and made with
instructions enabling changes in the future to fit newer cars. The team is
satisfied with the work performed at VCC and consider SPEED to be a
successful method that delivers result that can be implemented in
computer analysis with RAMSIS. It will help VCC Ergonomics in their
future work of developing cars suitable for future drivers of new
explored markets.

98
99
14 References
14.1 Literature
Bergström, M., Grahn, N. (2003) Driving positions: correlation of real world
driving and laboratory testing. Luleå: Luleå Tekniska Universitet. (Master
thesis for the institution for Arbetsvetenskap. Ergonomisk design och
produktion)
Bhise, Vivek D. (2012) Ergonomics in the automotive design process. Boca
Raton: Taylor & Francis
Bligård, L-O. (2011) Utvecklingsprocessen ur ett människa-maskinperspektiv.
Göteborg: Institutionen för produkt- och produktionsutveckling
Coelho, D. A., Dahlman, S. (2000) Evaluation of methods, approaches
and simulation quality in the experimental evaluation of car seat
comfort and functionality. Proceedings of the Human Factors and Ergonomic
Society … Annual Meeting, 3, pp. 353-356
Gkikas, N. (2013) Automotive Ergonomics Driver-Vehicle Interaction.
London: Taylor & Francis
Jonsson, B., Stenlund, H., Svensson, M. Y. and Björnstid, U. (2007)
Backset and Cervical Retraction Capacity among Occupants in a
Modern Car, Traffic Injury Prevention, 8:1, pp. 87-93
Park et al. (2000) Comfortable driving postures for Koreans. Internation-
al Journal of Industrial Ergonomics, vol 26, pp.489-497
Peacock, B., Karwowski, W. (1993) Automotive ergonomics. London:
Taylor & Francis
Reed, M. P. (1998) Statistical and Biomechanical Prediction of Automobile
Driving Posture. Michigan: The University of Michigan. (A dissertation
submitted in partial fulfillment of the requirements for the degree of
Doctor of Philosophy)
SAE International (2013) Occupant/Interior Vehicle Packaging: Designing for
the Customer, http://training.sae.org/seminars/c0108/, 21 May 2013
Trost, J., Hultåker, O. (2007) Enkätboken. Lund: Studentlitteratur.
100
Van Niekerk, S-M., Louw, Q., Vaughan, C. Grimmer-Somers, K.,
Schreve, K. (2008) Photographic measurement of upper-body sitting
posture of high school students: A reliability and validity study, BMC
Musculoskeletal disorders, vol 9:113
14.2 Oral resources
Bligård, Lars-Ola, (Design and Human Factors, Chalmers) supervisor and
examiner at Chalmers University of Technology
Eriksson, Lotta, (Crash and Safety, VCC) included in workshop 20th of
February 2013.
Hansson, Ida (Design and Human Factors, Chalmers) interviewed 28th of
February 2013.
Jerksjö, Magnus (Ergonomics, VCC) supervisor at Volvo Car
Corporation
Nurbo, Pernilla (Ergonomics, VCC) supervisor at Volvo Car
Corporation
Kristiansson, Erik (Matematisk Statistik, Chalmers), interviewed 21st of
February 2013.
Wallgren, Pontus (Design and Human Factors, Chalmers) interviewed 28th
of February 2013.
101
15 Appendix
Appendix A: Questionnaire evaluation sheet
Appendix B: Matrix for tool selection
Appendix C: SPEED Note sheet
Appendix D: SPEED Questionnaire
Appendix E: SPEED Compilation document
Appendix F: SPEED Coordinates document
Appendix G: SPEED Instruction document

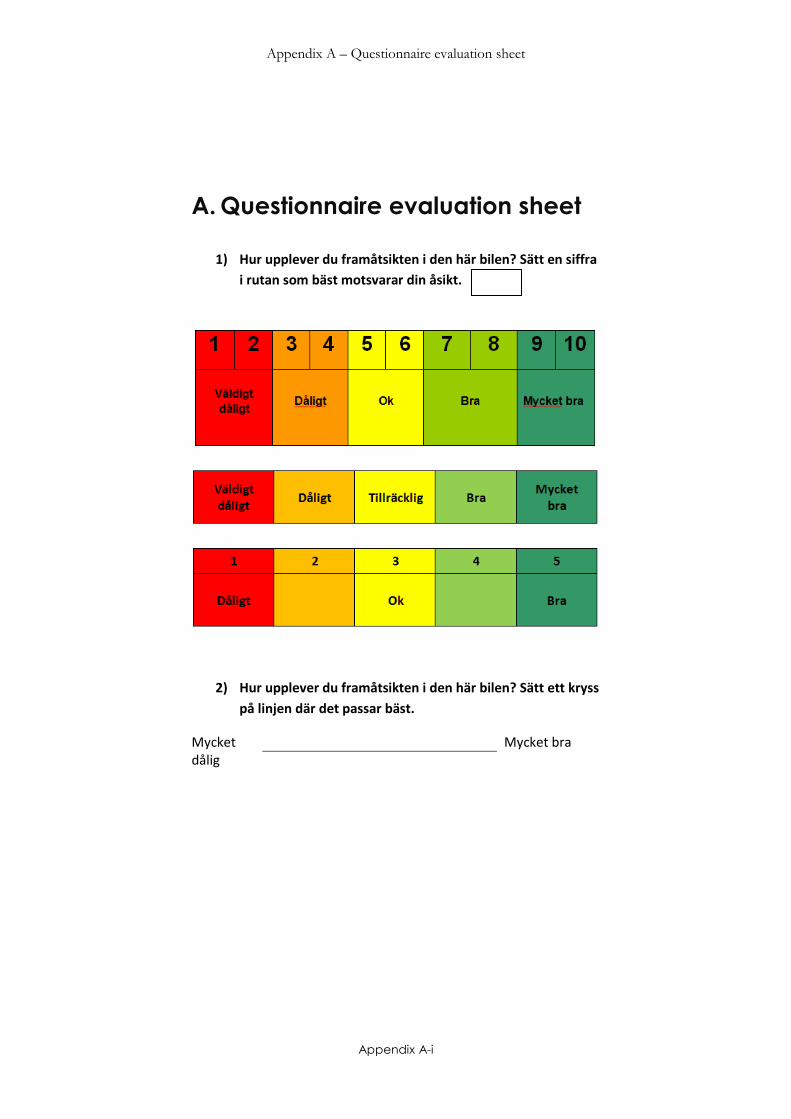
Appendix A – Questionnaire evaluation sheet
Appendix A-i
A. Questionnaire evaluation sheet
1) Hur upplever du framåtsikten i den här bilen? Sätt en siffra
i rutan som bäst motsvarar din åsikt.
2) Hur upplever du framåtsikten i den här bilen? Sätt ett kryss
på linjen där det passar bäst.
Mycket dålig
Mycket bra
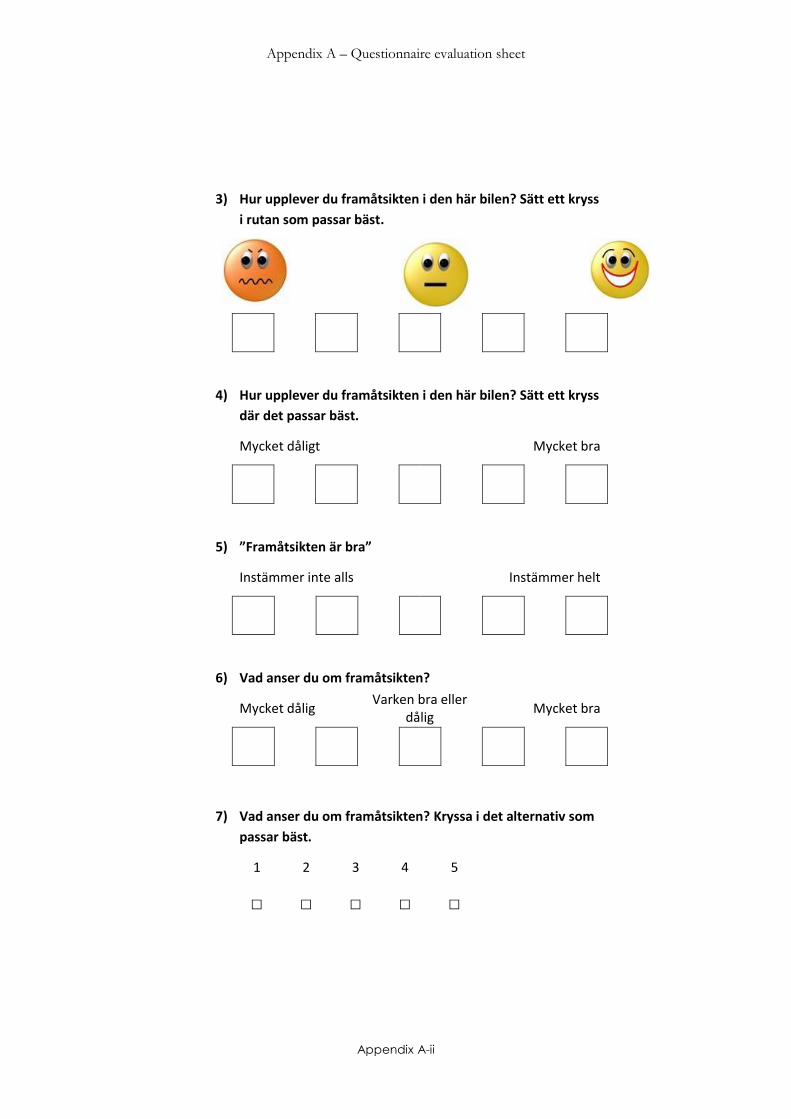
Appendix A – Questionnaire evaluation sheet
Appendix A-ii
3) Hur upplever du framåtsikten i den här bilen? Sätt ett kryss
i rutan som passar bäst.
4) Hur upplever du framåtsikten i den här bilen? Sätt ett kryss
där det passar bäst.
Mycket dåligt Mycket bra
5) ”Framåtsikten är bra”
Instämmer inte alls Instämmer helt
6) Vad anser du om framåtsikten?
Mycket dålig Varken bra eller
dålig Mycket bra
7) Vad anser du om framåtsikten? Kryssa i det alternativ som
passar bäst.
1 2 3 4 5
q q q q q
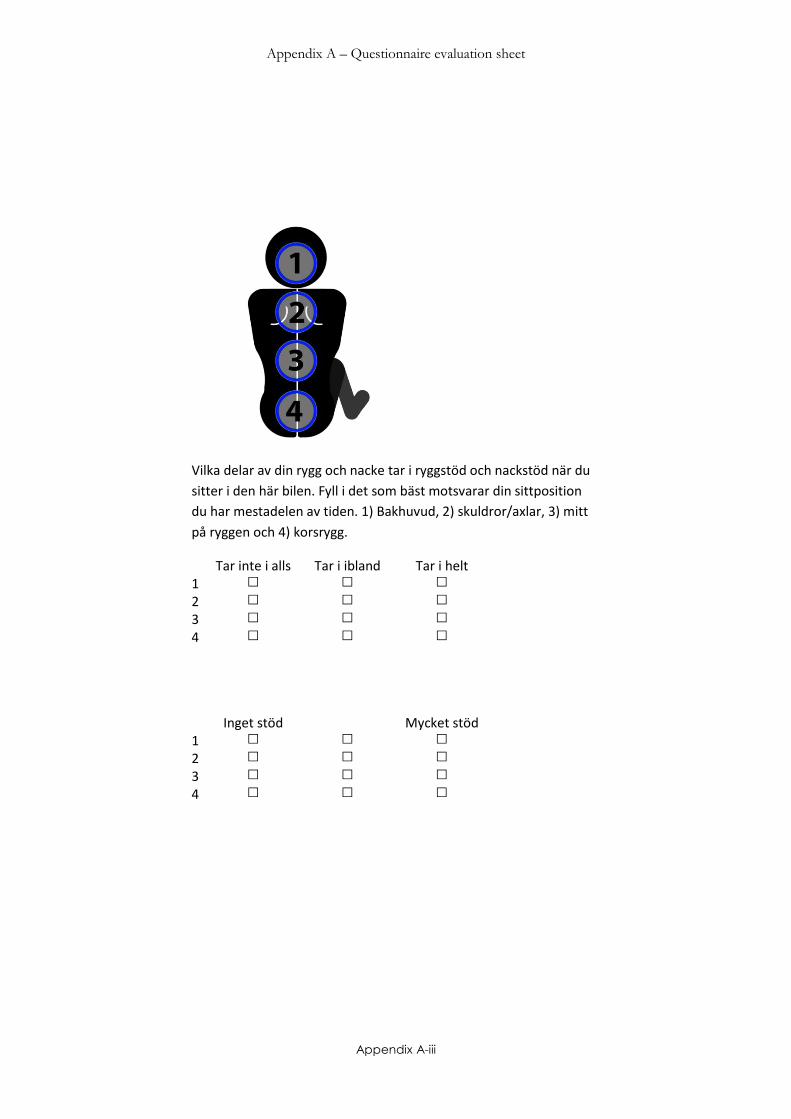
Appendix A – Questionnaire evaluation sheet
Appendix A-iii
Vilka delar av din rygg och nacke tar i ryggstöd och nackstöd när du
sitter i den här bilen. Fyll i det som bäst motsvarar din sittposition
du har mestadelen av tiden. 1) Bakhuvud, 2) skuldror/axlar, 3) mitt
på ryggen och 4) korsrygg.
Tar inte i alls Tar i ibland Tar i helt 1 q q q
2 q q q
3 q q q
4 q q q
Inget stöd Mycket stöd 1 q q q
2 q q q
3 q q q
4 q q q

Appendix A – Questionnaire evaluation sheet
Appendix A-iv
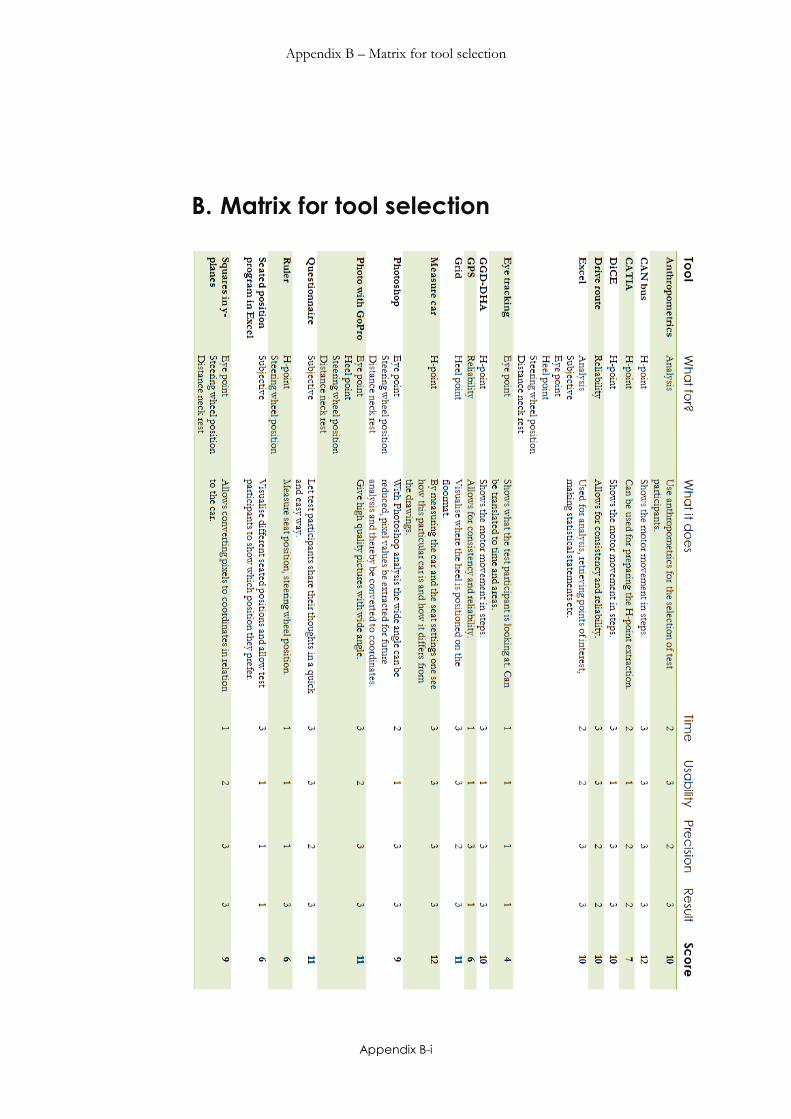
Appendix B – Matrix for tool selection
Appendix B-i
B. Matrix for tool selection

Appendix B – Matrix for tool selection
Appendix B-ii
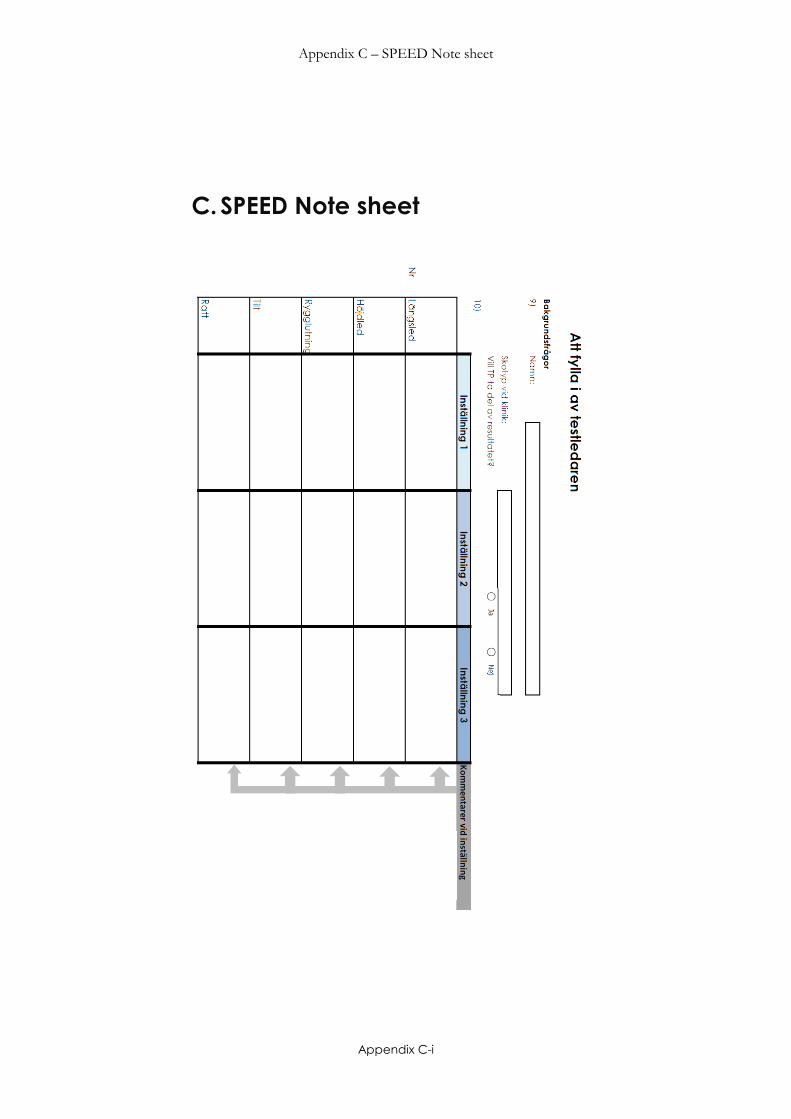
Appendix C – SPEED Note sheet
Appendix C-i
C. SPEED Note sheet
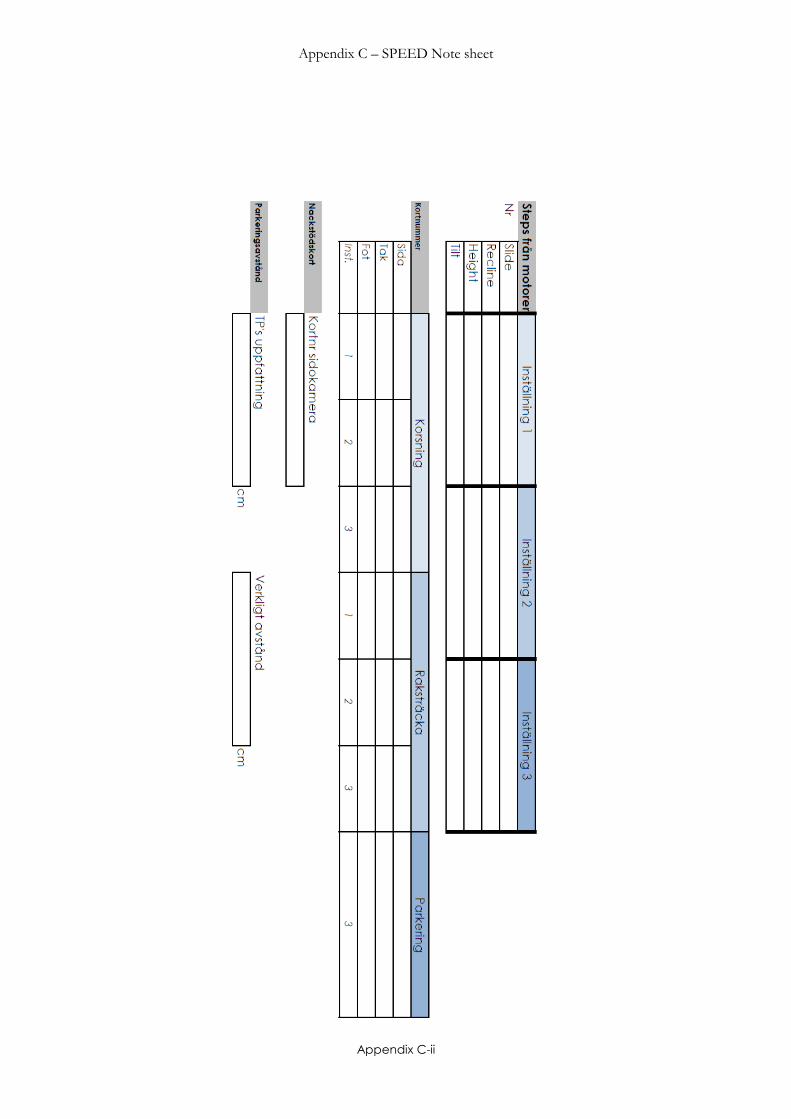
Appendix C – SPEED Note sheet
Appendix C-ii
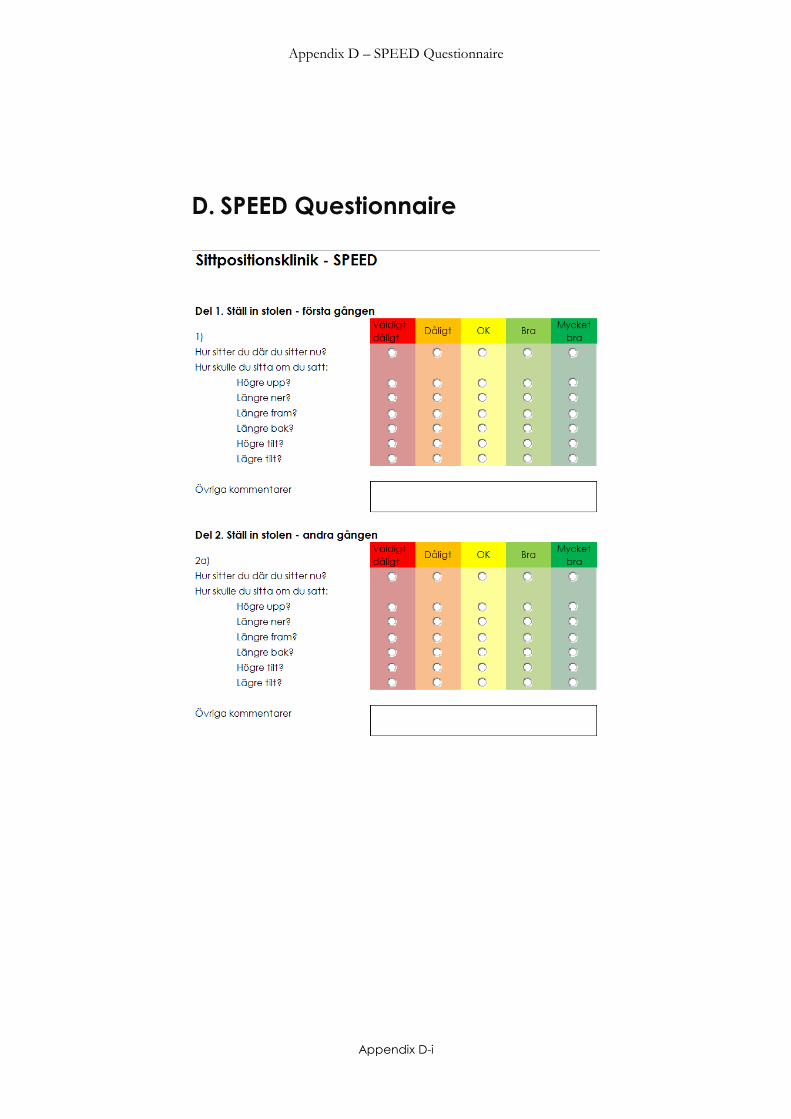
Appendix D – SPEED Questionnaire
Appendix D-i
D. SPEED Questionnaire

Appendix D – SPEED Questionnaire
Appendix D-ii
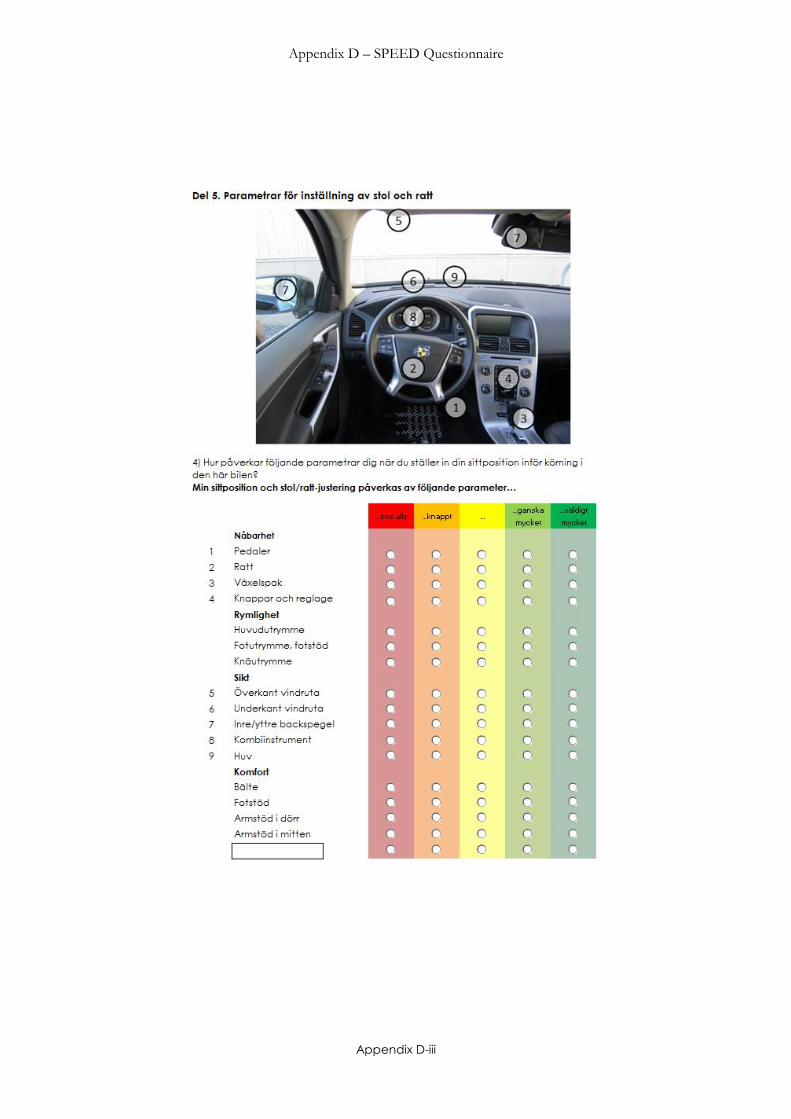
Appendix D – SPEED Questionnaire
Appendix D-iii
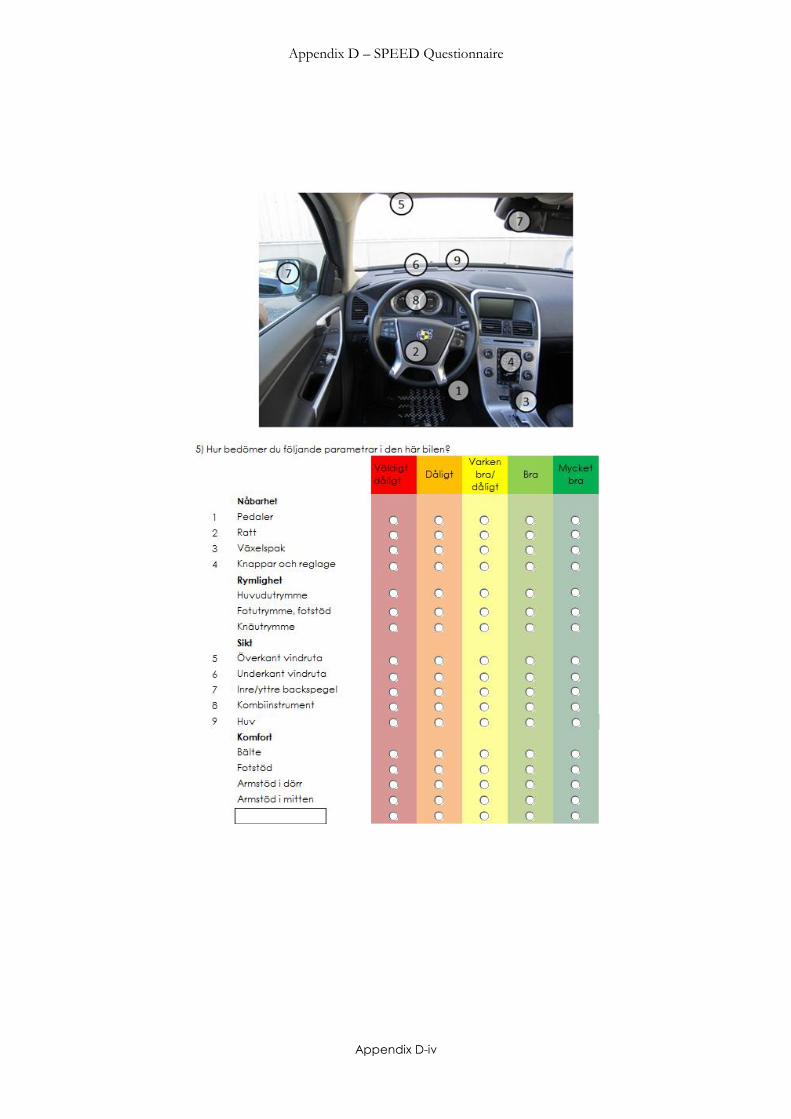
Appendix D – SPEED Questionnaire
Appendix D-iv
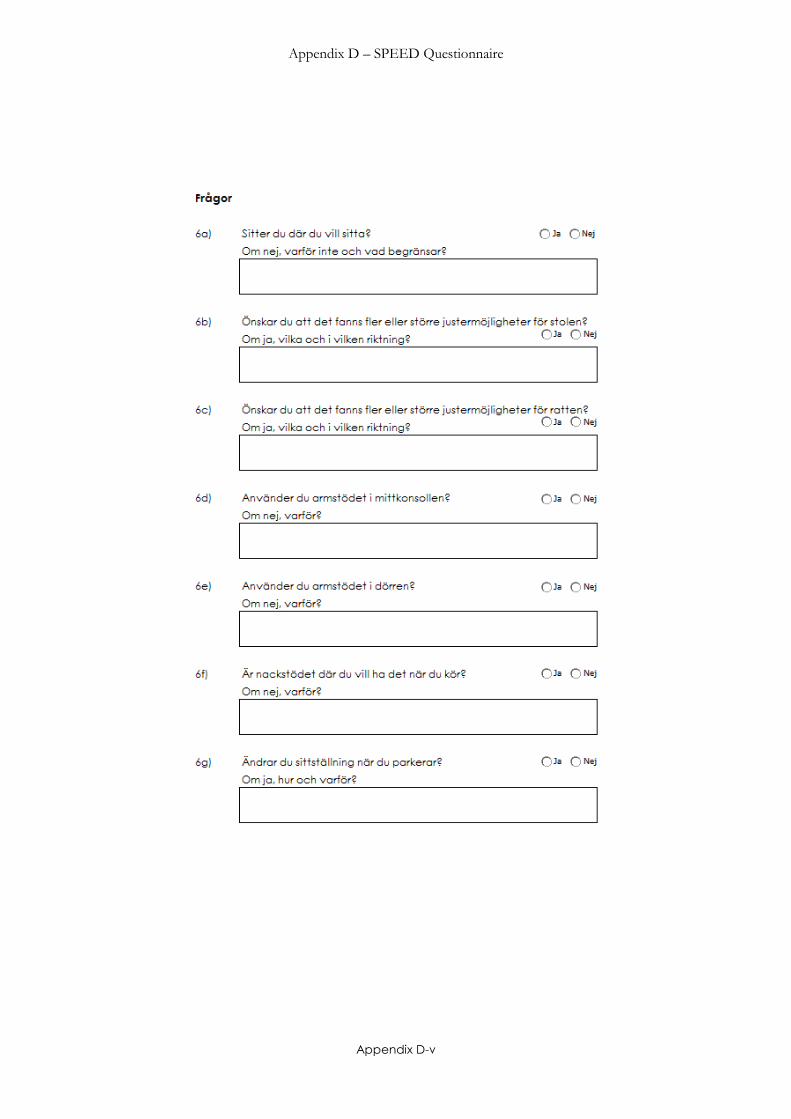
Appendix D – SPEED Questionnaire
Appendix D-v
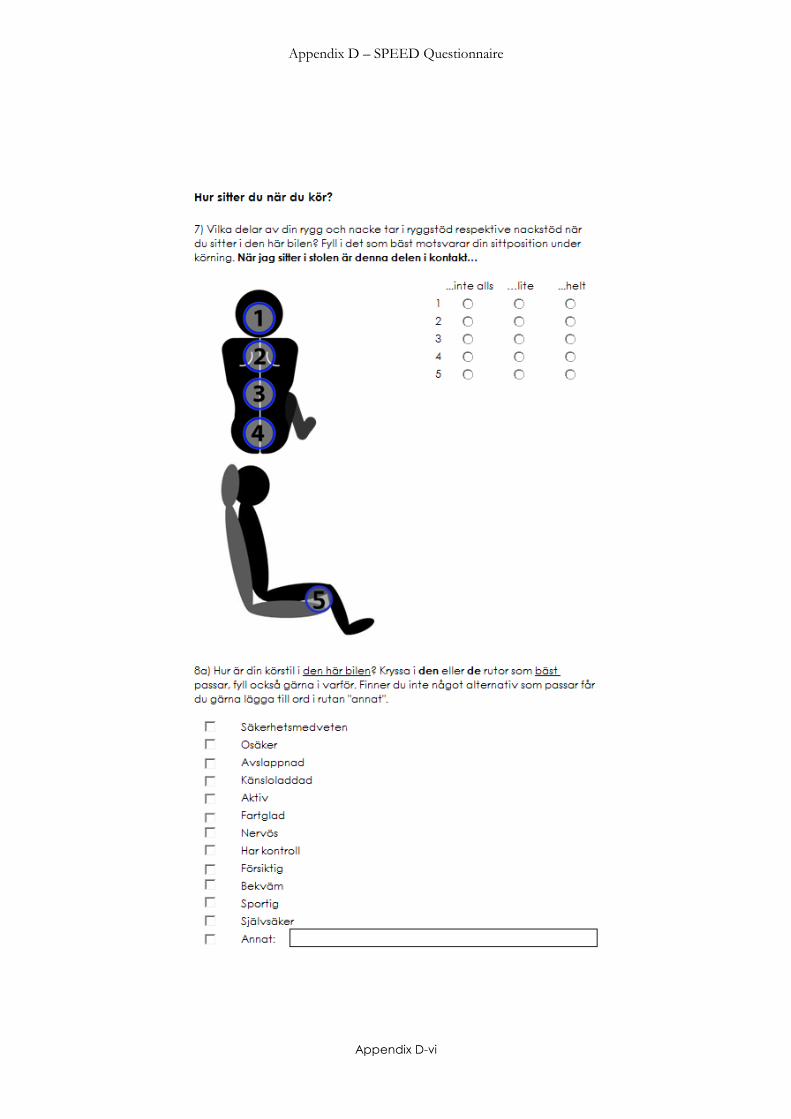
Appendix D – SPEED Questionnaire
Appendix D-vi
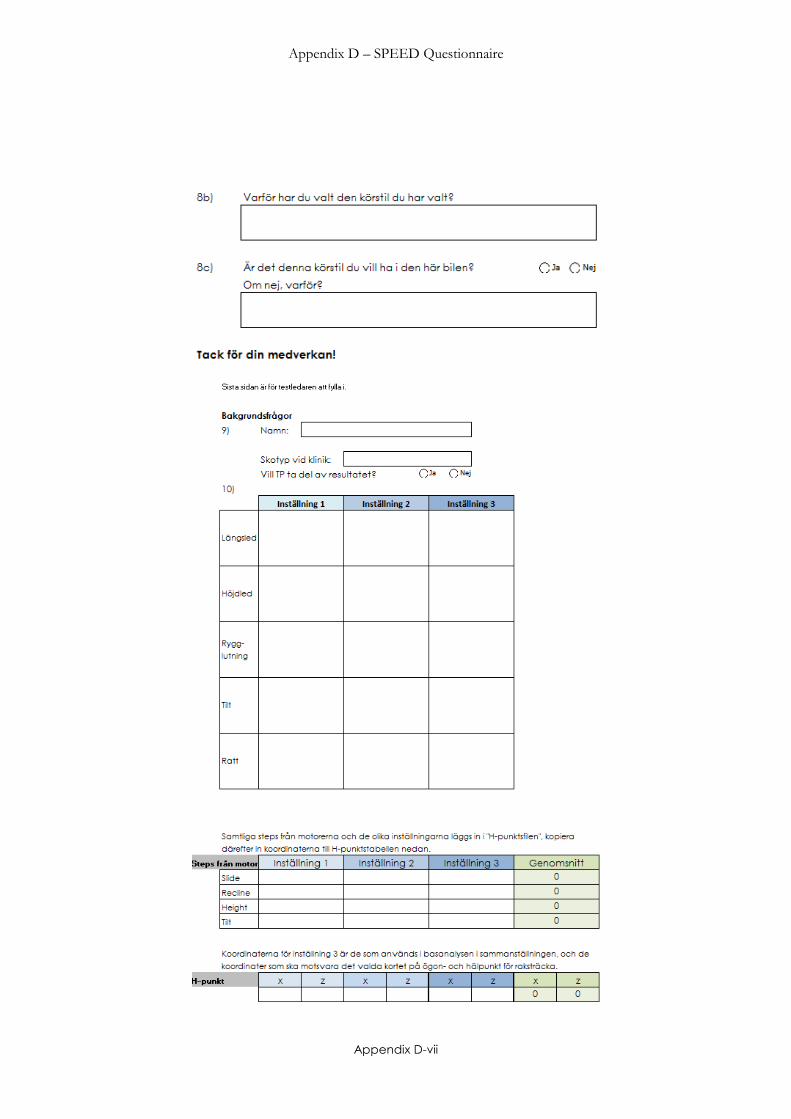
Appendix D – SPEED Questionnaire
Appendix D-vii
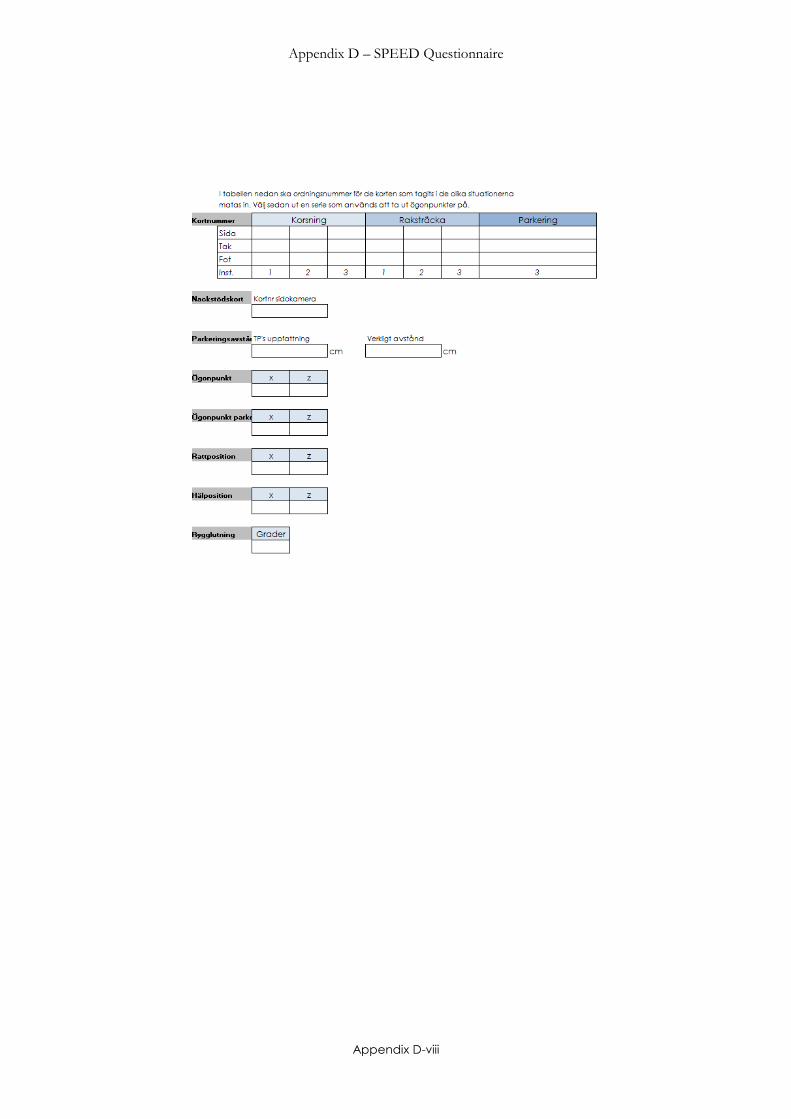
Appendix D – SPEED Questionnaire
Appendix D-viii
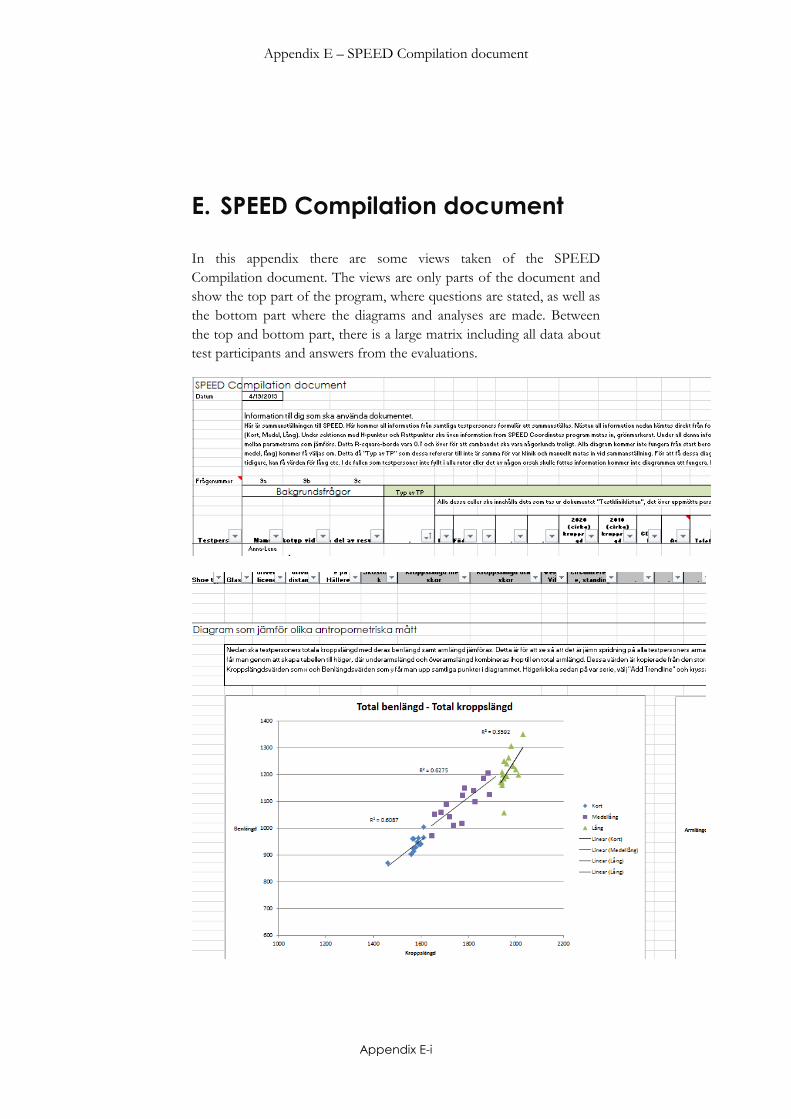
Appendix E – SPEED Compilation document
Appendix E-i
E. SPEED Compilation document
In this appendix there are some views taken of the SPEED
Compilation document. The views are only parts of the document and
show the top part of the program, where questions are stated, as well as
the bottom part where the diagrams and analyses are made. Between
the top and bottom part, there is a large matrix including all data about
test participants and answers from the evaluations.
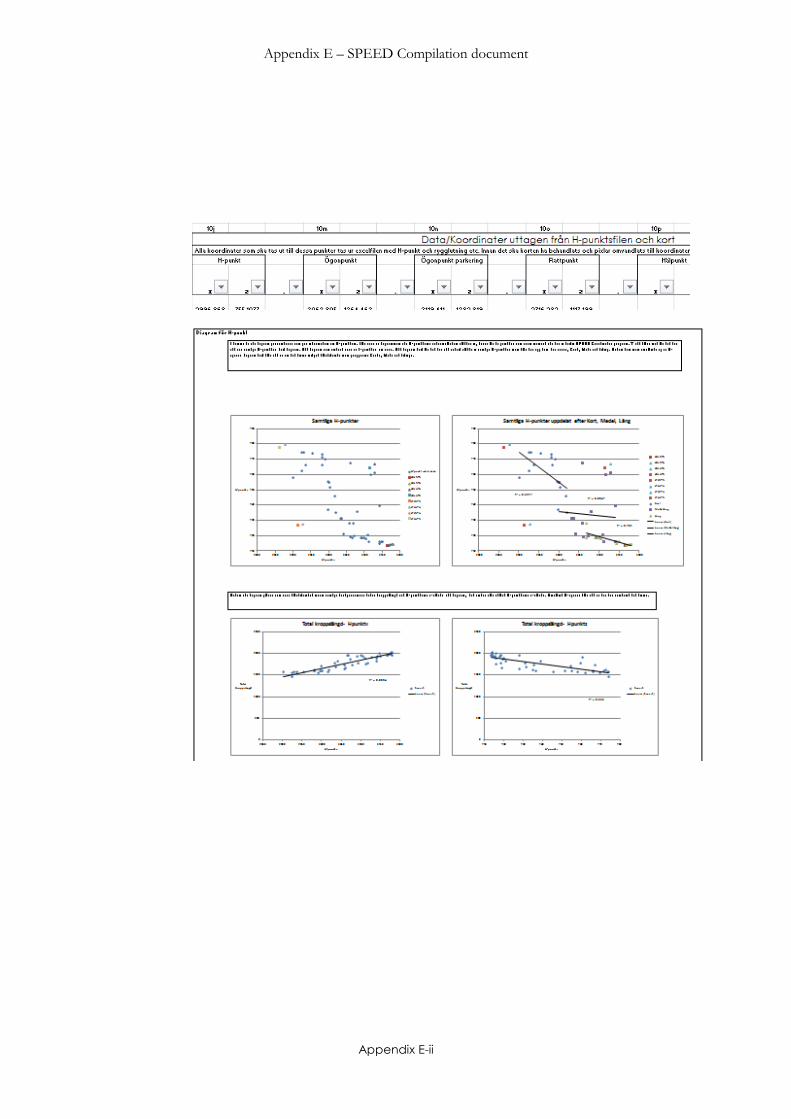
Appendix E – SPEED Compilation document
Appendix E-ii
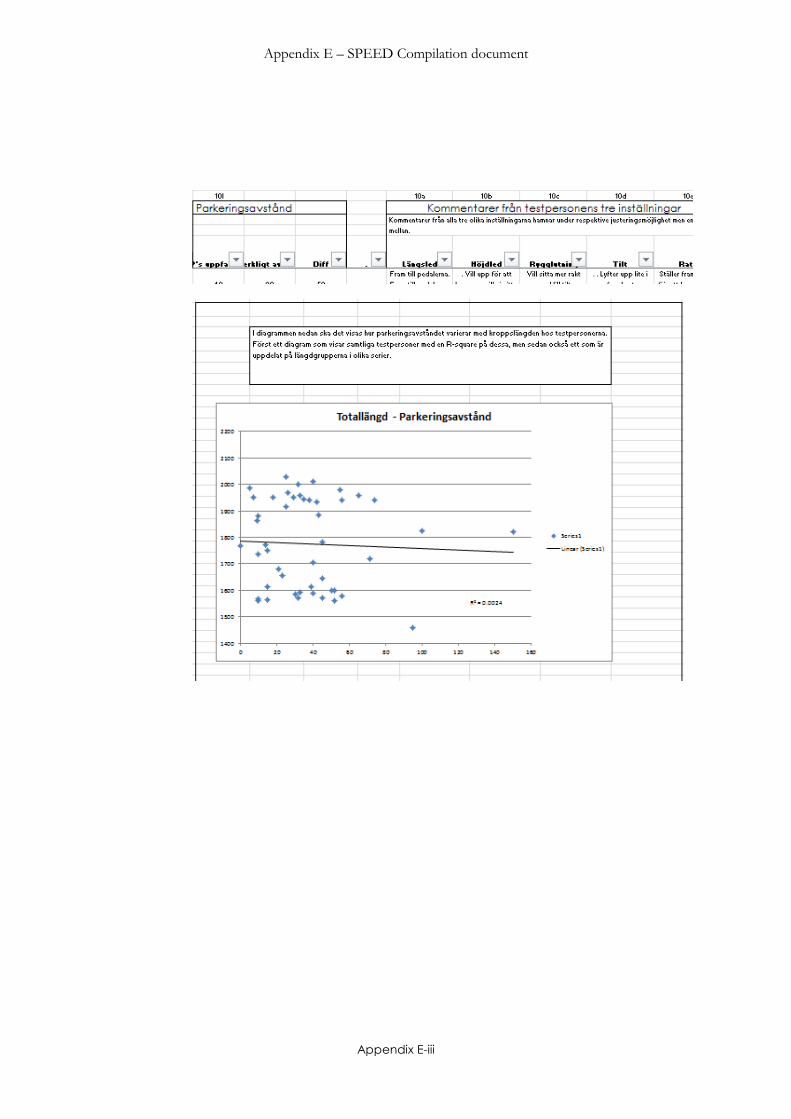
Appendix E – SPEED Compilation document
Appendix E-iii
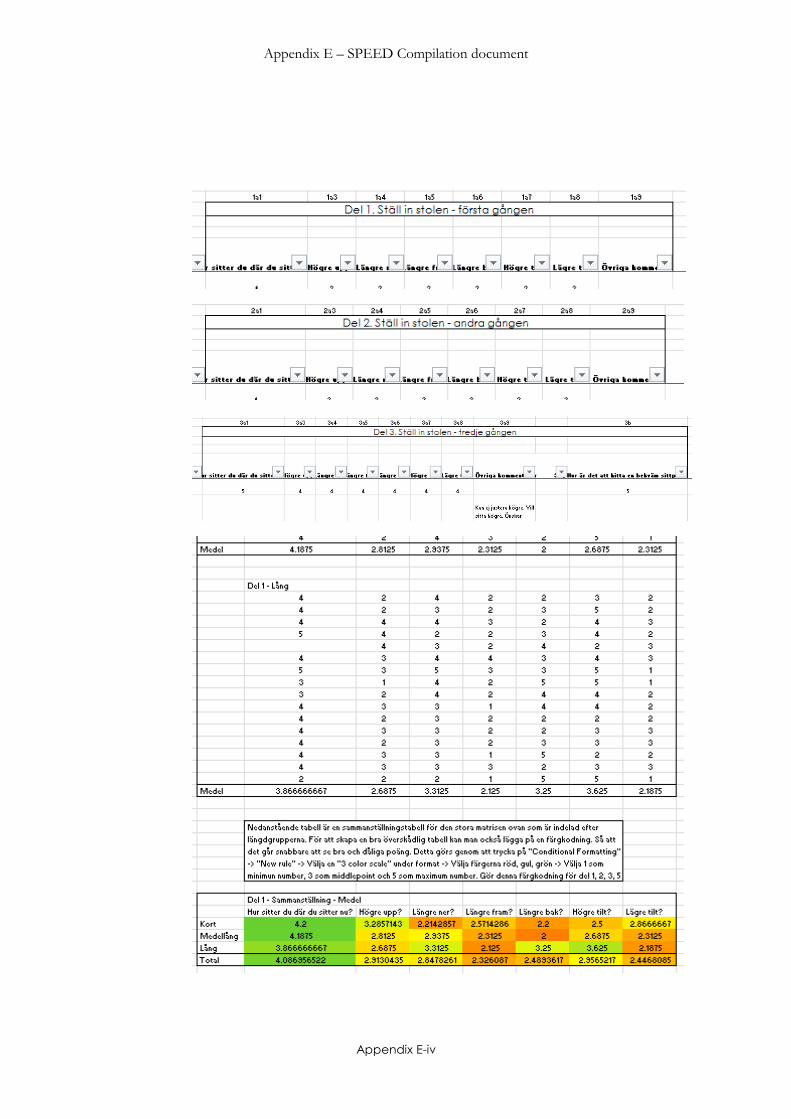
Appendix E – SPEED Compilation document
Appendix E-iv
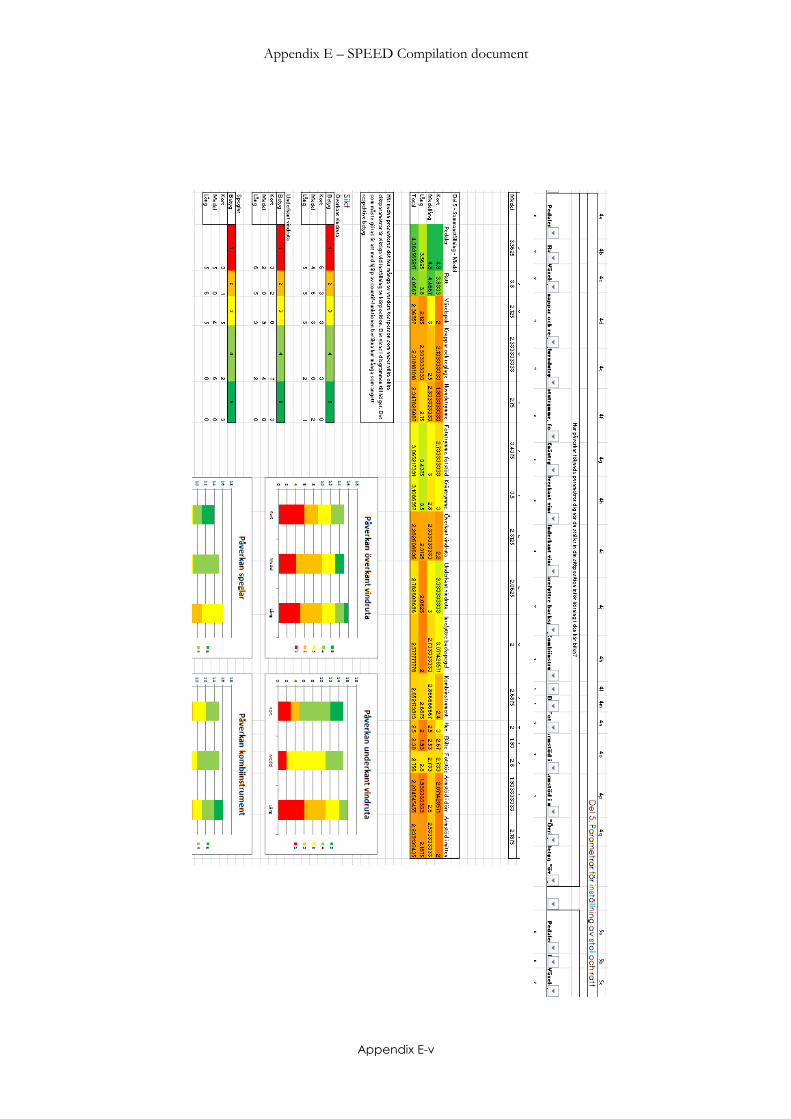
Appendix E – SPEED Compilation document
Appendix E-v
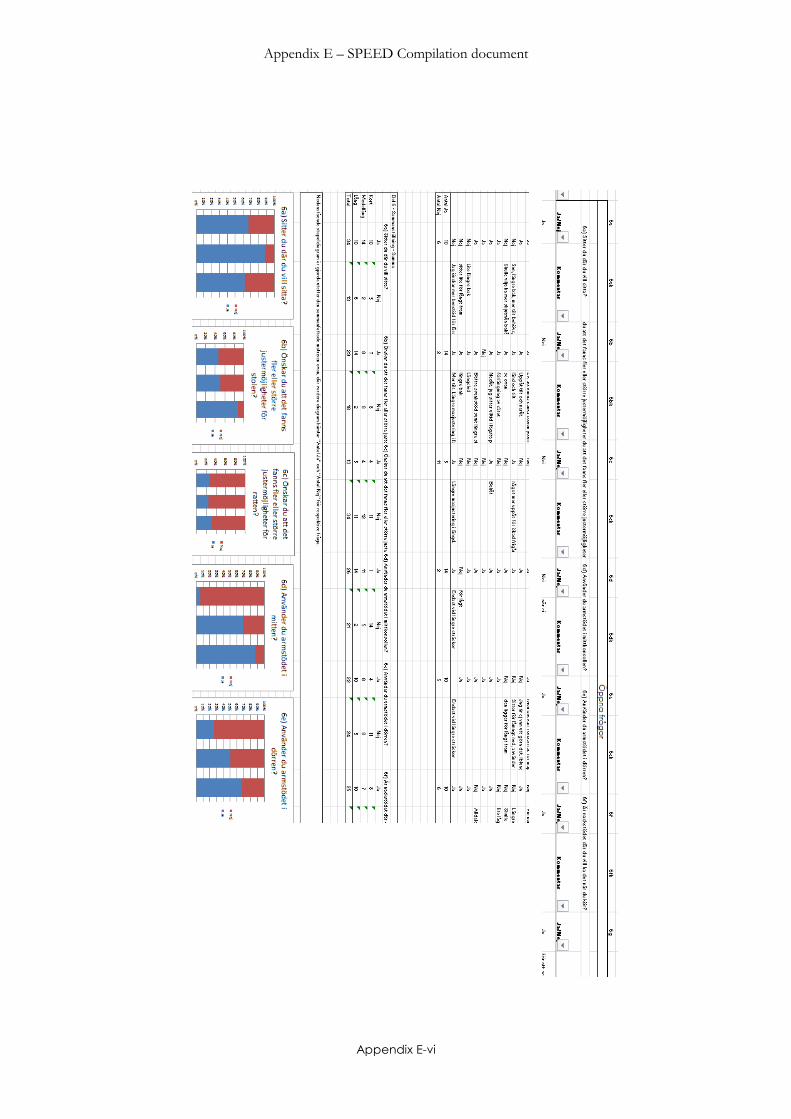
Appendix E – SPEED Compilation document
Appendix E-vi
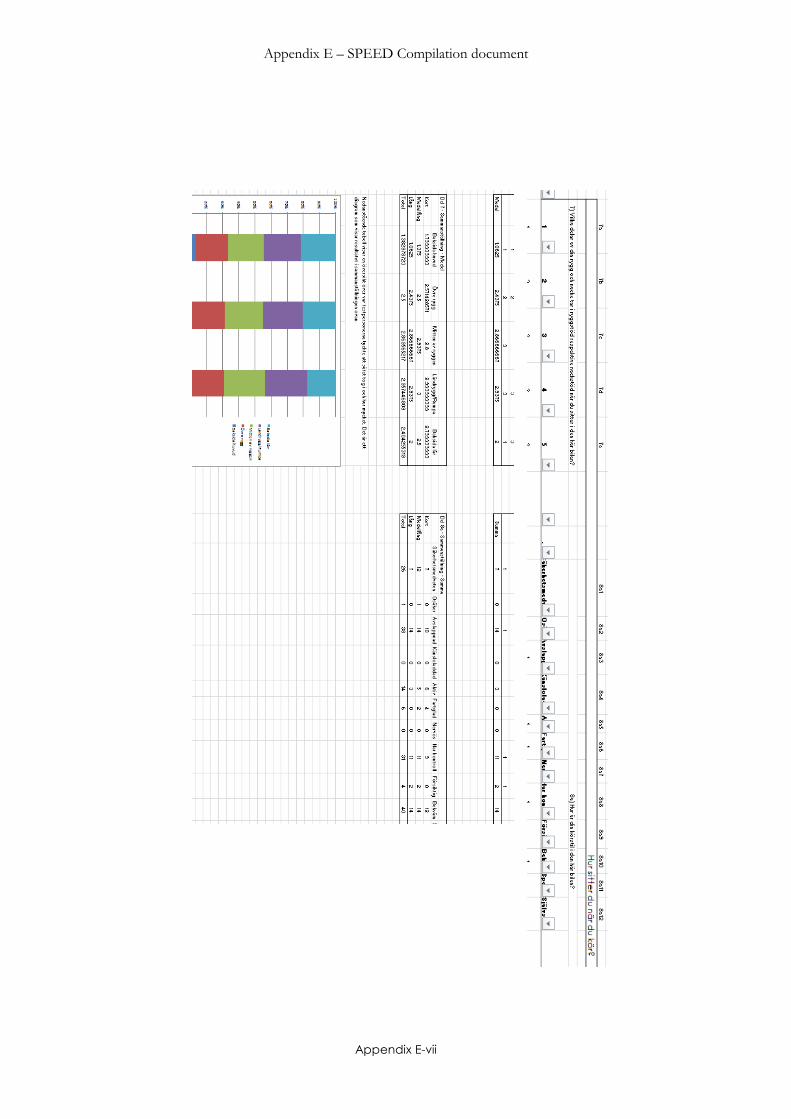
Appendix E – SPEED Compilation document
Appendix E-vii
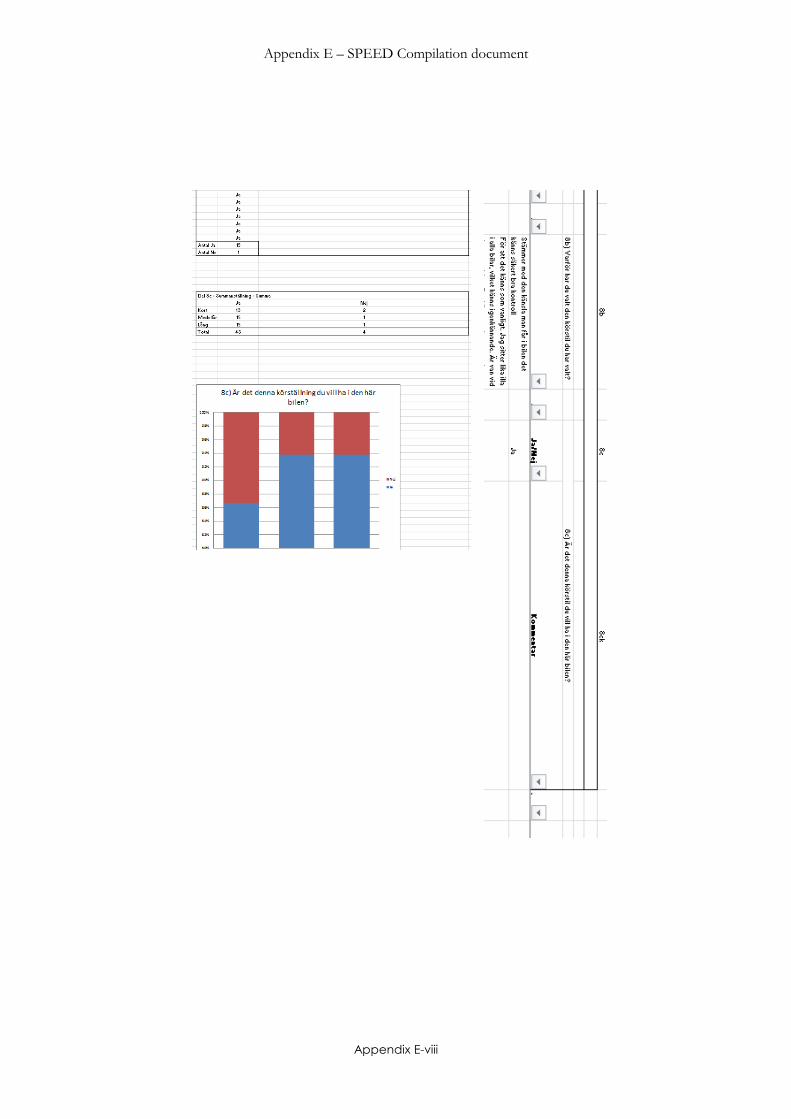
Appendix E – SPEED Compilation document
Appendix E-viii
Appendix F – SPEED Coordinates program
Appendix F-i
F. SPEED Coordinates program
In this appendix parts from the coordinates program is shown. The
information displayed here is copied directly from the SPEED
Coordinates program in Excel the way it will be seen for the user.
Formulas are not shown. The information is displayed in order of
appearance in the program with h-point first, eye point and steering
wheel and they heel point.
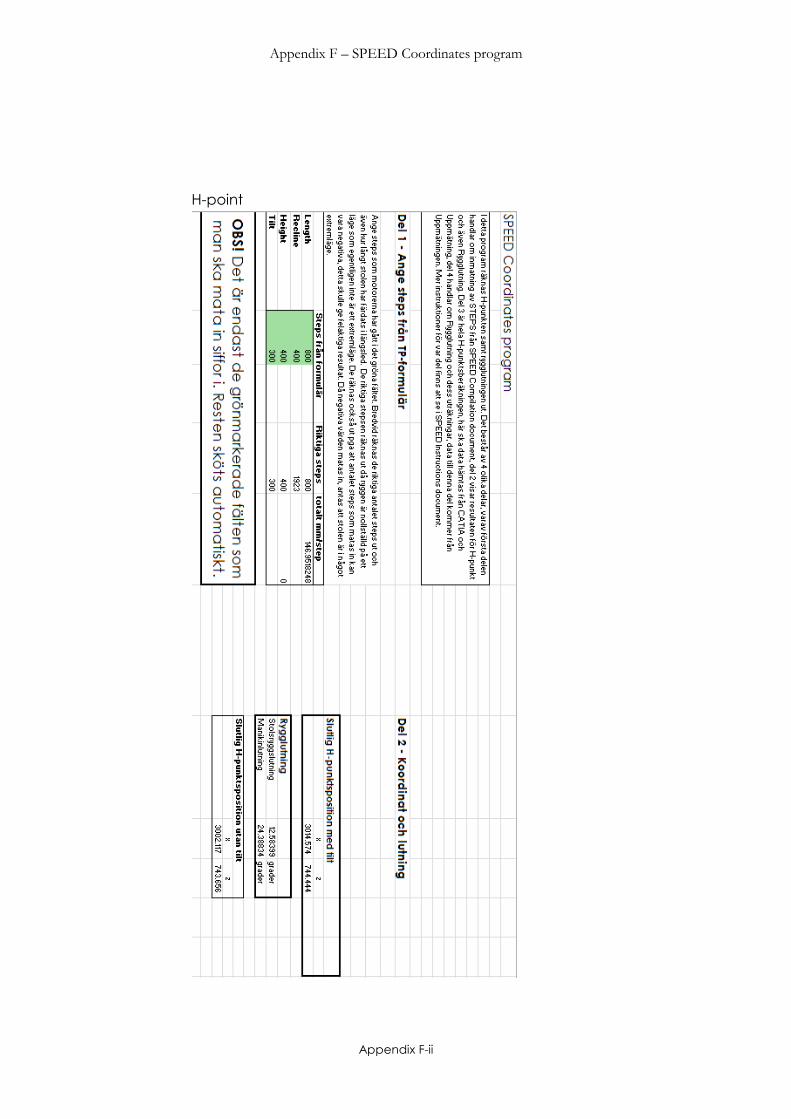
Appendix F – SPEED Coordinates program
Appendix F-ii
H-point
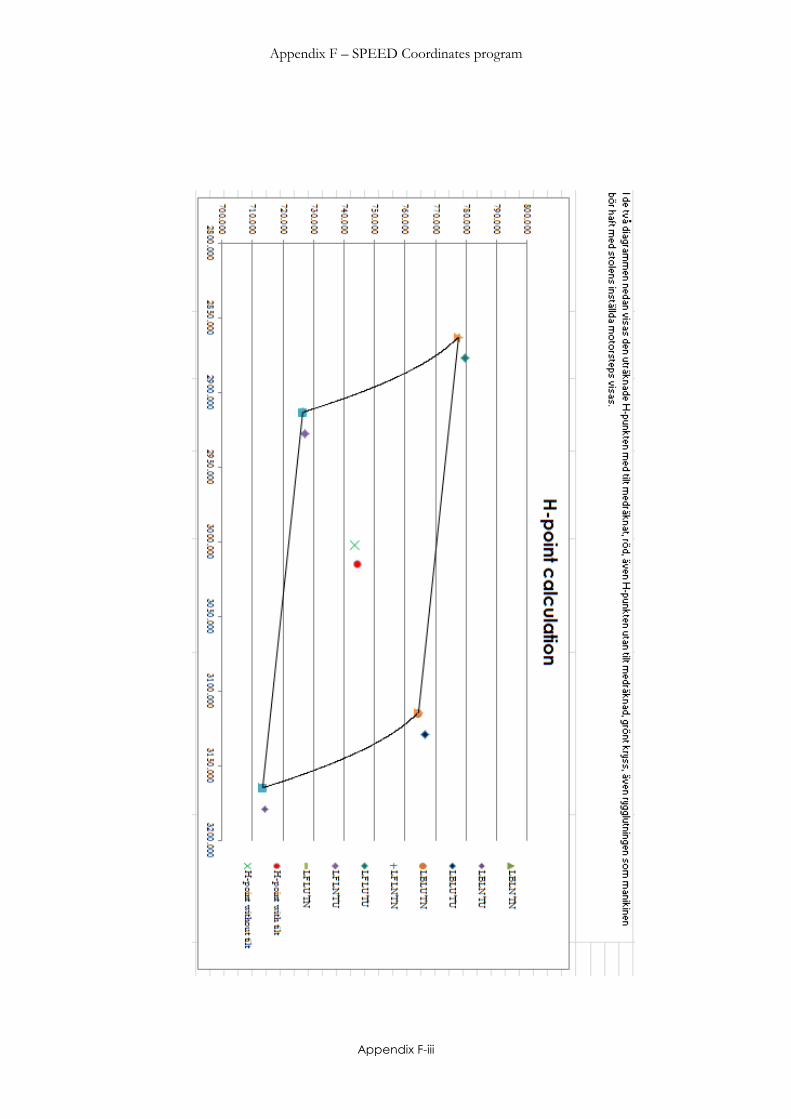
Appendix F – SPEED Coordinates program
Appendix F-iii
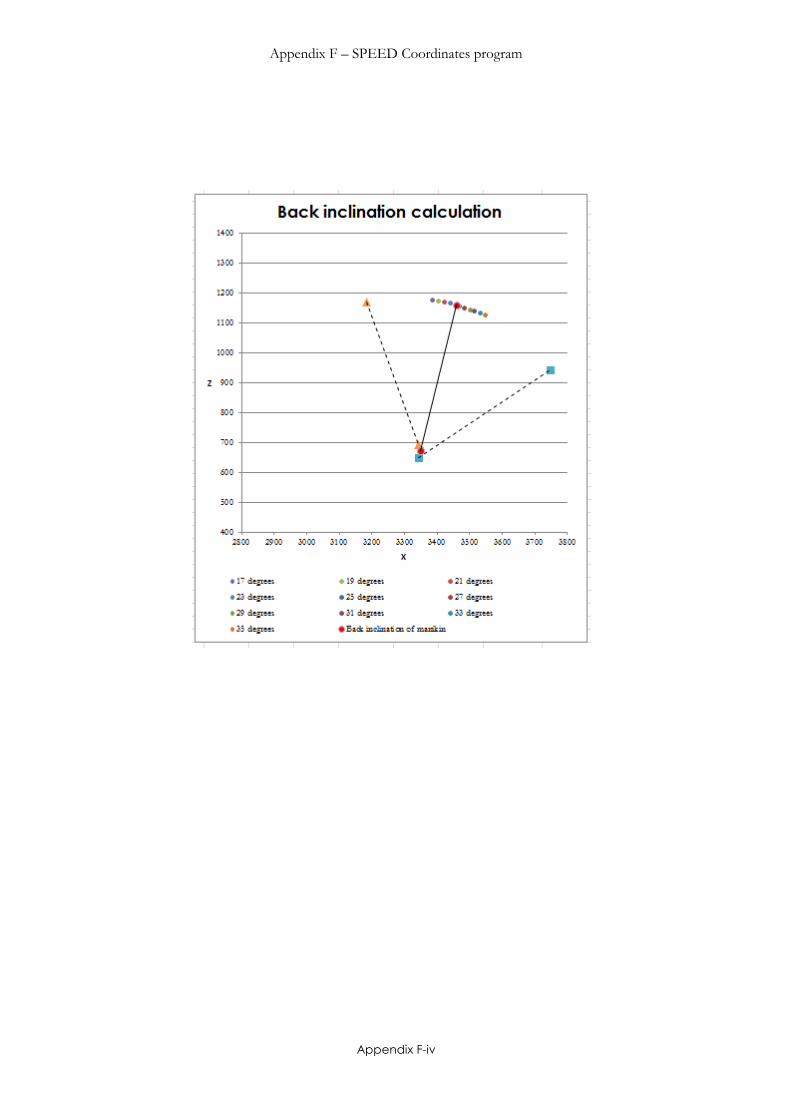
Appendix F – SPEED Coordinates program
Appendix F-iv
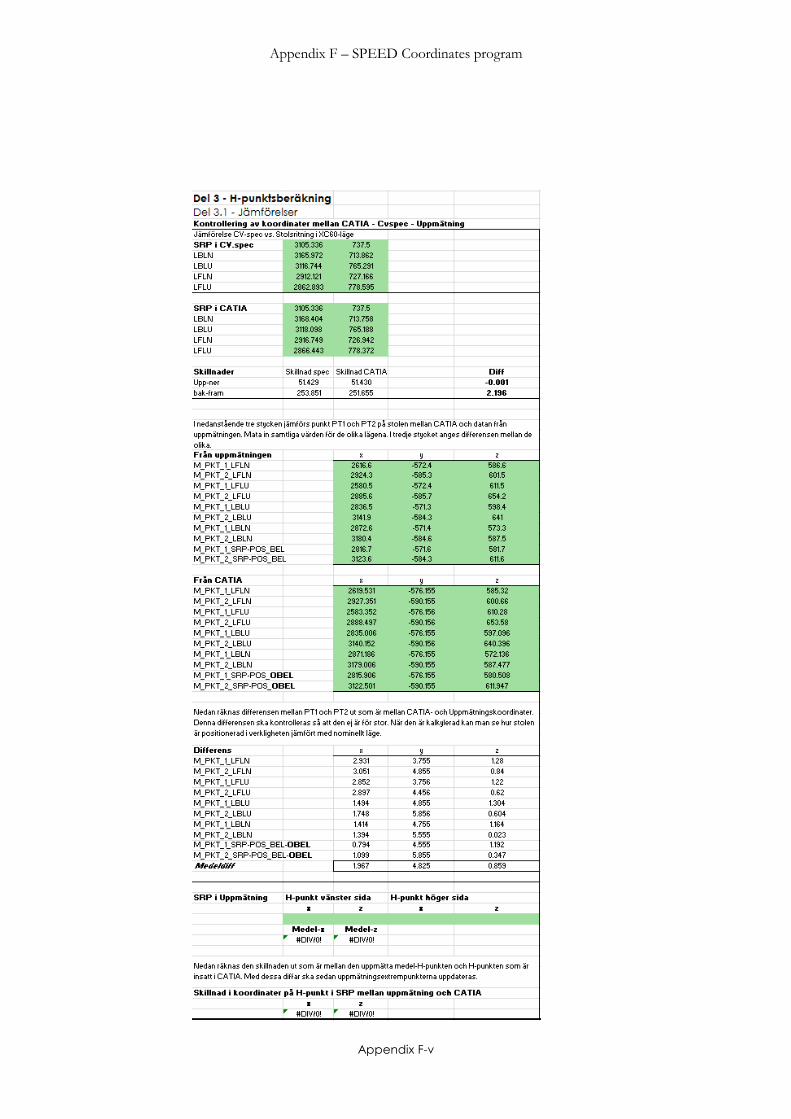
Appendix F – SPEED Coordinates program
Appendix F-v
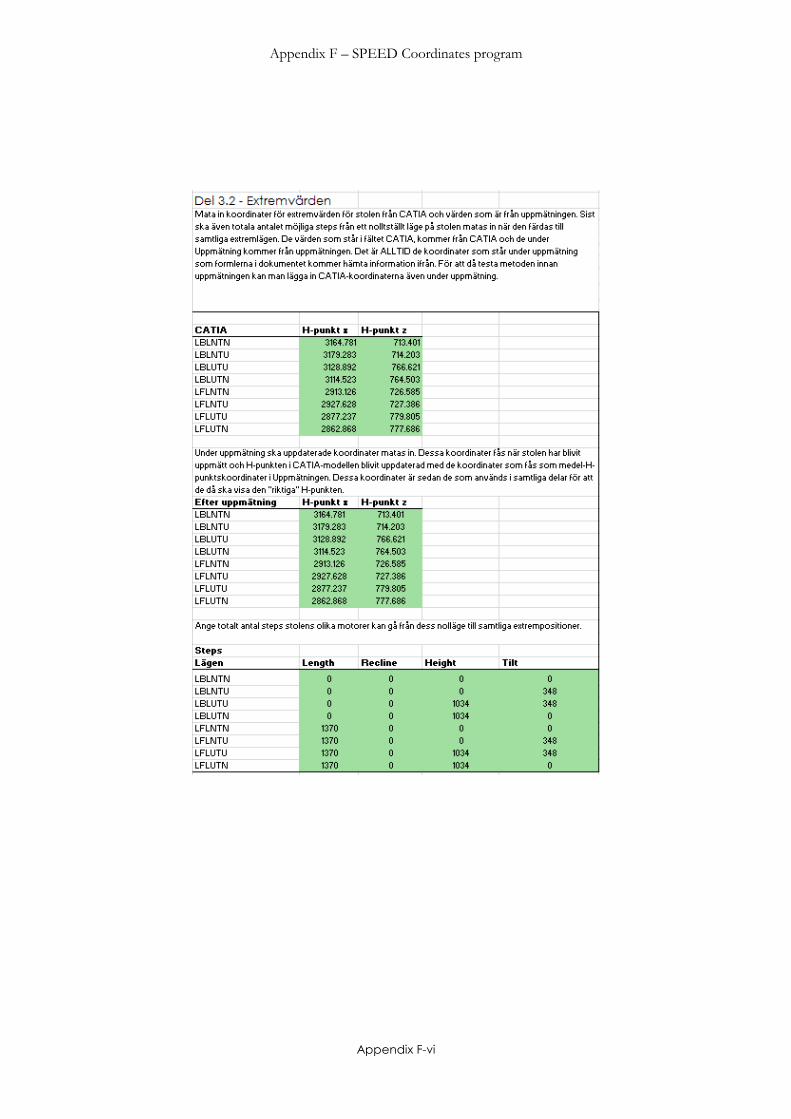
Appendix F – SPEED Coordinates program
Appendix F-vi
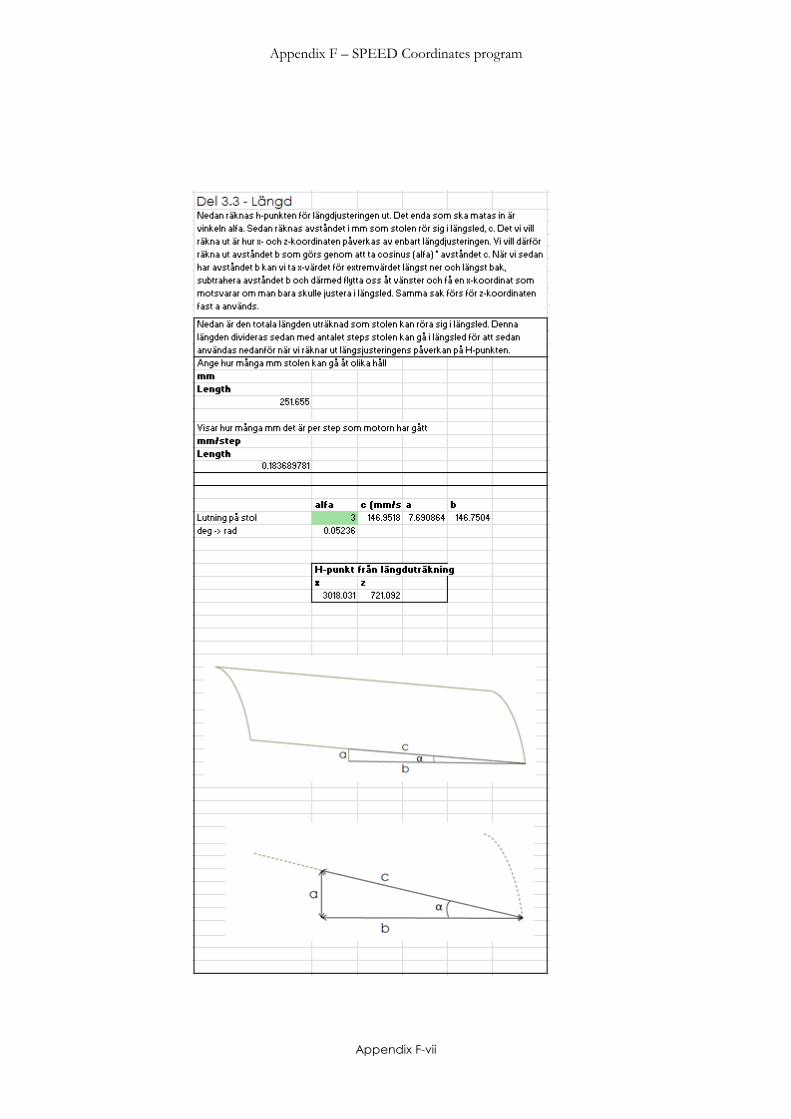
Appendix F – SPEED Coordinates program
Appendix F-vii
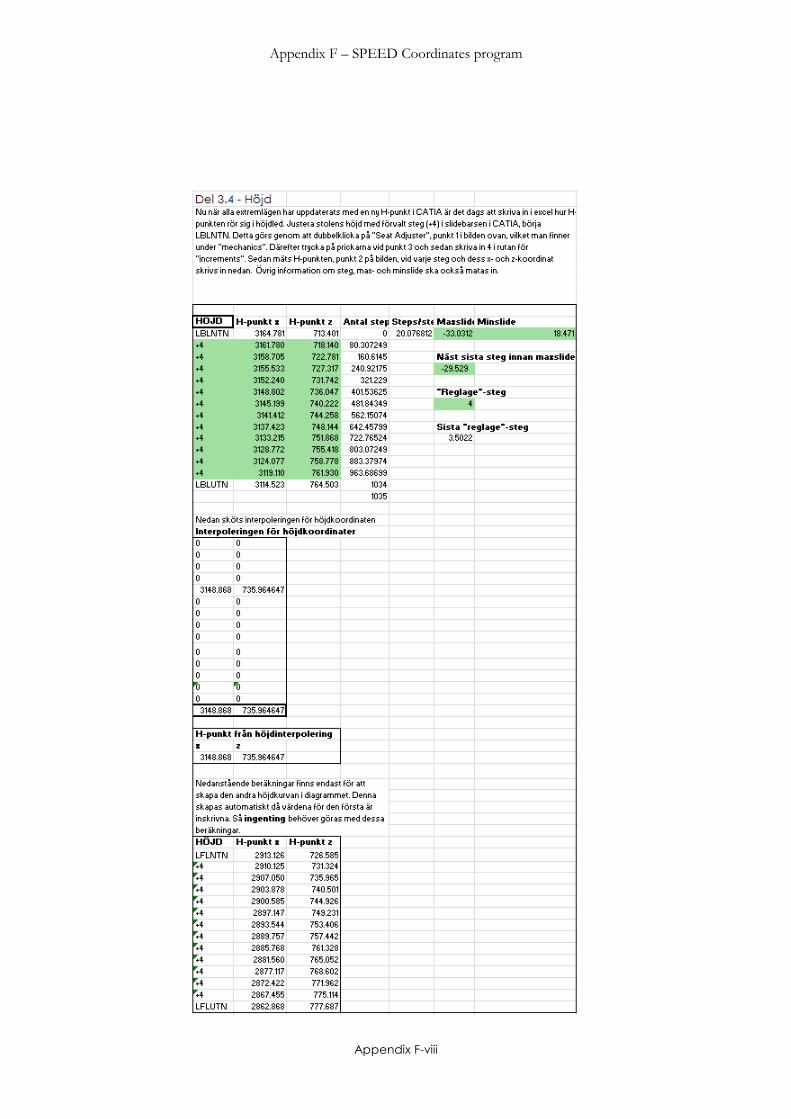
Appendix F – SPEED Coordinates program
Appendix F-viii

Appendix F – SPEED Coordinates program
Appendix F-ix
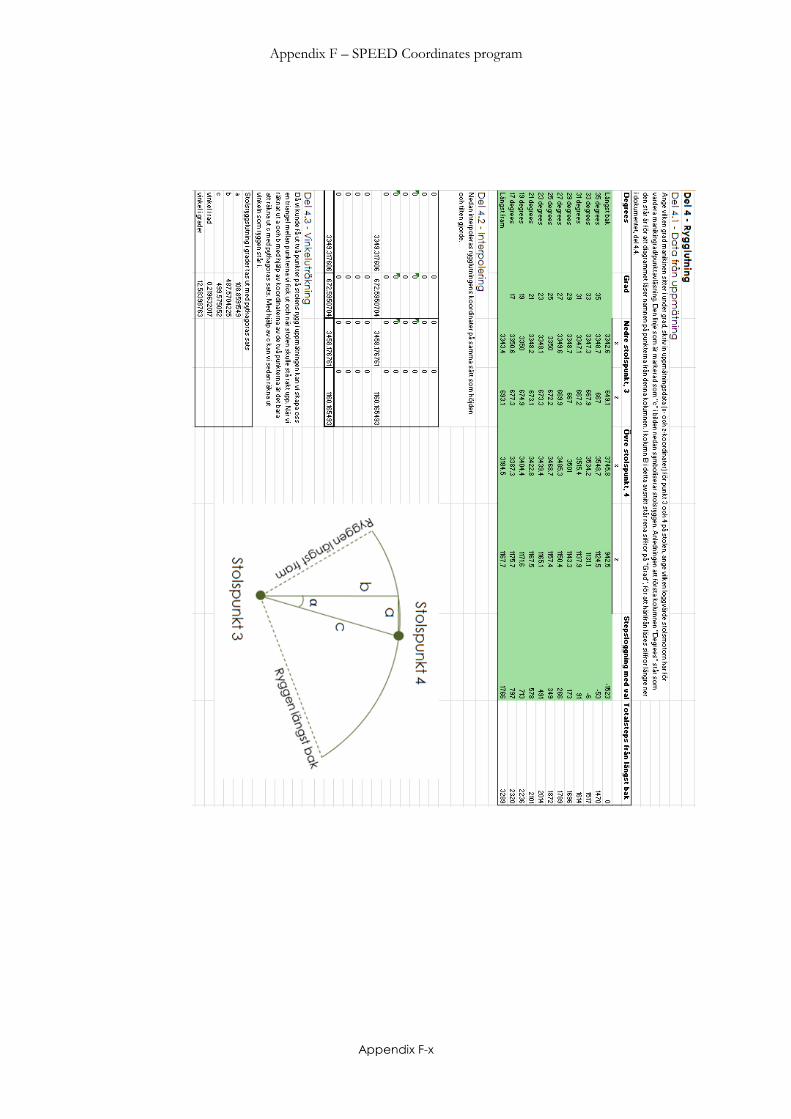
Appendix F – SPEED Coordinates program
Appendix F-x
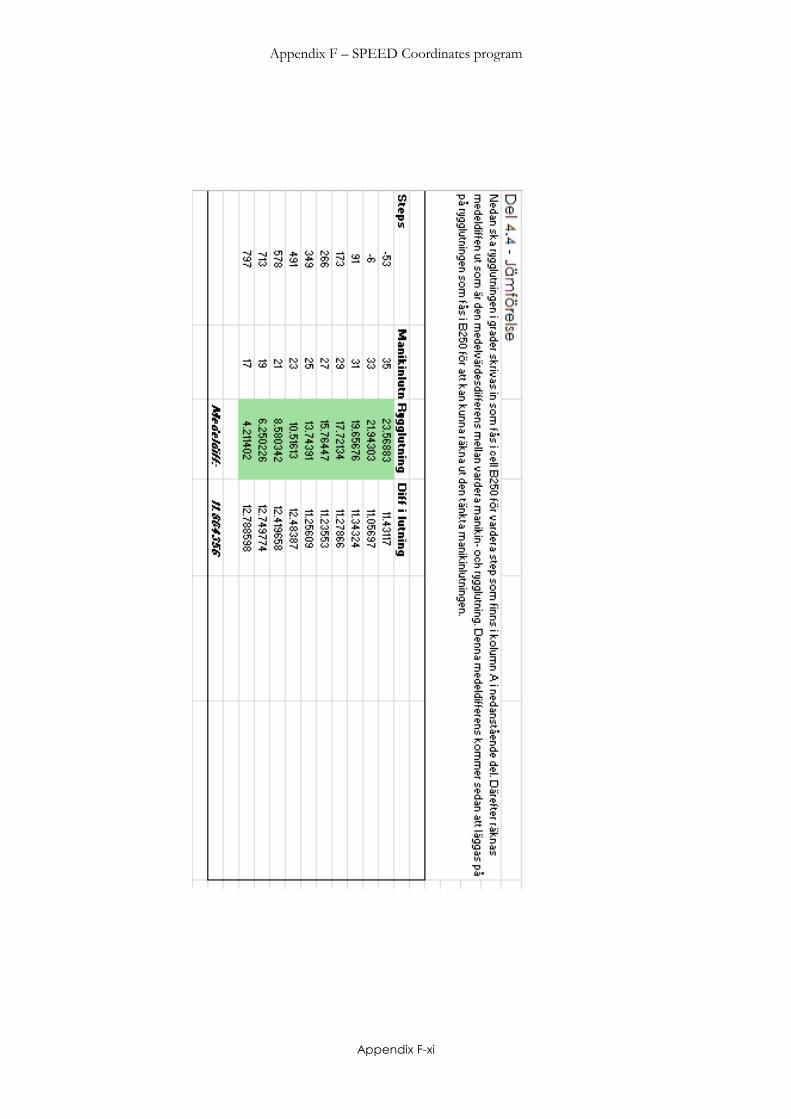
Appendix F – SPEED Coordinates program
Appendix F-xi
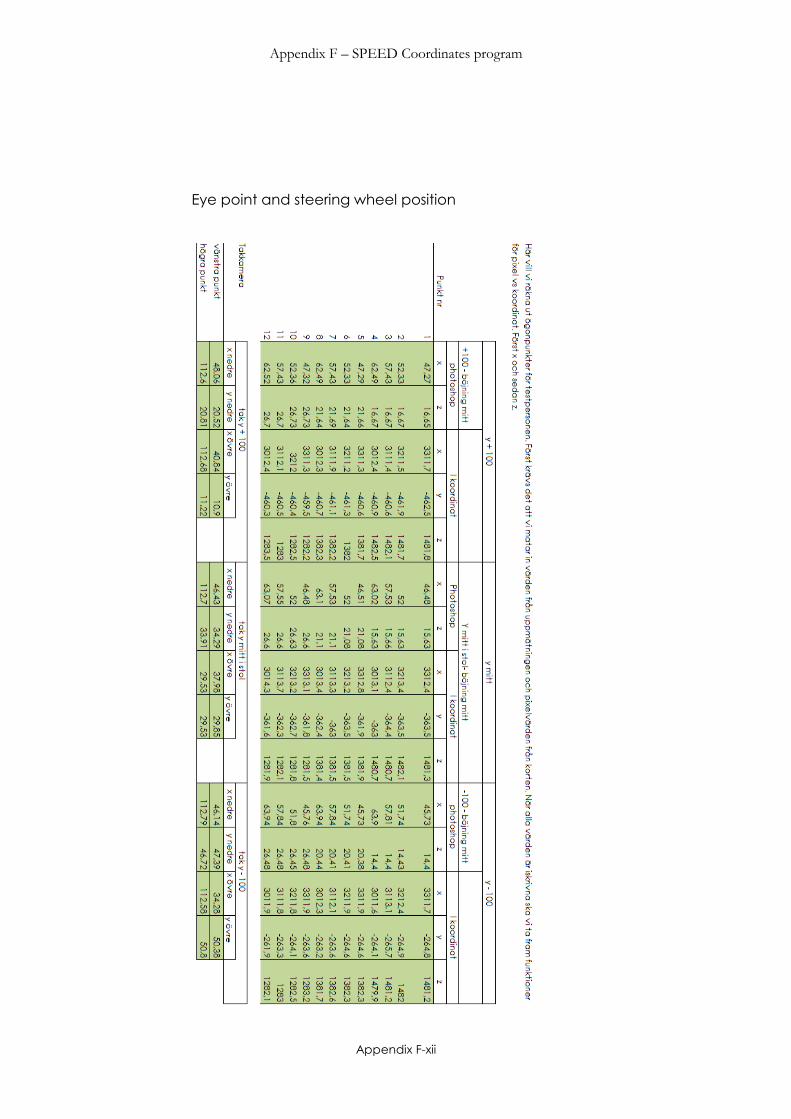
Appendix F – SPEED Coordinates program
Appendix F-xii
Eye point and steering wheel position
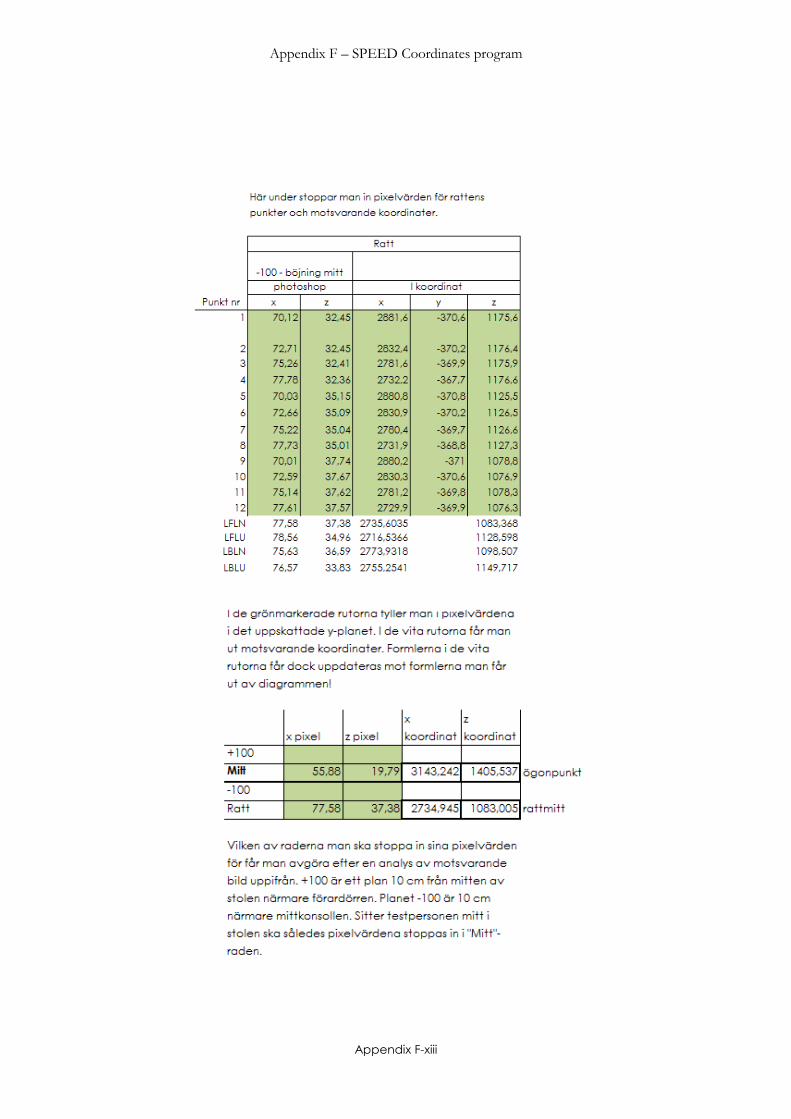
Appendix F – SPEED Coordinates program
Appendix F-xiii
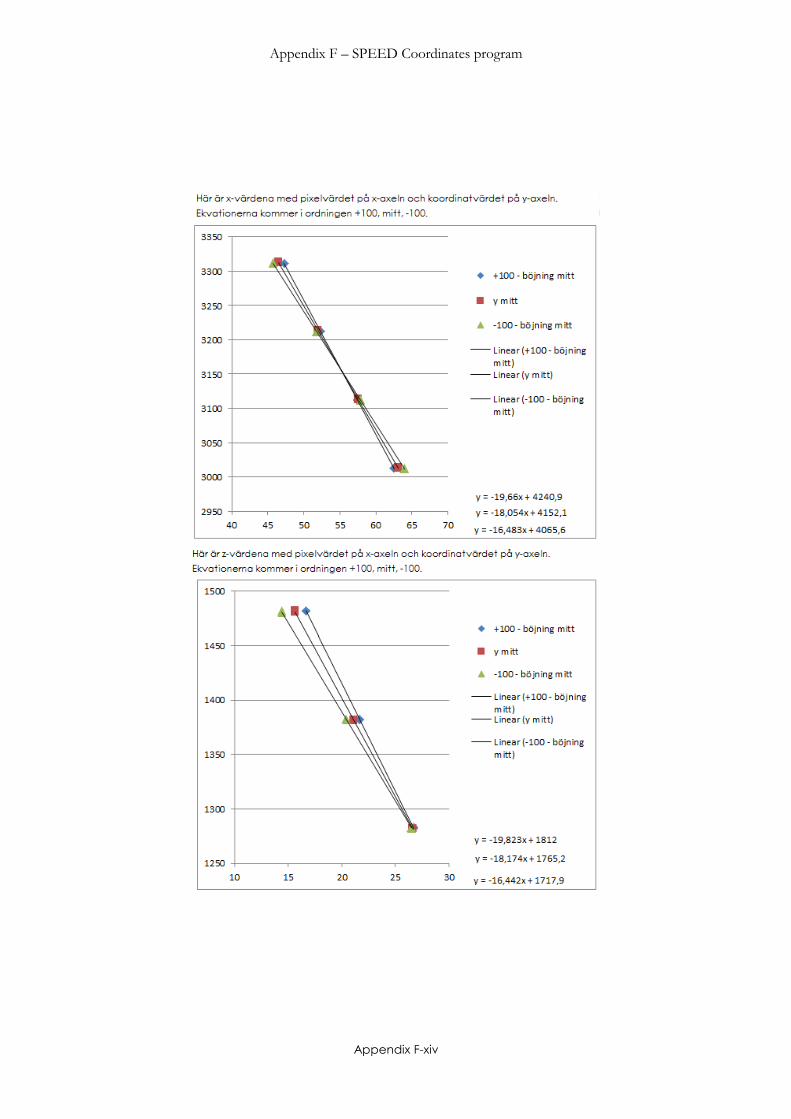
Appendix F – SPEED Coordinates program
Appendix F-xiv

Appendix F – SPEED Coordinates program
Appendix F-xv
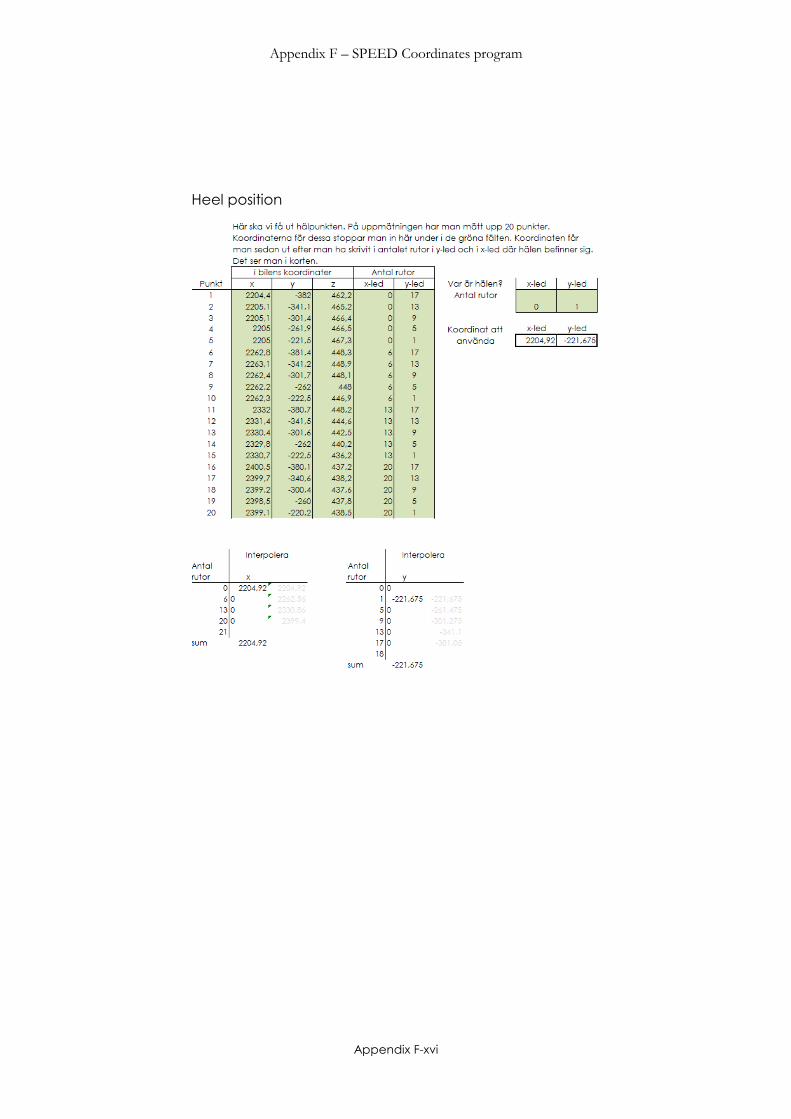
Appendix F – SPEED Coordinates program
Appendix F-xvi
Heel position
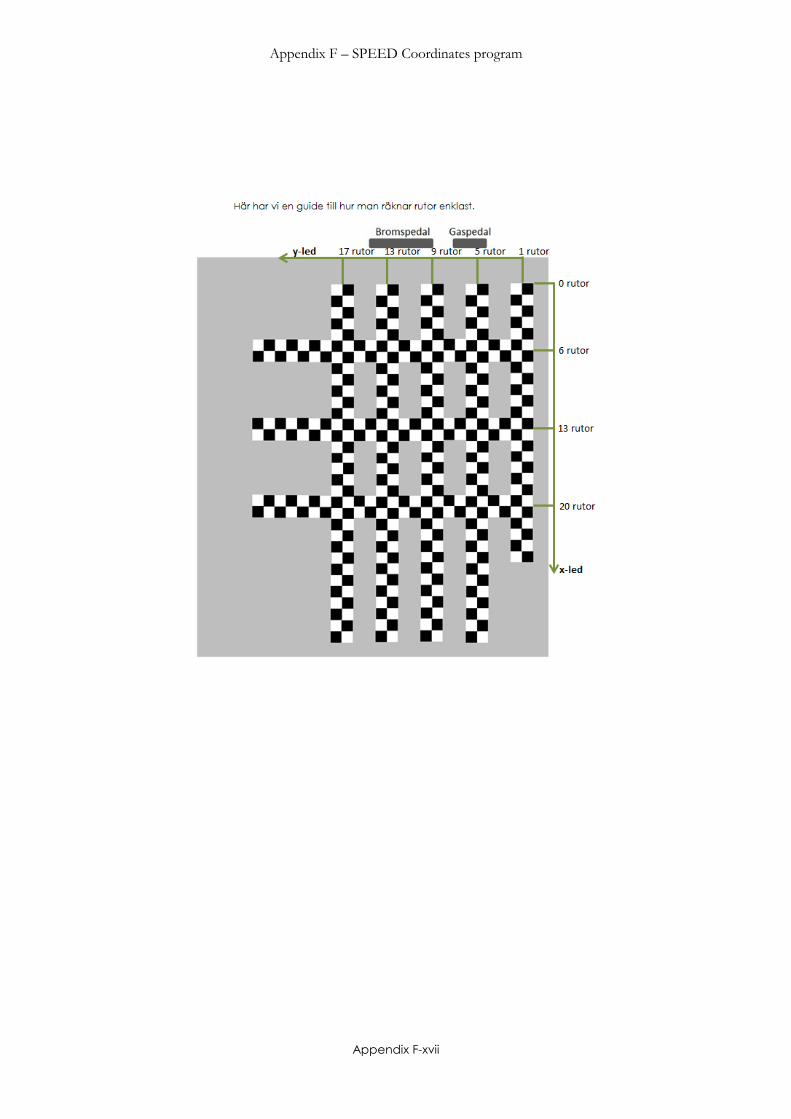
Appendix F – SPEED Coordinates program
Appendix F-xvii
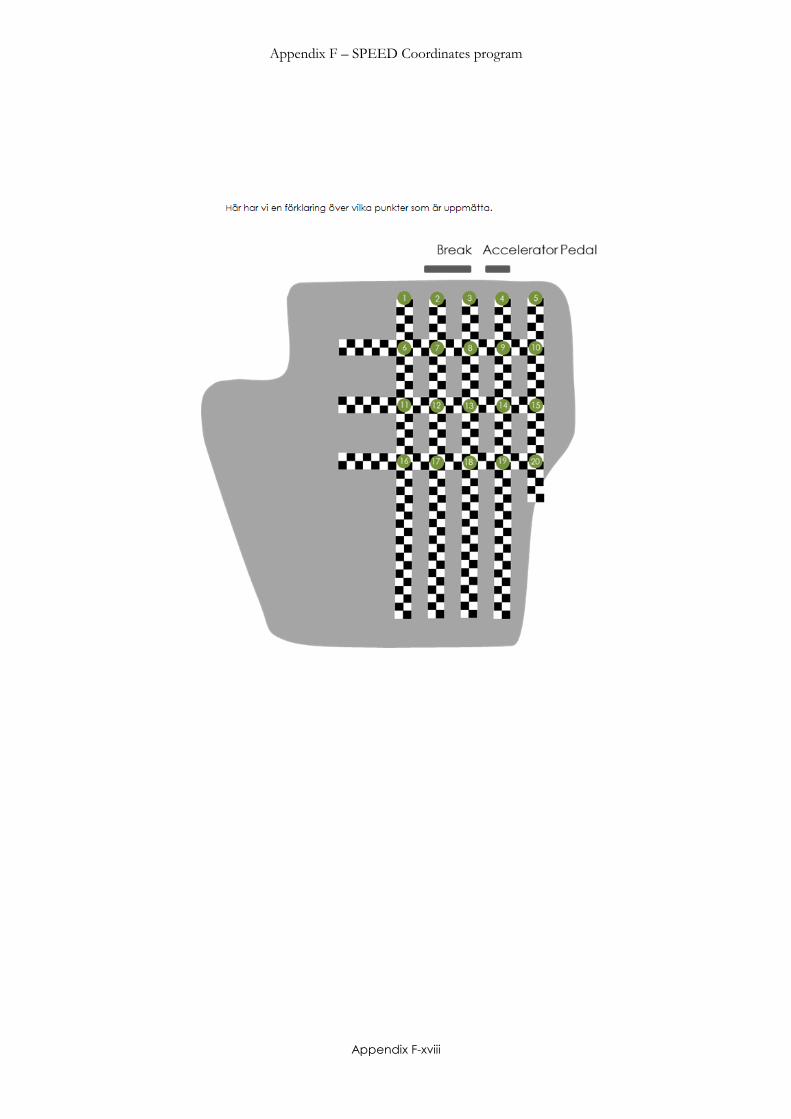
Appendix F – SPEED Coordinates program
Appendix F-xviii

Appendix G – SPEED Instruction document
Appendix G-i
G. SPEED Instruction document
In this appendix the instructions to how to use SPEED is found.

Appendix G – SPEED Instruction document
Appendix G-ii
Appendix G – SPEED Instruction document
SPEED
Instruction
document
Nadja Lejon
Henrik Thorsén
2013-06-11
VCC Ergonomics

Appendix G – SPEED Instruction document
1
Appendix G – SPEED Instruction document
1
Innehållsförteckning
1 Introduktion ................................................................................... 3
2 Bokning av bil ............................................................................... 5
2.1 Bokning .................................................................................. 5
2.2 Körtillstånd ............................................................................. 6
3 Utrustning ....................................................................................... 9
3.1 Instrumentutlåning .............................................................. 9
3.1.1 Utrustning för att läsa av stol ..................................... 9
3.1.2 Kameror ...................................................................... 10
3.1.3 Strömförsörjning ......................................................... 10
3.2 All utrustning som behövs ................................................ 12
3.3 Rigga utrustning ................................................................. 13
3.3.1 Kameror ...................................................................... 13
3.3.2 Referensmärken ........................................................ 14
3.3.3 Styrning av kameror .................................................. 15
3.3.4 DiCE ............................................................................. 15
3.3.5 Formulärdator ............................................................ 16
4 Uppmätning av bil ..................................................................... 17
4.1 Att tänka på innan uppmätning .................................... 17
4.2 Vad ska mätas upp .......................................................... 17
5 Stol ................................................................................................ 19
5.1 Typ av stol ........................................................................... 19
5.2 Läsa ut stolens position ..................................................... 19
5.2.1 Koppla upp sig mot bilen/stolen ............................ 20
5.3 Kinematisk modell ............................................................. 21
5.3.1 CATIA ........................................................................... 21
5.3.2 Uträkning av H-punkt ................................................ 23
6 Pixlar till koordinater ................................................................... 29
6.1 Mappstruktur för bilder ..................................................... 29
Appendix G – SPEED Instruction document
2
6.2 Bildhantering i Photoshop ................................................ 30
6.2.1 Göra en action i Photoshop ................................... 30
6.2.2 Ta bort fisheyeeffekt ................................................. 31
6.2.3 Lägg till referenser ..................................................... 31
6.2.4 Image Processor i Photoshop ................................. 32
6.3 Uppdatera SPEED Coordinates program ..................... 33
6.4 Få ut ögonpunkter ............................................................ 34
6.4.1 Vilket y-plan ska jag välja?...................................... 35
6.5 Avstånd huvud – nackstöd ............................................. 35
6.6 Rattposition ......................................................................... 36
6.6.1 Utläsning av rattposition .......................................... 36
7 Boka klinikpersoner .................................................................... 37
7.1 Testkliniklistan ...................................................................... 37
7.2 Urval ..................................................................................... 37
7.3 Bokning via doodle ........................................................... 37
7.4 Mail för utskick .................................................................... 37
7.4.1 Mail 1 ........................................................................... 38
7.4.2 Mail 2 ........................................................................... 39
7.5 Kallelse ................................................................................. 40
8 Klinik och sammanställning ...................................................... 43
8.1 Klinikinstruktioner för SPEED .............................................. 43
8.1.1 Introduktion (2 min) ................................................... 43
8.1.2 Del 1 – Sträcka 1 med korsning (8 min) ................. 44
8.1.3 Del 2 – Sträcka 2 (8 min) .......................................... 45
8.1.4 Del 3 – Sträcka 3 med raksträcka (8 min) ............ 46
8.1.5 Del 4 – Parkeringssituation (5 min) ......................... 47
8.1.6 Del 5 – TP ska fylla i listor/frågor (10 min) .............. 49
8.2 Anteckningssida till testledare ........................................ 49
8.3 Eventuella ändringar i formuläret .................................. 50
8.4 Bilformulär till sammanställningsdokument ................... 51
8.5 Ruttbeskrivning för klinik ................................................... 51
9 Analys ........................................................................................... 59
Appendix G – SPEED Instruction document
3
1 Introduktion
SPEED är en metod för att utvärdera hur en förare har positionerat sig
i bilen samt varför denna förare har positionerat sig som den har gjort.
Detta dokument innehåller samtliga instruktioner som behövs för att
kunna använda metoden SPEED.
Här finns grundläggande information, som till exempel hur bilen ska
bokas, samt detaljerad information, som till exempel beskriver hur olika
resultat ska göras i ordning för analys. Det finns information som både
är riktat mot VCC Ergonomi och mot sommarjobbare som ska utföra
metoden.
De inledande instruktionerna är för VCC Ergonomi som ska stå för att
boka bil till utvärderingen, boka uppmätning av bilen samt en del
utrustning som ska användas under utvärderingen, så som till exempel
CAN-utrustning och kameror.
Metoden använder sig av fyra olika dokument, först detta
instruktionsdokument som vi valt att kalla SPEED Instruction
document, SPEED Compilation document, SPEED Coordinates
program samt SPEED Note Sheet. Alla dokument läses med fördel
parallellt för att få en bättre helhetsbild, då mer detaljerade instruktioner
om hur vissa delar av metoden finns i respektive dokument/program. I
instruktionerna finns också namn samt telefonnummer till
personer/avdelningar som var till stor hjälp under respektive delar vid
metodframtagningen. Dessa namn kan endast ses som en vägledning till
rätt person då det ofta händer att personer byter tjänst och då också
ansvarsområden. Detta innebär att om det skulle uppstå problem eller
om vidare information behövs, kan avdelningschefen för den angivna
avdelningen som nämnts i respektive stycke kontaktas, alternativt kan
hjälp fås av Ergonomiavdelningen för att hitta den ansvariga personen.

Appendix G – SPEED Instruction document
4
Appendix G – SPEED Instruction document
5
2 Bokning av bil
2.1 Bokning
Ska göras innan sommarjobbare anländer. Men nedan kan vara bra att
ha:
Bilen som ska användas ska bokas och dessa bokningar sköts av
vagningenjörerna. För att hämta bilen måste man veta var nyckeln finns
samt var bilen är parkerad, denna info kan hämtas ur interna systemet
DRIP. Detta nås genom att:
1. Gå till VCC’s intranätsida
2. Skriv ”DRIP” i sökfältet
3. Välj första länken (http://drip.vcc.ford.com/)
4. Logga in med CDSID samt lösenord
5. Tryck på ”Vehicle Engineer” i vänsterträdet
6. Tryck på ”Week calender by reg no”
7. Välj en av de bokade veckorna (ex. 13w11 = vecka 11 år 13)
8. Ange regnr på bokad bil
9. När kalendern visas, vänsterklicka på någon av de bokade
tiderna
10. Information kommer att visas och där bland annat ”Parking
lot/keys”. Till höger om detta står det vilken parkering samt
vilket nyckelskåp nycklarna befinner sig i. Kontakta
vagningenjören om det är oklart vart dessa två befinner sig.
Kontaktperson: Vagningenjör
Appendix G – SPEED Instruction document
6
2.2 Körtillstånd
För att få köra ut genom portarna med den bokade bilen måste
körtillstånd ordnas. Detta är något som man får skriva på för var dag
bilen ska användas och ska undertecknas av avdelningschefen på
Ergonomi samt vagningenjören. Körtillståndet är digitalt och nås via
DRIP:
1. Gå till VCC’s intranätsida
2. Skriv ”DRIP” i sökfältet
3. Välj första länken (http://drip.vcc.ford.com/)
4. Logga in med CDSID samt lösenord
5. Tryck på ”Standard User” i vänsterträdet
6. Välj ”Issue A-Daytime (EJ tj. resa)
7. Fyll i följande info:
a. Läs och acceptera ”Affirmation”
b. Under ”Purpose”, välj ”Perform test”
c. Fyll i “Reason for driving”
d. Under “Planned mileage” ska det fyllas i ruttens längd
multiplicerat med hur många testpersoner som ska
köra under dagen. Ruttens längd är ca 8 km och finns
att se i kapitel 8.5.
e. Fyll i ”Departure”
f. Under ”Method for vehicle selection”, välj “Use
existing reservation” då det redan är en bil bokad.
g. Fyll i registreringsnummer på den bokade bilen
h. Under ”Enter reservation code”, ska
reservationskoden som erhålls av vagningenjören
matas in.
i. Under ”Supervisor cdsid”, fyll i cdsid för
ergonomiavdelningens chef.

Appendix G – SPEED Instruction document
7
j. Under ”VING”, välj rätt vagningenjör, fråga
handledare på Ergonomiavdelningen om det är oklart
vad denna heter.
k. Tryck ”Submit”.
8. Nu är körtillståndet skickat till vagningenjören och
avdelningschefen för bekräftelse.

Appendix G – SPEED Instruction document
8
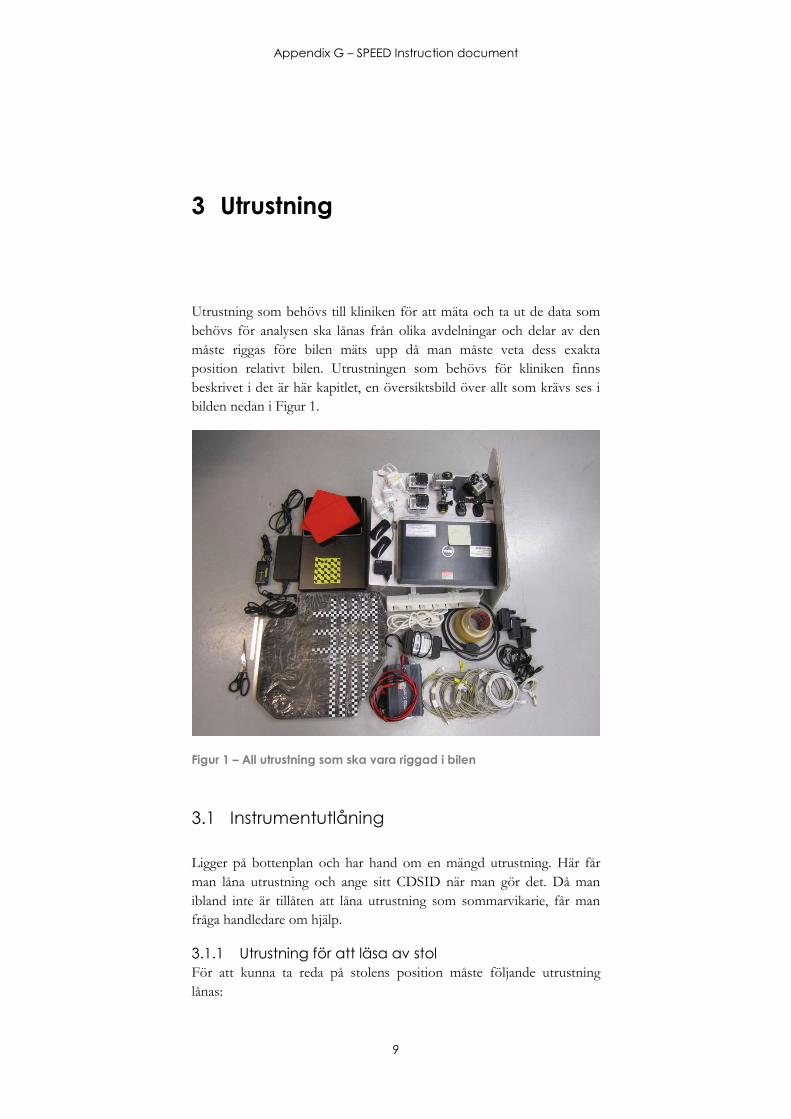
Appendix G – SPEED Instruction document
9
3 Utrustning
Utrustning som behövs till kliniken för att mäta och ta ut de data som
behövs för analysen ska lånas från olika avdelningar och delar av den
måste riggas före bilen mäts upp då man måste veta dess exakta
position relativt bilen. Utrustningen som behövs för kliniken finns
beskrivet i det är här kapitlet, en översiktsbild över allt som krävs ses i
bilden nedan i Figur 1.
Figur 1 – All utrustning som ska vara riggad i bilen
3.1 Instrumentutlåning
Ligger på bottenplan och har hand om en mängd utrustning. Här får
man låna utrustning och ange sitt CDSID när man gör det. Då man
ibland inte är tillåten att låna utrustning som sommarvikarie, får man
fråga handledare om hjälp.
3.1.1 Utrustning för att läsa av stol
För att kunna ta reda på stolens position måste följande utrustning
lånas:
Appendix G – SPEED Instruction document
10
CAN-dator med installerad GGD-DHA-programvara
DiCE mätanordning
3.1.2 Kameror
Här är det viktigt att låna kameror som har tillhörande programvara
med fjärrstyrning så att testledaren kan styra kameran och ta kort från
dator. Viktigt är också att tänka på hur kamerorna laddas så att de helst
kan sitta på sin plats i bilen jämt men ändå laddas via cigarettuttaget
exempelvis.
GoPro-kameror 3-4 st
o Kamera som sitter på fönster främre passagerarsida
o Kamera som sitter på framkant förarstol
o (Kamera som sitter i taket ovanför förarstol)
o Kamera som filmar från dörrkarm främre
passagerarsida
”Öppna skal” till GoPro-kamerorna. Det ska finnas skal med
uppborrade hål så man kan ladda dem.
Fästen med klister så man kan fästa kamerorna, 4 st
”Armar” och ”leder”, böjda, raka, i vinkel, för att kunna
anpassa vinkeln på kamerorna. Ta så många som möjligt och
lämna tillbaka de som inte används sedan.
Förlängningssladdar USB, så många som antalet uttag som
finns hos kamerorna. 2 för varje GoPro 2 och 1 för varje
GoPro 3.
MiniUSB-sladdar, 2 för varje GoPro 2 och 1 för varje GoPro 3.
iPads med GoPro-program på, 2-3 st.
GoPro-kameror är att föredra då dessa går att ladda samtidigt som de
används samt att de kan fjärrstyras med hjälp av iPad.
3.1.3 Strömförsörjning
För att kunna driva all utrustning i bilen kan cigarettuttagen användas. I
ett av dessa kan en omvandlare kopplas in så att ett grenuttag går att
sätta in i bilen, vilket möjliggör enklare drivning. Vissa bilmodeller kan
ge ström hela tiden genom ett av de flera cigarettuttag som finns, även
Appendix G – SPEED Instruction document
11
då bilen är avstängd, koppla in omvandlaren i detta uttag. CAN-datorn
som används i metoden har också i vissa fall möjlighet att drivas via
cigarettuttaget med en adapter för detta.
Omvandlare från 12V till 220V
Grenuttag för att koppla in ev. laptopladdare samt laddare för
iPad, övriga batterier etc.
Cigarettladdare till CAN-dator
USB-hub, 2 st, finns på gruppen
Appendix G – SPEED Instruction document
12
3.2 All utrustning som behövs
CAN-dator med installerad GGD-DHA-programvara
DiCE mätanordning
GoPro-kameror 3-4 st
o Kamera som sitter på fönster främre passagerarsida
o Kamera som sitter på framkant förarstol
o (Kamera som sitter i taket ovanför förarstol)
o Kamera som filmar från dörrkarm främre
passagerarsida
”Öppna skal” till GoPro-kamerorna. Det ska finnas skal med
uppborrade hål så man kan ladda dem. Skalen är olika
beroende på modell. Prata med Peter Broberg på utlåningen.
Fästen med klister så man kan fästa kamerorna, 4 st
”Armar” och ”leder”, böjda, raka, i vinkel, för att kunna
anpassa vinkeln på kamerorna. Ta så många som möjligt och
lämna tillbaka de som inte används sedan.
Förlängningssladdar USB, så många som antalet uttag som
finns hos kamerorna. 2 för varje GoPro 2 och 1 för varje
GoPro 3.
MiniUSB-sladdar, 2 för varje GoPro 2 och 1 för varje GoPro 3.
iPads med GoPro-program på, 2-3 st.
Omvandlare från 12V till 220V
Grenuttag för att koppla in ev. laptopladdare samt laddare för
iPad, övriga batterier etc.
Cigarettladdare till CAN-dator
USB-hub, 2 st, finns på gruppen
Linjaler, tejp, etc. (Förrådet)
Mätremsor och prickar (Krockavdelningen)
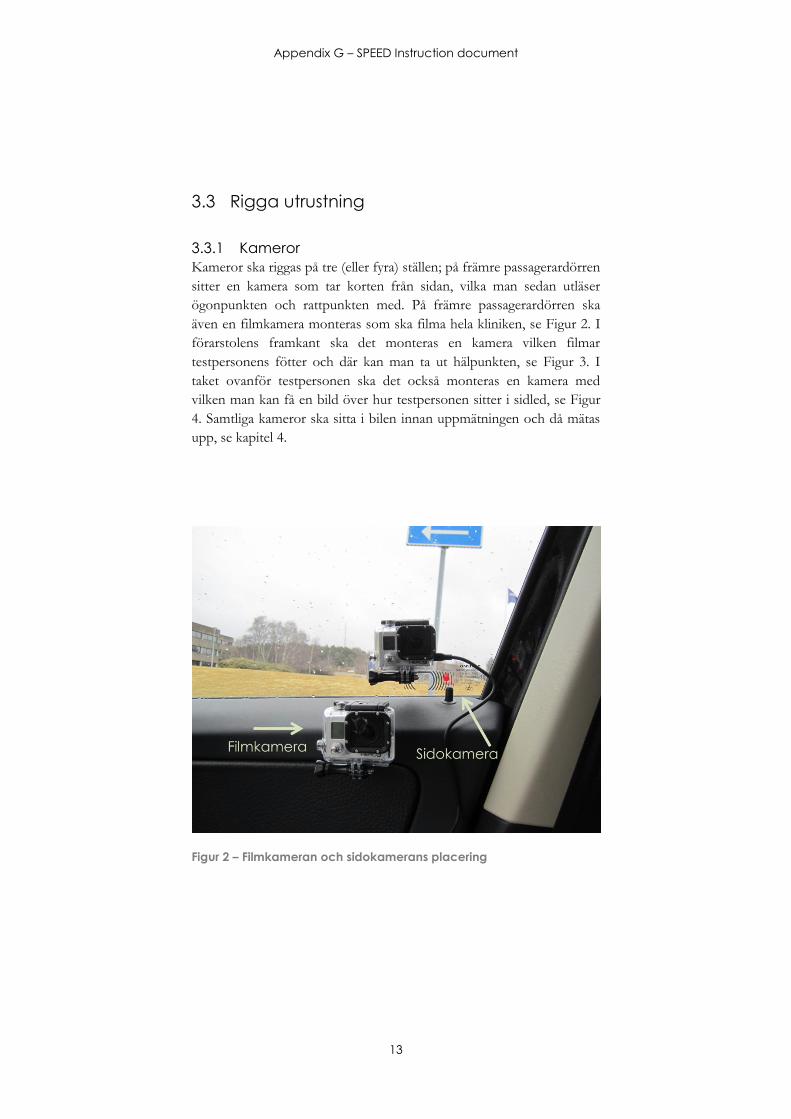
Appendix G – SPEED Instruction document
13
3.3 Rigga utrustning
3.3.1 Kameror
Kameror ska riggas på tre (eller fyra) ställen; på främre passagerardörren
sitter en kamera som tar korten från sidan, vilka man sedan utläser
ögonpunkten och rattpunkten med. På främre passagerardörren ska
även en filmkamera monteras som ska filma hela kliniken, se Figur 2. I
förarstolens framkant ska det monteras en kamera vilken filmar
testpersonens fötter och där kan man ta ut hälpunkten, se Figur 3. I
taket ovanför testpersonen ska det också monteras en kamera med
vilken man kan få en bild över hur testpersonen sitter i sidled, se Figur
4. Samtliga kameror ska sitta i bilen innan uppmätningen och då mätas
upp, se kapitel 4.
Figur 2 – Filmkameran och sidokamerans placering
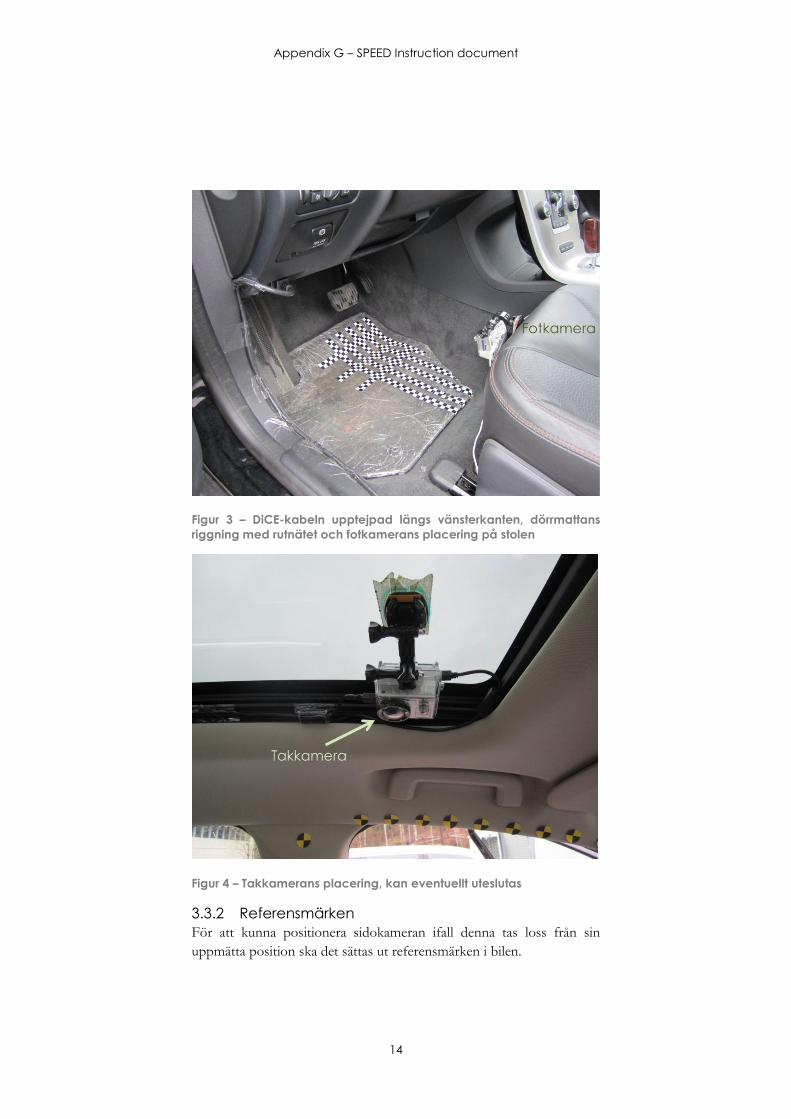
Appendix G – SPEED Instruction document
14
Figur 3 – DiCE-kabeln upptejpad längs vänsterkanten, dörrmattans
riggning med rutnätet och fotkamerans placering på stolen
Figur 4 – Takkamerans placering, kan eventuellt uteslutas
3.3.2 Referensmärken
För att kunna positionera sidokameran ifall denna tas loss från sin
uppmätta position ska det sättas ut referensmärken i bilen.
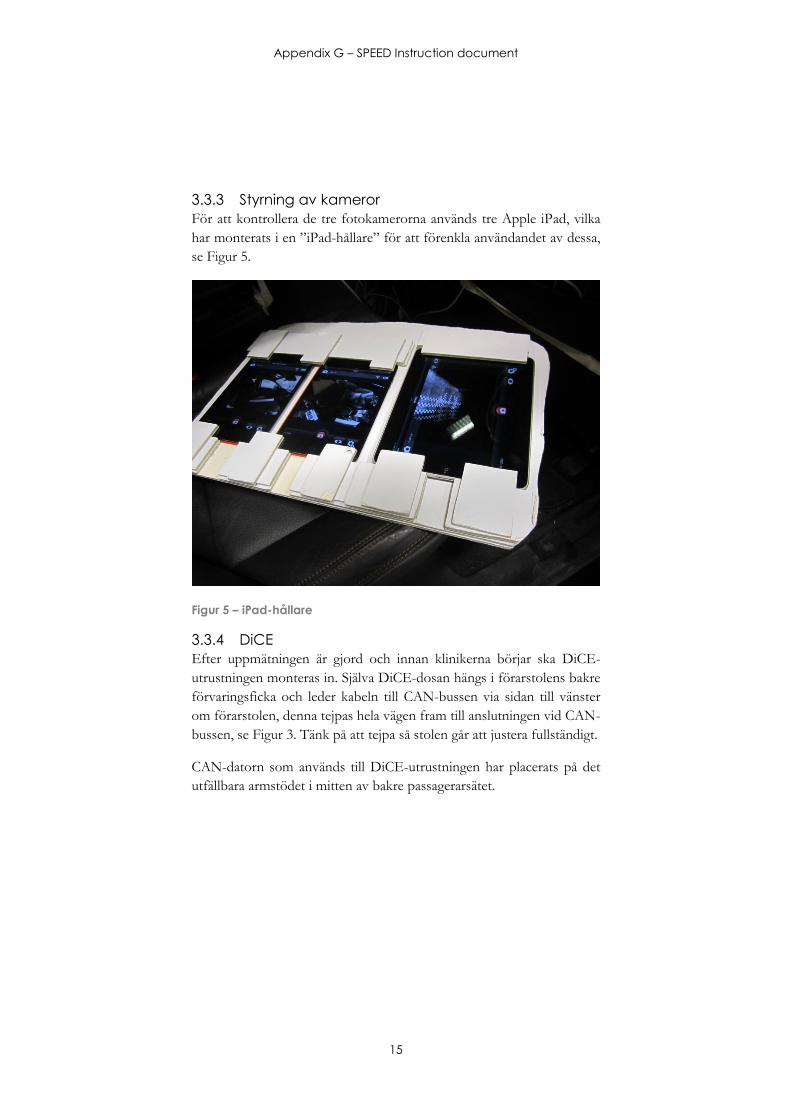
Appendix G – SPEED Instruction document
15
3.3.3 Styrning av kameror
För att kontrollera de tre fotokamerorna används tre Apple iPad, vilka
har monterats i en ”iPad-hållare” för att förenkla användandet av dessa,
se Figur 5.
Figur 5 – iPad-hållare
3.3.4 DiCE
Efter uppmätningen är gjord och innan klinikerna börjar ska DiCE-
utrustningen monteras in. Själva DiCE-dosan hängs i förarstolens bakre
förvaringsficka och leder kabeln till CAN-bussen via sidan till vänster
om förarstolen, denna tejpas hela vägen fram till anslutningen vid CAN-
bussen, se Figur 3. Tänk på att tejpa så stolen går att justera fullständigt.
CAN-datorn som används till DiCE-utrustningen har placerats på det
utfällbara armstödet i mitten av bakre passagerarsätet.
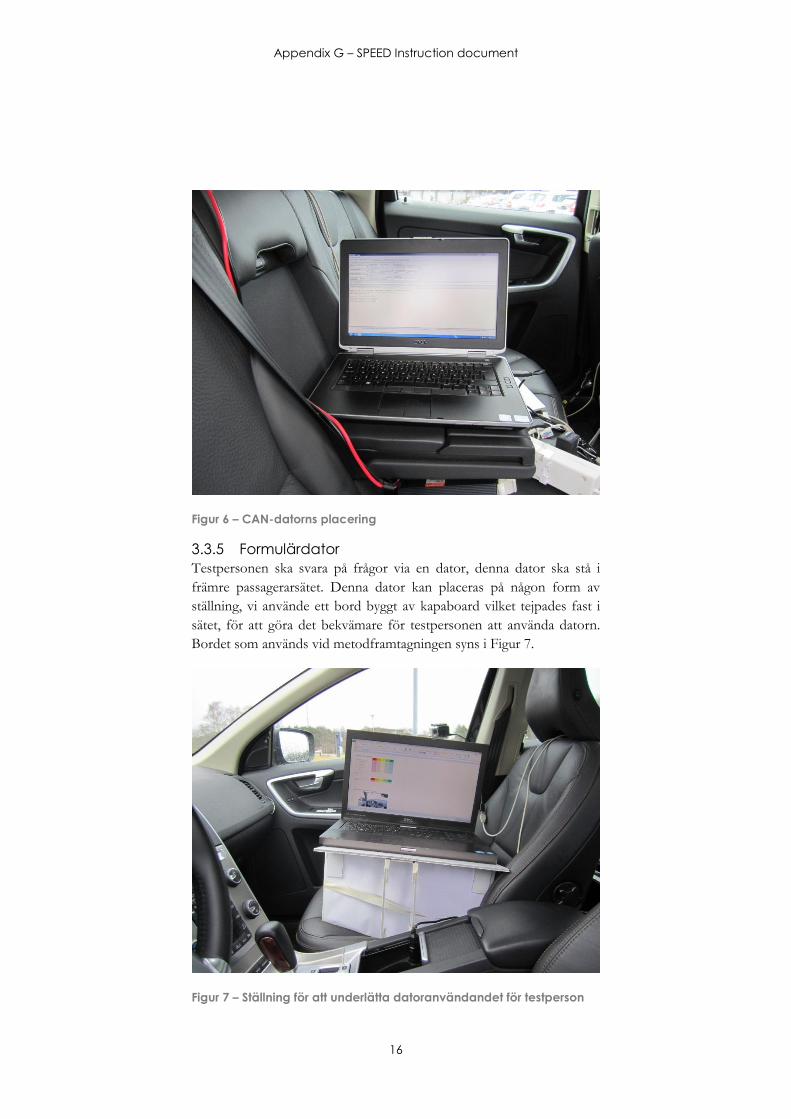
Appendix G – SPEED Instruction document
16
Figur 6 – CAN-datorns placering
3.3.5 Formulärdator
Testpersonen ska svara på frågor via en dator, denna dator ska stå i
främre passagerarsätet. Denna dator kan placeras på någon form av
ställning, vi använde ett bord byggt av kapaboard vilket tejpades fast i
sätet, för att göra det bekvämare för testpersonen att använda datorn.
Bordet som används vid metodframtagningen syns i Figur 7.
Figur 7 – Ställning för att underlätta datoranvändandet för testperson
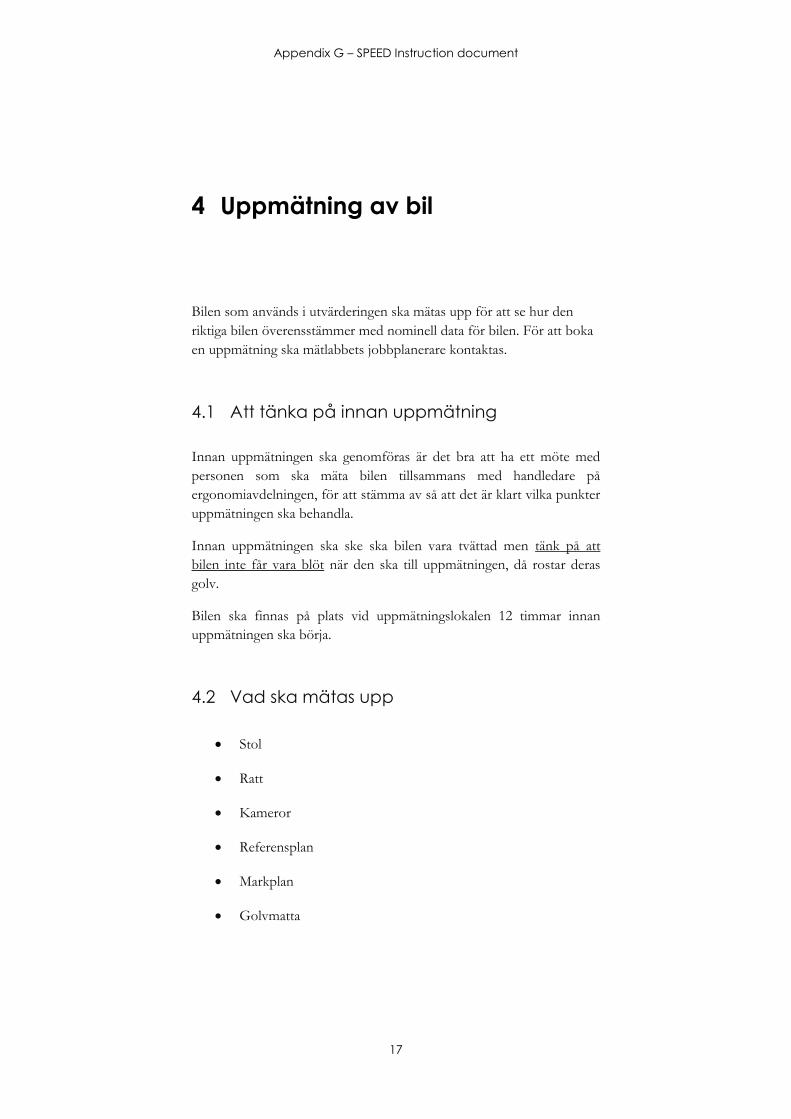
Appendix G – SPEED Instruction document
17
4 Uppmätning av bil
Bilen som används i utvärderingen ska mätas upp för att se hur den
riktiga bilen överensstämmer med nominell data för bilen. För att boka
en uppmätning ska mätlabbets jobbplanerare kontaktas.
4.1 Att tänka på innan uppmätning
Innan uppmätningen ska genomföras är det bra att ha ett möte med
personen som ska mäta bilen tillsammans med handledare på
ergonomiavdelningen, för att stämma av så att det är klart vilka punkter
uppmätningen ska behandla.
Innan uppmätningen ska ske ska bilen vara tvättad men tänk på att
bilen inte får vara blöt när den ska till uppmätningen, då rostar deras
golv.
Bilen ska finnas på plats vid uppmätningslokalen 12 timmar innan
uppmätningen ska börja.
4.2 Vad ska mätas upp
Stol
Ratt
Kameror
Referensplan
Markplan
Golvmatta

Appendix G – SPEED Instruction document
18
Appendix G – SPEED Instruction document
19
5 Stol
5.1 Typ av stol
Olika årsmodeller av bilar använder sig av olika stolar och samma
stolsmodell kan användas i olika bilmodeller. Detta gör att det ibland
kan vara oklart vilken stol som sitter i vilken bilmodell. För att ta reda
på detta kan man ta kontakt med stolsavdelningen om man vet vilken
bilmodell och årsmodell av denna man har. Be stolsavdelningen om
följande information:
Vilken stol som sitter i den specifika bilen
En kinematisk modell av stolen
Vad denna stol har för modellnummer i TCE
Kontaktperson:
Systemansvarig för framsäte
5.2 Läsa ut stolens position
Man läser ut stolens position genom att undersöka stolmotorernas
rörelse. Genom att ansluta sig till bilen kan man läsa av motorernas
pulser i vissa punkter och sedan får dessa översättas till koordinater. För
att undersöka detta får man först ta ut hur stolen rör sig mellan sina
extremlägen, jämföra detta med en kinematisk modell över stolen i
CATIA, för att sedan få bilen (stolen) uppmätt och därmed möjliggöra
att man kan jämföra stolens tänkta rörelse men den verkliga stolens
rörelse. När man mätt upp bilen kan man sedan uppdatera
beräkningarna med de riktiga värdena. Detta leder till att man med hjälp
av utläsning av stolsmotorernas pulser kan få det antal mm som stolen
rör sig, och tillslut få ut stolens position i koordinater.
När man mäter hur stolen rör sig så måste man koppla upp sig mot
bilens dator och använda sig av speciell mätutrustning samt speciell
Appendix G – SPEED Instruction document
20
programvara. För att ta reda på hur man mäter och kopplar upp sig mot
en viss stolsmodell kan man kontakta El-avdelningen.
Berätta för El-avdelningen vilken stolsmodell som används,
informationen som tillhandahållits av stolsavdelningen, så kan
El-avdelningen hjälpa till med att förklara hur man kopplar upp
sig mot stolen.
De vet hur man kontrollerar stolen när man har anslutit sig till
bilens dator samt vilken typ av data man kan få ut, samt hur
stolens motorer har gått i varje specifik stol.
Informationen som fås från El-avdelningen bör innehålla
vilken mätutrustning (DiCE) samt vilken programvara som
behövs (GGD-DHA). För att kontrollera mätutrustning och
programvara behövs även en CAN-dator (även kallad
mätdator). All denna utrustning tillhandahålls av
instrumentutlåningen, se kapitel 3.1.
För att kunna använda sig av DiCE och GGD-DHA behövs
också en databasfil för den specifika bilen/stolen, denna måste
också erhållas från El-avdelningen.
Från El-avdelningen bör koder för att skriva till och läsa från
stolen erhållas, de som sedan används i kapitel 0 och Error!
Reference source not found..
Kontaktpersoner är:
Avdelningschefen på El
Person på El som jobbar med koder till stolar
5.2.1 Koppla upp sig mot bilen/stolen
För att kunna läsa ut stolens position måste man koppla upp sig mot
stolen i bilen, detta gör man genom att använda DiCE och GGD-DHA.
Instruktioner för att använda GGD-DHA finns på
Ergonomiavdelningens gruppdisk. För att göra det enklare vid
beräkningar ska stolen nollställas i ett visst läge. Därefter får man läsa ut
stolens position med hjälp av att läsa av hur många steps dess motorer
har gåt. Till att nollställa och läsa ut information används två olika
koder vilket kan tillhandahållas av El-avdelningen.
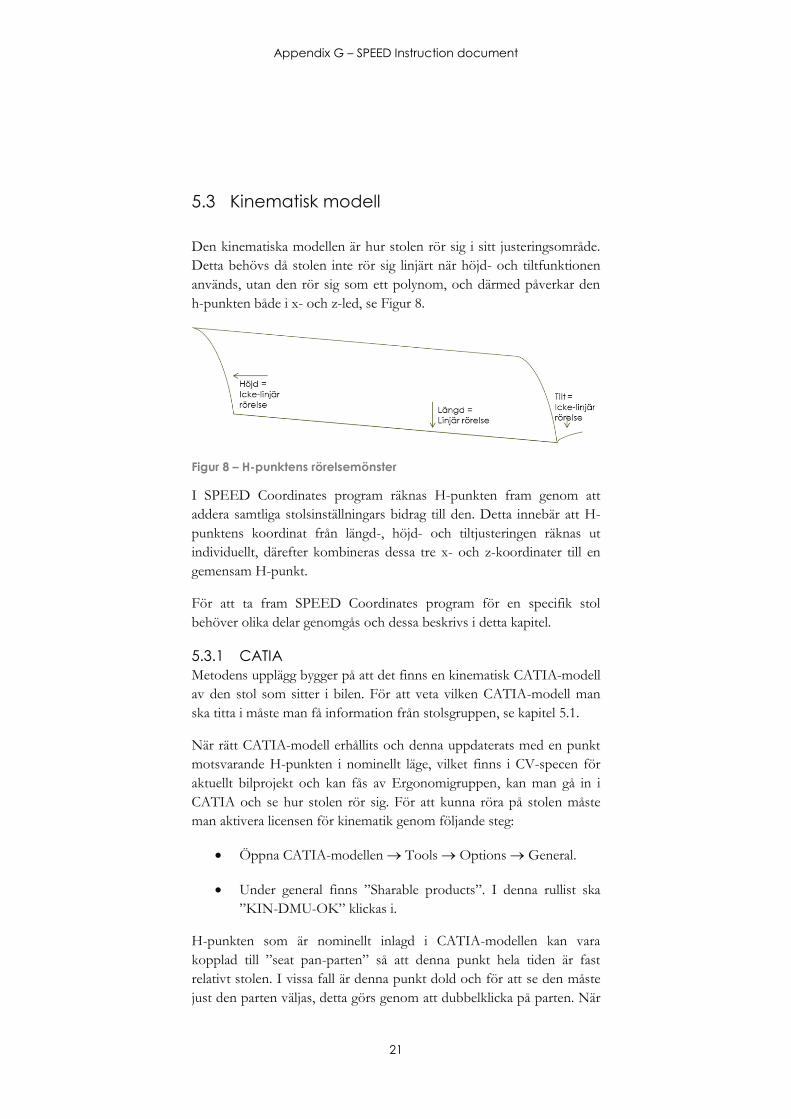
Appendix G – SPEED Instruction document
21
5.3 Kinematisk modell
Den kinematiska modellen är hur stolen rör sig i sitt justeringsområde.
Detta behövs då stolen inte rör sig linjärt när höjd- och tiltfunktionen
används, utan den rör sig som ett polynom, och därmed påverkar den
h-punkten både i x- och z-led, se Figur 8.
Figur 8 – H-punktens rörelsemönster
I SPEED Coordinates program räknas H-punkten fram genom att
addera samtliga stolsinställningars bidrag till den. Detta innebär att H-
punktens koordinat från längd-, höjd- och tiltjusteringen räknas ut
individuellt, därefter kombineras dessa tre x- och z-koordinater till en
gemensam H-punkt.
För att ta fram SPEED Coordinates program för en specifik stol
behöver olika delar genomgås och dessa beskrivs i detta kapitel.
5.3.1 CATIA
Metodens upplägg bygger på att det finns en kinematisk CATIA-modell
av den stol som sitter i bilen. För att veta vilken CATIA-modell man
ska titta i måste man få information från stolsgruppen, se kapitel 5.1.
När rätt CATIA-modell erhållits och denna uppdaterats med en punkt
motsvarande H-punkten i nominellt läge, vilket finns i CV-specen för
aktuellt bilprojekt och kan fås av Ergonomigruppen, kan man gå in i
CATIA och se hur stolen rör sig. För att kunna röra på stolen måste
man aktivera licensen för kinematik genom följande steg:
Öppna CATIA-modellen Tools Options General.
Under general finns ”Sharable products”. I denna rullist ska
”KIN-DMU-OK” klickas i.
H-punkten som är nominellt inlagd i CATIA-modellen kan vara
kopplad till ”seat pan-parten” så att denna punkt hela tiden är fast
relativt stolen. I vissa fall är denna punkt dold och för att se den måste
just den parten väljas, detta görs genom att dubbelklicka på parten. När
Appendix G – SPEED Instruction document
22
man ser punkten kan man använda sig av kinematik-kontrollerna
CATIA har, detta för att röra stolen i sitt justeringsområde. För att
använda sig av kinematiken i CATIA gör man följande:
Tryck på ”Applications” i vänsterträdet i CATIA som visar
parter och dubbelklicka på ”Mechanics”. Det fönster som nu
kommer upp i CATIA visar att stolen står i en viss position,
denna position ska vara SRP. En förklarande bild av detta ses i
SPEED Coordinates program.
De reglage som man kan dra i justerar stolen i längd, höjd och
tilt. Alla marknader har inte samma justeringsområde på stolen,
kontrollera därför med Ergonomiavdelningen att
justeringsområdet är korrekt.
Skulle justeringsområdet behöva ändras, görs detta genom att
trycka på knappen med de tre punkterna längst till höger i rutan
och sedan skriva in nya värden under ”Lowest” och ”Highest”
value.
CATIA-modellen vill vi använda för att jämföra med den riktiga stolen
hur pass bra de nominella värdena är, hur pass bra den riktiga stolen
och stolsmodellen i CATIA stämmer överens.
Genom processen att läsa ut H-punkten ur stolen kommer x- och z-
koordinater som motsvarar stolens extremlägen att behöva läsas ut vid
olika tillfällen. Dessa är kombinationer av följande:
LB = Längst bak
LF = Längst fram
LN = Längst ner
LU = Längst upp
TN = Tilt ned
TU = Tilt upp
I CATIA ska också CV-specen öppnas och jämföras med den
kinematiska modellen så att dessa stämmer överens. CV-specen är en
CATIA-modell full av ”linjer” som bland annat visar var olika
percentiler sitter i bilen och bilens yttre linjer. Här finns även H-
punktens extrempunkter utmärkta och även H-punkten i SRP. För att
få fram CV-specen när man har CV-specnumret gör man följande:
Appendix G – SPEED Instruction document
23
Starta CATIA
Logga in på TeamCenter
I TeamCenter anges CV-specnumret inom två *-tecken.
Dubbelklicka på den översta filen som kommer upp.
Enkelklicka på den översta filen i fönstret på TeamCenter.
I programmets verktygsfält finns en flik ”CATIA”, under
denna flik ska man trycka på ”Load in CATIA”. Om problem
uppstår eller om man inte har tillgång till TeamCenter eller
CATIA kan Ergonomiavdelningen hjälpa till med att ta fram
CV-specen.
Kontaktpersoner är:
Systemansvarig för framsäte
Ergonomigruppen
5.3.2 Uträkning av H-punkt
För att räkna ut H-punkten kommer excelprogrammet SPEED
Coordinates program att användas. Här finns förbereda formler som
räknar ut H-punktens koordinater när data har matats in i dess
grönmarkerade områden. Det första man ser när man öppnar detta
program är diagram som visar H-punktens justeringsområde samt
Rygglutning. Programmet består av olika delar, varav del 1 är där man
matar in data från stolen för att programmet ska kunna räkna ut H-
punkten och del 2 är där man kan utläsa H-punktens koordinater
utifrån samtliga uträkningar. I programmet kommer först en del basdata
angående stolen behöva matas in, det ska matas in data från både
CATIA, CV-specen, hur motorerna rör sig i stolen och uppmätningen
av bilen. All data ska jämföras så att man ser att den stämmer överens.
När bilen är uppmätt får man uppdatera SPEED Coordinates program
så att det är aktuellt och visar koordinater för den uppmätta bilen.
Basdata
Till att börja med i SPEED Coordinates program ska en del basdata
matas in, detta under del 3.1. Här börjar man med att använda sig av
CATIA och se vad H-punkten har för koordinater i extremlägena samt
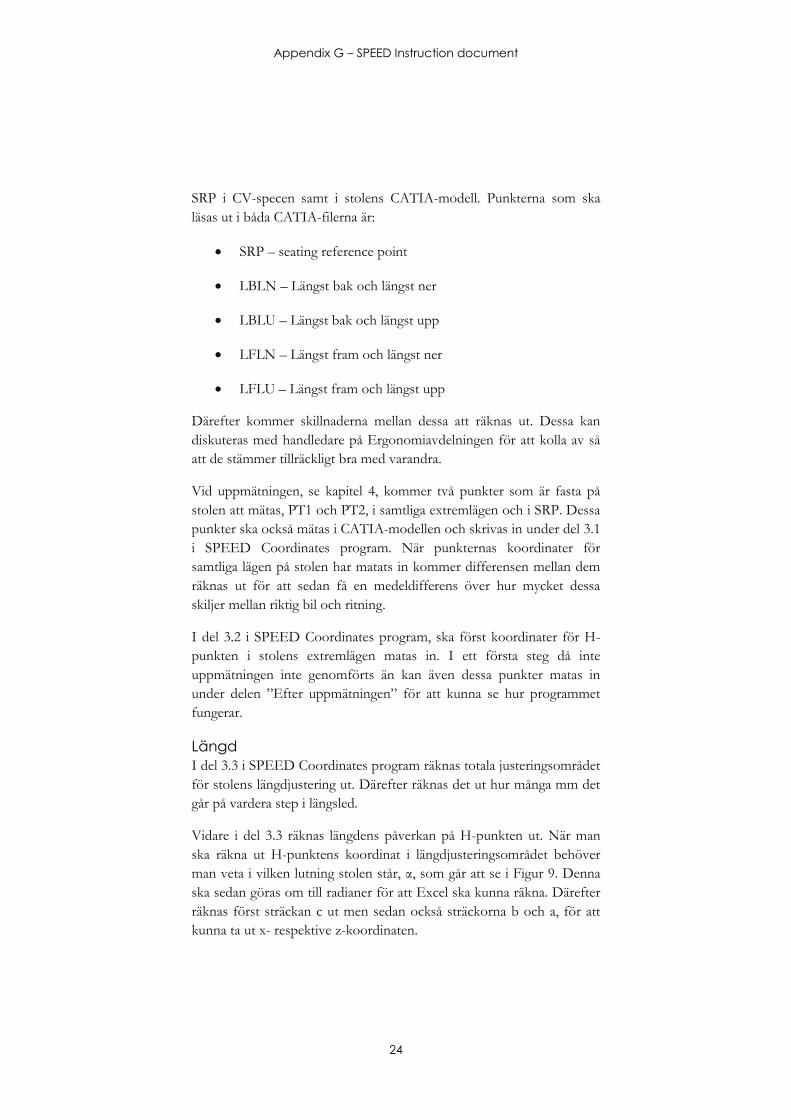
Appendix G – SPEED Instruction document
24
SRP i CV-specen samt i stolens CATIA-modell. Punkterna som ska
läsas ut i båda CATIA-filerna är:
SRP – seating reference point
LBLN – Längst bak och längst ner
LBLU – Längst bak och längst upp
LFLN – Längst fram och längst ner
LFLU – Längst fram och längst upp
Därefter kommer skillnaderna mellan dessa att räknas ut. Dessa kan
diskuteras med handledare på Ergonomiavdelningen för att kolla av så
att de stämmer tillräckligt bra med varandra.
Vid uppmätningen, se kapitel 4, kommer två punkter som är fasta på
stolen att mätas, PT1 och PT2, i samtliga extremlägen och i SRP. Dessa
punkter ska också mätas i CATIA-modellen och skrivas in under del 3.1
i SPEED Coordinates program. När punkternas koordinater för
samtliga lägen på stolen har matats in kommer differensen mellan dem
räknas ut för att sedan få en medeldifferens över hur mycket dessa
skiljer mellan riktig bil och ritning.
I del 3.2 i SPEED Coordinates program, ska först koordinater för H-
punkten i stolens extremlägen matas in. I ett första steg då inte
uppmätningen inte genomförts än kan även dessa punkter matas in
under delen ”Efter uppmätningen” för att kunna se hur programmet
fungerar.
Längd
I del 3.3 i SPEED Coordinates program räknas totala justeringsområdet
för stolens längdjustering ut. Därefter räknas det ut hur många mm det
går på vardera step i längsled.
Vidare i del 3.3 räknas längdens påverkan på H-punkten ut. När man
ska räkna ut H-punktens koordinat i längdjusteringsområdet behöver
man veta i vilken lutning stolen står, α, som går att se i Figur 9. Denna
ska sedan göras om till radianer för att Excel ska kunna räkna. Därefter
räknas först sträckan c ut men sedan också sträckorna b och a, för att
kunna ta ut x- respektive z-koordinaten.
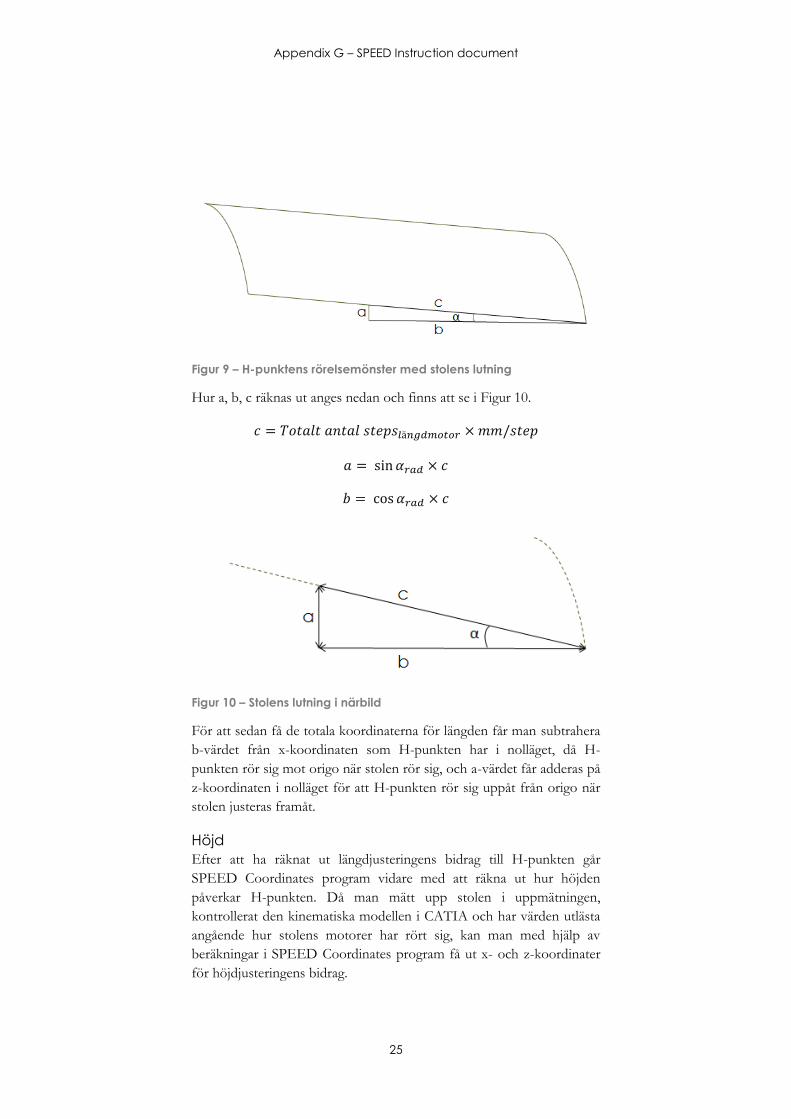
Appendix G – SPEED Instruction document
25
Figur 9 – H-punktens rörelsemönster med stolens lutning
Hur a, b, c räknas ut anges nedan och finns att se i Figur 10.
Figur 10 – Stolens lutning i närbild
För att sedan få de totala koordinaterna för längden får man subtrahera
b-värdet från x-koordinaten som H-punkten har i nolläget, då H-
punkten rör sig mot origo när stolen rör sig, och a-värdet får adderas på
z-koordinaten i nolläget för att H-punkten rör sig uppåt från origo när
stolen justeras framåt.
Höjd
Efter att ha räknat ut längdjusteringens bidrag till H-punkten går
SPEED Coordinates program vidare med att räkna ut hur höjden
påverkar H-punkten. Då man mätt upp stolen i uppmätningen,
kontrollerat den kinematiska modellen i CATIA och har värden utlästa
angående hur stolens motorer har rört sig, kan man med hjälp av
beräkningar i SPEED Coordinates program få ut x- och z-koordinater
för höjdjusteringens bidrag.
Appendix G – SPEED Instruction document
26
Tilt
Tiltens bidrag till H-punkten räknas ut på samma sätt som höjdens
bidrag i SPEED Coordinates program. Samma typ av data behövs för
att sedan programmet ska räkna ut x- och z-koordinater.
Ihopläggning till en H-punkt
Till sist läggs samtliga bidrag ihop i x- och z-led för att skapa den
slutliga H-punkten. Därefter plottas denna ut i ett diagram vilket också
visar extremlägen för H-punkten och ett område motsvarande alla de
punkter denna kan ha.
Rygglutning
Rygglutningen räknas ut i samma dokument som H-punktsuträkningen,
under del 4. Denna kan räknas ut först då uppmätningen är gjord och
man har fått koordinater för en nedre och en övre punkt på stolsryggen
med steps loggade för vartdera koordinatpar, vilka symboliserar olika
lutningar på manikinen.
I del 4.1 listas först de grader som manikinen satt i vid uppmätningen,
sedan var grads motsvarande koordinatpar för den nedre (punkt 3) och
övre (punkt 4) mätta punkten, därefter skriv även det loggade
stepvärdet in. Längst till höger i 4.1 räknas det totala stepvärdet ut som
är från det absolut bakersta läget på stolsryggen.
I del 4.2 görs en liknande interpolering som tidigare gjorts i del 3.4 och
3.5 för höjden respektive tilten, för att kunna få ut de koordinatpar för
övre och nedre punkten som ligger mellan de uppmätta baserade på
vilket stepvärde som matas in i del 1 i SPEED Coordinates program.
Vad vi egentligen vill ha i denna beräkning är vilken lutning som en
testdeltagare har i stolen med det stepvärdet som motorn i stolsryggen
har. I del 4.3 används pythagoras sats för att räkna ut vinkeln α, vilket är
vinkeln mellan läget där stolen står rakt upp, b, och där den faktiskt är
vid valt step, c. Dessa sträckor och vinkeln kan ses i Figur 11. Vinkeln
som presenteras är alltså stolsryggsvinkeln. För att få rygglutningen hos
manikinen får ytterligare en beräkning göras, del 4.4.
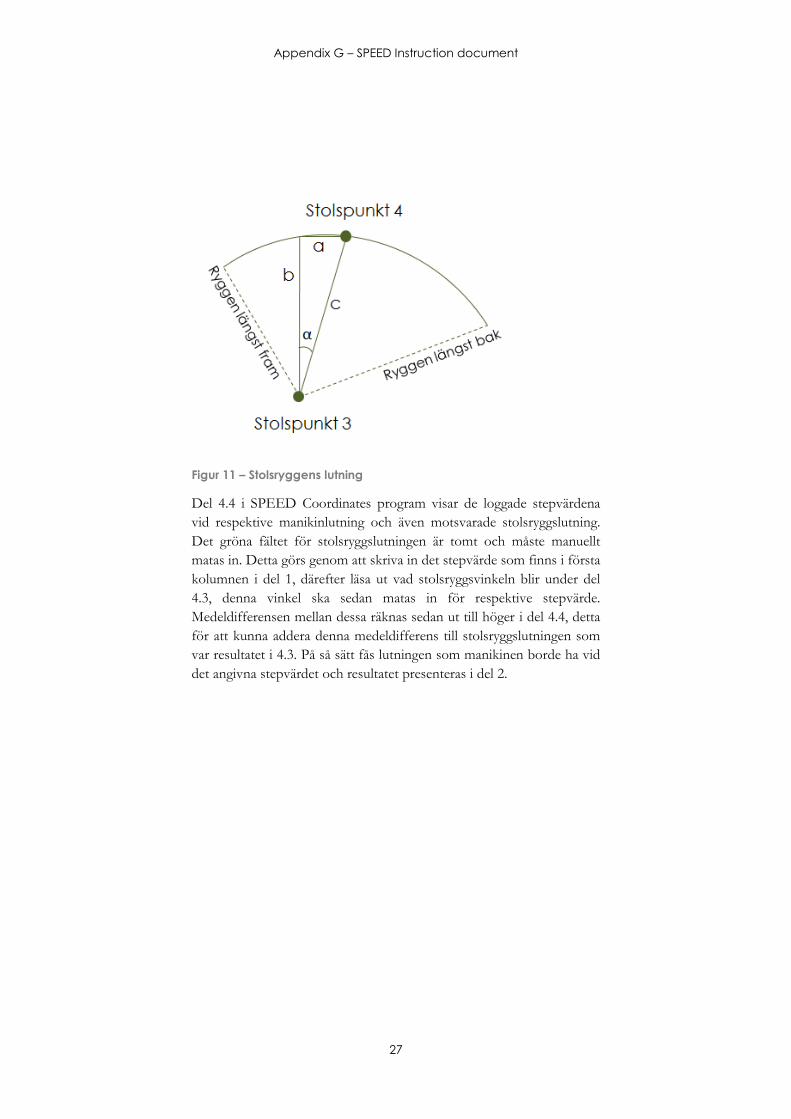
Appendix G – SPEED Instruction document
27
Figur 11 – Stolsryggens lutning
Del 4.4 i SPEED Coordinates program visar de loggade stepvärdena
vid respektive manikinlutning och även motsvarade stolsryggslutning.
Det gröna fältet för stolsryggslutningen är tomt och måste manuellt
matas in. Detta görs genom att skriva in det stepvärde som finns i första
kolumnen i del 1, därefter läsa ut vad stolsryggsvinkeln blir under del
4.3, denna vinkel ska sedan matas in för respektive stepvärde.
Medeldifferensen mellan dessa räknas sedan ut till höger i del 4.4, detta
för att kunna addera denna medeldifferens till stolsryggslutningen som
var resultatet i 4.3. På så sätt fås lutningen som manikinen borde ha vid
det angivna stepvärdet och resultatet presenteras i del 2.

Appendix G – SPEED Instruction document
28
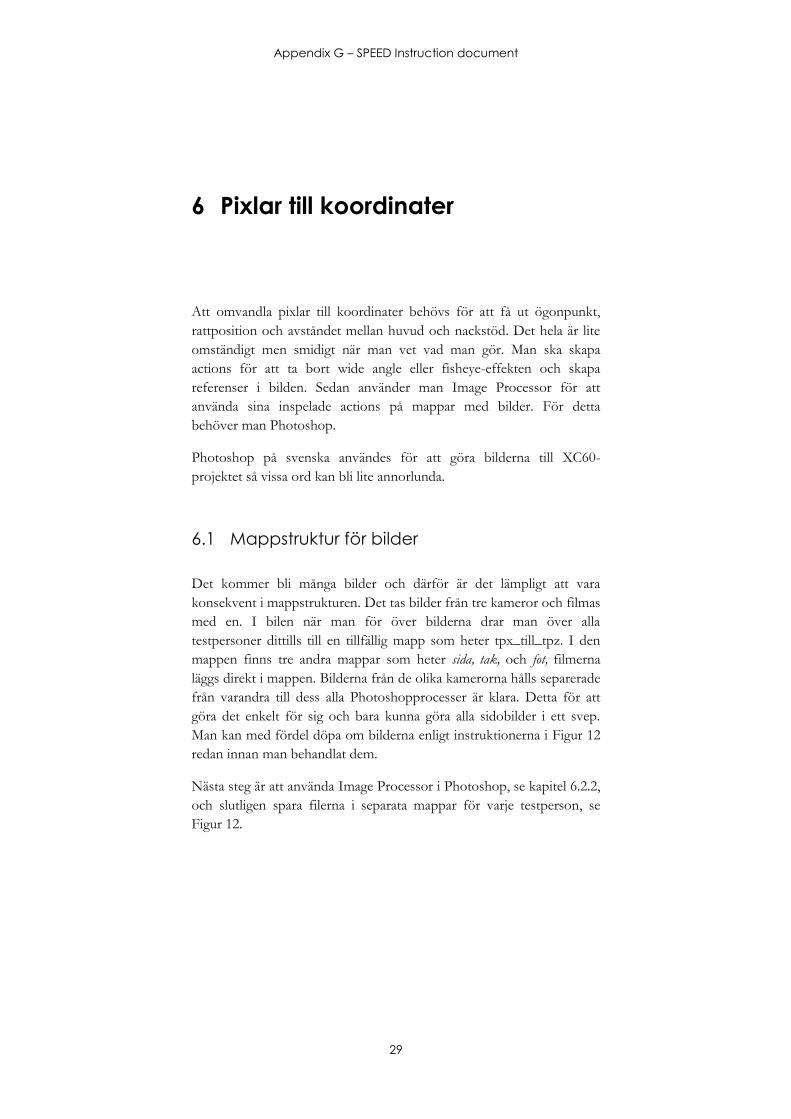
Appendix G – SPEED Instruction document
29
6 Pixlar till koordinater
Att omvandla pixlar till koordinater behövs för att få ut ögonpunkt,
rattposition och avståndet mellan huvud och nackstöd. Det hela är lite
omständigt men smidigt när man vet vad man gör. Man ska skapa
actions för att ta bort wide angle eller fisheye-effekten och skapa
referenser i bilden. Sedan använder man Image Processor för att
använda sina inspelade actions på mappar med bilder. För detta
behöver man Photoshop.
Photoshop på svenska användes för att göra bilderna till XC60-
projektet så vissa ord kan bli lite annorlunda.
6.1 Mappstruktur för bilder
Det kommer bli många bilder och därför är det lämpligt att vara
konsekvent i mappstrukturen. Det tas bilder från tre kameror och filmas
med en. I bilen när man för över bilderna drar man över alla
testpersoner dittills till en tillfällig mapp som heter tpx_till_tpz. I den
mappen finns tre andra mappar som heter sida, tak, och fot, filmerna
läggs direkt i mappen. Bilderna från de olika kamerorna hålls separerade
från varandra till dess alla Photoshopprocesser är klara. Detta för att
göra det enkelt för sig och bara kunna göra alla sidobilder i ett svep.
Man kan med fördel döpa om bilderna enligt instruktionerna i Figur 12
redan innan man behandlat dem.
Nästa steg är att använda Image Processor i Photoshop, se kapitel 6.2.2,
och slutligen spara filerna i separata mappar för varje testperson, se
Figur 12.
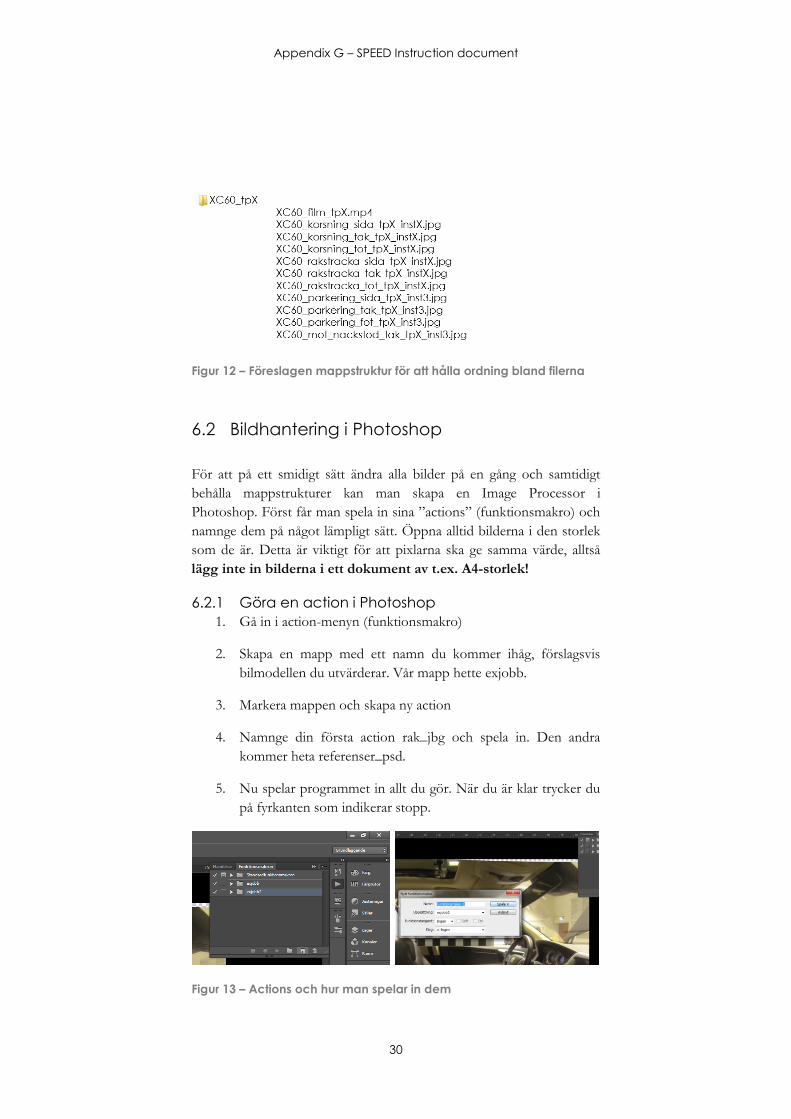
Appendix G – SPEED Instruction document
30
Figur 12 – Föreslagen mappstruktur för att hålla ordning bland filerna
6.2 Bildhantering i Photoshop
För att på ett smidigt sätt ändra alla bilder på en gång och samtidigt
behålla mappstrukturer kan man skapa en Image Processor i
Photoshop. Först får man spela in sina ”actions” (funktionsmakro) och
namnge dem på något lämpligt sätt. Öppna alltid bilderna i den storlek
som de är. Detta är viktigt för att pixlarna ska ge samma värde, alltså
lägg inte in bilderna i ett dokument av t.ex. A4-storlek!
6.2.1 Göra en action i Photoshop
1. Gå in i action-menyn (funktionsmakro)
2. Skapa en mapp med ett namn du kommer ihåg, förslagsvis
bilmodellen du utvärderar. Vår mapp hette exjobb.
3. Markera mappen och skapa ny action
4. Namnge din första action rak_jbg och spela in. Den andra
kommer heta referenser_psd.
5. Nu spelar programmet in allt du gör. När du är klar trycker du
på fyrkanten som indikerar stopp.
Figur 13 – Actions och hur man spelar in dem
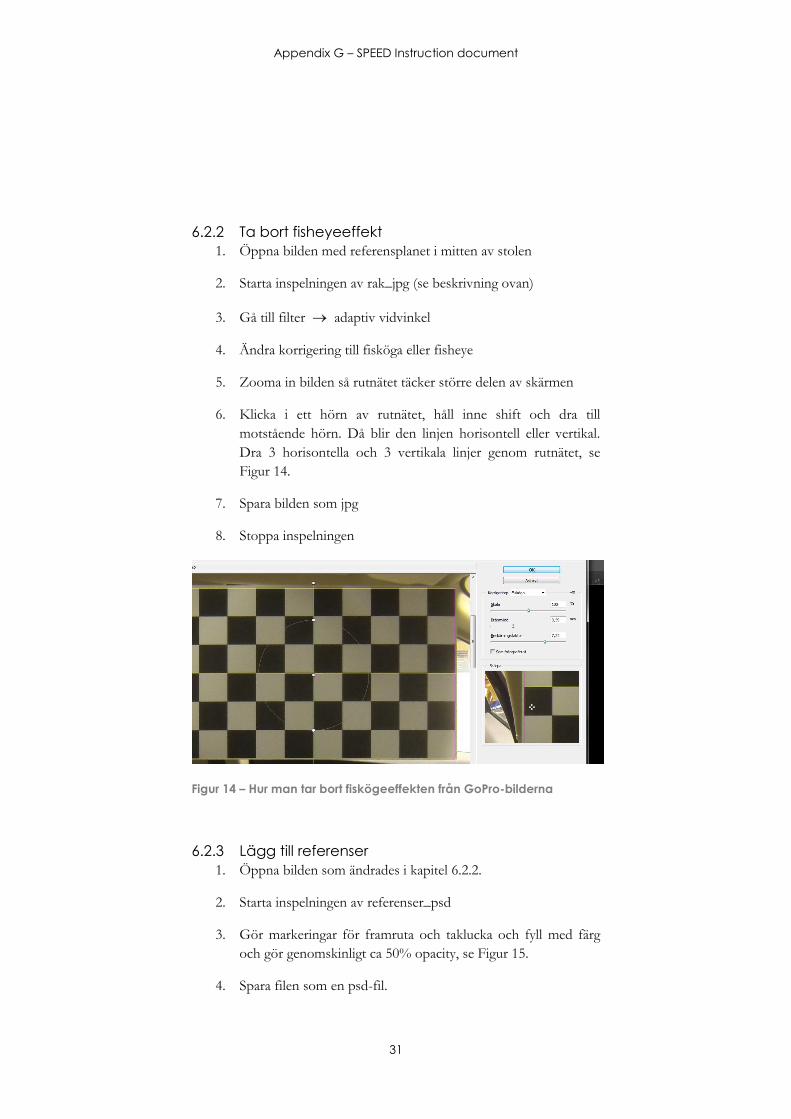
Appendix G – SPEED Instruction document
31
6.2.2 Ta bort fisheyeeffekt
1. Öppna bilden med referensplanet i mitten av stolen
2. Starta inspelningen av rak_jpg (se beskrivning ovan)
3. Gå till filter adaptiv vidvinkel
4. Ändra korrigering till fisköga eller fisheye
5. Zooma in bilden så rutnätet täcker större delen av skärmen
6. Klicka i ett hörn av rutnätet, håll inne shift och dra till
motstående hörn. Då blir den linjen horisontell eller vertikal.
Dra 3 horisontella och 3 vertikala linjer genom rutnätet, se
Figur 14.
7. Spara bilden som jpg
8. Stoppa inspelningen
Figur 14 – Hur man tar bort fiskögeeffekten från GoPro-bilderna
6.2.3 Lägg till referenser
1. Öppna bilden som ändrades i kapitel 6.2.2.
2. Starta inspelningen av referenser_psd
3. Gör markeringar för framruta och taklucka och fyll med färg
och gör genomskinligt ca 50% opacity, se Figur 15.
4. Spara filen som en psd-fil.
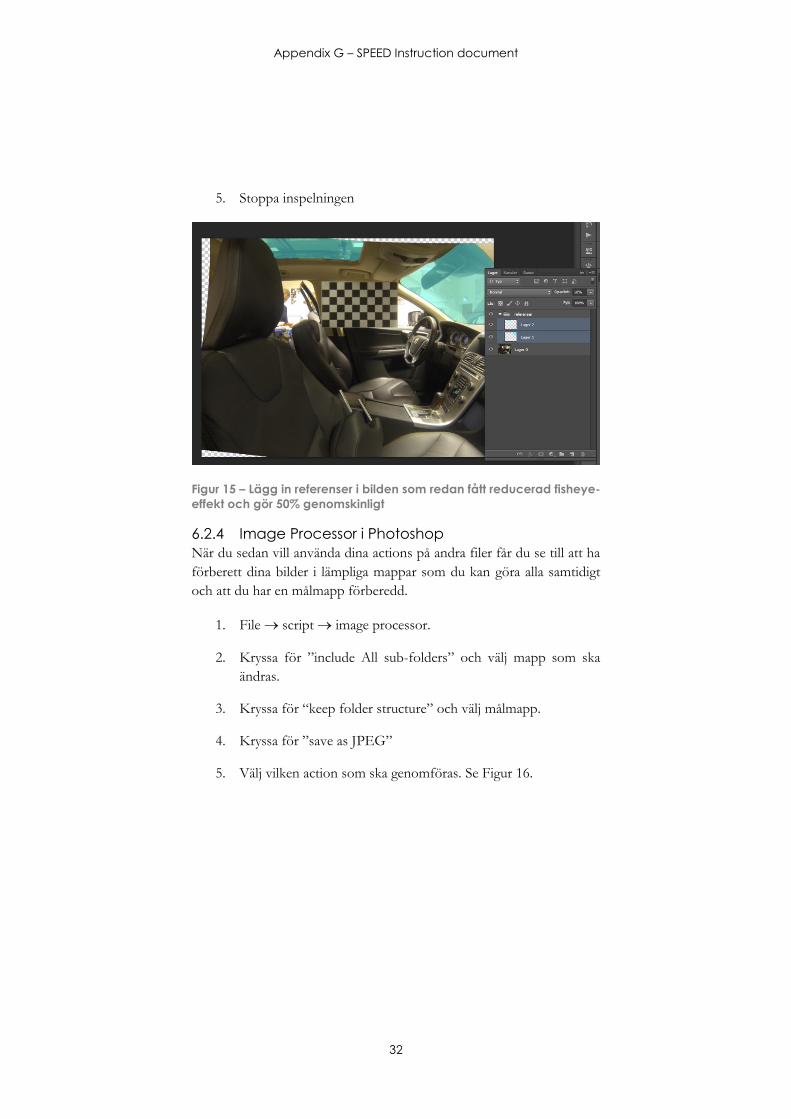
Appendix G – SPEED Instruction document
32
5. Stoppa inspelningen
Figur 15 – Lägg in referenser i bilden som redan fått reducerad fisheye-
effekt och gör 50% genomskinligt
6.2.4 Image Processor i Photoshop
När du sedan vill använda dina actions på andra filer får du se till att ha
förberett dina bilder i lämpliga mappar som du kan göra alla samtidigt
och att du har en målmapp förberedd.
1. File script image processor.
2. Kryssa för ”include All sub-folders” och välj mapp som ska
ändras.
3. Kryssa för “keep folder structure” och välj målmapp.
4. Kryssa för ”save as JPEG”
5. Välj vilken action som ska genomföras. Se Figur 16.
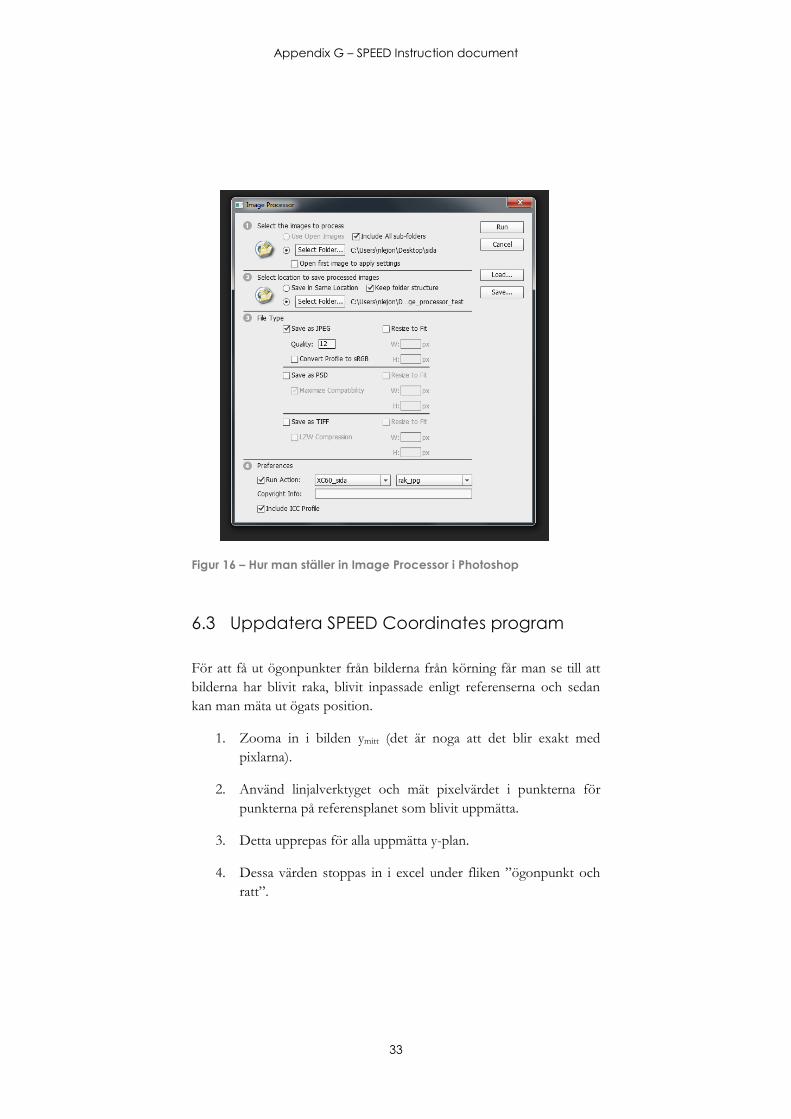
Appendix G – SPEED Instruction document
33
Figur 16 – Hur man ställer in Image Processor i Photoshop
6.3 Uppdatera SPEED Coordinates program
För att få ut ögonpunkter från bilderna från körning får man se till att
bilderna har blivit raka, blivit inpassade enligt referenserna och sedan
kan man mäta ut ögats position.
1. Zooma in i bilden ymitt (det är noga att det blir exakt med
pixlarna).
2. Använd linjalverktyget och mät pixelvärdet i punkterna för
punkterna på referensplanet som blivit uppmätta.
3. Detta upprepas för alla uppmätta y-plan.
4. Dessa värden stoppas in i excel under fliken ”ögonpunkt och
ratt”.
Appendix G – SPEED Instruction document
34
6.4 Få ut ögonpunkter
Först får man uppdatera SPEED Coordinates program innan man kan
få ut koordinater från ögats pixelvärde. När pixelvärdena från alla bilder
och koordinaterna från uppmätningen är skrivna fylls diagrammen upp
automatiskt och de tillhörande trendlinjerna uppdaterar man med i
Excel-sheetet. Det står väl förklarat i SPEED Coordinates program hur
man ska göra, hur det kan se ut ser man i Figur 18.
1. Öppna en bild från tredje körinställningen från raksträcka som
är behandlad enligt beskrivningarna ovan.
2. Zooma in på ögat
3. Använd linjalverktyget och mät pixelvärdet i mitten av pupillen.
4. Skriv upp x- och y-värdet (se Figur 17) i ett Excel-dokument
som du sedan kan kopiera över värdena till SPEED
Coordinates program från.
5. Gör samma för motsvarande persons bild med huvudet mot
nackstödet.
Om testpersonen har glasögon och ögat inte syns:
1. Mät ögonpunkten på kortet taget mot nackstödet utan glasögon
2. Hitta en referenspunkt på glasögonen på motsvarande persons
kort med glasögon
3. Mät referenspunkten och ta ut en skillnad mellan ögats position
och glasögonreferensens punkt.
4. Från kortet taget på raksträcka får man ta ut pixelvärdet för
referenspunkten och räkna ut vad ögonpunkten borde vara.
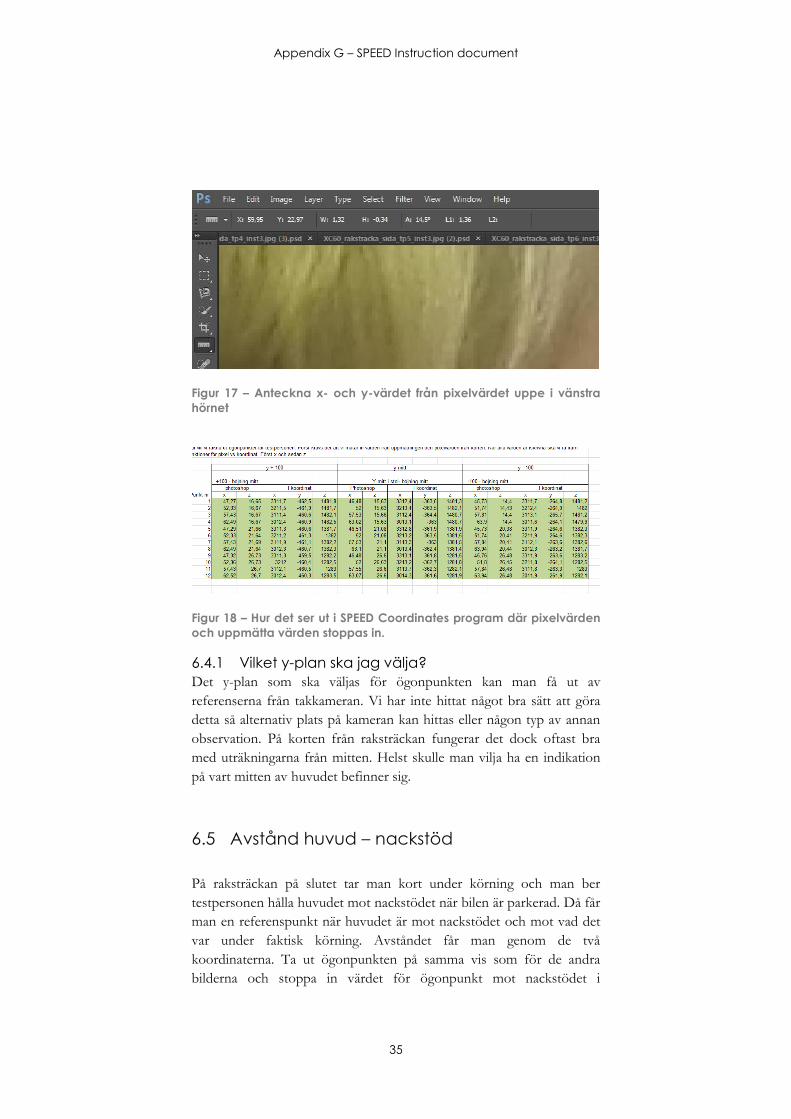
Appendix G – SPEED Instruction document
35
Figur 17 – Anteckna x- och y-värdet från pixelvärdet uppe i vänstra
hörnet
Figur 18 – Hur det ser ut i SPEED Coordinates program där pixelvärden
och uppmätta värden stoppas in.
6.4.1 Vilket y-plan ska jag välja?
Det y-plan som ska väljas för ögonpunkten kan man få ut av
referenserna från takkameran. Vi har inte hittat något bra sätt att göra
detta så alternativ plats på kameran kan hittas eller någon typ av annan
observation. På korten från raksträckan fungerar det dock oftast bra
med uträkningarna från mitten. Helst skulle man vilja ha en indikation
på vart mitten av huvudet befinner sig.
6.5 Avstånd huvud – nackstöd
På raksträckan på slutet tar man kort under körning och man ber
testpersonen hålla huvudet mot nackstödet när bilen är parkerad. Då får
man en referenspunkt när huvudet är mot nackstödet och mot vad det
var under faktisk körning. Avståndet får man genom de två
koordinaterna. Ta ut ögonpunkten på samma vis som för de andra
bilderna och stoppa in värdet för ögonpunkt mot nackstödet i
Appendix G – SPEED Instruction document
36
sammanställningsdokumentet för testpersonerna. Avståndet räknas då
ut automatiskt.
6.6 Rattposition
Ratten kan justeras in och ut och upp och ner och extremlägena är
kombinationer av längst ner (LN), längst upp (LU), längst fram (LF)
och längst bak (LB) alltså samma förkortningar som för
stolsjusteringen. Längst fram är därför närmast huven. Rattens position
mäts från mitten av ratten, i bilen som användes under
metodutvecklingen var detta en punkt i volvomärket. Koordinaterna för
rattens positioner får man ur uppmätningen.
Man går tillväga på samma sätt som för ögonpunkterna, se kapitel 6.3
och 6.4. Börja med att uppdatera SPEED Coordinates program för att
sedan ta ut pixelvärdet för mittpunkten av märket placerat mitt på
ratten.
6.6.1 Utläsning av rattposition
Rattens position läser man ut av korten som tas ur färd. Innan det
måste man dock förbereda med rutnätet som beskrivs i kapitel .
Planet ska alltså placeras med y i rattens mitt och kort ska tas i samband
med att uppmätningen sker. Hur man omvandlar pixlar till koordinater
sker på samma sätt som för ögonpunkterna i samma sheet i excel. Ta
även med extremlägena från uppmätningen och jämför med
pixelvärdena.
Appendix G – SPEED Instruction document
37
7 Boka klinikpersoner
7.1 Testkliniklistan
Ur testkliniklistan tas testpersonerna, ansvarig person på
Ergonomiavdelningen för denna lista vet vilken version som ska
användas. Vi vill inte trakassera folk för mycket så en tumregel är att
kalla de som varit med minst antal gånger. Detta är svårt för extremerna
så försök att inte kalla folk som varit med mer än åtta gånger i en klinik.
7.2 Urval
Till sittpositionskliniken har vi tre urvalsgrupper. Korta, medel och
långa. I korta gruppen har vi 15 kvinnor <20%il. I medel har vi 8
kvinnor >20%il och 8 män <90%il. I den långa gruppen har vi 15 män
>90%il.
7.3 Bokning via doodle
Bokning sker lättast via doodle. Förbered de tider som ni ska ha till
förfogande och tänk på att det kan vara lättare för folk att boka in sig
tidigt på morgonen (07.30) eller vid lunch. Ha fler tider än personer ni
behöver och boka in ett par extra per urvalsgrupp. Skicka ut en
testversion till några i gruppen så ni ser att den fungerar. Gör
inställningen att man bara ska kunna boka in en person per tid.
7.4 Mail för utskick
Man kan med fördel skicka ut kallelse till de korta först, efter en dag
eller två till de långa och sist till medelgruppen. Detta är för att det är
svårast att få de korta att anmäla sig. När det närmar sig tiden för
kliniken kan det vara bra att skicka ut ett ”påminnelsemail” som inte är
ett påminnelsemail eller lägga till ytterligare detaljer i kallelsen. Skriv
Appendix G – SPEED Instruction document
38
bara till ett par extra detaljer och välkomna dem till kliniken så att de
inte glömt bort att de anmält sig.
7.4.1 Mail 1
Mailet som man skickar ut först kan se ut så här:
Hej!
Avdelningen Craftsmanship and Ergonomics behöver din hjälp
med att tycka till om möjligheterna för en bra sittposition i
bilmodellen XC60.
Du finns med i den testpersonlista som avdelningen använder
sig av när de behöver försökspersoner till något av deras tester
och därför är du nu inbjuden att delta.
Utvärderingen kommer att ske under vecka 15, 16 och tar ca 45
minuter och vi har ett antal frågor där vi vill att man bedömer
sittpositionen.
Under utvärderingen kommer man att köra en kortare sväng och
sittpositionen kommer dokumenteras i form av några foton
samt frågor som ställs efter man kört klart. Frågorna kommer att
läsas och besvaras på en dator så eventuella läsglasögon kan vara
bra att ha med.
Om du vill delta följer du bara länken nedan och bokar in dig på
en tid som passar genom att skriva in ditt namn, CDS ID och
telefonnummer på raden längst ned ("Ditt namn"). Man väljer
tid genom att ställa sig över en blå tid och markera Ja i rutan
som dyker upp. Gråa tider är redan upptagna. Glöm inte att
spara!
Länk till tidsbokning: http://doodle.com/adzeg5t93srky2nv
Vi kommer att utgå från PV-porten och under vecka 14 kommer
du som bokat in dig att få en bekräftelse av oss samt lite mer
info.
Har du frågor kontakta gärna Namn Efternamn (CDSID,
telefonnummer) eller Namn Efternamn (CDSID, telefonnummer)
Välkommen!
Med vänliga hälsningar
Namn och Namn
Appendix G – SPEED Instruction document
39
7.4.2 Mail 2
Eftersom folk inte alltid anmäler sig efter första mailet får man skicka ut
ett till mail till de som inte anmält sig. Vi ska vara noggranna så vi inte
skickar ut mail till de som varit duktiga och anmält sig redan. Mail 2
fungerar som en påminnelse men ska inte se ut som en påminnelse.
Mail 2 kan se ut så här:
Hej!
Du har tidigare i veckan fått mail om möjligheten att delta i en
ergonomiklinik för avdelningen Craftsmanship and Ergonomics
vecka 15 och 16. Vi vill meddela att det fortfarande finns
möjlighet att delta och tycka till om möjligheterna för en bra
sittposition i bilmodellen XC60.
Om du vill delta följer du bara länken nedan och bokar in dig på
en tid som passar genom att skriva in ditt namn, CDS ID och
telefonnummer på raden längst ned ("Ditt namn"). Man väljer
tid genom att ställa sig över en blå tid och markera Ja i rutan
som dyker upp. Gråa tider är redan upptagna. Glöm inte att
spara!
Länk till tidsbokning: http://doodle.com/adzeg5t93srky2nv
Vi kommer att utgå från PV-porten och under vecka 14 kommer
du som bokat in dig att få en bekräftelse av oss samt lite mer
info.
Har du frågor kontakta gärna Namn Efternamn (CDSID,
telefonnummer) eller Namn Efternamn (CDSID, telefonnummer)
Välkommen!
Med vänliga hälsningar
Namn och Namn
Appendix G – SPEED Instruction document
40
7.5 Kallelse
Inom några dagar efter att folk börjat anmäla sig skickar ni ut en
individuell kallelse för varje person. Där ska tid, dag och mötesplats
vara aktuellt och en tillhörande text finnas med. Den tillhörande texten
kan se ut så här:
Subject: Ergonomiklinik på Volvo Torslanda
Location: Parkeringen utanför PV-porten
Hej,
Vad kul att du har anmält dig att delta i ergonomikliniken! Under
kliniken kommer man att köra ett par kortare sträckor och
sittpositionen kommer dokumenteras med foton och genom
frågor som ställs efter man kört klart. Inga frågor kommer att
ställas under färd. Utvärderingen kommer utgå och avslutas vid
parkeringen utanför PV-porten (se bild nedan) och det beräknas
ta ca 45 minuter.
Eftersom du kommer köra bil kan det var bra att tänka på att ha
körbara skor på sig. Vi ser helst att du inte har någon bylsig jacka
på dig under färd, men mellan körningarna kommer du få gå ur
bilen då stolens inställningar nollas. Då frågor kommer att läsas
och besvaras av dig på en dator kan eventuella läsglasögon vara
bra att ha med sig.
Har du frågor kontakta gärna Namn Efternamn (CDSID,
telefonnummer) eller Namn Efternamn (CDSID, telefonnummer)
Välkommen!
Med vänliga hälsningar
Namn och Namn
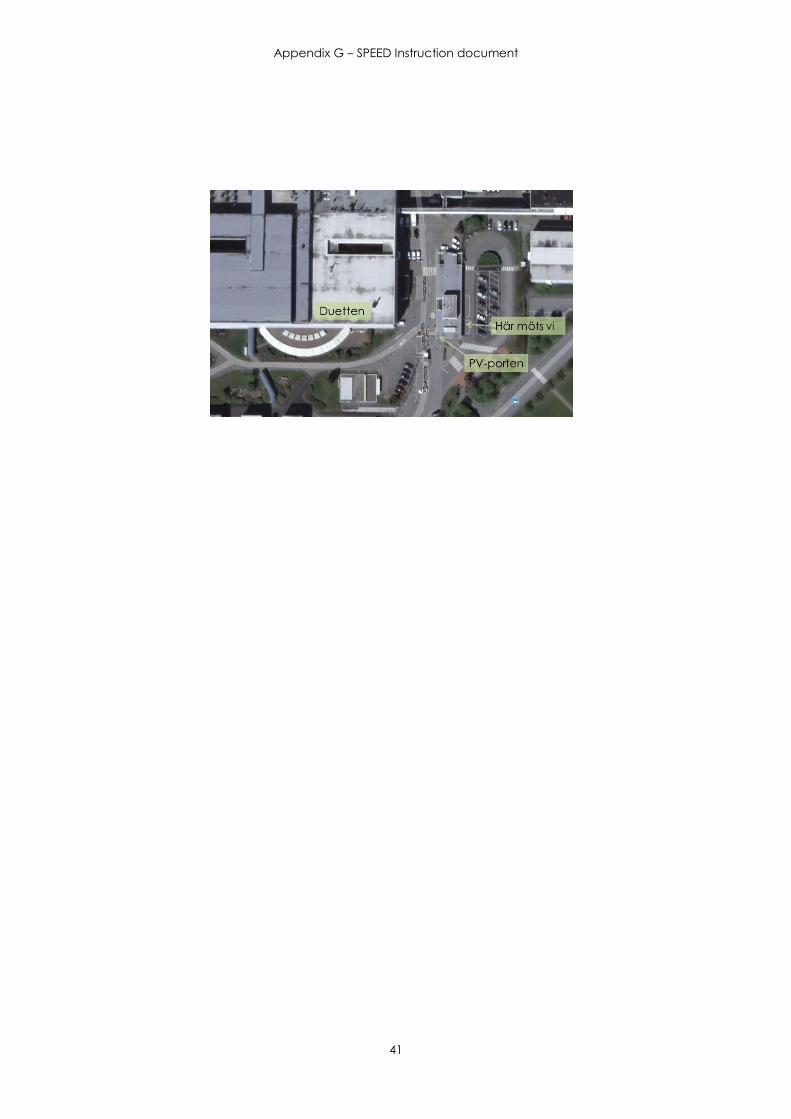
Appendix G – SPEED Instruction document
41

Appendix G – SPEED Instruction document
42
Appendix G – SPEED Instruction document
43
8 Klinik och sammanställning
För att kunna göra sammanställning av samtliga testpersoners ifyllda
svarsformulär har ett sammanställningsdokument förberetts.
8.1 Klinikinstruktioner för SPEED
De instruktioner som finns här under kapitel 8.1 bör skrivas ut och
finnas i bilen under utförandet av kliniken. De syftar till att kliniken ska
utföras på samma sätt oavsett vem som är testledare och att
utvärderingarna i framtiden ska kunna jämföras mot varandra.
8.1.1 Introduktion (2 min)
All text som är kursiv är för testledaren. Övrig text som inte är kursiv
ska läsas upp för testpersonen.
Instruktioner till testledare
1. Ställ stolen till den valda nollpositionen, LBLNTN, via minnesfunktion
2. Ställ ratten i mittenpositionen
3. Koppla in DICE-utrustning och koppla upp mot dator, gör en
kontrollmätning
4. Sätt igång kameror och deras WiFi
5. Starta ipads och välj takkamera, sidokamera och takkameran till varsin
iPad
6. Kontrollera sidokamerans referenspunkter
7. Skriv ned testpersonens namn i fältet ”Namn” på löst papper
Bakgrundsfrågor
Notera eller fråga vilken typ av skor testpersonen har vid kliniken
(ex. Klackskor, Finskor, Promenadskor, Arbetsskor, Sandaler, Sportskor,
Ballerinaskor, Seglarskor)
Skulle du vilja ta del av resultatet?
Anteckna på löst papper.
Bakgrund till klinik
Testet görs för att utvärdera hur folk sitter och varför de väljer den
positionen som de gör.
Appendix G – SPEED Instruction document
44
Upplägg
Du kommer ställa in stolen tre gånger, tänk på att dessa inställningar är
möjliga: Visa hur man ställer in alla funktioner.
Fram/bak
Upp/ner
Tilt
Ryggstödslutning
Ratt upp/ner
Ratt fram/bak
När du ställer in stolen är det uppskattat om du hela tiden tänker högt
varför du ställer om stolen som du gör. Efter att du har ställt in stolen
kommer du köra en bit och du kommer få vägen förklarad för dig. Vi
kommer att stanna på utvalda ställen där vi tänker be dig svara på några
frågor samt ställa om stolen. När vi har kört hela rundan kommer vi
stanna på ett ställe och låta dig fylla i ytterligare några frågor.
Testet kommer sammanlagt att ta cirka 45 minuter och under det är
tillåtet att justera stolen under körning. Var god rör inte fönsterhissar
eller taklucka då vi har placerat utrustning på rutorna.
8.1.2 Del 1 – Sträcka 1 med korsning (8 min)
Ställ in stolen
Nu kan du ställa in stolen första gången. Det är väldigt uppskattat om
du berättar vad du gör för inställning och varför.
Anteckna kommentarerna på löst papper, när TP ställt in sig färdigt fortsätter du
fråga:
Sitter du där du vill sitta eller vill du fortsätta justera dig?
Ta kort
Under körning ska kort tas (sidovy, toppvy, fotvy) synkroniserat när TP anländer
till en korsning och vid raksträcka. Ta kort då tillfälle ges, då det finns risk att det
är grönt vid trafikljusen.
Låt testdeltagaren köra en sväng
Tänk på att inte ge TP för mycket köranvisningar på samma gång.
Nu är det dags att köra första rundan.
1. Starta från PV-porten
2. Kör mot Volvohallen.
3. När vi närmar oss rondellen vid Volvohallen, håll vänsterfilen
och följ skylt mot GÖTEBORG TORSLANDA Volvo.
Appendix G – SPEED Instruction document
45
4. Följ skylt mot TORSLANDA CENTRUM.
5. Följ skylt mot TK-porten och kör nästan hela vägen fram.
6. Vid TK-porten, sväng vänster och håll rakt förbi parkeringen
till nästa korsning.
7. I korsningen ska vi svänga höger och sen kan du hålla till höger
för att sedan direkt kunna svänga in till
biltvätten/bensinstationen till höger.
8. Väl inne vid biltvätten/bensinstationen kan du stanna på en
lämplig parkering och låta bilen vara igång.
Logga stolsposition
Efter ni stannat loggas första stolspositionen, och skrivs in på lösbladet.
Frågor om sittposition
Se till att TP har datorn nära till hands.
Nu ska du få svara på frågor om hur du sitter nu i den här bilen. Kryssa
för det alternativ som passar bäst och säg till när du är färdig. För att
kunna svara på de olika frågorna kan du justera stolen för att se hur det
känns. Har du några övriga kommentarer eller om det är så att
alternativen inte är möjliga att genomföra för dig, skriv gärna det i rutan
”Övriga kommentarer”.
8.1.3 Del 2 – Sträcka 2 (8 min)
Ställ in stolen
Nu skulle jag vilja att du går ur bilen så ska jag ställa om omgivningen
till ett startläge. Ställ nu om stolen till sitt nolläge genom att hålla inne knappen
för minnesfunktionen för startläget tills stolen har stannat. Ställ också in ratten till
sitt nolläge.
Nu får du sätta dig och ställa in en bekväm sittposition igen. Tänk gärna
högt.
Anteckna kommentarerna på löst papper, när TP ställt in sig färdigt fortsätter du
fråga:
Sitter du där du vill sitta eller vill du fortsätta justera dig?
Ta kort
Under körning ska kort tas (sidovy, toppvy, fotvy) synkroniserat när TP
anländer till en korsning och vid raksträcka. Ta kort då tillfälle ges, då
det finns risk att det är grönt vid trafikljusen.
Köranvisningar för runda 2
1. Kör höger ut från biltvätten/bensinstationen.
Appendix G – SPEED Instruction document
46
2. Håll dig i vänsterfilen och följ skylten mot GÖTEBORG, alltså
vänster i den stora korsningen.
3. Efter korsningen så ska vi köra rakt fram och passera ett
trafikljus.
4. Till höger vid nästa trafikljus finns en JET-bensinstation, sväng
in på denna och stanna där på en lämplig plats.
Logga stolsposition
Efter TP har stannat ska andra stolspositionen loggas, denna skrivs in på lösbladet.
Frågor om sittposition
Se till att TP har datorn nära till hands.
Nu ska du få svara på frågor om hur du sitter nu i den här bilen. Kryssa
för det alternativ som passar bäst och säg till när du är färdig. För att
kunna svara på de olika frågorna kan du justera stolen för att se hur det
känns. Har du några övriga kommentarer eller om det är så att
alternativen inte är möjliga att genomföra för dig, skriv gärna det i rutan
”Övriga kommentarer”.
8.1.4 Del 3 – Sträcka 3 med raksträcka (8 min)
Ställ in stolen
Nu skulle jag vilja att du går ur bilen så ska jag ställa om omgivningen
till ett startläge. Ställ nu om stolen till sitt nolläge genom att hålla inne knappen
för minnesinställningen för startläge tills stolen har stannat. Ställ också in ratten till
sitt nolläge.
Nu får du sätta dig och ställa in en bekväm sittposition igen. Tänk gärna
högt.
Anteckna kommentarerna på löst papper, när TP ställt in sig färdigt fortsätter du
fråga:
Sitter du där du vill sitta eller vill du fortsätta justera dig?
Ta kort
Under körning ska kort tas (sidovy, toppvy, fotvy) synkroniserat när TP kör i
korsning och raksträcka.
Logga stolsposition
Synkroniserat med att korten tas ska också stolens position loggas och
skrivas in på lösbladet.
Köranvisningar för runda 3
Nu ska vi köra tillbaka till PV-porten.
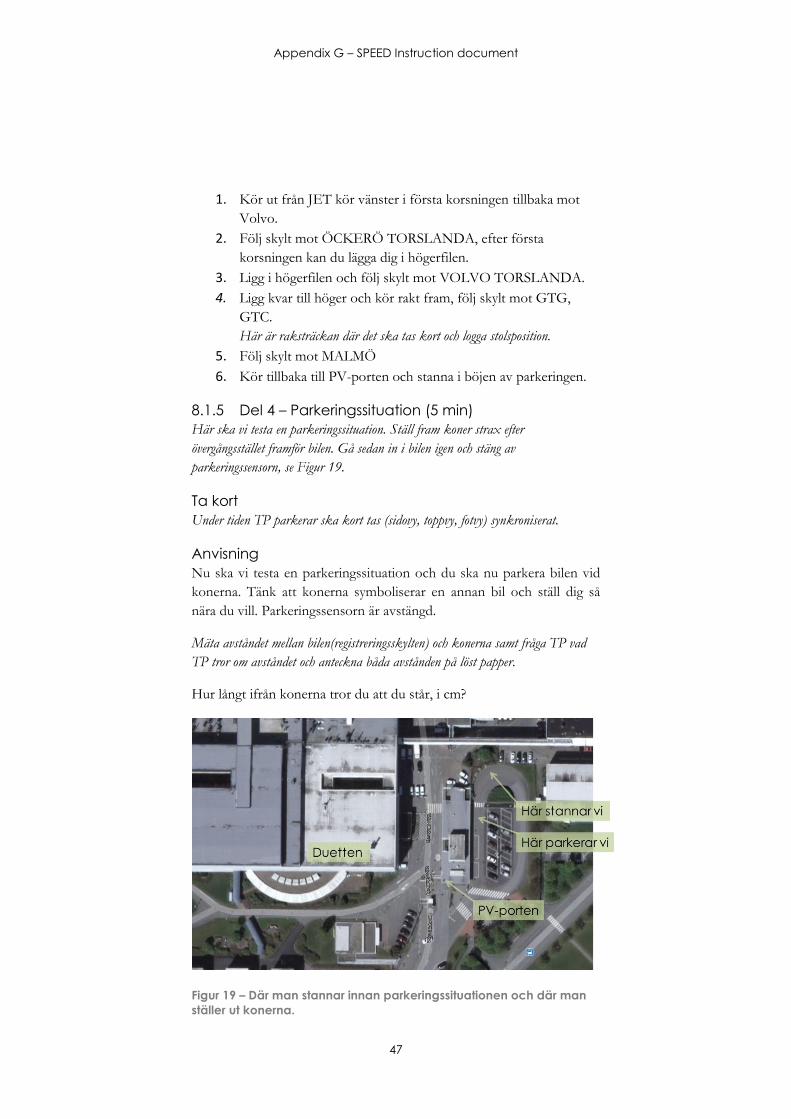
Appendix G – SPEED Instruction document
47
1. Kör ut från JET kör vänster i första korsningen tillbaka mot
Volvo.
2. Följ skylt mot ÖCKERÖ TORSLANDA, efter första
korsningen kan du lägga dig i högerfilen.
3. Ligg i högerfilen och följ skylt mot VOLVO TORSLANDA.
4. Ligg kvar till höger och kör rakt fram, följ skylt mot GTG,
GTC.
Här är raksträckan där det ska tas kort och logga stolsposition. 5. Följ skylt mot MALMÖ
6. Kör tillbaka till PV-porten och stanna i böjen av parkeringen.
8.1.5 Del 4 – Parkeringssituation (5 min)
Här ska vi testa en parkeringssituation. Ställ fram koner strax efter
övergångsstället framför bilen. Gå sedan in i bilen igen och stäng av
parkeringssensorn, se Figur 19.
Ta kort
Under tiden TP parkerar ska kort tas (sidovy, toppvy, fotvy) synkroniserat.
Anvisning
Nu ska vi testa en parkeringssituation och du ska nu parkera bilen vid
konerna. Tänk att konerna symboliserar en annan bil och ställ dig så
nära du vill. Parkeringssensorn är avstängd.
Mäta avståndet mellan bilen(registreringsskylten) och konerna samt fråga TP vad
TP tror om avståndet och anteckna båda avstånden på löst papper.
Hur långt ifrån konerna tror du att du står, i cm?
Figur 19 – Där man stannar innan parkeringssituationen och där man
ställer ut konerna.
Appendix G – SPEED Instruction document
48
Ta ett kort med sidokameran på TP när TP har huvudet mot nackstödet, anteckna
vilket kortnr det är på löst papper.
Nu skulle jag vilja att du lutar huvudet tillbaka mot nackstödet så att du
tar mot det.
Frågor om sittposition
Se till att TP har datorn nära till hands.
Nu ska du få svara på frågor om hur du sitter nu i den här bilen. Kryssa
för det alternativ som passar bäst och säg till när du är färdig. För att
kunna svara på de olika frågorna kan du justera stolen för att se hur det
känns. Har du några övriga kommentarer eller om det är så att
alternativen inte är möjliga att genomföra för dig, skriv gärna det i rutan
”Övriga kommentarer”. Här ska du även svara på den sista frågan, 3b,
hur det är att hitta en bekväm sittposition.
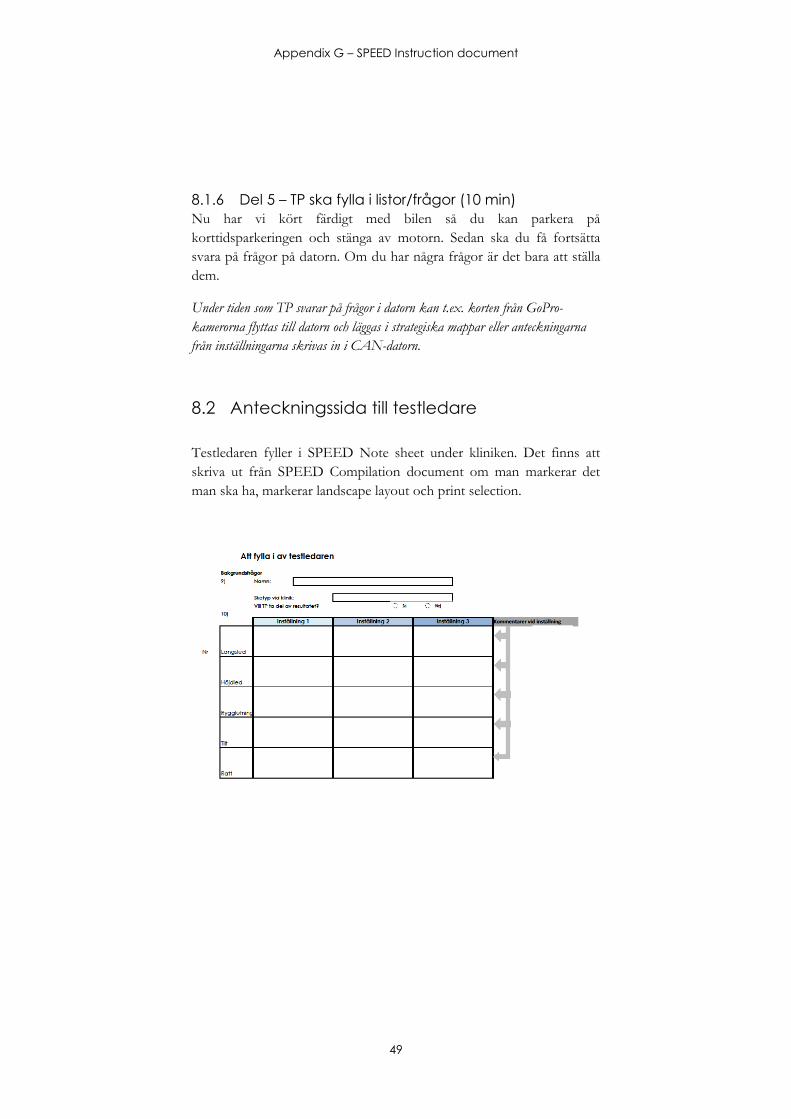
Appendix G – SPEED Instruction document
49
8.1.6 Del 5 – TP ska fylla i listor/frågor (10 min)
Nu har vi kört färdigt med bilen så du kan parkera på
korttidsparkeringen och stänga av motorn. Sedan ska du få fortsätta
svara på frågor på datorn. Om du har några frågor är det bara att ställa
dem.
Under tiden som TP svarar på frågor i datorn kan t.ex. korten från GoPro-
kamerorna flyttas till datorn och läggas i strategiska mappar eller anteckningarna
från inställningarna skrivas in i CAN-datorn.
8.2 Anteckningssida till testledare
Testledaren fyller i SPEED Note sheet under kliniken. Det finns att
skriva ut från SPEED Compilation document om man markerar det
man ska ha, markerar landscape layout och print selection.
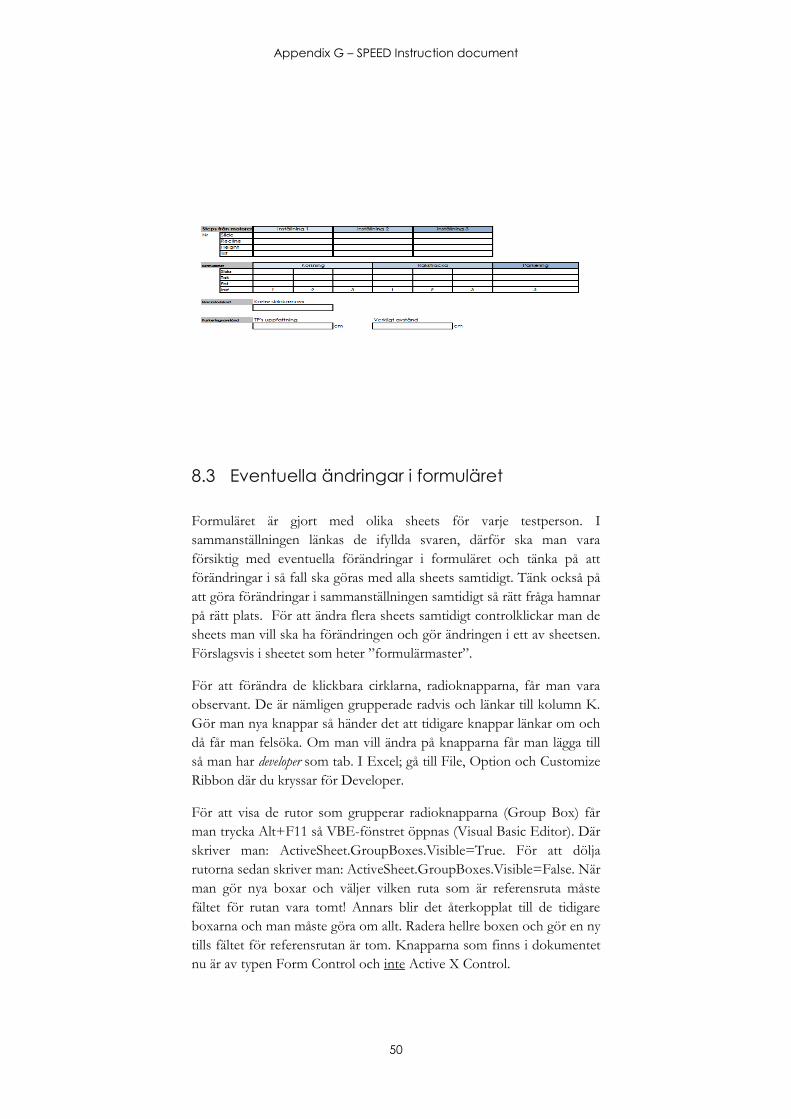
Appendix G – SPEED Instruction document
50
8.3 Eventuella ändringar i formuläret
Formuläret är gjort med olika sheets för varje testperson. I
sammanställningen länkas de ifyllda svaren, därför ska man vara
försiktig med eventuella förändringar i formuläret och tänka på att
förändringar i så fall ska göras med alla sheets samtidigt. Tänk också på
att göra förändringar i sammanställningen samtidigt så rätt fråga hamnar
på rätt plats. För att ändra flera sheets samtidigt controlklickar man de
sheets man vill ska ha förändringen och gör ändringen i ett av sheetsen.
Förslagsvis i sheetet som heter ”formulärmaster”.
För att förändra de klickbara cirklarna, radioknapparna, får man vara
observant. De är nämligen grupperade radvis och länkar till kolumn K.
Gör man nya knappar så händer det att tidigare knappar länkar om och
då får man felsöka. Om man vill ändra på knapparna får man lägga till
så man har developer som tab. I Excel; gå till File, Option och Customize
Ribbon där du kryssar för Developer.
För att visa de rutor som grupperar radioknapparna (Group Box) får
man trycka Alt+F11 så VBE-fönstret öppnas (Visual Basic Editor). Där
skriver man: ActiveSheet.GroupBoxes.Visible=True. För att dölja
rutorna sedan skriver man: ActiveSheet.GroupBoxes.Visible=False. När
man gör nya boxar och väljer vilken ruta som är referensruta måste
fältet för rutan vara tomt! Annars blir det återkopplat till de tidigare
boxarna och man måste göra om allt. Radera hellre boxen och gör en ny
tills fältet för referensrutan är tom. Knapparna som finns i dokumentet
nu är av typen Form Control och inte Active X Control.
Appendix G – SPEED Instruction document
51
8.4 Bilformulär till sammanställningsdokument
Börja med att kopiera formuläret som använts i bilen samt
sammanställningsdokumentet vi vill kopiera allting till, till en mapp på
skrivbordet. Fortsätt med att gå in i formuläret som använts i bilen,
markera samtliga ”sheet” och välj ”Find & Replace”. Här vill vi nu
ersätta samtliga ”=” med en text som inte används någon annanstans i
dokumentet, man kan välja vad som helst, exempelvis ”bart”. Så under
”Find”, skriv in ”=” utan citationstecken, under ”Replace” skriver vi in
”bart” utan citationstecken. Tryck sedan på knappen ”Replace All”.
Nästa steg är nu att kopiera samtliga blad in till det riktiga
sammanställningsdokumentet. Detta gör vi genom att ha alla ”TP-
sheets” markerade och sedan högerklicka och välja ”move or copy…”.
Här väljer vi till vilken ”workbook” som vi vill kopiera det till, det är
viktigt att dokumentet man vill kopiera från till i samma mapp som det
man vill kopiera till och att båda dokumenten är öppnade. Sedan
scrollar vi ner i rutan vilken innehåller alla sheets och väljer ”move to
end”. Tryck sedan på OK.
Nu hamnar vi i sammanställningsdokumentet och sheetsen ska vara
inklistrade. Nu får vi markera samma sheets som har flyttats hit, välja
samtliga celler och använda oss av ”Find & Replace” igen för att ersätta
”bart” med ”=”, kom ihåg att inte använda citationstecken utan bara
det inom dem.
Nästa steg är att avmarkera samtliga sheets och celler, sedan gå till
sammanställnings-sheet. Här ser vi nu att det står #REF! på de TP-
rader som vi klistrat in nya TP-sheets för. Nu får vi för respektive rad
ersätta ”#REF!” med rätt TP-sheet-referens samt spannet som matrisen
befinner sig i, t.ex. ersätta ”#REF!” med ”'TP1'!$A$1:$L$265”. Märk
här att fot-tecknet (enkelfnutten) ska vara med men inte citationstecken.
Nu ska det fungera!
8.5 Ruttbeskrivning för klinik
Ruttens totala längd är ca 8 km. Den består av tre delsträckor. En mera
detaljerad ruttbeskrivning i text finns att läsa i kapitel 8.1.
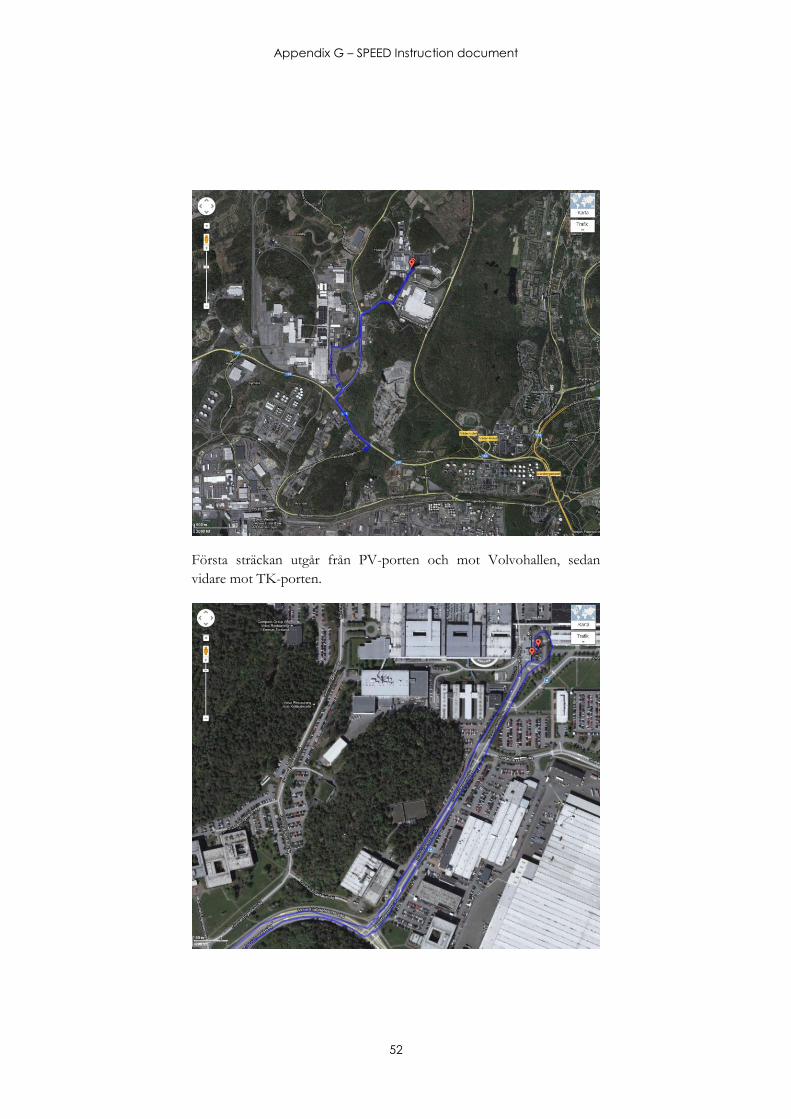
Appendix G – SPEED Instruction document
52
Första sträckan utgår från PV-porten och mot Volvohallen, sedan
vidare mot TK-porten.
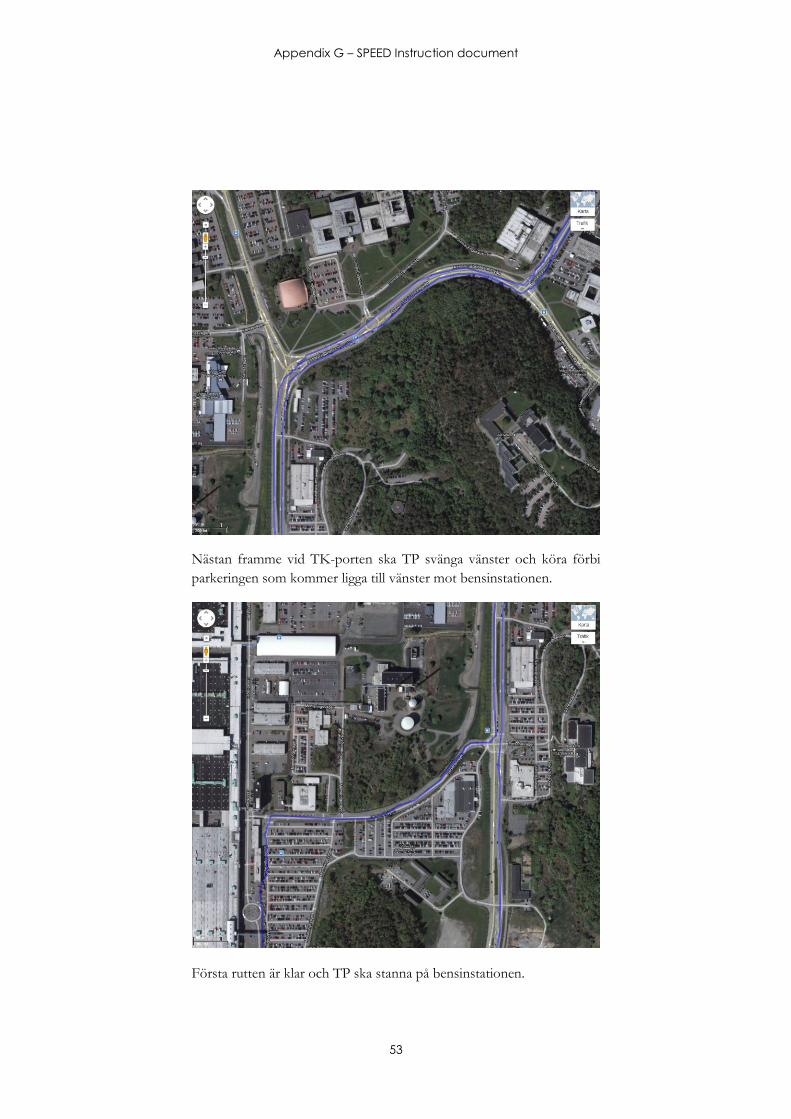
Appendix G – SPEED Instruction document
53
Nästan framme vid TK-porten ska TP svänga vänster och köra förbi
parkeringen som kommer ligga till vänster mot bensinstationen.
Första rutten är klar och TP ska stanna på bensinstationen.
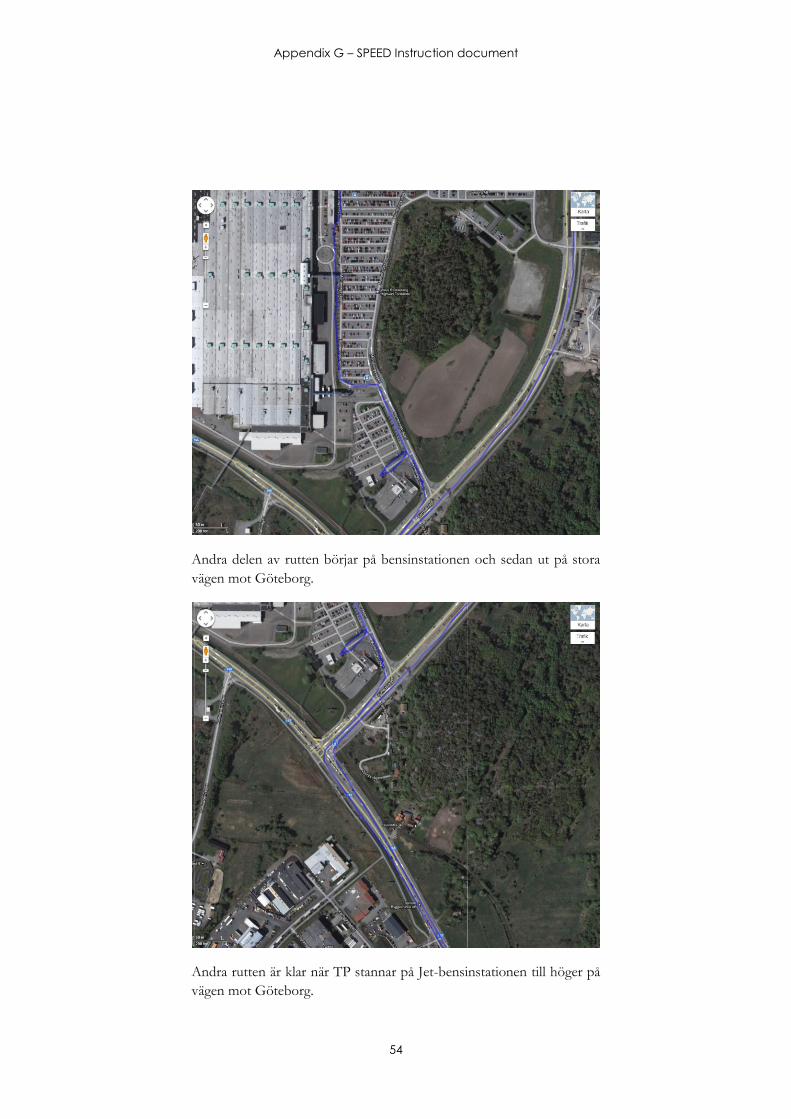
Appendix G – SPEED Instruction document
54
Andra delen av rutten börjar på bensinstationen och sedan ut på stora
vägen mot Göteborg.
Andra rutten är klar när TP stannar på Jet-bensinstationen till höger på
vägen mot Göteborg.
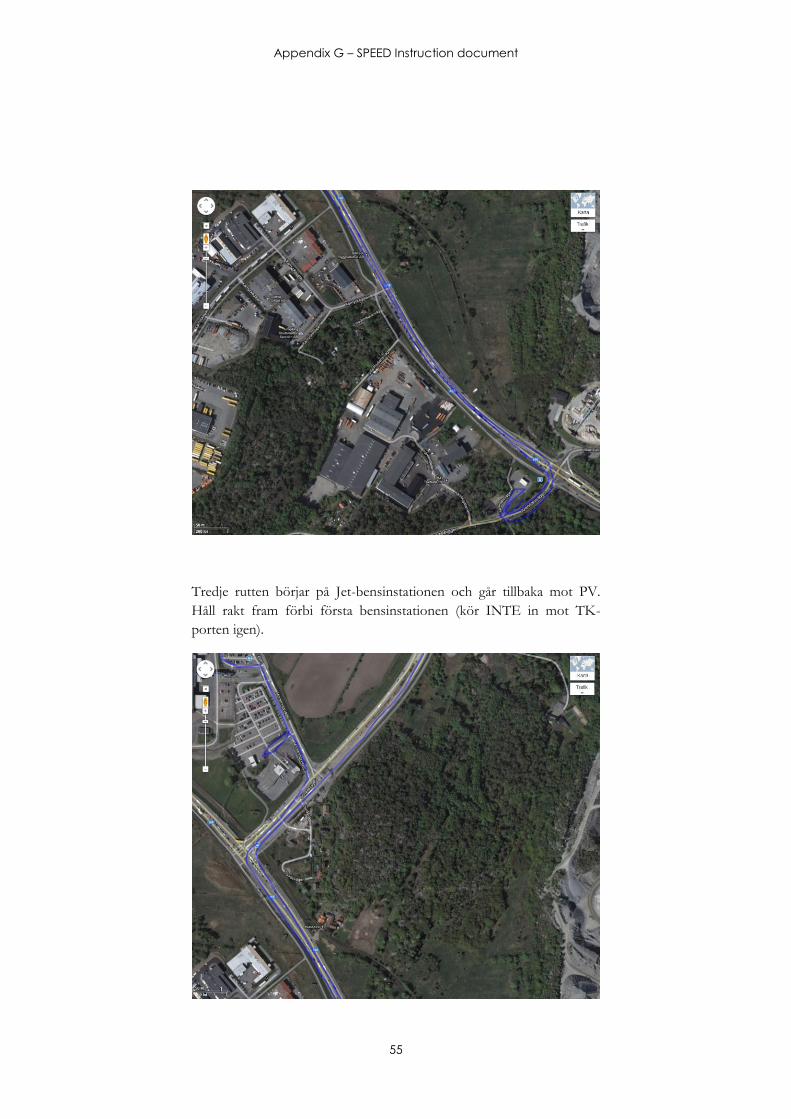
Appendix G – SPEED Instruction document
55
Tredje rutten börjar på Jet-bensinstationen och går tillbaka mot PV.
Håll rakt fram förbi första bensinstationen (kör INTE in mot TK-
porten igen).
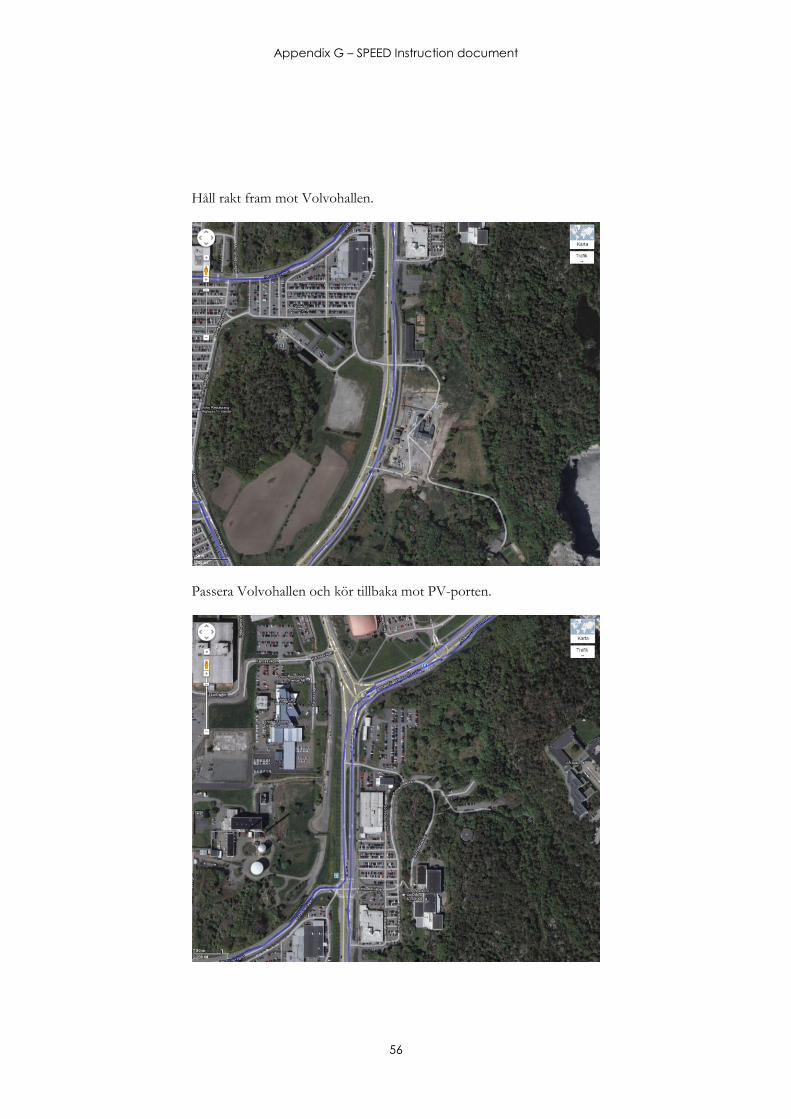
Appendix G – SPEED Instruction document
56
Håll rakt fram mot Volvohallen.
Passera Volvohallen och kör tillbaka mot PV-porten.
Appendix G – SPEED Instruction document
57
Stanna vid PV-porten.

Appendix G – SPEED Instruction document
58
Appendix G – SPEED Instruction document
59
9 Analys
De delar som ska analyseras i basanalysen finns förberedda i SPEED
Compilation document, antingen med förberedda diagram eller med en
förklaring till hur man ska åstadkomma dessa. För vissa analyser får
man sortera alla testdeltagare efter kort/medel/lång och kopiera alla
dessa svar som text, inte med formler, och lägga sorterade under svaren
från sammanställningen. Därigenom kommer mycket att räknas ut
automatiskt. Alla instruktioner till detta finns som sagt i SPEED
Compilation document. Man ska vara försiktig med att sortera efter
man gjort diagram. Kopiera eventuellt skapade diagram som bilder till
t.ex. powerpoint för att inte riskera att de sorteras om.
Slutsatserna från kliniken kommer att presenteras i en Powerpoint. Ett
tomt powerpointdokument med Volvo-mall kommer finnas på samma
plats som alla andra dokument som krävs för SPEED.


Phone: + 46 (0)31 772 10 00
Web: www.tekniskdesign.se
CHALMERS UNIVERSITY OF TECHNOLOGY
SE 412 96 Gothenburg, Sweden


![Social Innovations as Drivers of Social Change – Exploring Tarde’s … · 2014. 11. 5. · Social Innovations as Drivers of Social Change 33 one to form a new one. […] By inventions](https://img.pdfslide.us/doc/110x75/60a12515b221683d2f044d99/social-innovations-as-drivers-of-social-change-a-exploring-tardeas-2014-11.jpg)