Embed Size (px)
Citation preview

Exploring a New Mechanism Increasing Emergency Department Visits
Katrina HullUniversity at AlbanyApril 17, 2015

2
Contents
• Background• Current Theories• Dynamic Hypothesis• Model Scenario• Model Results• Discussion

3
Emergency Department Crowding
• Definition– Wait times– Ambulance diverting
• Historical trend– Increase in per capita use, twice what would be
predicted by population growth– This research focuses on the increased per capita
use

4
Source: Kaiser Family Foundation <http://www.statehealthfacts.org/comparetrend.jsp?sub=217&sortc=1&o=a&ind=388&typ=1&sort=a&cat=8&yr=138&srgn=1>

5
Research Goal
• Propose an endogenous dynamic mechanism increasing emergency department visits
• Develop a model of this hypothesis• Use the model to determine useful empirical
data to support this hypothesis

6
Health of ED Patients
• Ambulance diversions correlated to poorer outcomes for heart attack patients
• Overcrowded EDs may result in lower quality of care– Patient boarding– Stressed physicians less effective
• Stakeholders– ED Patients

7
Internal Process Variables
• Premise: A better structured ED and Hospital could handle the increased load
• Prior focus of system dynamics work• Models examine patient flow through the ED to
discharge (appropriate or not) or admission• ED as backdoor to admissions• Stakeholders– ED staff– Hospitals

8
General Population Health
• Increase ED use as symptom of poorer health in the population
• Ambulatory sensitive care conditions• Failure of system to care for vulnerable
populations• ED visits are urgent but should be avoidable• Stakeholders– Society– Patients

9
Literature Summary
• Lot of exogenous theories• Multiple actors with disparate motivations• Conflicting policy approaches • Perfect space for a model– Unify multiple stakeholder perspectives– Highlight interaction of their activities– Examine outcomes of suggested policies

10
Dynamic Hypothesis
• Where would ED patients come from within the healthcare system?
11
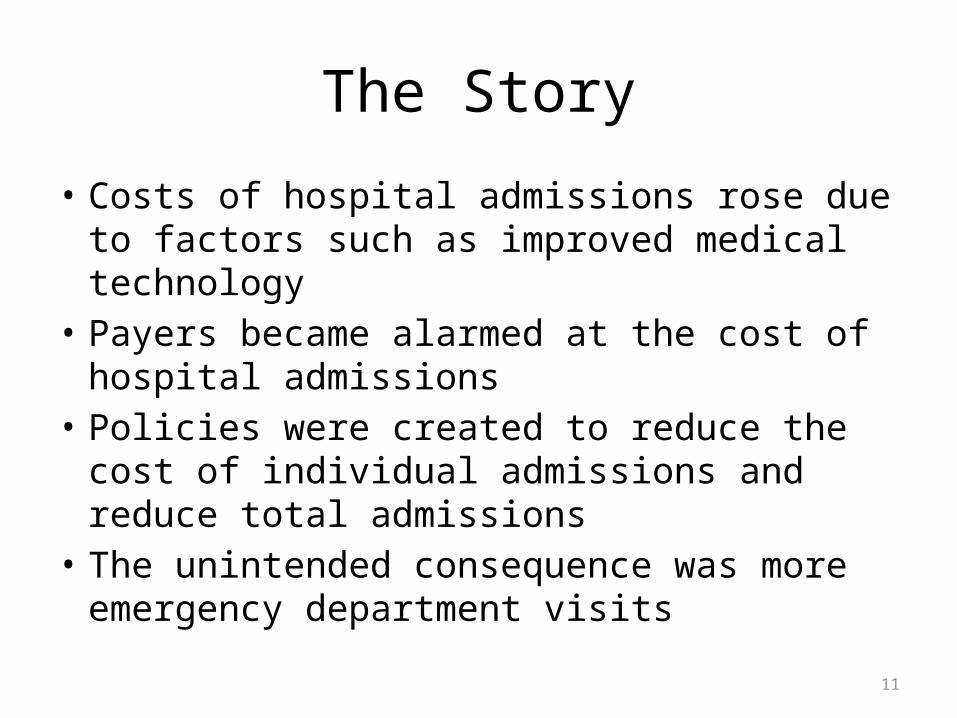
The Story
• Costs of hospital admissions rose due to factors such as improved medical technology
• Payers became alarmed at the cost of hospital admissions
• Policies were created to reduce the cost of individual admissions and reduce total admissions
• The unintended consequence was more emergency department visits

19901992
19941996
19982000
20022004
20062008
20102012
2014300
320
340
360
380
400
420
440
Model Historic No Change
ED V
istis
per
100
0Reference Mode
12
Physicians Redirecting Patients
Increase OutsideModel Boundary
Historical Data from Avalere Health analysis of American Hospital Association Annual Survey data

Feedback Loops
13
total ED visits
total costs topayers
Expectedcosts
pressure from payerto reduce hospital use
wait time to admitgp referral
Expected waittime for gp
referralpercent of gp admits
redirected to ED
ED referralsby gp
-
RedirectingGP referrals
to ED
Adjustmentto Increasing
Costs

Payer Sector
14
pressure from payer toreduce hospital use
time adjustedcost per ED visit
<total admissions>
expectedcostschng expected
costs
total costs
<Total ED Visits>
time to changeexpectations
- -
<Time>
ED costs
Time adjusted costper admission
<Time>
Total inpatient cost
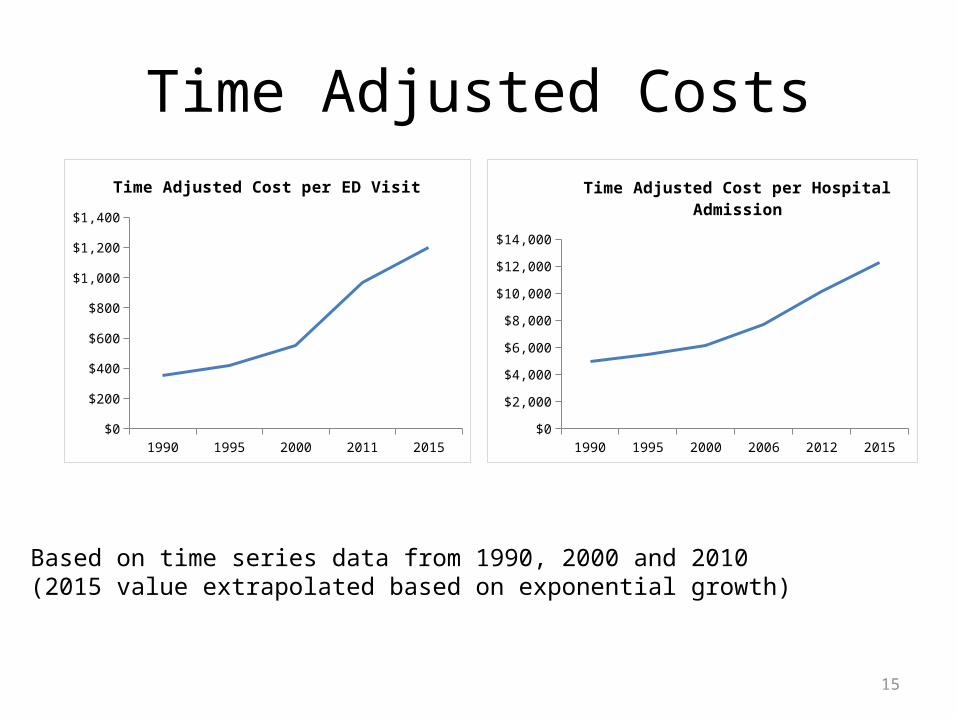
Time Adjusted Costs
15
1990 1995 2000 2011 2015$0
$200
$400
$600
$800
$1,000
$1,200
$1,400
Time Adjusted Cost per ED Visit
1990 1995 2000 2006 2012 2015$0
$2,000
$4,000
$6,000
$8,000
$10,000
$12,000
$14,000
Time Adjusted Cost per Hospital Admission
Based on time series data from 1990, 2000 and 2010 (2015 value extrapolated based on exponential growth)

General Practitioner Sector
16gp visits per
capita
actual wait time toadmit gp referral
ED referrals bygp
effect of wait time toadmit on gp referrals to
ed
percent of gp visitsrequiring hospital
admission
normal wait time toadmit gp referral
percent of gp admitsredirected to ed
desired admitsfrom gp
total gp visitsper year
Expected wait timefo gp referralchg expected wait
for gp referral
-
time to adjustexpectation
effect of costs onartificial barriers to direct
referrals
<Population>
<pressure from payer toreduce hospital use>
direct admitsfrom gp
-
payer sensitivityto pressure
expected overnormal wait time
gp sensitivity towait

17
Unknown Parameters
• Normal wait times• Actual wait times• Percent of patients referred to ED• BUT, these don’t matter because the model is
normalized, the key unknowns are:– Payer sensitivity to pressure– GP sensitivity to pressure
• GP and Payer time to adjust expectations also unknown

18
Sensitivity Testing
• GP Sensitivity to wait times is the slope of the Effect of Wait Times on Referrals to ED
• This effect was formulated using a Gompertz function rather than as a lookup to allow for easier sensitivity testing
• Similar for Payer sensitivity

19
Effect of Wait Times on GP Redirects
0 1 1.5 2 2.5 3 3.5 4 4.5 5 5.6 6 6.5 7 7.5 80.00
0.10
0.20
0.30
0.40
0.50
0.60
0.70
0.80
0.90
1.00
Expected over Normal Wait Time
Perc
ent o
f Pati
ent R
edire
cted

20
Final Value of Per Capita ED Visits

21
In 2 DimensionsSurface Base Run50% 75% 95% 100%
ED visits per 1000400
375
350
325
3001990 1996 2002 2008 2015
Date

22

23

24
Estimating Sensitive Parameters
• Next step is find data on these sensitive parameters
• Where? I don’t know yet.