Embed Size (px)
Citation preview

, ' A -
c
.f
\ # \ #
/ , I
!
. DETAILED BEHAVIOR
OF THE MIDLATITUDE IONOSPHERE
FROM THE EXPLORER X Y l I SATELLITE
* s r
/
,
NOWEMBER 1964
\
GODDARD SPACE FLIGHT CENTER GREENBELT, MD.
Submitted to Planetary and Space Science with three other papers on Explorer XPIl and its results.
.-

DETAILED BEHAVIOR O F THE MIDLATITUDE IONOSPHERE
FROM THE EXPLORER XVII SATELLITE
L. H. Brace and N. W. Spencer Goddard Space Flight Center
Greenbelt, Maryland
and
A. Dalgarno The Queen's University of Belfast,
N. Ireland

I
ABSTRACT
Measurements of electron temperature and ion density by electrostatic probes on the Explorer 17 satellite have revealed the detailed diurnal and lati- tudinal behavior of the summer ionosphere near the altitude of the F, maximum over the eastern United States at the time of solar minimum. The electron temperature at 40° North magnetic latitude is observed to rise rapidly from a nighttime value of about l l O O O K to a mid-morning maximum of 2700OK followed by an afternoon plateau of 2000OK. The electron temperature always exceeds accepted values of neutral gas temperature and thus reflects the existence of heat sources in both the daytime and nocturnal ionosphere. The ion densijy dis- plays a maximum value about three hours after local noon. A strong degree of latitude control, evident near the F, maximum, causes the temperature to in- c rease and the density to decrease with increasing latitude. The electron tem- perature is relatively independent of altitude between 260 and 450 kilometers in the forenoon but displays a slight increase with altitude at night. The diurnal variations found over stations at 10' and 60' North magnetic latitude display general characterist ics similar to those found at 40° N and also reveal the in- verse gradients of temperature and density with latitude. Calculations based on the measurements show that the ion temperature begins to exceed the neutral temperature significantly above 300 kilometers and approaches the electron temperature near 600 km. The ratio of electron to ion temperature at 300 km is between 2 and 3 in the daytime and about 1.5, but highly variable, at night. The measurements are also employed to calculate the amount of electron heat- ing in the F region. It appears that heating by solar - . ultraviolet radiation is ade- quate to explain the d a m e results below 300 kilometers, and that the available flux of fast photoelectrons is adequate to account for the heating at higher alti- tudes. The heating at night is consistent with a corpuscular flux of soft electrons with a total energy of about 1 X ergs c m - 2 sec -,.
c
i

CONTENTS
Page -
* .- .-
.
INTRODUCTION ...................................... 1
THE ELECTROSTATIC PROBE EXPERIMENTS . . . . . . . . . . . . . . . . 1
The Ion Density Measurement .......................... 3 The Electron Temperature Measurement. . . . . . . . . . . . . . . . . . . 4
RESULTS ........................................... 6
Motion of the Satellite ............................... 6 Blossom Point Data . ................................ 9 Data from Other Latitudes ............................ 15
ION TEMPERATURE AND HEAT SOURCE.. . . . . . . . . . . . . . . . . . . 16
The Positive Ion Temperature .......................... 1 7 The Heat Source ................................... 1 8
DISCUSSION ......................................... 25
ACKNOWLEDGMENT ................................... 29
REFERENCES ....................................... 30
Figure
LIST OF ILLUSTRATIONS
Page
1
2
Functional Diagram of Either the Electron Temperature (T, ) o r
Raw Telemetry Data (Points) for Two Consecutive Volt-Ampere Characteristics of N i Probe. The Ion Saturation Regions, Modulated by the Changing Probe Orientation, Display Maxi- mum Ion Current when the Probe is Perpendicular to Velocity Vector (90') and Minimum Current when the Probe h o k s
the Positive Ion Density ( N i ) Probe Experiment . . . . . . . . . . 2
Forward (50' in this Case) and Aft (140') . . . . . . . . . . . . . . 3
iii
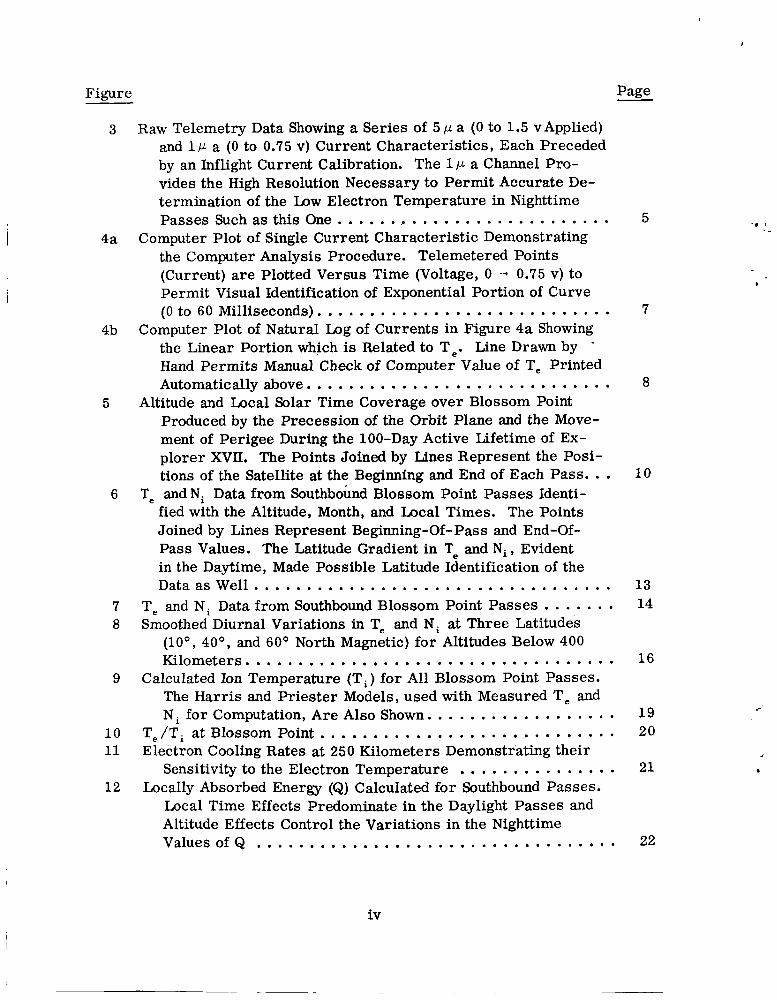
Figure Page
3
4a
4b
5
6
7 8
9
10 11
12
Raw Telemetry Data Showing a Series of 5 p a (0 to 1.5 vApplied) and l p a (0 to 0.75 v) Current Characteristics, Each Preceded by an Inflight Current Calibration. The 1~ a Channel Pro- vides the High Resolution Necessary to Permit Accurate De- termination of the Low Electron Temperature in Nighttime Passes Such as this One .......................... the Computer Analysis Procedure. Telemetered Points (Current) a r e Plotted Versus Time (Voltage, 0 -+ 0.75 v) to Permit Visual Identification of Exponential Portion of Curve (0 to 60 Milliseconds). ...........................
Computer Plot of Natural Log of Currents in Figure 4a Showing the Linear Portion which is Related to T,. Line Drawn by Hand Permits Manual Check of Computer Value of T, Printed
Computer Plot of Single Current Characteristic Demonstrating
Automatically above. ............................ Altitude and Local Solar Time Coverage over Blossom Point
Produced by the Precession of the Orbit Plane and the Move- ment of Perigee During the 100-Day Active Lifetime of Ex- plorer XVII. The Points Joined by Lines Represent the Posi- tions of the Satellite at the Beginning and End of Each Pass. . .
T, and Ni Data from Southbound Blossom Point Passes Identi- fied with the Altitude, Month, and Local Times. The Points Joined by Lines Represent Beginning-Of-Pass and End-Of- Pass Values. The Latitude Gradient in T, and Ni, Evident in the Daytime, Made Possible Latitude Identification of the Data as W e l l . .................................
T, and N i Data from Southbound Blossom Point Passes . . . . . . . Smoothed Diurnal Variations in T, and N i at Three Latitudes
( l o o , 40°, and 60' North Magnetic) for Altitudes Below 400 K i l o m e t e r s . . . . . . . . . . . . . . . . . . . . . . . . . . . . . . . . . . .
Calculated Ion Temperature (Ti) for All Blossom Point Passes. The Harris and Priester Models, used with Measured T, and N i for Computation, Are Also Shown. . . . . . . . . . . . . . . . . .
T,/Ti at Blossom Point ............................ Electron Cooling Rates at 250 Kilometers Demonstrating their
Sensitivity to the Electron Temperature . . . . . . . . . . . . . . . Locally Absorbed Energy (Q) Calculated for Southbound Passes.
Local Time Effects Predominate in the Daylight Passes and Altitude Effects Control the Variations in the Nighttime Values of Q ..................................
5
7
8
10
13 14
16
19 20
21
22
'. I
.
iv

13
14
15
16
Table
1
1.3 g i r t\ Page
XVII) .......................................
Q vs . Altitude in the Nighttime Ionosphere Using the Calculated
Q vs. Xltitude in the Nighttime Ionosphere Assuming Ti = T,. \';dues of T, .................................. Note the Greater Scatter and Lack of Pattern Resulting from This X s su niption ...............................
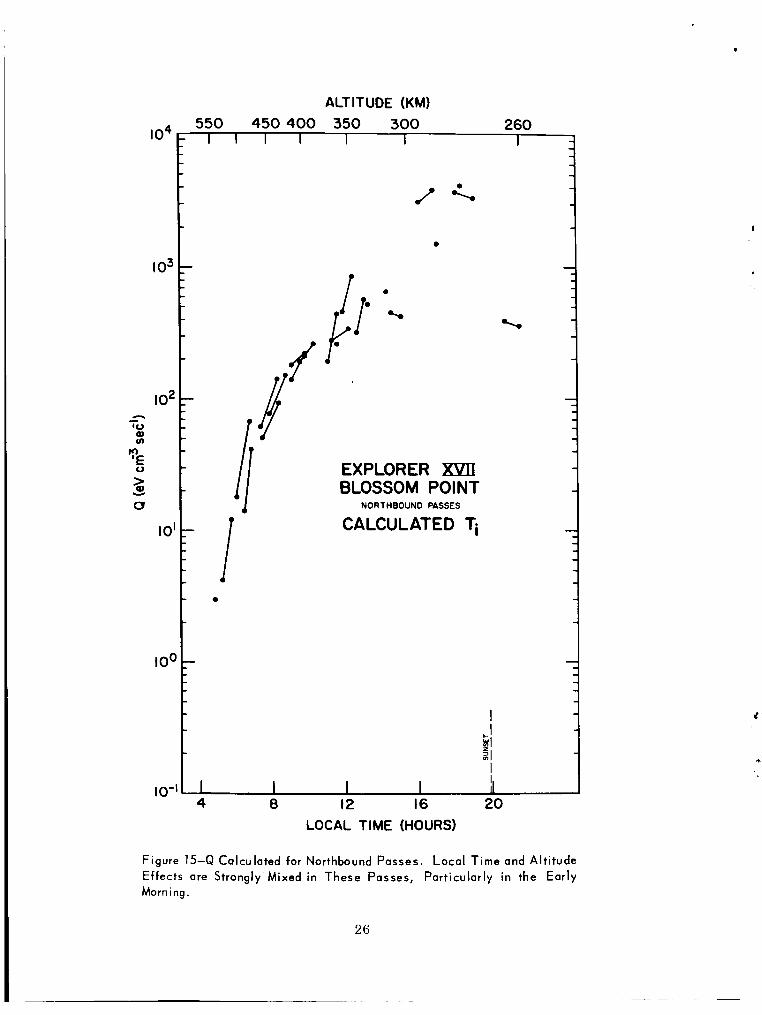
Q Calculated for Northbound Passes. Local Time and Altitude Effects a r e Strongly Mixed in These Passes, Particularly in the Early Morning.. ............................
Q vs. Altitude Normalized to Noon. This Altitude Variation of Q was Obtained from Northbound Passes by Removing the Diurnal Variation Suggested by Southbound Passes . . . . . . . .
LIST O F TABLES
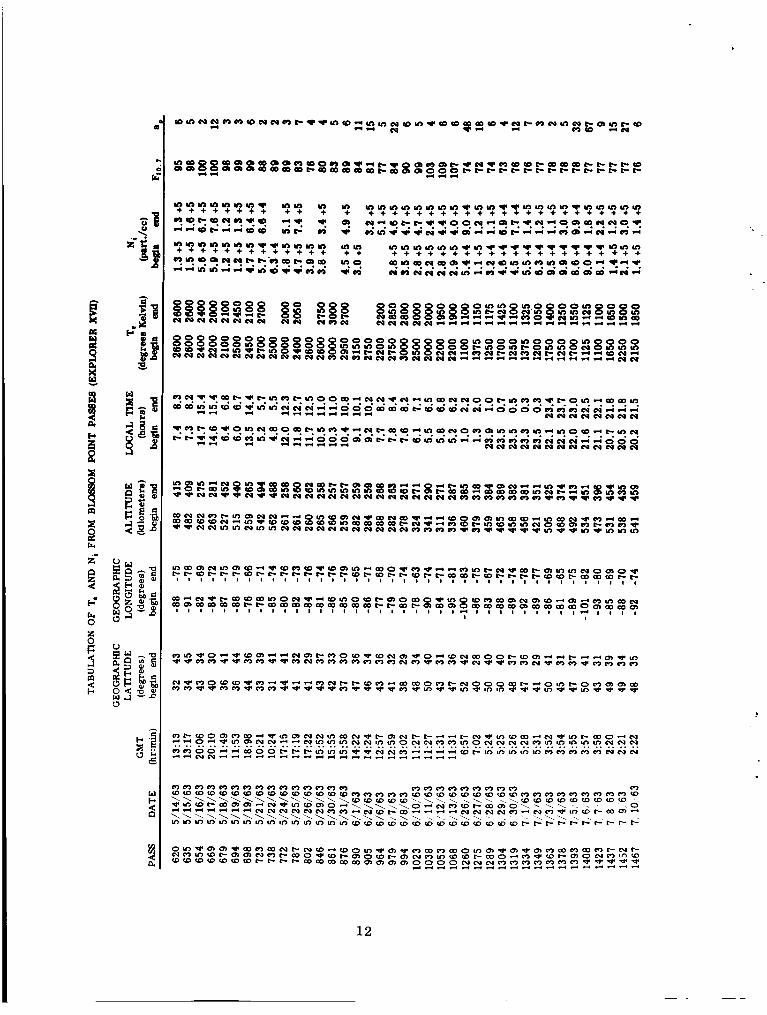
Tabulation of T, and N i From Blossom Point Passes (Explorer
23
24
26
27
Page
11
c
V

DETAILED BEHAVIOR O F THE MIDLATITUDE IONOSPHERE
FROM THE EXPLORER XVII SATELLITE
, .-
INTRODUCTION
Between 1959 and 1961 a ser ies of measurements of electron tempera- ture using rocket-borne electrostatic probes at Ft. Churchill, Manitoba and at Wallops Island, Virginia, established that there are marked differences between the electron temperature and the heavy particle temperature in both daytime and nighttime ionospheres (Boggess, Brace and Spencer, 1959),l (Spencer, Brace and Carignan, 1962),2 (Brace, Spencer and Carignan, 1963). The data show also that the magnitude of the temperature difference increases with latitude, a conclusion in harmony with later observations from the Ariel satellite (Willmore, Henderson, Bowen and Boyd, 1964).4
It was clear that further measurements were desirable to determine more precisely the extent of non-equilibrium for a wide variety of ionospheric condi- tions¶ especially since the degree of thermal non-equilibrium is a sensitive indi- cator of atmospheric energy sources. Theoretical studies (Hanson and Johnson, 1961), had demonstrated the close relationship of the charged particle temperature and densities to the composition and structure of the neutral particle atmosphere, and thus had emphasized the need for simultaneous measurements of ionospheric and neutral particle parameters. Accordingly, cylindrical electrostatic probe experiments, similar to that employed in the rocket flights, were included with the neutral particle mass spectrometer and total density gauge experiments in the Explorer XVII satellite, (Reber, Nicolet, 1965)' (Newton, Horowitz, Pr ies ter , 1965).1° A brief description of some of the satellite probe measurements has been given (Brace and Spencer, 1964).111n this paper, we shall report the probe results in more detail and discuss their significance in the context of the heat balance in the ionosphere.
(Dalgarno, McElroy and Moffett, 1963): (Hanson, 1963, ' (Dalgarno, 1963)'
THE ELECTROSTATIC PROBE EXPERIMENTS
The cylindrical probes employed for the measurements of electron tem- perature T, and ion density Ni were dimensioned to operate in an orbital-motion- limited mode (Mott-Smith and Langmuir, 1926). l2 Each collector was 23 cni in
1

length and 0.056 cm in diameter. A guard electrode, 10 cm in length, w a s em- ployed to prevent the collection of charged particles within the ion sheath sur- rounding the satellite. Both the collector and guard were made o f stainless steel. The location of the sensors is discussed in an accompanying paper (Spencer, 1965).13
Figure 1 is a functional block diagram which applies for either the T, o r the N experiment. The electronic circuitry associated with each sensor pro- vided suitable sawtooth sweep voltages and current measuring sensitivities to optimize one experiment for the determination of N i and the other for the meas- urement of T e.
4-minute satellite pass and provided simultaneous point by point measurements of both T, and N i along the satellite path.
The experiments operated simultaneously throughout each
TELEMETRY
Figure 1-Functional Diagram of Either the Electron Temperature or the Posi t ive Ion Density (Ni) Probe Experiment
-. .
- ,
(T e)
2

Tlw Ion L)twsit\r Measurement
I , .A
, - I . - :
Thc voltagc applied between the N, probe and the satellite was swept both iwgntive and positive (-3 v to +2 v) so that both the ion and electron saturation rcyions of the volt-ampere characteristics were observed. Since the satellite potcntial was normally about -0.5 v, the probe potential V relative to the plasma MYIS -3 .5 to +1.5 v. The ion saturation region of a cylindrical collector (when t.mployed on a satellite) is particularly useful for determining the local charged particle density because the flux of ions intercepted by the probe is determined largely by the satellite velocity and the collector orientation, which are known factors. Because of the high satelli \ e velocity the ion current Ii is relatively insensitive to the thermal velocity of the ions and the accelerating potential of the collector, factors which a re less well known.
Figure 2 shows a machine-plot of raw telemetry data points representing two consecutive volt-ampere characteristics from the Ni probe. At positive applied voltages the measured current is off-scale negative due to the predom- inance of electron current, and only the ion saturation regions are visible. The
ORIENTATION
50" 90" 140" 90" 50" 90" 0-15 r i I I I I I
50" 90" 140" 90" 50" 90" 1 1 1 1 1 1
Figure 2-Raw Telemetry Data (Points) for Two Consecutive Volt-Ampere Characterist ics of Ni Probe. The Ion Saturation Regions, Modulated by the Changing Probe Orientation, Display Maximum Ion Current when the Probe i s Perpendicular to Veloci ty Vector (90 " ) and Minimum Current when the Probe Looks Forward (50" in this Case) and Aft (140").
3

I
sweep period (2 seconds) was made several t imes the spin period (0.7 seconds) so that the effects of changes in orientation upon collection area and wake effects could be studied through the manner in which they modulate the ion saturation current. Maxima in the ion current (I,,,) occur twice per satellite spin, corre- sponding to those t imes when the probe axis is perpendicular to the velocity vec- tor. At this orientation the collector presents its maximum projected area to the plasma stream. In addition, a major minimum of ion current is observed each time the probe is rotated into the wake region behind the satellite. A secondary minimum occurs 180' later when the sensor is ahead of the satellite and presents i ts minimum projecled a rea to the stream.
The relatively small effect of the applied voltage is evident in the slight de- crease of I,,, between successive maxima. This decrease corresponds to a voltage change of about 1 v. Curves such as those shown in Figure 2 permit one to derive empirically the functional dependence of I,,, upon V, a relationship which is needed for an accurate evaluation of Ni from the measured ion cur- rents. Using the slope of I,,, versus V derived from a representative selec- tion of probe data, I,,, was found to be about 20% f 3% higher than would be observed at V = 0, where no acceleration of the ions occurs. Neglecting a very small enhancement of the current due to the thermal motion of the ions (<4%), the current at V = 0 is simply the charge per unit time swept out by the frontal area of the collector. Therefore the ambient positive ion density is given by:
where 1 is the length and d is the diameter of the collector, e is the unit charge and v, is the satellite velocity.
Because 1; is always measured at the same orientation, the relative accu- racy of the Ni measurements depends primarily upon the current detection e r r o r , which does not exceed 5% for Ni > 5 X l o 4 ~ m - ~ . The absolute accuracy of Ni is better than 10% when O+ ions predominate (below 600 km).
The Electron Temperature Measurement
Between the extremes of ion and electron saturation, the probe current char- acteristic exhibits an exponential shape whose curvature permits a direct inter- pretation of the curves in te rms of the electron temperature (Mott-Smith and Langmuir, 1926).12 The analysis of indilidual curves is carr ied out by the log- plot technique in which T, is given by the slope of log, I, with respect to V,
4

a s given by (2)
. _- Based on the experience gained with identical probes on ejectable rocket-
borne instruments (Spencer, Brace and Carig-nan, 1962): the T, experiment was designed to permit high resolution of the exponential portion of the volt-ampere characteristics, with primary emphasis on thermal electrons in the 0 - 1 eV range. To permit ample voltage resolution through a wide range of T,, two saw- tooth sweeps were employed (0 to +0.75 v and 0 to +1.5 v). The telemetry Sam- pling rate assigned to the experiment (180 samples/sec) was sufficient to permit a sweep rate of 10 curves per second. The necessary current resolution was provided by two linear current detectors of 1 p a and 5 pa full scale sensitivity which time-shared the assigned telemetry channels on a 10-second-on, 10-second- off basis. Each detector recorded 100 consecutive volt-ampere curves during its on-period.
Figure 3 is a computer plot of 1 p a and 5 p a raw telemetry data at the be- ginning of two consecutive 1 0 second on-times recorded during a nighttime Blos- som Point pass. The temperature and density at this time were moderately low
Te Probe Volt-ampere Characteristics
Ca I i bra te I Data--
5 ~ a Channel
t Sweep -I Period t
(0.1 sed Spin Period(0.7 sec) ~
Calibrate Data - 1 p 1 Channel
. . . . . . . . . . . ... ................................. ..... ..... ... ........ . . . . . . . . . . . . . . . . .....
Figure 3-Raw Telemetry D-to Showing a Series of 5 p a (0 to 1.5 v Applied) and 1 p a (0 to 0.75 v ) Current Chara::t*ristics, Each Preceded by an lnf l ight Current Calibrat ion. The 1 p a Channel Provides the High Resolution Necessary to Permit Accurate Determi- nation of the L o w Electron Temperature in Nightt ime Passes Such as th is One.
5

(T, 2 1200"K, N, :? 1 X l o 5 ~ m - ~ ) . The inflight current calibrations at the left were obtained by substituting appropriate known resistances for the probe sensor at the beginning of each 10 second series of curves. The 5 pa data taken with a 1.5 v sweep permit a "coarse" measurement of the characteristics. resolution" measurement is provided by the 1 p a detector with a 0.75 volt saw- tooth applied. This combination of sensitivities and voltages permitted high resolution measurements of T, between 500" and 5000°K, when Nj exceeded 3 x lo4 ~ m - ~ . The satellite spin period is apparent in Figure 3 in the modula- tion envelope of the electron current curves (not particularly marked i n t h i s example). This modulation stems from both the reduction of charged particle density in the wake region immediately behind the satellite and the modulation of probe voltage by the induced B x Vs voltage caused by motion of the satellite through the Earth's magnetic field, B . Measurement e r r o r due to these easily recognized effects has been avoided by selecting for analysis only those non- wake curves which correspond to the minimum rate of change of induced voltage. Following this criterion for curve selection, the relative accuracy of the T, measurements within a given satellite pass is better than 5%. The absolute ac- curacy depends upon the maintenance of the linearity and amplitude of the saw- tooth sweep voltage throughout the life of the satellite. Frequent checking of inflight calibrations has shown no detectable change and the absolute accuracy is believed to be better than 5% on most passes.
A "high
Figure 4a and 4b help to demonstrate the computer methods employed in the T, analysis. Figure 4a is a computer printout arranged to display a single volt- ampere characteristic as it appeared on the 1 p a channel, and 4b is a log-plot of the same characteristic. Because of a limited plotting interval imposed by the printer, the plotting accuracy shown is only 1/1Oth the accuracy of the actual data. The computer is programmed to make a best straight-line f i t to the linear part of the log plot and then print out the corresponding T, according to equation (2). Plots of this type are made by the computer for each curve of a group of 15 consecutive curves. Several groups are chosen from each satellite pass to per- mit hand verification of the computer values of T, . All temperature data pre- sented in this paper have been verified in this manner.
RESULTS
Motion of the Satellite
The inclination of a satellite orbit simultaneously determines the precession rate of the orbit plane and the movement of perigee, so that a given satellite may sample the atmosphere at only unique combinations of local t imes and altitudes over each telemetry station. Thus, the orbital inclination determines the
G

. I
u ry N
VI VI 4 a
Y 0 - 3 0
- I F 0 - L I W u w a a
5) U
U V
u L W
c L y 4 I d - J . c .d 09
A U u o U L 2 4
e .
c (L - c v)
c U
w . 0 UY, 3 f fm I - . - N c uv) 2 e- U
a 0 e U W > > c
0 VI L W tA
L W
W > 2 U
a
a a c
o 9 v)
0 0 0 0 0 a 0 IF 0 0
m N N
4 . .
LF 0 4
vl d
4-mo 0 0 0 0 IF m
N I O I F 3 IF 0 - -IF IF ff J
a U - 0 Q
C m
0 c
0 9
W L - c
C m w > -
c
A W a
V ff
a c1
0 F
C d
C
7

,
2 4 I-ffo 4 -mI- I. \+I- u I-f-ff
D-. .. N Q
C I W C -ul0
P W O -ul
m . .. aLy -n Lym CN
xulm
d
N -
\ m N 9
N
OIn
- d
.. w . aff
ul 0 In
4 0
0 - cul 0 ul 0 * 0 m 0 In - 0
4 ff9 9 IF 111 .c ff c) CI N N \ 9 .
d e ..1 ..
Off
s 0
OD
0
m 0
f-
U
9
V
In 0
W L f f
*U
W w m CV - 2 W N a *
U
..I.
-.
N
U
d
C
0 - U
o .a *Q UV
v - 0
8
aeronomic coverage which a particular satellite can provide. For example, in its 100 day lifetime, Explorer XVII's inclination of 58O, combined with apogee and perigee altitudes of 927 and 258 km, provided the coverage over Blossom Point shown in Figure 5. Each pair of points connected by a line represents the beginning and end of a particular satellite pass. Although the pattern of cover- age was similar at other latitudes, perigee and apogee occurred at other local times.
Figure 5 aids in selecting those Blossom Point passes in which diurnal and altitude effects can be most effectively separated. For example, the southbound set of passes provides an excellent opportunity to study the diurnal variation of Te and N i at a fixed altitude (perigee) through the daylight hours.
In processing the data from each telemetry station we derived a single value of Te and of Ni from groups of volt-ampere curves taken at one-minute inter- vals through each satellite pass and plotted the beginning-of-pass and end-of-pass values of Te and N i against local solar time. Although the gross variations evi- dent in the resulting local time plots for each station may reflect some altitude and seasonal variations in the atmosphere, the rapid precession of the orbit plane ensures that local time effects will predominate. Variations of Te and Ni within a particular pass, however, are controlled by latitude or altitude changes in that pass because the local t ime change within a pass is small.
Blossom Point Data
Table 1 contains the values of Te and Ni measured at the beginning and end of each Blossom Point pass, with the corresponding positions of the satellite and concurrent values of the solar index (Floe ) and of the magnetic index (a,).
To permit the local time, altitude, latitude and season of each measurement to be identified, data from southbound and northbound passes have been plotted separately in Figures 6 and 7, respectively. The points joined by lines are the beginning and end-of-pass values and the figures show the average altitude and the month of the pass.
Latitude and Local Time Effects - In order to show the effects of latitude, smoothed curves have been drawn in Figure 6 through the values measured at magnetic latitudes of 40°N and 55ON, the extremes of latitude observed from Blossom Point. The smoothed curves therefore represent an averaged diurnal variation of Te and Ni near F, maximum at the indicated magnetic latitudes. The major characteristics of the diurnal variation of electron temperature are a nighttime minimum, a steep rise to a mid-morning maximum, and an afternoon
9

I I I I I I I 22-
\ ------.
1
I I I 1 I I I 0 0 t
t+
5: 0 cu 5: m
5: 5: t 0 8
v) 8 (D
t
10

W b 4 c1
3 a
11
e
W r+ d
2 a
12

5: t 0 0 t
5: m
0 0 m
0
0 u) m
0 0 t
5: w
A
v)
3 0 I
a
Y
0 0 0 0 0 0 0 0 0 0
u) 0 5: O 5 : 0 - - m O N (u
13

3000
2500
2000
e
1500 P
1000
500
0 -
0
Figure 7-T, and Ni Data from Southbound Blossom Point Passes.
550500 450 400 350 300 260 I I I I I ' I 1
MAY I APRIL
EXPLORER XPIl BLOSSOM POINT
- H.
NORTHBOUND PbSSES
H * A )4
To
P e a *\ 0 Ni
a < / -
N -
\ - - a
0
/
%$ -
- I
0 k-l I
El 21 I
31 u)I 4-
1 0 4 I II I
I
- 0
$ 1 ob w & " - 4b-W
I 1 I I 4 8 12 16 20 24
IO 9 0 7 0 6 6 0
5 9 .- 4 = 3 2 I 0
plateau, followed by a decline to a lower, more variable, value at night. This behavior is very different from the diurnal variation of the neutral gas tempera- ture (Tg), which exhibits a maximum in the afternoon rather than the morning. The values of Te a re clearly much in excess of Tg , even at night. The diurnal variation in Ni is characterized by a gradual morning r i se , an afternoon max- imum and a sharp decrease at sunset.
It is particularly significant that in all southbound daytime passes the satel- lite was near perigee and therefore was changing altitude very little. Thus the changes in Te and Ni observed within each of these passes must reflect the lati- tude control which was first evident in the smoothed diurnal variation curves for 40' and 5 5 O N magnetic latitude. The average temperature gradient is about 25'K/O latitude, at this latitude and altitude.
14

Seasonal Effects - A major seasonal effect which may be seen in Figure G is made evident by the longer time Te remained low in the April night passes as compared to the June-July night passes when nights were shorter. The less rapid decay of Te at sunset in July than at sunset in April may also be a seasonal effect, o r it may simply reflect the greater influence of heat conduction in the electron gas at the higher altitude of the July sunset passes.
Altitude Effects - The night-time passes in April (Figure G ) , where altitude is the most important variable, suggest that there is a slight positive gradient of Tr with altitude at night of the order of 1°K/km between 350 and 550 km.
I- - As noted earlier, a comparison of northbound passes (Figure 7) and south-
bound passes (Figure 6) permits the effect of altitude to be evaluated for the morning hours. Such a comparison reveals no systematic gradient of Te with altitude between OGOO and 1200 hours.
Inverse Relationship Between T, and N i - In nearly all daytime passes where beginning and end values of To and N ; have been derived, T_ increased and N i decreased with increasing latitude, the changes being especially marked in the southbound passes which were at lower altitudes. A few exceptions occurred in the early morning, higher altitude, passes when neither Te nor N i changed significantly within individual passes.
Data from Other Latitudes
Graphs of the measurements of Tp and Ni during passes at Quito, Equador (10'N magnetic) and at College, Alaska ( G O O N magnetic) have been prepared. The smoothed diurnal variations of Te and N, derived from all three stations a r e shown in Figure 8. These curves refer to the region between 260 and 400 km containing the F, maximum. Although the general behavior of the F-region at Blossom Point, Quito and College is similar, the times of the morning maxima of Tf, and afternoon maxima of Ni and the magnitudes of the temperatures and densities differ considerably. Not all the differences can be ascribed to mag- netic latitude alone, for the Te maximum at College may occur earlier because of the ear l ier sunrise there in summer, which is a result of the higher geo- graphical latitude. Indeed, the Blossom Point results at 40" and 55'N magnetic latitude suggest that magnetic latitude has little control over the time of occur- rence of the maxima in Te. Differences in magnetic longitude may also be of impo rt anc e.
The higher nocturnal electron temperatures of the College passes also may be related to the higher geographic latitude (58'N) at which they were measured.
15

T, ("K
50L 1 I I I I I I 0 4 8 12 16 20 24
I
10
8
6 Ni
4
2
0
(10Y cc 1
LOCAL TIME (hours)
Figure 8-Smoothed Diurnal Variations in Te and N i at Three Latitudes ( loo, 40", and 60° North Magnetic) for Altitudes Below 400 Kilometers.
The mid-summer F, region at 58ON is always illuminated, although the zenith angle of the sun exceeds 90° near midnight.
ION TEMPERATURE AND HEAT SOURCE
If we assume that the temperature of the electron gas is in equilibrium such that the rate at which it gains heat equals the rate at which it loses heat, the heat source Q necessary to maintain a temperature difference can be calculated from the cooling rates. Only elastic processes contribute significantly to cooling in collisions with the positive ions, and the rate at which the electron gas loses heat to a positive ion gas mixture of O+, He' and H' at a temperature T i is given ap- proximately by
J
5 x ioe7 (T, - T ~ ) ne
~ 3 / 2 Q, = { n (0 ' ) t 4n (He') t 16n (H') 1 eVcma3 sec- ' (3) e
16

(cf. Spitzer 1956),14 (Hanson and Johnson, 1961).' Equation (3) demonstrates that simultaneous measurements of temperature and density are required for an accurate calculation of the energy source responsible for the temperature difference. The strong inter-dependence of temperature and density require that the measurements be essentially point measurements.
The Positive Ion Temperature
The heat gained by the positive-ion gas causes its temperature to rise above that of the neutral particle gas (Hanson, 1963)7 (Dalgarno, 1963).8 The positive ions cool mainly by resonance charge transfer collisions with the parent atoms and by elastic collisions with unlike atoms and molecules. The rates of heat loss f rom the positive ions to the neutral gas at a temperature Tg may be derived from the collision frequencies (Dalgarno, 1958, '' 1961, l6 196417 ) and there results
Q(Ot) = n(0') (9 x n ( 0 ) t 6 x n (N, )
t 6 x lo-'' n (He) t 2 x lo-'' n (H)} (Ti -Tg) eV ~ r n - ~ sec-', (4)
Q (He') = n (He') (6 x n ( 0 ) t 4 x n ( N , )
t 2 x n(He) t 1 x n(H)} (Ti - T g ) eV ~ r n - ~ sec- ' (5) and
Q (H') = n (H') ( 3 x n ( 0 ) t 3 x n (N, )
t 5 x n (He) t 4 x n (H)} (Ti - T g ) eV ~ r n - ~ sec-' . (6)
. In equilibrium,
an equation which determines Ti in terms of Te , ne and the neutral particle and positive-ion concentrations.
17

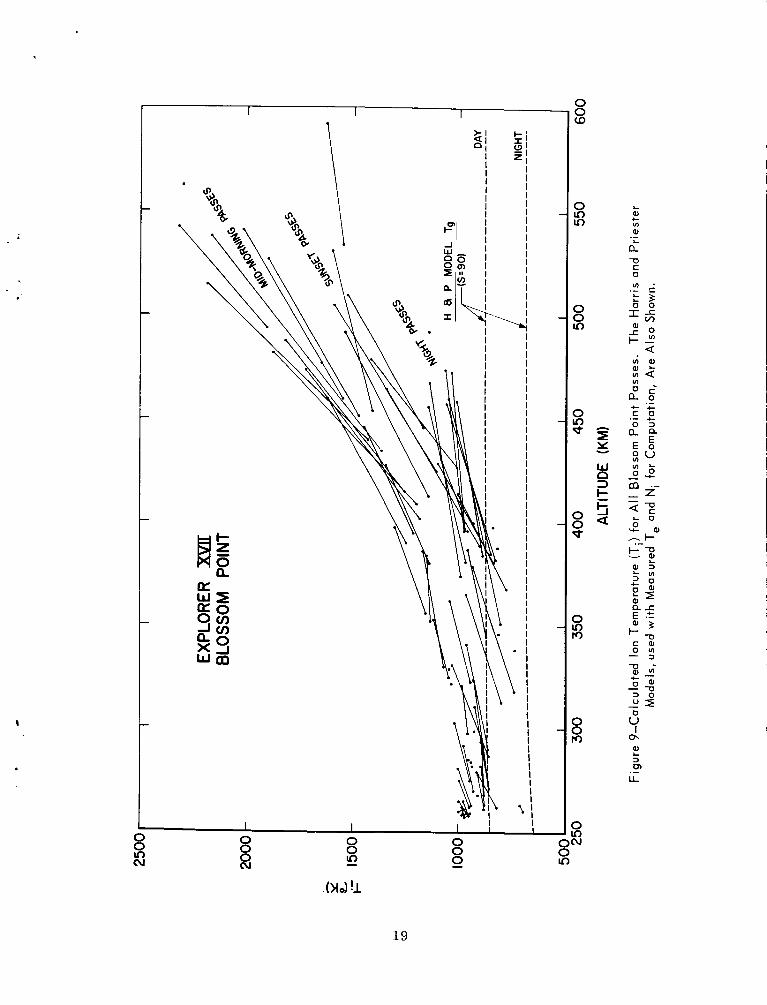
1i.c have. substituted the3 satcllitc mcnsurement of N I ne and of Te into ( > \ toSct1it.r ~ i t h the number densities of ntoiiiic oxygen glven by the model of Ilnrris :ind Pricstcr (19G2)lS for the local time of the measurement. The re- sult ing v:ilucs of T I ,u:d of T p / T , for Blossom Point a r e shown in Figures 9 nnd 10 3s 3 luuction of altitude. In Figure 9 the passes divide naturally into those occurring in inid-morninff (when Te reaches its maximum), near sunset :md :it night. Figure E) reveals a positive-ion temperature increasing with alti- tude. 3 difference between TI and Tg f i rs t emerging in the region of 300 km. The positive-ion temperature is larger during the day than at night but even at night it appears to esceed Tg at high altitudes. Local time effects are distin- guished in Figure 1 0 only between day and night but the data are probably suffi- ciently numerous to establish that during the day Te/T, passes through a maxi- inuni value of between 2 and 3 at an altitude near 300 km and approaches unity at high altitudes. Similar descriptions of the average Te variations with altitude and of T ,'TI have been given by Evans (1964)19and by Evans and Lowenthal, (1964)20 :n analyses of ground-based radar observations made at the latitude of the Blossom Point passes.
The Heat Source
Having determined T i , the rate of heat loss of the heated electrons to the positive ion gas may be computed. The heated electrons also cool in collisons with the neutral particle gas, the most significant processes being excitation of atomic oxygen to the 'D level at high altitudes and rotational and vibrational ex- citation of molecular nitrogen at low altitudes. Cooling by excitation of oxygen to the 'D level is of special importance since it may be responsible for the var- iability in the intensity of the red a r c in the dayglow (Noxon 1964), 21 (Dalgarno and Walker, 19G4).22 The cooling rates have been tabulated by Dalgarno and McElroy (19G4)23 and a comparison of the contributions of the various processes at an altitude of 250 km is given in Figure 11.
The accuracy of the cooling rates is not yet adequate to warrant the use of the neutral particle densities and temperatures measured by the other Explorer XVII experiments (Newton, et al , 1964)," (Reber, et al, 1964).9 To calculate the heat necessary to produce the measuredelectron temperature we have instead
18
c
I I I
t 0
I I I
0 0 0 0 0
cv 0 a 5: - 0 3
0 8
5: In
0 5:
5: *
0 0 *
8 rr)
0 8
2 N
1 9

I
.
I I I
I- I
5 Y a z
0 0 W
5: In
0 0 In
5: t
0 0 t
5: rr)
0 0 rr)
20
+ c 0 .- a
2
m
E
v) 0 - c 0 .- I-
I- I
‘a
z ?! 3 ul
LL .-

3800
3000
- x -
Q1 I-
2000
1000
ELECTRON COOLING RATE vs Te [at 250 km] I
-
I I
/
1 10 lo2 i o 3 104 105 dTe/d: [eV cm-%ec-']
Figure 1 1 -Electron Cooling Rates at 250 Kilometers Demonstrating their Sensitivity to the Electron Temperature
adopted the model distributions of Harris and Priester (1962) l8 appropriate to the local time of the measurement. The results for the southbound passes over Blossom Point a r e shown in Figure 1 2 as a function of local time and altitude. Local time effects dominate during the daytime southbound passes and it appears that the heat input is roughly symmetrical about local noon, a variation in marked contrast to the asymmetries in Te and N i . The heat input at 260 km has a max- imum value of 4 >: l o 3 eV cm-3 sec-'. The nighttime values, presented in Fig- u re 13, depend more strongly on altitude. They show clearly a non-vanishing heat source decreasing with increasing altitude with a value of not less than 20eV ~ i i i - ~ sec- ' at an altitude of 400 km. The importance of using calculated ion tem- peratures is shown by a comparison of Figures 13 and 14. No clear pattern for Q emerges from Figure 14, which is based upon the assumption that Ti = TR.
21

f A /
t
I I
I fi I
t \
EXPLORER XPIl BLOSSOM POINT
SOUTHBOUND PlSsES
CALCULATED Ti
1 I I 1 I I 1 I I I I
4 0 12 16 20 24 4 24
LOCAL TIME (HOURS)
Figure 12-Locally Absorbed Energy (Q) Calculated for Southbound Passes. Local Time Effects Predominate in the Daylight Passes and Altitude Effects Control the Variations in the Nighttime Values of Q.
22

.
io3
IO2 0 - I 0 0 u)
m E
Y 2 0
IO'
. - I 1 I I I
- / EXPLORER XRII NIGHTTIME 0
BLOSSOM POINT (Ti CALCULATED)
r - - - - - - -
r
I I I I I 250 3 0 0 350 400 450 500 550
ALTITUDE (KM)
Figure 13-Q vs. Al t i tude in the Nightt ime Ionosphere Using the Calculated Values of Ti.
23

IO2 - I : Y n E
Y
0
IO‘
c
- EXPLORER XYU -/ NIGHTTIME Q - BLOSSOM POINT -
7 - - -
-
: - -
I 1 I I I 250 300 350 400 450 500 , 550
ALTITUDE (KM)
I
Fisure 14-Q vs. Altitude in the Nighttime Ionosphere Assuming Ti = T Note the Greater Scatter and Lack of Pattern Resulting from Th is Assumption. s:
I
24
.
The calculated values of Q for the northbound passes are shown in Figure 15. Local time and altitude effects a r e mixed and we have attempted to remove the dependence on local time by adopting for the northbound passes the diurnal varia- ation suggested by the southbound passes. The corrected values of Q, normalized to noon, are given in Figure 16. They show a heat input decreasing with altitude with an apparent change in the gradient in the region of 350 km.
DISCUSSION
The probe measurements of Te from the Explorer XVII satellite confirm the conclusions of the rocket flights (Boggess, Brace and Spencer, 1959), (Spencer, Brace and Carignan, 1962), (Nagy, Brace, Carignan and Kanal, 1963)24 that the difference between the tem- perature of the electrons in the F region of the ionosphere and the neutral par- ticle temperature is large during the daytime and small but non-vanishing at night. These conclusions are in harmony with measurements on the Ariel satel- lite (Willmore, Henderson, Bowen and Boyd, 1964)4 and on the Discoverer satel- lite (Sagalyn and Smiddy, 1964), 25 with observations of incoherent backscatter (Bowles, Ochs and Green, 1962),26 (Evans, 1962),27 (Pineo and Hynek, 1962),28 (Evans, 1964),19 (Evans and Lowenthal, 1964),20 (Greenhow, Sutcliffe, Watkins)21 and with a recent analysis of density profiles (Bauer, and Blumle, 1964).30
(Brace, Spencer and Carignan, 1963),3
There are significant differences between the various data. In particular, Willmore, et a1 do not find the morning maximum in Te which is a feature of the Explorer XVII data and which also appears in the backscatter observations of Evans and Loewenthal, the satellite data of Sagalyn and Smiddy and the density profile analysis of Bauer and Blumle. Bowles, et al, observing at the Equator, find a maximum at sunrise. As discussed earlier, Figure 8 shows that the time of the maximum depends at least partly upon geographic latitude.
Again in harmony with the rocket flight data, the Explorer XVII data show that Te increases with latitude, a phenomenon also observed by Willmore, Hen- derson, Bowen and Boyd (1964).4 The inverse relationship between Te and ne described in Equation (3) strongly suggests that the increase in Te is caused by the decrease in ne, a possibility noted by Dalgarno (1963).8 The temperature may not continue to increase at high latitudes and a preliminary analysis of passes over Grand Forks at a latitude of approximately 65'N magnetic indicates that Te had passed through a maximum (and ne through a minimum).
Strong evidence that the positive ion temperature is also higher than the neutral particle temperature at altitudes above 300 km has been advanced by Evans (1964)lg and by Evans and Loewenthal (1964)20 and the averaged profiles of Te and of Te/Ti that they present are consistent with those given in Figures
25
*
ALTITUDE (KM) 550 450400 350 300 260
I o4 1 I I 1 1 I I
I i
EXPLORER XYD BLOSSOM POINT
NORTHBOUND PASSES
CALCULATED Ti
I I
21 I
LjI
I I I 8 12 16 20
LOCAL TIME (HOURS)
I I1
5
Figure 15-Q Calculated for Northbound Passes. Local Time and Altitude Effects are Strongly Mixed in These Passes, Particularly in the Early Morning .
26

t
. i
* /
r / /
0 0 (0
5: m
0 0 m
L Y Y
W
3 n
t 5
g a 0
m
0 0 m
N
27

9 and 10, which a r e based upon Equation (8). The magnitudes of Ti at 400 km a r e in harmony with those measured by Boyd and Raitt (1964)31 and it seems that over a considerable altitude extent Te ? Ti ? Tg with Te/Ti approaching unity at high altitudes, a possibility to which Hanson (19G3)7 and Dalgarno (1963)8 drew attention.
The heating effect of absorbed solar ultraviolet radiation has been investi- gated by Hanson and Johnson (19Gl),S by Dalgarno, McElroy and Moffett (19G3),6 by Hanson (1963)7 and most recently by Dalgarno and McElroy (19G4)23 whose calculations make use of the improved photoionization calculations of Dalgarno , Henry, and Stewart (1964).32 The assumption that the heat is deposited locally leads to the predicted euv heating shown in Figure 16, which is in agreement with the heating derived from the Explorer XVII measurements at altitudes be- low 300 km. Because of the escape of fast photoelectrons (Hanson, 1963)7 the assumption of local heating is not valid above 300 km.
The gradient of the heat deposition from solar extreme ultraviolet radiation is equivalent to the neutral particle scale height, which is also shown in Figure16 to emphasize the change in gradient near 350 km. This change in gradient demon- s t ra tes that absorption of energy by neutral particles is not the controlling process at great altitudes, and it suggests that the controlling process may be absorption by the ambient electrons, a typical gradient for which is also shown in Figure 16. Such a heat flux is to be expected at great altitudes from the escaping photoelec- trons which lose energy by elastic collisions with the ambient electrons.
If j cm-' sec-' is the upward flux of photoelectrons and we adopt a mean of 10 eV for their energy, the rate of heating is given by
Q = 2 j ne x eV ~ r n - ~ sec- '
If the electrons cool by collisons with the positive ions O',
and if by collisons with He'
(9)
t

It follows that an upward flux of about 5 x 10 * cm-2 sec-' may be sufficient to explain the Explorer XVII data, and it appears from the report of Hinteregger, Hall and Schmidtke (1964)33 on the intensities of the extreme solar ultraviolet radiation, and from observations on Cosmos 3 and Cosmos 5 satellites (Mularchik and Vaisberg, 1964),34 that such a flux is available.
Similar arguments have been advanced by Willmore (1964) 35 in a discussion of the Ariel measurements which were carried out a year earlier than Explorer XVII measurements, but which lead to daytime heat inputs smaller by a factor of two o r three.
The fact that the electron temperature does not fall to the neutral particle temperature at night is of great interest, since it reveals the presence of an energy source in the nocturnal ionosphere. The heat input at an altitude of 400 km is about 20 eV cm-3 sec- l , which is about five t imes larger than that derived from Arie l data. Willmore (1964)35 has suggested that the energy source re- sponsible for the Ariel observations can be identified with the fluxes of 2-3 kev electrons of about 8 x l o 9 cm-* sec-l observed by Vernon, Savenko, Shavrin, Nesterov, Pisivenko (1963).36 This is an energy flux of 30 e rgs cm-2 sec- l , which is an order of magnitude larger than that of the solar ultraviolet radiation. If these electrons were precipitated into the atmosphere, they would give rise to 6 kilorayleighs of 3914 A emission (c.f. Dalgarno, 1964)37 whereas 0' Brien, Allum and Goldwire (1964)38 observe 5 rayleighs or less above 85 kilometers.
The difficulties presented by the large energy flux postulated by Willmore can be avoided by arbitrarily invoking instead a flux of soft electrons of, say, 100 eV energy. Assuming a heating efficiency of 0.1, the Ariel data require about 2 x 10⁻³ e rgs cm-2 sec- and the Explorer XVII data require about 1 X
ergs cm-2 s ~ c - ~ . Fluxes of this order do not contradict any of the limits that have been derived from spectroscopic observations (c.f. Dalgarno, 1964) 37 and the resulting altitude variation in the heat deposition would be similar to that indicated by the data in Figure 16.
t ACKNOWLEDGMENT
The authors a r e indebted to Mr. G. Carignan, University of Michigan, and Mr . J. Findlay, Goddard Space Flight Center for their outstanding efforts toward making the experiment successful and to G. Dunham for his aid in the analysis of data.
29

REFERENCES
1. Boggess, R.L., L.H. Brace, N.W. Spencer, J. Geophys. Res. 64, 1627 (1959)
2. Spencer, N.W., L.H. Brace, G.R. Carignan, J. Geophys. Res. 3, 157 (1962)
3. Brace, L.H., N.W. Spencer, G.R. Carignan, J. Geophys. Res. - 68, 5397 (1963)
4. Bowen, P.J., R.L.F. Boyd, C.L. Henderson, A.P. Willmore, Proc. Roy. Soc. A, - 281, 514 (1964)
5. Hanson, W.B., and F.S. Johnson, Mem. Soc. Sci. Liege, Series 5, - . 4 , 390 (1961)
6. Dalgarno, A., M.B. McElroy and R.J. Moffett, Planet. Space Sci. 11, 463 (1963)
7. Hanson, W.B., Space Research III (North-Hol1and:Amsterdam) Edited by W. Priester (1963)
8. Dalgarno, A., National Aeronautics and Space Administration, CR-8 (1963)
9. Reber, C.A., and M. Nicolet, P1anet:Space Sci. (in this issue) (1965)
10. Newton, G.P., R. Horowitz and W. Pr iester , Planet. Space Sci. (in this issue) (1965)
11. Brace, L.H., and N.W. Spencer, J. Geophys. Res. 69, (1964)
12. Mott-Smith, H.M., and I. Langmuir, Phys. Rev., 28, 727 (1926)
13. Spencer, N.W., Planet. Space Sci. (in this issue) (1965)
14. Spitzer, L., Physics of Fully Ionized Gases (Interscience, N.Y.) (1965)
15. Dalgarno, A., Phil. Trans. Roy. SOC., a, 426 (1958)
16. Dalgarno, A., Annales de Geophysique, 17, 16 (1961)
17. Dalgarno, A., Journal of Atmos. and Terr. Phys., 26, 939 (1964)
18. Harris, I., and W. Pr iester , J. Geophys. Res., 67, 4585 (1962)
30

19. Evans, J.V., J. Geophys. Res., 69, 1436 (1964)
20. Evans, J.V., and M. Loewenthal, Planet. and Space Sci. 10, 905 (1964) -
21. Noxon, J.F., J. Geophys. Res. 69, 3245 (1964)
22. Dalgarno, A., and J.C.G. Walker, Journ. Atmos. Sci., 21, 463 (1964)
23. Dalgarno, A., and M.B. McElroy, to be published (1964)
24. Nagy, A.F., L.H. Brace, G.R. Carignan and M. Kanal, J. Geophys. Res. - 68, 6401 (1963)
25. Sagalyn, R.C., M. Smiddy, Y.N. Bhargava, presented at fifth International COSPAR meeting, Florence, (1964)
26. Bowles, K.L., E.R. Ochs, and J.L. Green, J. Res. NBS, 66, 395 (1962)
27. Evans, J.V., J. Geophys. Res., 67, 4914 (1962)
28. Pineo, V.C., D.P. Hynek, J. Geophys. Res. 3, 5119 (1962)
29. Greenhow, J.S., H.K. Sutcliffe and C.D. Watkins, Journ. Atmos. Terr. Phys., 25, 197 (1963)
30. Bauer, S.J., L. Blumle, J. Geophys. Res., 69, 3613 (1964)
31. Boyd, R.L.F., W.J. Raitt, to be published (1964)
32. Dalgarno, A., R.J.W. Henry, and A.L. Stewart, Planet. Space Sci. 12, 235 (1964)
33. Hinteregger, H.E., L.A. Hall, G.Schmidtke, presented at fifth International COSPAR meeting, Florence, (1964)
34. Mularchik, T.M., O.L. Vaisberg, presented at fifth International COSPAR meeting, Florence (1964)
35. Willmore, P.A., Proc. Roy. SOC. A, 281, 140 (1964)
36. Vernov, S.N., I.A. Savenko, P.I. Shavrin, V. YE Nesterov and N.F. Pisarenko, Planet. Space Sci., 11, 567 (1963)
31

37. Dalgarno, A., Annales de Geophysique, 20, 65 (1964)
38. O'Brien, B.J., R. Allum, and H.C. Goldwire, J. Geophys. Res. (submitted) (1964)
t
32