Embed Size (px)
Citation preview

Woman River Banded Iron Formation channel sample, Marion Township.
Exploration Report (June – July 2006 Program)
on the Cayenne-Chili Properties
Benton, Genoa, Heenan, Mallard, and Marion Townships Porcupine Mining Division
Ontario, Canada Latitude 47.793° North, Longitude 83.314° West
NTS Map Sheet 41-O/16
October, 2006
Prepared for
Toronto, Ontario
By Claude Aussant, P.Geol. and Craig Scherba, P.Geol.
#4, 1922 – 9th Avenue SE Calgary, Alberta T2G 0V2
Canada
And With Geophysical Interpretations By
Roman Tykajlo, P.Geo. GeoVector Management Inc.
10 Green Street, Suite 312, Ottawa, Ontario K2J 3Z6

1

VenCan Gold Corporation Cayenne-Chili Property Exploration
i
Table of Contents SUMMARY..................................................................................................................................................................1
1.0 INTRODUCTION AND TERMS OF REFERENCE ................................................................................5
2.0 DISCLAMER ................................................................................................................................................7
3.0 PROPERTY DESCRIPTION AND LOCATION ......................................................................................8
4.0 ACCESSIBILITY, PHYSIOGRAPHY, CLIMATE, LOCAL RESOURCES & INFRASTRUCTURE 11
5.0 EXPLORATION HISTORY......................................................................................................................13 5.1 EAST - EAST OF RUSH RIVER.............................................................................................................................13 5.2 CENTRAL – AREA BETWEEN RUSH AND WOMAN RIVERS..................................................................................14 5.3 WEST – WEST OF WOMAN RIVER .....................................................................................................................14
6.0 GEOLOGICAL SETTING.........................................................................................................................16 6.1 REGIONAL GEOLOGY (FROM TYKAJLO ET AL., 2006).........................................................................................16 6.2 LOCAL GEOLOGY ..............................................................................................................................................18
6.2.1 Map Physiography...............................................................................................................................18 6.2.2 Map Methodology ................................................................................................................................18 6.2.3 Lithology ..............................................................................................................................................19 6.2.4 Structure ..............................................................................................................................................21 6.2.5 Quaternary Geology ............................................................................................................................22
7.0 EXPLORATION MODEL .........................................................................................................................22 7.1 ALGOMA-TYPE IRON FORMATION.............................................................................................................22 7.2 BIMODAL-SILICICLASTIC VOLCANIC-ASSOCIATED MASSIVE SULPHIDE....................................................23
8.0 MINERALIZATION ..................................................................................................................................26
9.0 JUNE TO AUGUST 2006 EXPLORATION PROGRAM.......................................................................27 9.1 GENOA GRID ESTABLISHMENT..................................................................................................................27 9.2 GEOLOGICAL MAPPING .............................................................................................................................27 9.3 SOIL GEOCHEMICAL SURVEY.....................................................................................................................29 9.4 2006 GROUND GEOPHYSICS ......................................................................................................................35
9.4.1 IP/resistivity Survey .............................................................................................................................36 9.4.2 Magnetometer Survey ..........................................................................................................................40 9.4.3 Gravity Survey .....................................................................................................................................40
9.5 CHANNEL SAMPLING.................................................................................................................................44 9.6 PROSPECTING, SAMPLING, AND AIRBORNE GEOPHYSICAL ANOMALY INVESTIGATION.............................46
9.6.1 Prospecting and Grab Sampling..........................................................................................................46 9.6.2 Genoa Grid Airborne Geophysical Anomaly Investigation .................................................................46 9.6.3 Regional/Property Scale Investigation of Airborne Geophysical ........................................................58
9.7 DIAMOND DRILLING..................................................................................................................................61 9.7.1 Jefferson Deposit and Burton Shaft Area.............................................................................................76 9.7.2 ‘VenCan Zinc Showing’ Area ..............................................................................................................77
9.8 GPS CONTROL SURVEYING.......................................................................................................................78 10.0 QUALITY ASSURANCE/QUALITY CONTROL ..................................................................................79
10.1 QA/QC PROTOCOL – DDH CORE..............................................................................................................79 10.2 CERTIFIED STANDARD CONTROLS-DDH CORE .........................................................................................79
VenCan Gold Corporation Cayenne-Chili Property Exploration
ii
10.3 BLANK SAMPLES-DDH CORE ...................................................................................................................80 10.4 DUPLICATE SAMPLES-DDH CORE.............................................................................................................80 10.5 QA/QC CONCLUSIONS AND RECOMMENDATIONS-DDH CORE .................................................................80 10.6 QA/QC PROTOCOL & RESULTS-SOIL SAMPLING.......................................................................................81 10.7 QA/QC PROTOCOL & RESULTS – ROCK SAMPLING...................................................................................81
11.0 INTERPRETATION AND CONCLUSIONS...........................................................................................82 11.1 JEFFERSON DEPOSIT AND BURTON SHAFT AREA .......................................................................................82 11.2 BASE METAL AND GOLD TARGETS............................................................................................................82 11.3 SOIL SAMPLING .........................................................................................................................................83 11.4 ‘VENCAN ZINC SHOWING’ AREA ..............................................................................................................83 11.5 GROUND MAGNETICS................................................................................................................................83
12.0 RECOMMENDATIONS ............................................................................................................................83
13.0 ACKNOWLEDGEMENTS AND CERTIFICATES................................................................................84 13.1 ACKNOWLEDGEMENTS ..............................................................................................................................84 13.2 CERTIFICATE OF QUALIFICATION – C.H. AUSSANT ...................................................................................86 13.2 CERTIFICATE OF QUALIFICATIONS-C. S. SCHERBA....................................................................................87 13.3 CERTIFICATE OF QUALIFICATIONS-R. TYKAJLO ........................................................................................88
14.0 REFERENCES ............................................................................................................................................89 Figures FIGURE 1-1 – PROJECT LOCATION MAP...............................................................................................................6
FIGURE 3-1 – PROPERTY MAP...............................................................................................................................10
FIGURE 4-1 – PROPERTY ACCESS ........................................................................................................................12
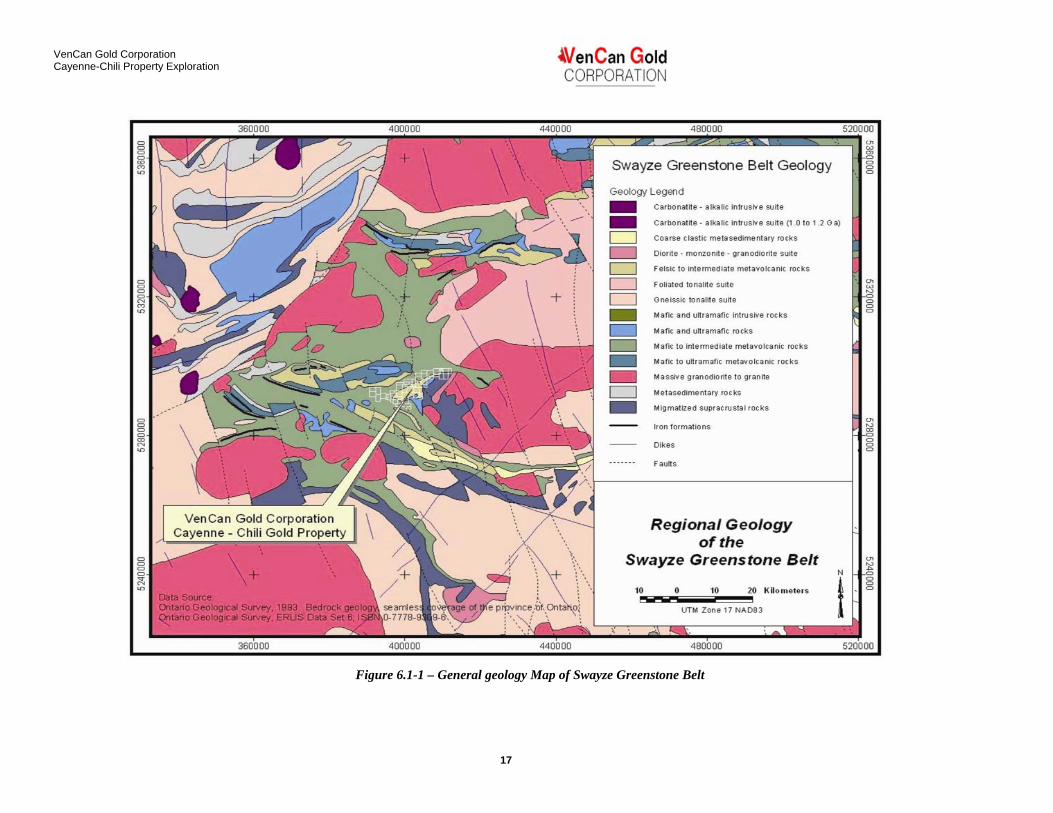
FIGURE 6.1-1 – GENERAL GEOLOGY MAP OF SWAYZE GREENSTONE BELT ............................................17
FIGURE 7.2-1 – SCHEMATIC OF MODERN SULPHIDE DEPOSIT ON THE MID-ATLANTIC RIDGE IDENTIFYING A CONCORDANT SEMI-MASSIVE TO MASSIVE SULPHIDE LENS UNDERLAIN BY A DISCORDANT STOCKWORK VEIN SYSTEM AND ASSOCIATED ALTERATION HALO (HANNINGTON ET. AL., 1996).............................................................................................................................................................24
FIGURE 7.2-2 – METAL ZONATION WITHIN VMS DEPSOITS ATTRIBUTABLE TO DIFFERENCES IN TEMPERATURE OF THE HOST ROCK AND/OR PROXIMITY TO A HYDROTHERMAL HEAT SOURCE (LARGE, 1992). ..........................................................................................................................................................25
FIGURE 7.2-3 – METAL ZONATION WITHIN VMS DEPOSITS AND SPATIAL ASSOCIATION WITH BIF ATTRIBUTABLE TO PROXIMITY TO A HYDROTHERMAL HEAT SOURCE (LARGE, 1977).......................25
FIGURE 9.1-1 – GENOA GRID.................................................................................................................................27
FIGURE 9.2-1: GENOA GRID GEOLOGIC MAP ...................................................................................................28
FIGURE 9.3-1 GENOA GRID SOIL SAMPLE COVERAGE ..................................................................................29
FIGURE 9.3-2: AU-IN-SOILS....................................................................................................................................30
FIGURE 9.3-3: AG-IN-SOILS...................................................................................................................................31
FIGURE 9.3-4: CU-IN-SOILS ...................................................................................................................................32

VenCan Gold Corporation Cayenne-Chili Property Exploration
iii
FIGURE 9.3-5: PB-IN-SOILS....................................................................................................................................33
FIGURE 9.3-6: ZN-IN-SOILS ...................................................................................................................................34
FIGURE 9.4.1-1: GENOA GRID – TOTAL APPARENT CHARGEABILITY........................................................38
FIGURE 9.4.1-2: GENOA GRID – APPARENT RESISTIVITY..............................................................................39
FIGURE 9.4.2-1: GENOA GRID – TOTAL FIELD MAGNETOMETER SURVEY...............................................41
FIGURE 9.4.3-1: GENOA GRID – BOUGEUR GRAVITY SURVEY ....................................................................42
FIGURE 9.4.3-2: GENOA GRID – RESIDUAL GRAVITY SURVEY....................................................................43
FIGURE 9.5-1 – GENOA GRID CHANNEL SAMPLING LOCATION MAP .........................................................45
FIGURE 9.6.1-1: PERCENTRANKED GOLD-IN-ROCKS .....................................................................................47
FIGURE 9.6.1-2: PERCENTRANKED SILVER-IN-ROCKS...................................................................................48
FIGURE 9.6.1-3: PERCENTRANKED COPPER-IN-ROCKS .................................................................................49
FIGURE 9.6.1-4: PERCENTRANKED LEAD-IN-ROCKS......................................................................................50
FIGURE 9.6.1-5: PERCENTRANKED ZINC-IN-ROCKS .......................................................................................51
FIGURE 9.6.2-1 – AEROQUEST AEROTEM TARGETS (AEROQUEST TOTAL FIELD AIRBORNE MAGNETICS BACKGROUND)................................................................................................................................52
FIGURE 9.6.2-2 – PRIORITIZED 2006 AIRBORNE TARGETS (AEROQUEST TOTAL FIELD AIRBORNE MAGNETICS BACKGROUND)................................................................................................................................56
FIGURE 9.7-1 – DRILL HOLE LOCATION PLAN MAP – COLLAR LOCATIONS .............................................62
FIGURE 9.7-2: DIAMOND DRILL HOLE SECTION – VG-06-01 .........................................................................65
FIGURE 9.7-3: DIAMOND DRILL HOLE SECTION – VG-06-02 TO VG-06-05..................................................66
FIGURE 9.7-4: DIAMOND DRILL HOLE SECTION – VG-06-06 TO VG-06-08..................................................67
FIGURE 9.7-5: DIAMOND DRILL HOLE SECTION – VG-06-09 TO VG-06-11..................................................68
FIGURE 9.7-6: DIAMOND DRILL HOLE SECTION – VG-06-12 .........................................................................69
FIGURE 9.7-7: DIAMOND DRILL HOLE SECTION – VG-06-13 .........................................................................70
FIGURE 9.7-8: DIAMOND DRILL HOLE SECTION – VG-06-14 .........................................................................71
FIGURE 9.7-9: DIAMOND DRILL HOLE SECTION – VG-06-15 .........................................................................72
FIGURE 9.7-10: DIAMOND DRILL HOLE SECTION – VG-06-16 ........................................................................73
FIGURE 9.7-11: DIAMOND DRILL HOLE SECTION – VG-06-17 .......................................................................74 Tables

VenCan Gold Corporation Cayenne-Chili Property Exploration
iv
TABLE 3-1 - CLAIMS STATUS..................................................................................................................................8
TABLE 9.5-1 –SUMMARY OF ANOMALOUS CHANNEL SAMPLE RESULTS.................................................44
TABLE 9.6.1-1 –SUMMARY OF ANOMALOUS ROCK SAMPLE RESULTS......................................................46
TABLE 9.6.2-1 – PRIORITIZED AIRBORNE ANOMALIES ..................................................................................53
TABLE 9.7-1: DRILL HOLE DATA..........................................................................................................................61
TABLE 9.7-2 – SUMMARY OF SIGNIFICANT DDH INTERSECTIONS..............................................................77
TABLE 10.1: STANDARD REFERENCE MATERIAL-DDH CORE ......................................................................79
TABLE 10-2: GEOSTATS STANDARD REFERENCE MATERIAL-SOIL SURVEY ...........................................81 Photos PHOTO 6.2.3.1-1 – FELDSPAR LAPILLI TUFF. .....................................................................................................19
PHOTO 6.2.3.2-1 – OXIDE FACIES IRON FORMATION WITH BANDED CHERT, MAGNETITE, AND HEMATITE.................................................................................................................................................................19
PHOTO 6.2.3.2-2 – SULPHIDE FACIES IRON FORMATION WITH >75% PYRITE AND PYRRHOTITE; CHANNEL #7. ............................................................................................................................................................19
PHOTO 6.2.3.3-1 – THOLEIITIC BASALT FLOW. .................................................................................................20
PHOTO 6.2.3.4 – MASSIVE LEUCOCRATIC GRANODIORITE. ..........................................................................20
PHOTO 6.2.3.5-1 – MESOCRATIC DIORITE. .........................................................................................................21
PHOTO 6.2.5-1 – GLACIAL STRIAE, WITH PENCIL POINTING IN DIRECTION OF GLACIAL MOVEMENT......................................................................................................................................................................................22 Maps Scale Genoa Grid Geology Map 1:5,000 Genoa Grid Total Magnetic Intensity Survey 1:5,000 Genoa Grid Total Magnetic Intensity Survey Profiles 1:5,000 Genoa Grid Bouguer Gravity Survey, Bouguer Density 2.67 gm/cc 1:5,000 Genoa Grid Bouguer Gravity Survey, Calculated Residual 1:5,000 Genoa Grid Elevation Survey 1:5,000 Genoa Grid Induced Polarization Survey Apparent Chargeability at N=1 1:5,000 Genoa Grid Induced Polarization Survey 75m Depth Slice from UBC 2D Inversion 1:5,000 Genoa Grid Resistivity Survey Apparent Resistivity at N=1 1:5,000 Genoa Grid Resistivity Survey 75m Depth Slice from UBC 2D Inversion 1:5,000

VenCan Gold Corporation Cayenne-Chili Property Exploration
v
Sections Genoa Grid Line 53+00E Resistivity/IP Pseudosections and Inversion Depth Sections Genoa Grid Line 54+00E Resistivity/IP Pseudosections and Inversion Depth Sections Genoa Grid Line 55+00E Resistivity/IP Pseudosections and Inversion Depth Sections Genoa Grid Line 56+00E Resistivity/IP Pseudosections and Inversion Depth Sections Genoa Grid Line 59+00E Resistivity/IP Pseudosections and Inversion Depth Sections Genoa Grid Line 60+00E Resistivity/IP Pseudosections and Inversion Depth Sections Genoa Grid Line 62+00E Resistivity/IP Pseudosections and Inversion Depth Sections Genoa Grid Line 63+00E Resistivity/IP Pseudosections and Inversion Depth Sections Genoa Grid Line 64+00E Resistivity/IP Pseudosections and Inversion Depth Sections Genoa Grid Line 66+00E Resistivity/IP Pseudosections and Inversion Depth Sections Genoa Grid Line 67+00E Resistivity/IP Pseudosections and Inversion Depth Sections Genoa Grid Line 68+00E Resistivity/IP Pseudosections and Inversion Depth Sections Genoa Grid Line 69+00E Resistivity/IP Pseudosections and Inversion Depth Sections Genoa Grid Line 73+00E Resistivity/IP Pseudosections and Inversion Depth Sections Genoa Grid Line 74+00E Resistivity/IP Pseudosections and Inversion Depth Sections Genoa Grid Line 75+00E Resistivity/IP Pseudosections and Inversion Depth Sections Genoa Grid Line 76+00E Resistivity/IP Pseudosections and Inversion Depth Sections Genoa Grid Line 77+00E Resistivity/IP Pseudosections and Inversion Depth Sections Genoa Grid Line 78+00E Resistivity/IP Pseudosections and Inversion Depth Sections Genoa Grid Line 79+00E Resistivity/IP Pseudosections and Inversion Depth Sections Genoa Grid Line 80+00E Resistivity/IP Pseudosections and Inversion Depth Sections Genoa Grid Line 81+00E Resistivity/IP Pseudosections and Inversion Depth Sections Genoa Grid Line 82+00E Resistivity/IP Pseudosections and Inversion Depth Sections Genoa Grid Line 85+00E Resistivity/IP Pseudosections and Inversion Depth Sections Genoa Grid Line 86+00E Resistivity/IP Pseudosections and Inversion Depth Sections Appendix A 1. Drill Core Logging Geological Legend 2. Drill Hole Locations and Summary 3. Down Hole Survey Log (Reflex Results) 4. ALS Chemex Assay and Analytical Procedures 5. Summary of Significant DDH Analytical Results 6. Swastyka Labs Au Analytical Proceedures 7. Partial List of Project Personnel- June to July 200 Program 8. QA-QC Graphs 9. KT-9 Kappameter Specifications 10. Diamond Drill Core RQD/Recovery Logs 11. Drill Core Magnetic Susceptibility Readings 12. Aeroquest Limited July, 2006 Airborne Geophysics Report 13. Airborne Anomalies (Picked by B. Nielsen & by GeoVector Management Inc.) 14. Exsics Exploration Limited Magnetic & Resistivity/IP Survey Logistics Report 15. MWH Geophysics Ltd. Gravity Survey Logistics Report Appendix B

VenCan Gold Corporation Cayenne-Chili Property Exploration
vi
1. Diamond Drilling Geology Logs with Au, Ag, Cu, Pb & Zn Analytical Results 2. Diamond Drill Core Analytical Results 3. Geochemical Soil Correlation Coefficient Plot 4. Summary Assay List-Soil Samples with Descriptions 5. Channel Sample Locations, Descriptions and Analytical Results 6. Rock Sample Locations, Descriptions and Analytical Results Appendix C 1. Certificates of Analysis 2. QC Certificates of Analysis DVD-1 Report text and figures All data PDF Raw data Core Photographs

VenCan Gold Corporation Cayenne-Chili Property Exploration
1
Summary The Cayenne-Chili Property is located approximately 110 kilometres southwest of the city of Timmins, and is centered on latitude 47.793 N and longitude 83.314' W within 1:50,000 NTS map sheet 41O/16. The property consists of 57 contiguous mining claims comprising 538 claim units for 8704.84 hectares. Within this claim package there are 46 unpatented mining claims, comprised of 512 claim units, and 5 patented mining claims comprised of 20 claim units that are recorded 100% in the name of VenCan Gold Corporation (VenCan). In addition, there are 4 leased mining claims, comprised of 4 claim units and 2 unpatented mining claims, comprised of 2 claim units that VenCan has optioned from Falconbridge Limited (Falconbridge). The claims are located in the Porcupine Mining Division in the Heenan, Marion, Mallard, and Genoa townships, Ontario. The primary focus of the summer 2006 exploration program was VMS style mineralization in the area of the Jefferson Zn-Pb deposit (Jefferson) which contains an historical (1948) non-NI 43-101 compliant resource estimate of 30,100 tons at 7.05% Zn and 4.58% Pb. The historical work defined “massive sulphides enriched in zinc and lead over a strike length of 150 meters and to a vertical depth of 30 metres”. Deeper drilling to a vertical depth of 85 metres in 1950 indicated continuity of the zinc-lead enriched sulphide body. Some of the better drill intersections documented by the historical work on the Jefferson deposit included 4.43% Zn and 1.25% Pb over 22.9 meters and 9.1% Zn and 11.5% Pb over 6.9 meters. Work by Falconbridge in the 1980’s reinterpreted the mineralization at the Jefferson deposit as associated with cross-cutting fractures and so not strictly of the VMS type. The results of the 2006 exploration program conducted by VenCan supports this interpretation, however, the authors believe that the known mineralization may be stringer type mineralization that indicates that potential exists to discover a proximal VMS source on VenCan’s property. A total of 12 diamond drill holes were completed by VenCan during the 2006 exploration program in the area of the Jefferson (holes VG-06-02 through VG-06-13) in an attempt to replicate historical results. The best drill intersections encountered in the 2006 program include 7.24% Zn over 1.85 meters (VG-06-02), 2.34% Zn and 2.10% Pb over 8.70 meters (VG-06-04), 1.83% Zn and 1.29% Pb over 10.20 meters (VG-06-05), and 1.48% Zn over 13.60 meters (VG-06-12). Two holes were drilled to the west of the Jefferson to test for strike extension of known mineralization. HoleVG-06-14 was drilled 300 meters to the west and encountered 8.93% Pb over 3.10 meters. Drill-Hole VG-06-15 was drilled 600 meters to the west and encountered no significant mineralization. VenCan was not able to confirm the thickness or tenor of mineralization at the Jefferson as was historically reported. The gravity survey conducted by MWH outlined a pronounced positive anomaly approximately 550 metres in length coincident with the Jefferson deposit. Based on geological mapping and interpretation of ground geophysical data, the Jefferson is believed to lie on the northern limb of an overturned east-north-east plunging isoclinal anticline with vergence to the north, indicating a possible proximal VMS source more deeply buried to the north and/or east of the Jefferson.

VenCan Gold Corporation Cayenne-Chili Property Exploration
2
Drilling completed near the Burton Shaft Zn-Pb-Au occurrence, located north-east of the Jefferson deposit, has led the to the conclusion that the Burton Shaft occurrence lies within a limb of a complementary syncline to the Jefferson anticline. A single drill hole by Hollinger in 1929 intersected 7.5% Zn, 1.5%Pb and 7.5 g/t Au over 4.8 meters. A hole drilled immediately adjacent to the Burton Shaft during the 2006 exploration program (VG-06-01) encountered 1.55% Zn and 0.35% Pb over 6.05 meters with no significant gold mineralization. Geologic mapping in conjunction with the ground magnetometer survey identified a previously unknown anticline fold nose of the Woman River Iron Formation 500 meters to the east of the Jefferson deposit which is believed to be a highly prospective base metal-gold target. The anticline appears to plunge shallowly to the east and the gravity survey results have revealed a weak but continuous positive anomaly that is coincident with the projected plunge and which extends for 800 meters in this direction. Considering that the amplitude of the gravity effect is attenuated by even modest depths of burial the “anticline” target merits thorough exploration follow up. The orientation soil sampling survey was highly successful in identifying the known mineralized zones, as well as highlighting a previously unknown area south of the Burton Shaft which is anomalous in gold, silver, copper, lead, and zinc. This multi-element anomaly is also coincident with the western edge of the “anticline” gravity anomaly at the eastern limit of the present soil survey coverage. The area around the historical drill intersection of 11.98% Zn over 3.2 meters located approximately 2.0 km to the west of the Jefferson Deposit was investigated during the 2006 exploration program, and an outcrop of sphalerite-rich mineralization corresponding to an AeroTEM helicopter-borne EM/Magnetometer anomaly was discovered. Grab samples from this outcrop yielded assay values ranging from 11.2% Zn to 17.96% Zn. VenCan drill hole VG-06-16 later completed beneath the outcrop intersected 4.22% over 16.85 meters including 7.27% Zn over 8.50 meters on a IP, magnetometer and gravity anomaly that extends 500 meters to the west. Subsequent to the field exploration program, inversion modeling of the 2006 IP data has identified a pronounced anomaly 100 meters to the north-west of the VG-06-16 collar that is open to the west. A channel sample of massive sulphide 100 meters west of hole VG-06-16 assayed 1250 ppm Zn, 538 ppm Pb, and 155 ppm Cu over 1.1 meter, and a regional highly anomalous grab sample taken 1.25 kilometers to the west assayed 8500 ppm Zn and 985 ppm Cu. The potential to discover Zn-rich mineralization with a strike length in excess of 1 kilometer makes this area highly prospective and therefore merits thorough exploration follow up. Magnetic surveys successfully mapped the complex interior character of the northeast trending WRIF and adjacent stratigraphy and revealed local stratigraphic or structural thickening of magnetic units. Discrete detection of the Jefferson Occurrence with magnetics remains problematic. Gravity surveying successfully defined a local residual gravity high associated with the Jefferson Occurrence, along with several similar anomalies in the VenCan Occurrence and GV Target areas.
VenCan Gold Corporation Cayenne-Chili Property Exploration
3
IP/RES surveying and subsequent inversion modeling outlined three distinct, high chargeability zones including one directly associated with the Jefferson Occurrence, one spatially associated with the Vencan Occurrence, and several in the GV Target Area. Recommendations include:
• Linecutting - To cover the prospective area to the west of the VenCan Zinc Showing, the existing Genoa Grid should be augmented/extended with the addition of lines 3900E to 5000E from stations 200N to 800S, and lines 2400E to 3800E from stations 0 to 1000S. In total 26 new lines, each 1 kilometer in length, should be cut.
• IP – IP/RES surveys and inversion modeling be completed on L51+00E, L52+00E,
L57+00E, L58+00E, L61+00E and L66+00E on the existing Genoa grid to complete mapping of anomalies over the VenCan Occurrence and GV Target Areas.
• IP/RES surveys and inversion modeling be completed westward over the extended grid
to map the limits and extents of VenCan Showing IP anomaly and possibly similar anomalies along strike westward.
• Magnetometer – Detailed magnetic surveying be completed over the extended grid to
continue mapping internal complexity of the WRIF and adjacent startigraphy.
• Soil Sampling - As the previous exploration program illustrated, soil sampling is efficacious on the property and should be completed over the newly established grid extension (1066 samples over 26 line km). Time permitting, infill soil sampling over the previously established Genoa Grid would entail 1681 samples over 41 line km, and could aid in identifying new mineral occurrences.
• Prospecting - The area around the newly identified antiformal nose (~300 meters to the
east of the Jefferson), the western portion of the Genoa Grid on strike with the VenCan Showing, and the newly established ‘Genoa Grid Extension’ should be thoroughly prospected and sampled. Additionally, two weeks of helicopter-supported exploration is proposed for inaccessible areas of VenCan’s broader land position.
• Drilling - Initially, 6 holes at the VenCan Showing are proposed over 900 meters, with
2 additional holes in the vicinity of the antiformal nose east of the Jefferson and/or the gravity anomaly east of the Burton (over 300 meters). Three drill sections, of 2 holes each, and spaced 100 meters apart are envisioned at the VenCan Showing to test strike extension and grade.
• Mapping – The Genoa Grid geology map should be augmented with additional mapping
over the newly established ‘Genoa Grid Extension’.

VenCan Gold Corporation Cayenne-Chili Property Exploration
4
4VenCan GOld CORPORATION
VenCan Gold Corporation Cayenne-Chili Property Exploration
5
1.0 Introduction and Terms of Reference This report was commissioned by Kirk McKinnon, President of VenCan Gold Corporation (VenCan), to review the base metal exploration developments on the Cayenne-Chili Property, located in the Genoa & Marion townships in the eastern part of the Swazye “greenstone” belt, in the Porcupine Mining District, Ontario, Canada (Figure 1-1). The exploration program carried out between June and August 2006 incorporated the following work:
• Drilling 17 diamond drill holes (2425 meters). • Lithological logging of all core, as well as RQD/recovery determinations. • Line cutting/grid placement over a selected portion of the property area (54 line km). • Gravity survey over the newly established Genoa grid. • IP/resistivity surveying over selected portions of the Genoa grid. • Magnetometer surveying over the entire Genoa grid. • Soil sampling over selected portions of the Genoa grid. • Geological mapping and prospecting over the entire Genoa grid. • Limited channel sampling over selected targets.
VenCan Gold Corporation Cayenne-Chili Property Exploration
6
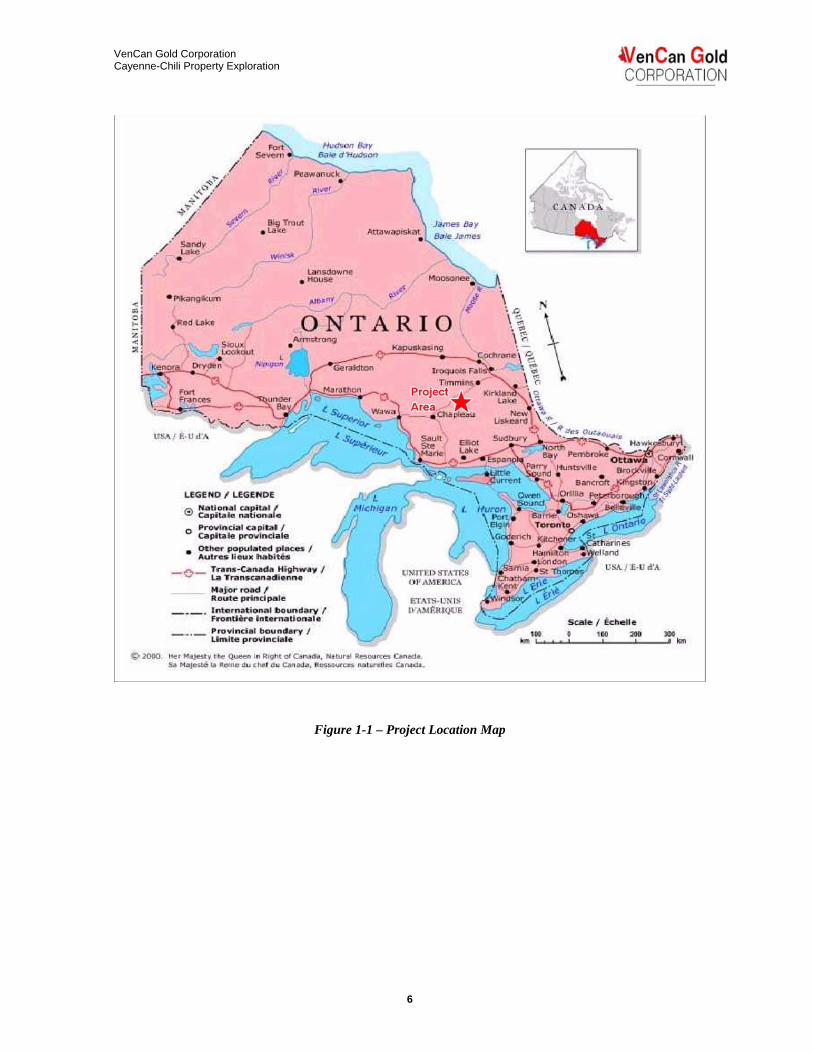
Figure 1-1 – Project Location Map
VenCan Gold Corporation Cayenne-Chili Property Exploration
7
2.0 Disclamer C. Aussant, P. Geol., and C. Scherba, P. Geol., have supervised and conducted the exploration program on which this report is based and have done so in accordance with normal industry practices. Property information in this report is sourced from assessment files, the Geological survey, or from original official documents held by VenCan Gold Corporation. For the purpose of this report Scherba and Aussant have assumed that VenCan Gold Corporation has appropriate right of title to the property area. Neither is responsible, however, for the accuracy of any property data and they do not make any claim or state any opinion as to the validity of the property disposition described herein. For the preparation of this report, Aussant and Scherba have relied upon maps, documents and electronic files generated by the current exploration crew, contributing consultants, and service providers working under our supervision. To the extent possible under the mandate of a National Instrument 43-101 review we have verified the material facts relating to the prospectiveness of the properties reviewed in this report. Considering the number of workers contributing to the project and the amount of information generated thereby, Aussant and Scherba take responsibility for work conducted under their supervision but can in no way be responsible for any inaccuracy, omission or misrepresentation of any historical, external, or third party material used by them in preparation of this report.

VenCan Gold Corporation Cayenne-Chili Property Exploration
8
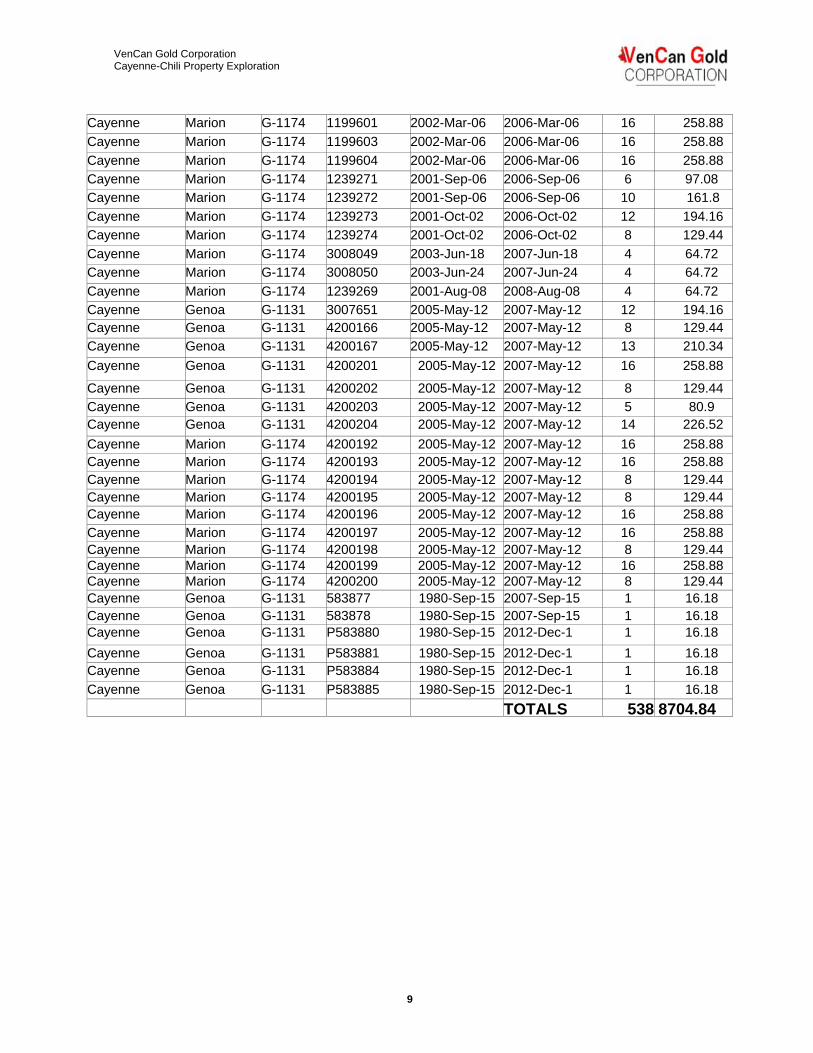
3.0 Property Description and Location The Cayenne-Chili Property is located approximately 110 kilometres southwest of the city of Timmins (Figure 1-1). The property is centered on latitude 47.793 N and longitude 83.314' W within 1:50,000 NTS map sheet 41O/16. The Cayenne and Chili Properties consist of 57 contiguous mining claims (Table 3-1) comprising 538 claim units for 8704.84 hectares (Figure 3-1). Within this claim package there are 46 unpatented mining claims, comprised of 512 claim units (8284.16 hectares) and 5 patented mining claims, comprised of 20 claim units (323.60 hectares) that are recorded 100% in the name of VenCan Gold Corporation. In addition, there are 4 leased mining claims, comprised of 4 claim units (64.72 hectares) and 2 unpatented mining claims, comprised of 2 claim units (32.36 hectares) that VenCan has optioned from Falconbridge Limited (Falconbridge). The claims are located in the Porcupine Mining Division in Heenan (G-1139), Marion (G-1174), Mallard (G-1171) and Genoa (G1131) townships, Ontario.
Table 3-1 - Claims Status
Project Name Township G-Plan Claim Number
Recording Date
Claim Due Date
Units Hectares
Cayenne Heenan G-1139 3004853 2003-Mar-05 2006-Mar-05 16 258.88 Cayenne Heenan G-1139 3004858 2003-Mar-05 2006-Mar-05 15 242.7 Cayenne Heenan G-1139 3005870 2004-Jul-20 2006-Jul-20 12 194.16 Cayenne Heenan G-1139 3005872 2004-Jul-20 2006-Jul-20 9 145.62 Cayenne Heenan G-1139 3011886 2004-Jul-20 2006-Jul-20 2 32.36 Cayenne Heenan G-1139 3011914 2004-Jul-20 2006-Jul-20 16 258.88 Cayenne Heenan G-1139 3003895 2004-Sep-07 2006-Sep-07 8 129.44 Cayenne Heenan G-1139 3003896 2004-Sep-07 2006-Sep-07 16 258.88 Cayenne Heenan G-1139 3003897 2004-Sep-07 2006-Sep-07 15 242.7 Cayenne Mallard G-1171 3003893 2004-Sep-07 2006-Sep-07 12 194.16 Cayenne Mallard G-1171 3003894 2004-Sep-07 2006-Sep-07 6 97.08 Cayenne Marion G-1174 3003877 2004-Sep-07 2006-Sep-07 9 145.62 Cayenne Marion G-1174 3003878 2004-Sep-07 2006-Sep-07 16 258.88 Cayenne Marion G-1174 3003879 2004-Sep-07 2006-Sep-07 16 258.88 Cayenne Marion G-1174 3003880 2004-Sep-07 2006-Sep-07 16 258.88 Cayenne Heenan G-1139 3005871 2004-Jul-20 2007-Jul-20 9 145.62 Cayenne Heenan G-1139 4200151 2005-Jul-25 2007-Jul-25 12 194.16 Cayenne Heenan G-1139 4200152 2005-Jul-25 2007-Jul-25 14 226.52 Cayenne Heenan G-1139 3003889 2005-Sep-06 2007-Sep-06 3 48.54 Cayenne Heenan G-1139 3003900 2005-Sep-15 2007-Sep-15 6 97.08 Chili Heenan G-1139 WS8 Patented Claim Patented Claim 6 97.08 Chili Heenan G-1139 WS9 Patented Claim Patented Claim 4 64.72 Chili Heenan G-1139 WS10 Patented Claim Patented Claim 6 97.08 Chili Heenan G-1139 WS11 Patented Claim Patented Claim 2 32.36 Chili Heenan G-1139 WS12 Patented Claim Patented Claim 2 32.36
VenCan Gold Corporation Cayenne-Chili Property Exploration
9
Cayenne Marion G-1174 1199601 2002-Mar-06 2006-Mar-06 16 258.88 Cayenne Marion G-1174 1199603 2002-Mar-06 2006-Mar-06 16 258.88 Cayenne Marion G-1174 1199604 2002-Mar-06 2006-Mar-06 16 258.88 Cayenne Marion G-1174 1239271 2001-Sep-06 2006-Sep-06 6 97.08 Cayenne Marion G-1174 1239272 2001-Sep-06 2006-Sep-06 10 161.8 Cayenne Marion G-1174 1239273 2001-Oct-02 2006-Oct-02 12 194.16 Cayenne Marion G-1174 1239274 2001-Oct-02 2006-Oct-02 8 129.44 Cayenne Marion G-1174 3008049 2003-Jun-18 2007-Jun-18 4 64.72 Cayenne Marion G-1174 3008050 2003-Jun-24 2007-Jun-24 4 64.72 Cayenne Marion G-1174 1239269 2001-Aug-08 2008-Aug-08 4 64.72 Cayenne Genoa G-1131 3007651 2005-May-12 2007-May-12 12 194.16 Cayenne Genoa G-1131 4200166 2005-May-12 2007-May-12 8 129.44 Cayenne Genoa G-1131 4200167 2005-May-12 2007-May-12 13 210.34 Cayenne Genoa G-1131 4200201 2005-May-12 2007-May-12 16 258.88
Cayenne Genoa G-1131 4200202 2005-May-12 2007-May-12 8 129.44 Cayenne Genoa G-1131 4200203 2005-May-12 2007-May-12 5 80.9 Cayenne Genoa G-1131 4200204 2005-May-12 2007-May-12 14 226.52 Cayenne Marion G-1174 4200192 2005-May-12 2007-May-12 16 258.88 Cayenne Marion G-1174 4200193 2005-May-12 2007-May-12 16 258.88 Cayenne Marion G-1174 4200194 2005-May-12 2007-May-12 8 129.44 Cayenne Marion G-1174 4200195 2005-May-12 2007-May-12 8 129.44 Cayenne Marion G-1174 4200196 2005-May-12 2007-May-12 16 258.88 Cayenne Marion G-1174 4200197 2005-May-12 2007-May-12 16 258.88 Cayenne Marion G-1174 4200198 2005-May-12 2007-May-12 8 129.44 Cayenne Marion G-1174 4200199 2005-May-12 2007-May-12 16 258.88 Cayenne Marion G-1174 4200200 2005-May-12 2007-May-12 8 129.44 Cayenne Genoa G-1131 583877 1980-Sep-15 2007-Sep-15 1 16.18 Cayenne Genoa G-1131 583878 1980-Sep-15 2007-Sep-15 1 16.18 Cayenne Genoa G-1131 P583880 1980-Sep-15 2012-Dec-1 1 16.18 Cayenne Genoa G-1131 P583881 1980-Sep-15 2012-Dec-1 1 16.18 Cayenne Genoa G-1131 P583884 1980-Sep-15 2012-Dec-1 1 16.18 Cayenne Genoa G-1131 P583885 1980-Sep-15 2012-Dec-1 1 16.18 TOTALS 538 8704.84

VenCan Gold Corporation Cayenne-Chili Property Exploration
10
Figure 3-1 – Property Map
N
~VenCan Gold CORPORATION
o V 2.5 5
VenCan Gold Corporation Cayenne-Chili Property Exploration
11
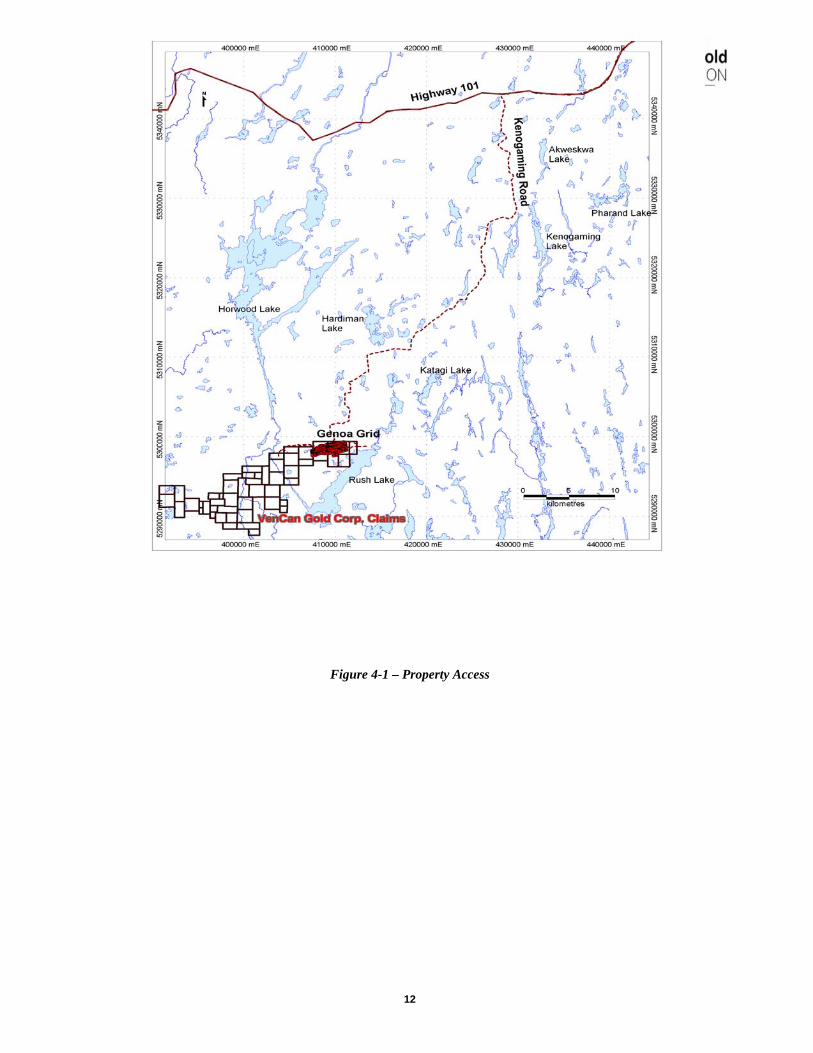
4.0 Accessibility, Physiography, Climate, Local Resources & Infrastructure Access is via paved road from Timmins Ontario, a distance of 60 kilometers along highway 101, to the Kenoqaming logging road located immediately after Sewell Creek, and then 60 kilometers along logging roads to the centre of the area investigated during the June to August exploration program (Figure 4-1). The claim area is relatively low and flat with a mean elevation of 400 meters. Occasional ridges, which have a maximum relief of 55 meters, provide locally variable topographic relief. Numerous swamps are present in the area, and Rush Lake to the southeast is the principal body of water. The area is drained northward by the Woman River and its tributaries: Opeepeesway River in the south; Heenan Creek in the west; and Rush River, which drains Rush Lake, in the west. Rock outcropping exposure is less than 5 percent, with the claim area dominated by spruce and cedar bogs in low-lying areas, and poplars with intermittent maple and minor oak over ridgelines and well drained areas. The claim area has a Continental climate that is characterized by cold dry winters and warm dry summers. The coldest month of the year is January with a mean temperature of -17 C, with July being the warmest month with a mean temperature of 18 C. Annual precipitation is roughly 900 millmetres, with the majority of precipitation falling between June and August.* Local resources are dominated by merchantable timber, with Domtar Inc. holding the harvest rights within its Pineland Forest Area (378900 hectares)**, over much of VenCan Gold’s claim area. As a result, accessibility to the claim areas is greatly enhanced due to Domtar Inc.’s extensive logging road network. The area is subject to tourism, with a fly-in fishing lodge located on the north shore of Rush Lake, roughly 1.5 kilometers south of the area investigated during the June to August exploration program. The property is of sufficient size to accommodate all facilities required to allow mining activities if economic mineralization in sufficient quantities is discovered on the property. Timmins is the largest center of commercial and social activity in the region, with services and manpower related to exploration and mining activities readily available. Scheduled commercial airlines, rail service, bus service, and numerous truck transportation companies service the Timmins area.
* Data from Environment Canada website (http://weatheroffice.ec.gc.ca) ** Data from Domtar Inc. website (http://www.domtar.com/en)
VenCan Gold Corporation Cayenne-Chili Property Exploration
12
Figure 4-1 – Property Access
,410000 mE
old ON

VenCan Gold Corporation Cayenne-Chili Property Exploration
13
5.0 Exploration History VenCan Gold Corporation’s property area, a small portion of which was investigated during the current exploration program, encompasses the Woman River iron range which extends across Genoa, Marion, and Heenan townships in the eastern part of the Swayze “greenstone” belt in the District of Sudbury. The iron formation and adjoining rocks have been explored at various times by means of trenching, diamond drilling and limited underground work, in search of iron, base metals, and gold deposits. Iron deposits of significant size have been outlined; lead-zinc mineralization associated with banded iron formation has been located; and some small gold prospects have been drilled. As VenCan’s current property configuration has seen work by various companies in the past over discontinuous land holdings, previous work is summarized below in three areas: 1) East – east of Rush River; 2) Central – between Rush and Woman Rivers; and 3) West – west of Woman River.
5.1 East - East of Rush River A history of the most significant exploration programs conducted on and immediately adjacent to the portion of the VenCan property located east of Rush River is summarized below. The earliest reported work was during the 1908-1910 period by Jefferson Mining Corporation following the discovery of several bodies of high-sulphur iron ore. In 1910 about 4,000 feet of diamond drilling was completed in search of iron ore. At that time, galena, sphalerite and chalcopyrite was encountered in one of the drill holes (Jefferson Showing). As a result, in 1912, an 8-foot deep test pit was dug on the best lead-zinc showing (Claim W.D.717). Additional drilling was completed in 1928 and 1929 to further test the lead-zinc mineralization on claim W.D.717. The property was subsequently acquired by Excelsior Mines Limited with work on the property carried out by Central Sudbury Lead-Zinc Mines Limited. In 1950-1951, 23 diamond drill holes (CS 1-23), totalling 6,300 feet, were completed to test the mineralization on the eastern part of claim W.D. 717. A magnetometer survey was completed covering claims W.D.715-721, W.D.723-727 and W.D.1728 covering a large potion of the current exploration area. Central Sudbury Lead-Zinc Mines Limited subsequently changed their name to Stackpool Mining Company Limited and further to Stackpool Mining and Holding Corporation (Stackpool). In 1957-1958 Stackpool completed 27,747 feet of diamond drilling (50 drill holes) along 14,000 feet of the iron range covered by claims W.D.715-719,721, 723-728 and 1729. In addition electromagnetic surveys were completed over claims W.D.715, 717-719 and 721. Geological and geophysical work, as well as diamond drilling, was conducted in the area in 1972 by Rush Lake Explorations. Reconnaissance work identified prospective VMS targets as well as 4 geophysical targets which were subsequently drilled. The results of the drilling are unknown however, as no assays were submitted for assessment purposes. Texas Gulf Ltd. (Texas Gulf) conducted ground magnetics and HLEM surveys over targets in the Genoa Township in 1976. Texas Gulf subsequently completed 2,085 feet of diamond

VenCan Gold Corporation Cayenne-Chili Property Exploration
14
drilling (5 drillholes – G-62-1 to 5) over targets generated from their geophysical program. The drillholes appear to have been testing the easterly strike extent of the Jessop Showing on the west edge of Northcott Bay, Rush Lake. Hole G-62-1 reportedly intersected 0.46% Cu over 3 feet, while G-62-2 intersected 0.68% Zn and 0.29% Pb over 7.5 feet. Falconbridge Exploration commenced a large program in 1982 focused on gold exploration along the Woman River Iron Formation. Work performed included geological mapping, lithogeochemical surveying (288 samples), mechanical stripping, and magnetometer surveying. Falconbridge found a strong geochem anomaly associated with the Jefferson Deposit. In 1985, Noranda Exploration Ltd. conducted magnetometer and HLEM surveys in the area, and recommended geologic mapping and IP surveys be conducted to delineate future targets. Falconbridge Exploration resumed exploration in the area with an aggressive program in 1992. An airborne geophysical survey was conducted in the area with subsequent ground-based magnetometer, VLF, and HLEM surveys delineating targets. Falconbridge completed 4014 meters of diamond drilling over 9 holes (GA61-01 to 07, MN56-01, and MN66-01) in the area to test geophysical anomalies. Of significance, hole GA61-01 encountered 2.7% Zn over 9.12 meters, and 1.6% Zn over 13.83 meters in separate intervals while hole GA61-07 encountered 1.7% Zn over 17.2 meters. In 1999, an integrated OPAP exploration program was completed over the eastern edge of the property. The program included linecutting (13.3 km), mapping, prospecting (28 grab samples), soil geochemical surveying (38 samples), and HLEM (7.7 km) and magnetometer (13.2 km) surveys over sulphide facies iron formation. A coincident HLEM-magnetic anomaly associated with anomalous Cu and Zn mineralization was identified during the program and recommended for drill testing.
5.2 Central – Area between Rush and Woman Rivers VenCan’s property area between Rush River and Woman River was originally staked by the C. K. Leith interests in 1906 and 1907. The iron formation was explored at this time by limited trenching and sampling in conjunction with the work being completed to the west of the Woman River. The area was subsequently explored by Stackpool Mining who completed a magnetometer survey over the iron formation in 1958-1959. Two magnetic anomalies were outlined over the iron formation which were subsequently checked by 12 short diamond drill holes.
5.3 West – West of Woman River A history of the most significant exploration programs conducted on and immediately adjacent to the portion of the VenCan property in the October Lake to Claim Lake area, west of Woman River, is summarized below. The earliest reported work on the property was during the 1906-1908 period and was related to an evaluation of the iron ore potential of the Woman River Iron Formation. This evaluation was
VenCan Gold Corporation Cayenne-Chili Property Exploration
15
completed by a syndicate consisting of C.K. Leith and C.R. Van Hise of Madison, Wisconsin. The work consisted of reconnaissance dip-needle surveys, regional and detailed geological mapping and 2848 metres (9344 feet) of trenching and pitting within the iron formation. The results of this work outlined low grade iron with values up to 43% iron (Goodwin, 1965). In 1946, Fumerton Mining and Development Company held a number of claims covering the area between Claim Lake and W. S.8. A program of magnetic surveying, prospecting and mapping was completed. Two small syenite occurrences at the centre of claim W.S.8 were reported to contain gold. No significant results were obtained.
During the 1963-65 period bedrock geological mapping was competed by the Ontario Department of Mines (Goodwin, 1965) in Heenan and Marion Townships. In 1975, U.S. Steel International Limited (W.G. Wahl, 1975) completed work to evaluate the iron ore potential of the Woman River Iron Formation within Benton, Heenan, Marion and Mallard Townships. The work consisted of reconnaissance and detailed ground VLF-EM and magnetic surveys, and rock geochemical sampling. The results of this work outlined twelve (12) VLF-EM anomalies. During the 1980-1985 period, Falconbridge Limited carried out a significant amount of work over much of the Woman River Iron Formation in search of base metals and gold. This work consisted of an extensive grid with northeast trending baseline and tie-lines and northwest-southeast trending cross lines over much of the current property (Manchuk, 1985). Geophysical (VLF-EM, magnetometer, HLEM), geological mapping and geochemical (humus) surveys were completed over the grid area. Several areas had follow-up trenching and diamond drilling completed. This work located several gold rich zones in quartz-pyrite veins in the iron formation, quartz-carbonate pyrite veins in the felsic volcanics, sulfide facies iron formation and in shear-related alteration zones (hematization, silicification, carbonatization, pyritization) within felsic volcanics and quartz-feldspar porphyries. In 1987-88 Ressources Halex Inc. (AGEOS, 1987; Zemeroz, 1988) completed 83.5 km of line cutting, 30 km of I.P. surveys and 2307 metres of diamond drilling in six (6) drill holes. This work was completed in the Claim Lake area with no significant results. In 1994-95 Conquest Yellowknife Resources Inc. (Lashbrook, 1995) completed a program of mechanical stripping, trenching, mapping and sampling in the area of Claim Lake. The best results obtained were 0.28 oz/ ton Au over 12 feet and 0.155 oz/ton Au over 9.5 feet. In addition, 630 metres of diamond drilling in seven (7) drill holes were completed with no significant results. In 1997, prospectors A. MacDonnell and R. Lashbrook (Lashbrook, 1997) completed 16 km of line cutting, 4.0 km of I.P. surveys and prospecting. This work was completed in the Claim Lake area. The most significant result was a grab sample of a sheared outcrop of mafic volcanic with pyrite bearing quartz veins which assayed 0.14 oz/ton gold.

VenCan Gold Corporation Cayenne-Chili Property Exploration
16
An exploration program was conducted in the summer of 2005 by GeoVector Management Inc. on behalf of VenCan, but no results were available at the time of writing of this report. 6.0 Geological Setting
6.1 Regional Geology (from Tykajlo et al., 2006) The Swayze greenstone belt is bounded in the north by the Nat River granitoid complex, to the west by the Kapuskasing uplift, to the south by the Ramsay-Algoma granitoid complex and to the east by the Kenogamissi batholith (Figure 6.1-1). The volcanic and sedimentary rocks of the Swayze greenstone belt were previously classified into five stratigraphic groups (Heather and van Breemen 1994; Becker and Benn, 2003). From oldest to youngest, these are the Chester group, the Marion group, the Trailbreaker group, the Swayze group and the Ridout group. Geochronological data for the different groups of the Swayze greenstone belt are not abundant and they are as yet insufficient to tightly constrain the absolute timing and duration of deposition for the different groups. The Chester group (2736 to 2746 Ma; Heather 1998) is the oldest stratigraphic group in the Swayze greenstone belt. This group is composed of mafic volcanic rocks and amphibolites overlain by felsic to intermediate volcanic rocks, intercalated with chemical and clastic sedimentary rocks. The Marion group consists of massive, calc-alkalic intermediate to felsic volcanic flows, ash and crystal tuffs interbedded with lapilli tuff and volcanic breccia. The Marion group is capped by iron formations, the most significant are contained within the Woman River Iron Formation. Ages of ca. 2729 Ma, obtained by U/Pb analyses of a quartz-eye bearing rhyolite breccia, are considered to be close to the beginning of the deposition of this group (Heather et al. 1996; Heather 1998). The lower Trailbreaker group conformably overlies the Marion group and consists of a thick succession of massive, pillowed, Fe- to Mg-tholeiitic mafic volcanic rocks. The upper part of the Trailbreaker group is made up of calcalkalic, intermediate to felsic volcanic rocks, including pyroclastic, volcanoclastic and minor clastic sedimentary facies that are intruded by synvolcanic feldspar +/- quartz porphyry dikes and stocks. A U/Pb zircon age of 2705±2 Ma from a quartz-phyric rhyolite of the Trailbreaker group (Heather and van Breemen 1994) is used as an approximate upper bracket for deposition of the Trailbreaker Group. The Swayze group occupies the largest area in the mapped parts of the Swayze greenstone belt. The basal part of the Swayze group comprises pillowed Mg-tholeiites and basaltic komatiites intercalated with picritic komatiites. This succession exhibits well developed hyaloclastic, variolitic and flow-top breccias. Komatiitic rocks are also common in the Swayze group. The overlying upper part of the Swayze group consists of felsic to intermediate pyroclastic and volcanoclastic rocks, interlayered with clastic sediments. The sedimentary rock mainly consists of intercalated quartz and/or feldspar rich sandstones, siltstones, polymictic conglomerates, wackes and mudstones. The absence of clasts of iron formation or
VenCan Gold Corporation Cayenne-Chili Property Exploration
17
Figure 6.1-1 – General geology Map of Swayze Greenstone Belt
.VenCan Gold CORPORATION
SWayze Greenstone Belt Geology
Geology LEtgmd _ C.fbon;ot~. - .Fulk ;"11115"'. suH @
_ Ca,bonat~. _ "IkaNe Intruslv. suM. (1 .0 to 1 2 0;;0)
c=J Coaru c'astlc metaudlmenFary rocks
--CJ -
OIortte· mOf\lQnh -1I.ancodiorlle suite
Felsic 10 Intermed~. mortavolunl!; rocks
FoWallld tonatttil sunil
Onelssic "'nalde sude
Marie and ".,amaro< Int ruslv" ,ocks
Maroc and uft,amafoc rink s
Marle'o intermediate rrl8tavolcank rock s
Marie 10 u!t.amafil: mlll ..... olcanic roch
lIIa$!jve \I,anodlorilelo 1I,,,nile
M9landimenl¥y roch
IIIlgmatlllld supr.o'Cf\lslal rocks
I.on formations
D1k8'
Faults
Regional Geology of the
Swayze Greenstone Belt
VenCan Gold Corporation Cayenne-Chili Property Exploration
18
granitoids in the conglomerates of the Swayze group distinguishes them from the conglomerates in the overlying Ridout group (see below). Ages determined for the Swayze group are 2697 Ma and 2695 Ma (Heather 1998) for felsic to intermediate volcanic rocks at the top of the Swayze group. The Ridout group is the youngest stratigraphic group recognized by previous workers. Predominantly, it is made up of greywackes and conglomerates with minor amounts of feldspar quartz porphyry dikes and sheets. A maximum depositional age of 2690 Ma for the Ridout group is based on the youngest ages obtained from zircons from a quartz feldspar-rich sandstone (Heather 1998). Two major tectonic events have been recognized in the Swayze Greenstone Belt. An earlier deformation event generated north-south trending folds. The second deformation event generated east-west trending folds. No large fault zones have been mapped in the Swayze greenstone belt, however, high-strain zones have been mapped by Heather et al. (1996). While most of these high-strain zones are only of local significance, the Ridout high-strain zone south of the Rice Lake batholith extends into the Abitibi greenstone belt and may be is the western extension of the Larder-Cadillac deformation zone (Milne 1972; Hall 2001; Heather et al. 1995). An east-striking shear zone to the north of the Kenogamissi batholith may correspond to the Porcupine-Destor deformation zone in the Abitibi belt (Milne,1972).
6.2 Local Geology
6.2.1 Map Physiography Grid mapping was conducted at a scale of 1:2500 over the Genoa Grid by the author (C. Scherba) on an intermittent basis between June 18th and July 20th, 2006. The grid comprised 40 lines of variable length, spaced at 100 meter intervals; outside dimensions were roughly 1.2 to 1.8 km north-south, and 4 km east-west. Line azimuth was approximately 170/350 +/- 5 degrees. Extensive vegetative cover coupled with poor outcrop exposure (typically less than 5%), resulted in traverses undulating back and forth across cut grid lines in search of outcrop. The grid area was dominated topographically by an east-north-east trending ridgeline consisting predominantly of banded iron formation that was roughly coincident with the grid baseline. This ridgeline rises between 25 to 30 metres above flat low-lying swamps and lakes to the north, 10 to 15 metres above low rolling glacially sculpted hills to the south, and 20 to 25 metres above Oldscamp Lake to the south-west.
6.2.2 Map Methodology The Genoa Grid was lithostratigraphically and structurally bedrock mapped at a scale of 1:2500, and was augmented by selected drill hole data, geophysical interpretation of ground based IP/resistivity, magnetometer and gravity surveys, and AeroTEM helicopter-borne EM/magnetometer survey data. Lithogeochemical data provided by Falconbridge was utilized in conjunction with U-Pb geochemical
18

VenCan Gold Corporation Cayenne-Chili Property Exploration
19
work conducted by Heather and Shore (1999) to elucidate the litho-stratigraphic associations throughout the map area. Geologic units identified on the accompanying geology map are based upon those utilized by Heather and Shore (1999) in their 1:50000 geological maps.
6.2.3 Lithology
6.2.3.1 Strata Lake Formation - MSf Felsic volcanics of the Strata Lake Formation of the Marion Group are the lowermost stratigraphic unit in the map area. Compositionally, these rocks are predominantly rhyolitic to dacitic, monolitihic lapilli tuff and volcanic breccias with phenocrysts of quartz and/or feldspar (Photo 6.2.3.1-1). Outcrops tend to weather white or buff with some localized areas weathering light pink. Pink outcrops usually have a gneissose texture with variable amounts of quartz, feldspar, and black mica, and are believed to be metamorphosed felsic flows
incorporating sediments. Sericitic alteration is pervasive throughout the felsic volcanics, with variably chloritized zones in proximity to the overlying iron formation. Locally sulphidized breccia zones are also prevalent in association with the iron formation.
6.2.3.2 Woman River Iron Formation – WMif, WMifsi, WMifsu Overlying the felsic volcanics is the Woman River Formation of the Marion Group.
Compositionally, rocks of this formation can be subdivided into three units; sedimentary rocks (WMif), oxide facies iron formation (WMifsi), and sulphide facies iron formation (MWifsu). Sedimentary rocks consist of fine- to medium-grained wacke, and siliceous siltstone and argillite with minor banded chert and minor amounts of one or more of magnetite, hematite, jasper, siderite, pyrite, and pyrrhotite. Oxide
facies iron formation rocks consist of iron-rich sedimentary rocks composed of banded chert and magnetite which may contain one or more of hematite (Photo 6.2.3.2-1), siderite, pyrite, pyrrhotite,
Photo 6.2.3.1-1 – Feldspar lapilli tuff.
Photo 6.2.3.2-1 – Oxide facies iron formation with banded chert, magnetite, and hematite.
Photo 6.2.3.2-2 – Sulphide facies iron formation with >75% pyrite
and pyrrhotite; Channel #7.
VenCan Gold Corporation Cayenne-Chili Property Exploration
20
carbonaceous chert, and/or ferrigenous siliceous argillite. Sulphide facies iron formation rocks (Photo 6.2.3.2-2) consist of massive sulphide-bearing iron formation with greater than 50% pyrite and/or pyrrhotite interbedded within fine- to medium-grained wacke, siliceous siltstone, and/or argillite, and may contain rare sphalerite, galena, chalcopyrite, and/or bornite. Goodwin (1965) and Manchuk (1982) have classified the Woman River Iron Formation as Algoma-type iron formation which is classically recognized as iron formation interbedded with mafic to felsic volcanics and volcaniclastic greywacke and shales in Archean greenstone belts (Cannon et al., 1986).
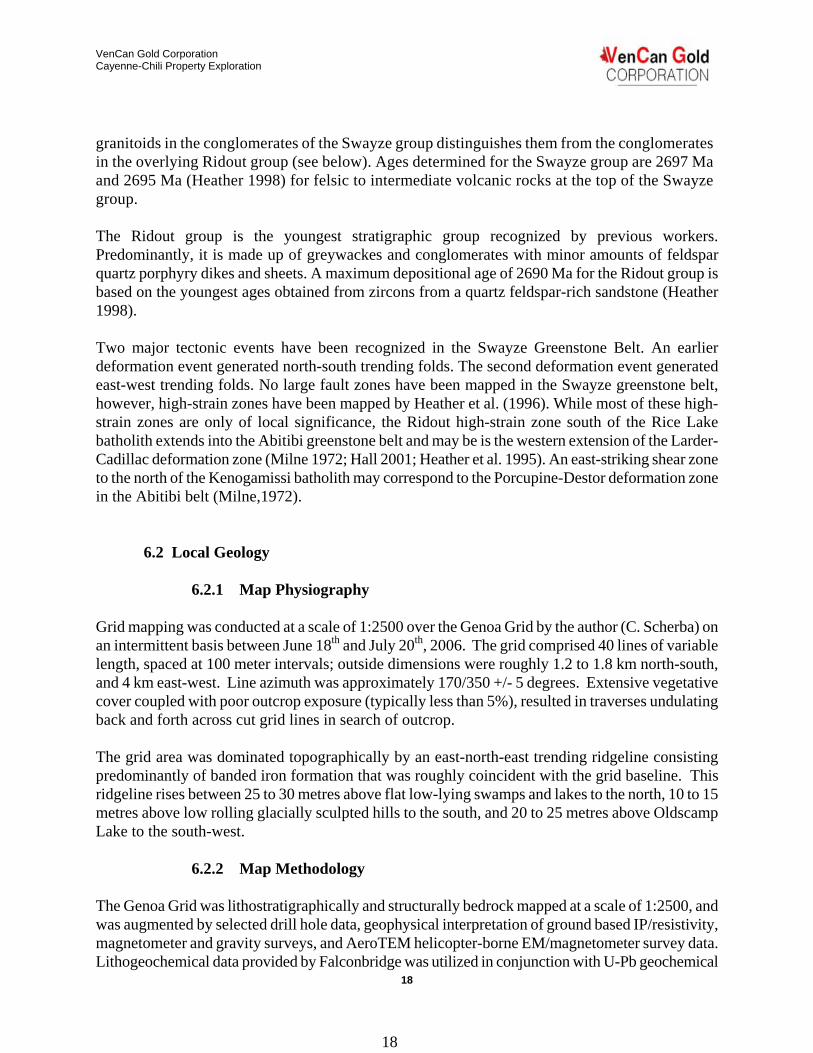
6.2.3.3 October Lake Formation – TOmv Overlying the Woman River Formation are mafic volcanics of the October Lake Formation of the Trailbreaker Group. Compositionally these rocks consist of massive and pillowed tholeiitic basalt flows (Photo 6.2.3.3-1), pillow breccias, medium- to coarse-grained flows/sills, and finely laminated tuffaceous beds. These rocks are typically light to dark green and exhibit very little alteration.
6.2.3.4 Kenogamissi Granitoid Complex – KBbt, KBbtd
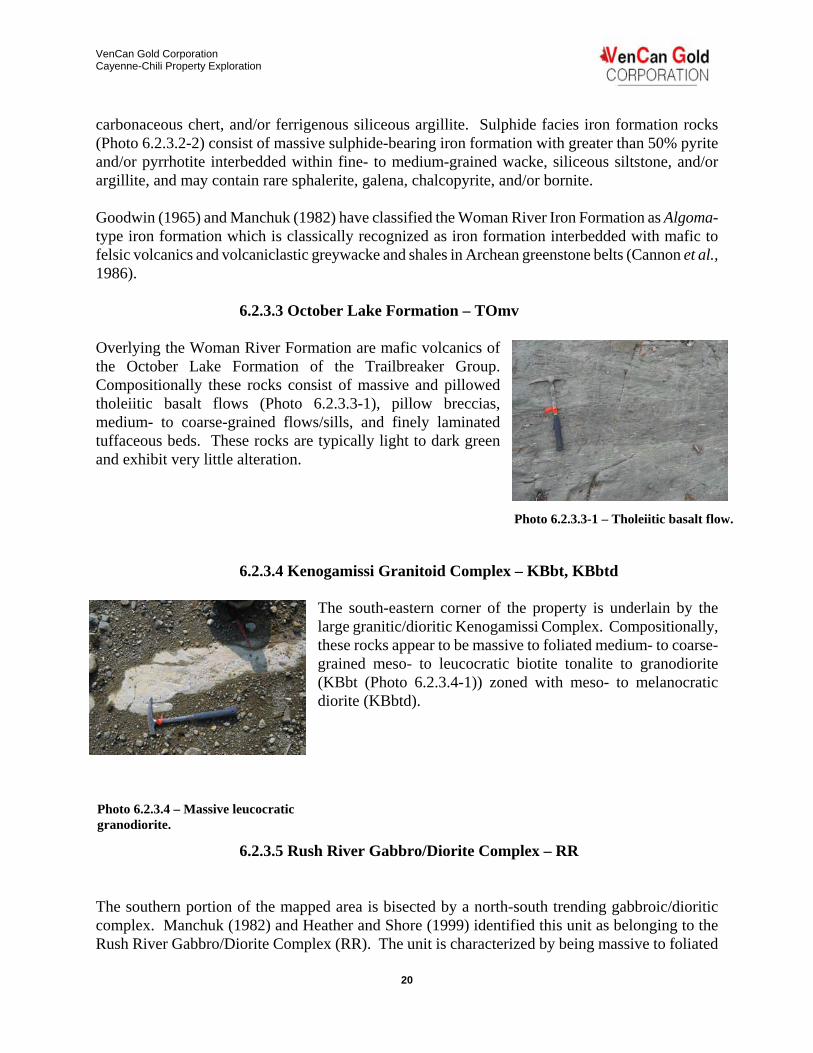
The south-eastern corner of the property is underlain by the large granitic/dioritic Kenogamissi Complex. Compositionally, these rocks appear to be massive to foliated medium- to coarse-grained meso- to leucocratic biotite tonalite to granodiorite (KBbt (Photo 6.2.3.4-1)) zoned with meso- to melanocratic diorite (KBbtd).
6.2.3.5 Rush River Gabbro/Diorite Complex – RR The southern portion of the mapped area is bisected by a north-south trending gabbroic/dioritic complex. Manchuk (1982) and Heather and Shore (1999) identified this unit as belonging to the Rush River Gabbro/Diorite Complex (RR). The unit is characterized by being massive to foliated
Photo 6.2.3.3-1 – Tholeiitic basalt flow.
Photo 6.2.3.4 – Massive leucocratic granodiorite.
VenCan Gold Corporation Cayenne-Chili Property Exploration
21
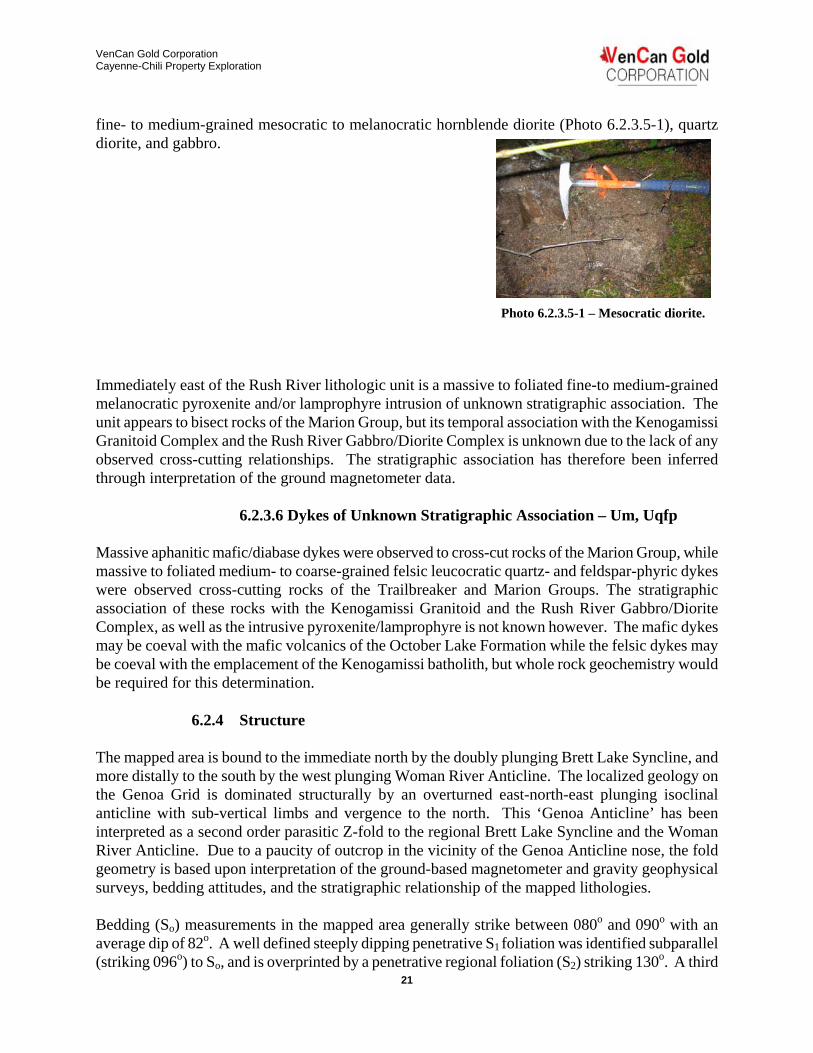
fine- to medium-grained mesocratic to melanocratic hornblende diorite (Photo 6.2.3.5-1), quartz diorite, and gabbro.
Immediately east of the Rush River lithologic unit is a massive to foliated fine-to medium-grained melanocratic pyroxenite and/or lamprophyre intrusion of unknown stratigraphic association. The unit appears to bisect rocks of the Marion Group, but its temporal association with the Kenogamissi Granitoid Complex and the Rush River Gabbro/Diorite Complex is unknown due to the lack of any observed cross-cutting relationships. The stratigraphic association has therefore been inferred through interpretation of the ground magnetometer data.
6.2.3.6 Dykes of Unknown Stratigraphic Association – Um, Uqfp Massive aphanitic mafic/diabase dykes were observed to cross-cut rocks of the Marion Group, while massive to foliated medium- to coarse-grained felsic leucocratic quartz- and feldspar-phyric dykes were observed cross-cutting rocks of the Trailbreaker and Marion Groups. The stratigraphic association of these rocks with the Kenogamissi Granitoid and the Rush River Gabbro/Diorite Complex, as well as the intrusive pyroxenite/lamprophyre is not known however. The mafic dykes may be coeval with the mafic volcanics of the October Lake Formation while the felsic dykes may be coeval with the emplacement of the Kenogamissi batholith, but whole rock geochemistry would be required for this determination.
6.2.4 Structure The mapped area is bound to the immediate north by the doubly plunging Brett Lake Syncline, and more distally to the south by the west plunging Woman River Anticline. The localized geology on the Genoa Grid is dominated structurally by an overturned east-north-east plunging isoclinal anticline with sub-vertical limbs and vergence to the north. This ‘Genoa Anticline’ has been interpreted as a second order parasitic Z-fold to the regional Brett Lake Syncline and the Woman River Anticline. Due to a paucity of outcrop in the vicinity of the Genoa Anticline nose, the fold geometry is based upon interpretation of the ground-based magnetometer and gravity geophysical surveys, bedding attitudes, and the stratigraphic relationship of the mapped lithologies. Bedding (So) measurements in the mapped area generally strike between 080o and 090o with an average dip of 82o. A well defined steeply dipping penetrative S1 foliation was identified subparallel (striking 096o) to So, and is overprinted by a penetrative regional foliation (S2) striking 130o. A third
Photo 6.2.3.5-1 – Mesocratic diorite.
VenCan Gold Corporation Cayenne-Chili Property Exploration
22
foliation (S?) striking north-south was identified during the mapping program, but its generation could not be discerned. Joint analysis indicates a preponderance of north-south joints with subsidiary joints striking 030o and 060o. Identifiable faults are transverse in nature, have a northwest strike, and a subvertical dip. Mineral lineations in the mapped area were predominantly of sericite and were steeply dipping on an azimuth between 245o and 260o.
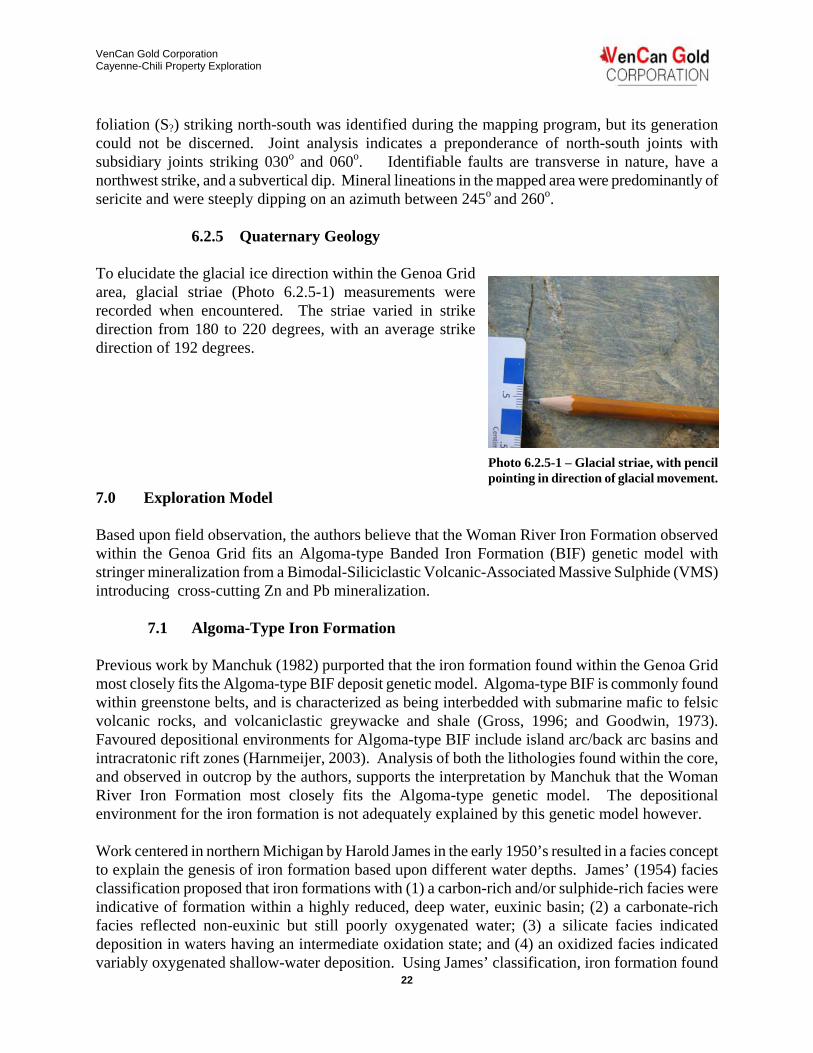
6.2.5 Quaternary Geology To elucidate the glacial ice direction within the Genoa Grid area, glacial striae (Photo 6.2.5-1) measurements were recorded when encountered. The striae varied in strike direction from 180 to 220 degrees, with an average strike direction of 192 degrees. 7.0 Exploration Model Based upon field observation, the authors believe that the Woman River Iron Formation observed within the Genoa Grid fits an Algoma-type Banded Iron Formation (BIF) genetic model with stringer mineralization from a Bimodal-Siliciclastic Volcanic-Associated Massive Sulphide (VMS) introducing cross-cutting Zn and Pb mineralization.
7.1 Algoma-Type Iron Formation Previous work by Manchuk (1982) purported that the iron formation found within the Genoa Grid most closely fits the Algoma-type BIF deposit genetic model. Algoma-type BIF is commonly found within greenstone belts, and is characterized as being interbedded with submarine mafic to felsic volcanic rocks, and volcaniclastic greywacke and shale (Gross, 1996; and Goodwin, 1973). Favoured depositional environments for Algoma-type BIF include island arc/back arc basins and intracratonic rift zones (Harnmeijer, 2003). Analysis of both the lithologies found within the core, and observed in outcrop by the authors, supports the interpretation by Manchuk that the Woman River Iron Formation most closely fits the Algoma-type genetic model. The depositional environment for the iron formation is not adequately explained by this genetic model however. Work centered in northern Michigan by Harold James in the early 1950’s resulted in a facies concept to explain the genesis of iron formation based upon different water depths. James’ (1954) facies classification proposed that iron formations with (1) a carbon-rich and/or sulphide-rich facies were indicative of formation within a highly reduced, deep water, euxinic basin; (2) a carbonate-rich facies reflected non-euxinic but still poorly oxygenated water; (3) a silicate facies indicated deposition in waters having an intermediate oxidation state; and (4) an oxidized facies indicated variably oxygenated shallow-water deposition. Using James’ classification, iron formation found
Photo 6.2.5-1 – Glacial striae, with pencil pointing in direction of glacial movement.

VenCan Gold Corporation Cayenne-Chili Property Exploration
23
within the Genoa Grid has been classified as either oxide facies or sulphide facies. Oxide facies iron formation rocks consist of iron-rich sedimentary rocks composed of banded chert and magnetite which may contain one or more of hematite, siderite, pyrite, pyrrhotite, carbonaceous chert, and/or ferrigenous siliceous argillite. Sulphide facies iron formation rocks consist of massive sulphide-bearing iron formation with greater than 50% pyrite and/or pyrrhotite interbedded within fine- to medium-grained wacke, siliceous siltstone, and/or argillite, and may contain rare sphalerite, galena, chalcopyrite, and or bornite. Generally, sulphide facies iron formation is found basally in the Woman River Formation, while oxide facies iron formation is found higher in the stratigraphic sequence. Lateral variation of facies is also evident in the map area as sulphide and oxide facies grade in and out at the base of the Woman River Formation. The variation of iron formation facies, both laterally and vertically, indicate a changing depositional environment with sulphide facies iron formation being deposited in relatively deep, anoxic waters, and oxide facies iron formation being deposited in relatively shallow, aerated waters according to James’ facies classification. As the accompanying geology map illustrates however, sulphide and oxide facies iron formation within the Genoa Grid are found grading immediately adjacent to one another which indicates deposition at drastically different water depths is unlikely. A locally reducing environment in proximity to a volcanic exhalation would account for the facies distribution observed within the Genoa Grid however. An analysis of rare-earth element profiles and Nd and Fe isotopes found within BIFs , indicates the source of iron was the result of deep ocean hydrothermal activity admixed with sea water (Klein, 2005; Polat and Frei, 2005; Krapex et. al., 2003). Work by Morris (1993) suggests that the rhythmic layering of chert- and iron-rich bands is due to fluctuations in two major oceanic supply systems: 1) silica saturated surface currents, generating chert layers; and 2) Fe-enriched hydrothermal convective upwelling from a mid-ocean ridge or hot spot activity, depositing the iron dominated layers during episodic volcanic activity. That the silica and iron were decoupled during banded iron formation deposition is supported by Ge/Si ratios within BIF chert layers which indicate weathering of a continental landmass (Hamade et. al., 2003). The episodic influx of admixed sediments of the Woman River Formation between BIF is most likely due to turbiditic influx of shelf-derived sediments.
7.2 Bimodal-Siliciclastic Volcanic-Associated Massive Sulphide The authors believe that the Woman River Iron Formation observed within the Genoa Grid fits an Algoma-type genetic model, but do not believe this model adequately explains cross-cutting Zn- and Pb-rich zones found within both the iron formation and the underlying felsic volcanics. Stringer mineralization from a Bimodal-Siliciclastic Volcanic-Associated Massive Sulphide (VMS) is proposed as the genetic model to explain the cross-cutting Zn and Pb mineralization. Work by Falconbridge Limited in the 1980’s interpreted Zn-Pb mineralization at the Jefferson ‘deposit’ as associated with cross-cutting fractures and so not strictly of the VMS type. The authors support this interpretation based on field observations, however, it is believed that the known mineralization may be stringer type mineralization that indicates that potential exists to discover a proximal VMS source on VenCan’s property.
VenCan Gold Corporation Cayenne-Chili Property Exploration
24
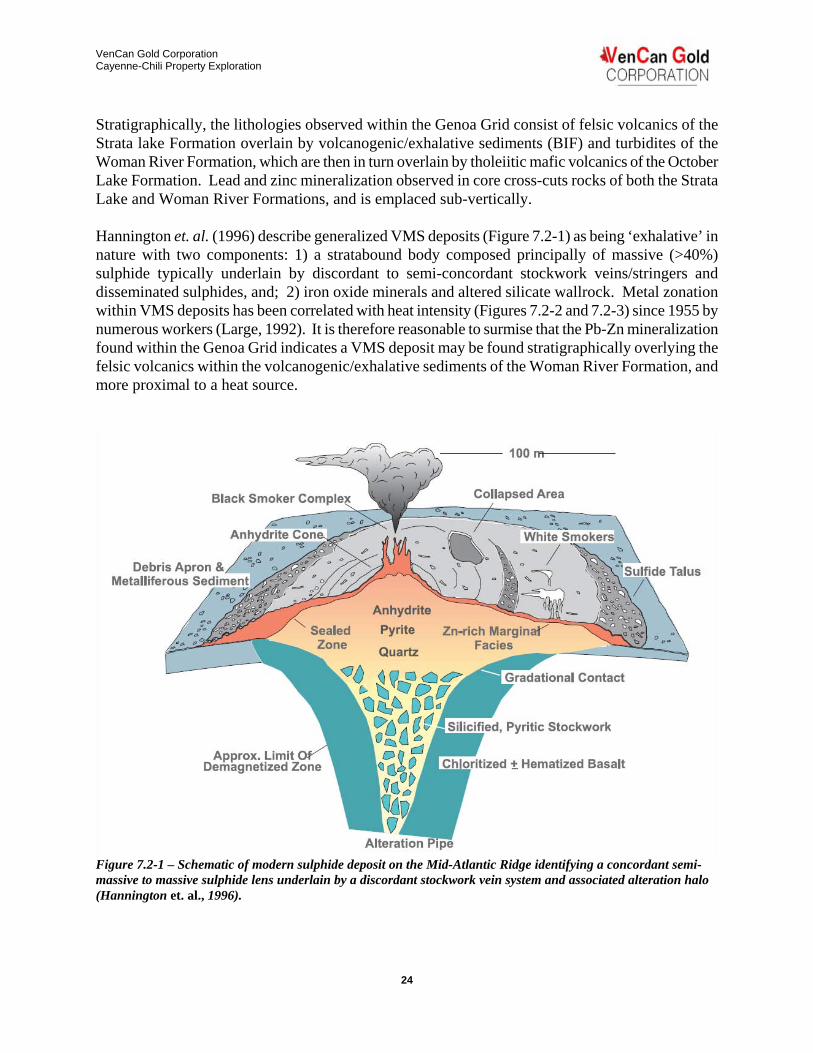
Stratigraphically, the lithologies observed within the Genoa Grid consist of felsic volcanics of the Strata lake Formation overlain by volcanogenic/exhalative sediments (BIF) and turbidites of the Woman River Formation, which are then in turn overlain by tholeiitic mafic volcanics of the October Lake Formation. Lead and zinc mineralization observed in core cross-cuts rocks of both the Strata Lake and Woman River Formations, and is emplaced sub-vertically. Hannington et. al. (1996) describe generalized VMS deposits (Figure 7.2-1) as being ‘exhalative’ in nature with two components: 1) a stratabound body composed principally of massive (>40%) sulphide typically underlain by discordant to semi-concordant stockwork veins/stringers and disseminated sulphides, and; 2) iron oxide minerals and altered silicate wallrock. Metal zonation within VMS deposits has been correlated with heat intensity (Figures 7.2-2 and 7.2-3) since 1955 by numerous workers (Large, 1992). It is therefore reasonable to surmise that the Pb-Zn mineralization found within the Genoa Grid indicates a VMS deposit may be found stratigraphically overlying the felsic volcanics within the volcanogenic/exhalative sediments of the Woman River Formation, and more proximal to a heat source.
Figure 7.2-1 – Schematic of modern sulphide deposit on the Mid-Atlantic Ridge identifying a concordant semi-massive to massive sulphide lens underlain by a discordant stockwork vein system and associated alteration halo (Hannington et. al., 1996).
VenCan Gold Corporation Cayenne-Chili Property Exploration
25
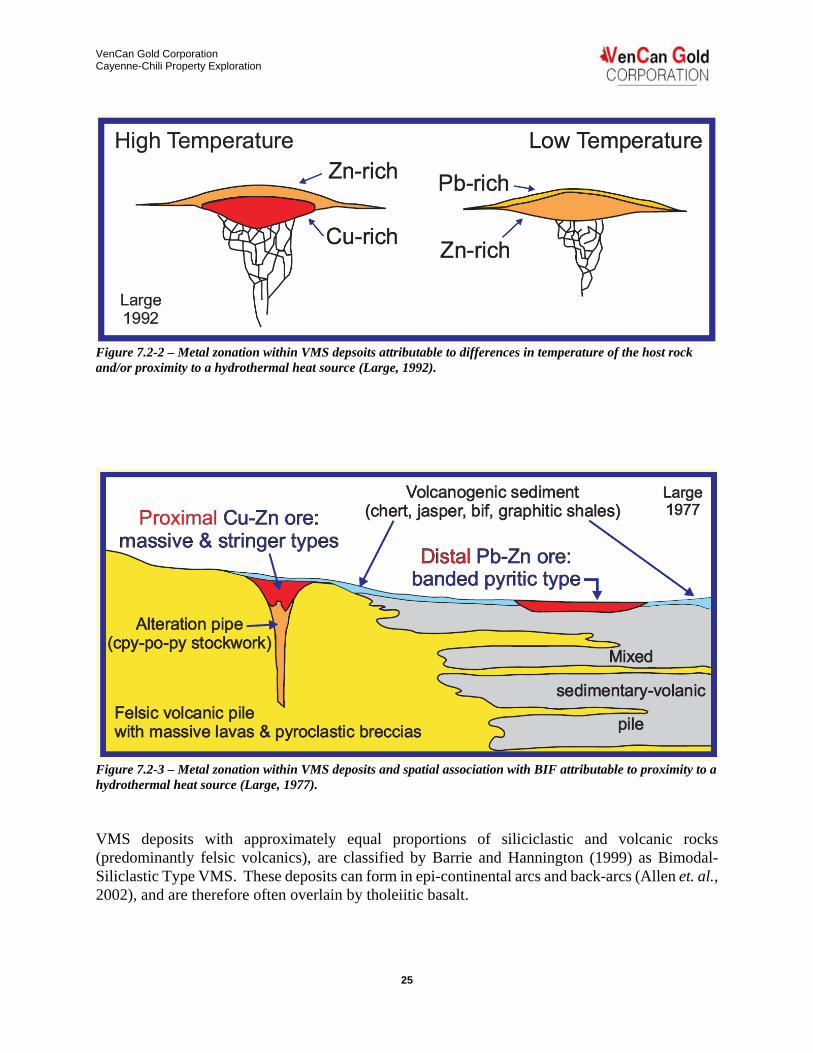
Figure 7.2-2 – Metal zonation within VMS depsoits attributable to differences in temperature of the host rock and/or proximity to a hydrothermal heat source (Large, 1992).
Figure 7.2-3 – Metal zonation within VMS deposits and spatial association with BIF attributable to proximity to a hydrothermal heat source (Large, 1977). VMS deposits with approximately equal proportions of siliciclastic and volcanic rocks (predominantly felsic volcanics), are classified by Barrie and Hannington (1999) as Bimodal-Siliclastic Type VMS. These deposits can form in epi-continental arcs and back-arcs (Allen et. al., 2002), and are therefore often overlain by tholeiitic basalt.

VenCan Gold Corporation Cayenne-Chili Property Exploration
26
The stratigraphic association of felsic volcanics overlain by volcanogenic exhalative sediments, which are in turn overlain by tholeiitic basalt and mafic flows, coupled with the presence of Pb-Zn veins and/or stringers within the Genoa Grid indicates that potential exists to discover a proximal Bimodal-SiliciclasticVMS source on VenCan’s property. 8.0 Mineralization The Woman River Iron Formation consists of two distinct facies: 1) oxide facies iron formation with iron-rich sedimentary rocks composed of banded chert and magnetite which may contain one or more of hematite, siderite, pyrite, pyrrhotite, carbonaceous chert, and/or ferrigenous siliceous argillite; and 2) sulphide facies iron formation with greater than 50% pyrite and/or pyrrhotite interbedded within fine- to medium-grained wacke, siliceous siltstone, and/or argillite, and which may contain rare sphalerite, galena, chalcopyrite, and or bornite. Lead and zinc mineralization observed in core cross-cuts rocks of both the Strata Lake and Woman River Formations, is emplaced sub-vertically, and is interpreted to be due to stringer mineralization from a Bimodal-Siliciclastic Volcanic-Associated Massive Sulphide.
VenCan Gold Corporation Cayenne-Chili Property Exploration
27
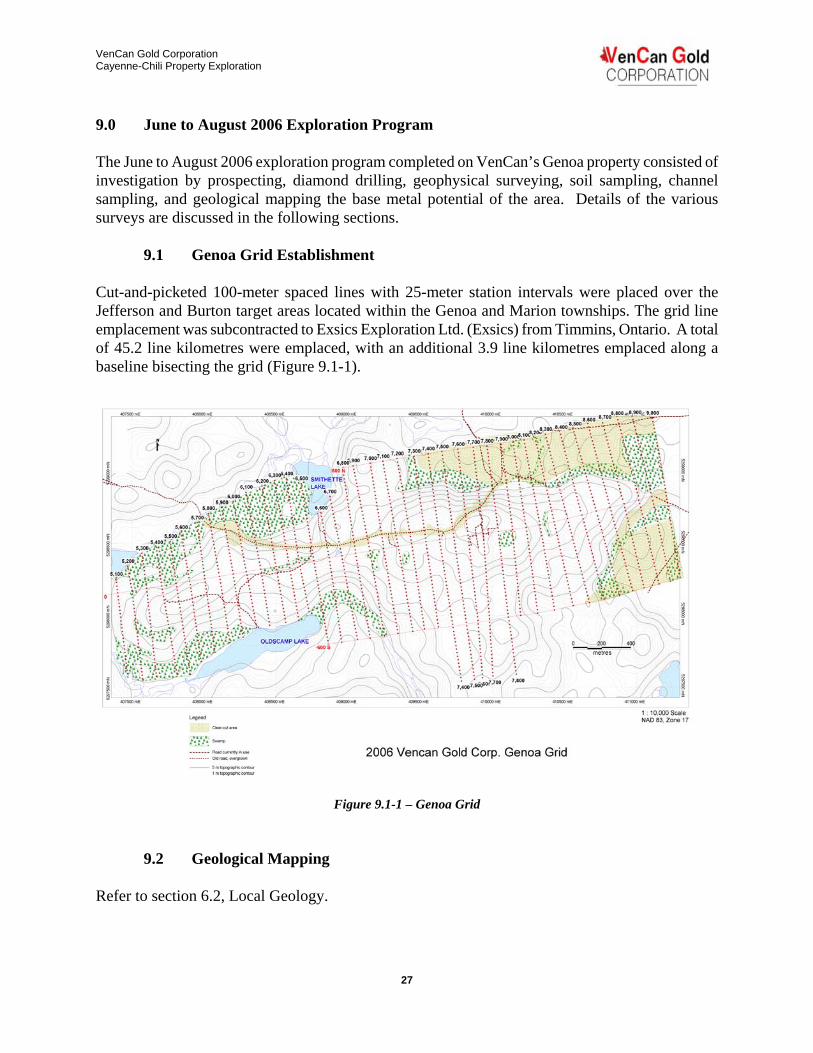
9.0 June to August 2006 Exploration Program The June to August 2006 exploration program completed on VenCan’s Genoa property consisted of investigation by prospecting, diamond drilling, geophysical surveying, soil sampling, channel sampling, and geological mapping the base metal potential of the area. Details of the various surveys are discussed in the following sections.
9.1 Genoa Grid Establishment Cut-and-picketed 100-meter spaced lines with 25-meter station intervals were placed over the Jefferson and Burton target areas located within the Genoa and Marion townships. The grid line emplacement was subcontracted to Exsics Exploration Ltd. (Exsics) from Timmins, Ontario. A total of 45.2 line kilometres were emplaced, with an additional 3.9 line kilometres emplaced along a baseline bisecting the grid (Figure 9.1-1).
Figure 9.1-1 – Genoa Grid
9.2 Geological Mapping Refer to section 6.2, Local Geology.

VenCan Gold Corporation Cayenne-Chili Property Exploration
28
Figure 9.2-1: Genoa Grid Geologic Map

VenCan Gold Corporation Cayenne-Chili Property Exploration
29
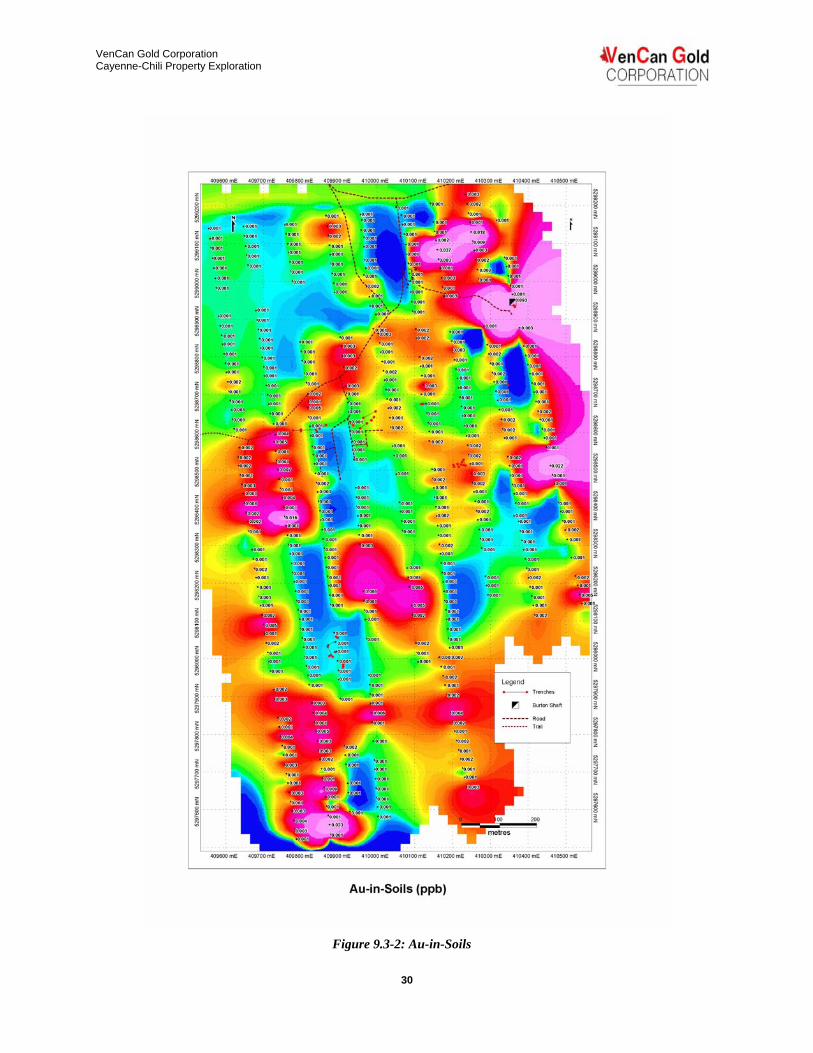
9.3 Soil Geochemical survey As part of the current exploration program soil sampling was completed over selective portions of the grid coverage. A summary of the analytical results along with sample descriptions is presented in Appendix B. The soil samples were collected from the “B” horizon along 100 meter spaced grid lines at 25 meter station intervals. Figure 9.3-1 depicts the survey coverage area.
Figure 9.3-1 Genoa Grid Soil Sample Coverage
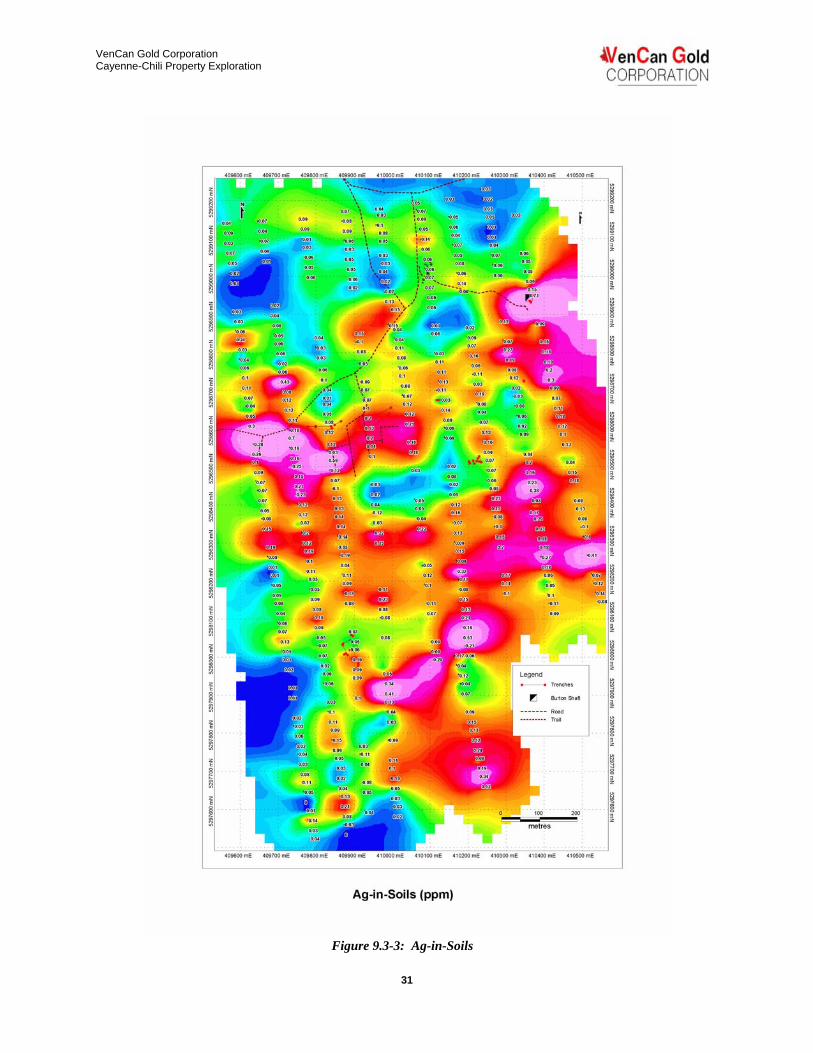
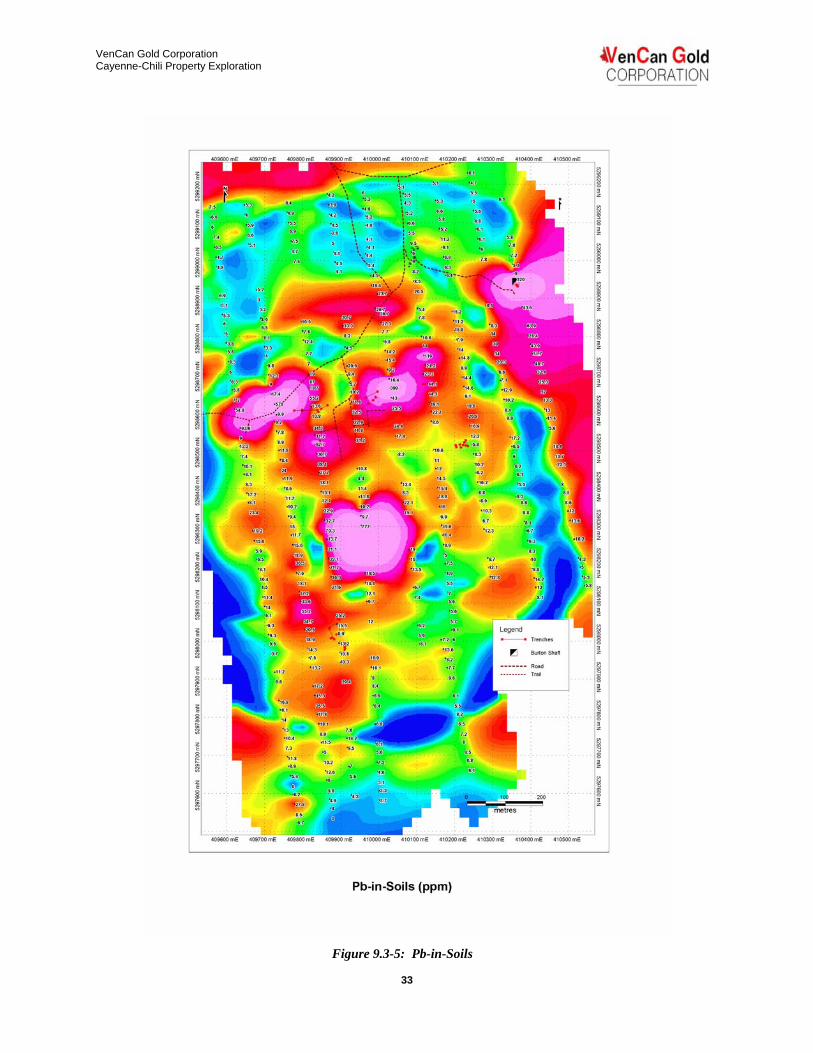
Analytical work was completed by ALS Chemex in Sudbury Ontario, Canada. All the samples were analyzed for 50 element aqua regia ICP-MS, with Au analysis by 30g fire assay ICP-AES finish. Assay results, assay certificates and analytical procedures are presented in the accompanying Appendices. The grid location and survey coverage is presented in figure 9.3-1 with the correlation plots and ICP analytical results presented in the accompanying sketches (Appendix B). Figures 9.3-2 to 9.3-6 display the raw, colour plotted analytical results for Au, Ag, Cu, Pb and Zn over a gridded percentrank background. The soil sampling was highly successful in identifying mineralized outcrops at the Jefferson, the Burton, and along the Woman River Iron Formation. Additionally, anomalous Au, Ag, Cu, Pb, and Zn-in-soils anomalies were found to correlate with massive sulphide occurrences discovered while
VenCan Gold Corporation Cayenne-Chili Property Exploration
30
Figure 9.3-2: Au-in-Soils
-". .. .,.
-" . . ". -". '.", -" .
. ". . " . .... '
..... . ... ,
.... ' ."' .... ' ,", -".
.,,, .
. .. ." . . " .
Au-in-Soils (ppb)
.VenCan GOld CORPORATION
VenCan Gold Corporation Cayenne-Chili Property Exploration
31
Figure 9.3-3: Ag-in-Soils
Ag-in-Soils (ppm)
.VenCan GOld CORPORATION

VenCan Gold Corporation Cayenne-Chili Property Exploration
32
Figure 9.3-4: Cu-in-Soils
Cu-in-Soils (ppm)
.VenCan GOld CORPORATION
VenCan Gold Corporation Cayenne-Chili Property Exploration
33 Figure 9.3-5: Pb-in-Soils
Pb·in-Soils (ppm)
.VenCan GOld CORPORATION

VenCan Gold Corporation Cayenne-Chili Property Exploration
34
Figure 9.3-6: Zn-in-Soils
." " ,
. , ' " . " ." .. "" ."
." ., "
."
'" " ." ." ."
'" " "
I ~I ~ Zn-in-Soils (ppm)
." " .. " .• ... ~.
' " . .,
."
." .. ." ."
., . ."
·" '" '1' ." ." '"
--
." ." ."
'" ."
.-II!] _ ..... --
.VenCan GOld CORPORATION
."

VenCan Gold Corporation Cayenne-Chili Property Exploration
35
prospecting, as well as identifying a highly prospective area to the south of the Burton Shaft with no outcrop. An extensive QA/QC program was followed throughout the program consisting of the insertion of standards, blanks and duplicates, the parameters and results of which will be presented in a later section of this report.
9.4 2006 Ground Geophysics The geophysical follow-up approach at Genoa was predicated on limited physical rock property testing on hand samples from the Jefferson Zn-Pb-Cu Occurrence that indicated mineralization was non-magnetic and non-conductive. The occurrence is embedded in a thick sulphide facies iron formation of the Woman River Iron Formation (WRIF) that is highly magnetic and conductive. The resulting magnetic contrast is dramatic and could allow the occurrence to be directly detectable with detailed magnetic surveys if it is of economically significant size. Electromagnetic (EM) anomalies would not be expected from a Jefferson-like deposit but perturbations in the EM continuity of the WRIF would be useful indicators of the possible presence of a deposit embedded within the WRIF. Similarly, the excess mass of a dense, economically sized Zn-Pb-Cu occurrence embedded within the WRIF would be expected to produce a recognizable gravity anomaly along the trend of the WRIF. The chargeability (IP) properties of the Jefferson Occurrence are expected to be moderate and perhaps not uniquely distinguishable from the high chargeabilities that can be expected from the WRIF. The geophysical target properties for Jefferson-type deposits of economic scale are therefore assumed to be correlations of:
• Local magnetic lows within the WRIF, or indistinct magnetic signatures in other stratigraphy • Non-conductive • Residual gravity highs • Chargeability highs
The objectives of the summer 2006 geophysical program were to:
• Map the internal complexity of the highly magnetic WRIF in the vicinity of, and along strike of the non-magnetic Jefferson Occurrence with magnetic surveying, and attempt to map the extent of the occurrence and possibly similar occurrences within the WRIF,
• Characterize and map possible density anomalies related to the Jefferson and Burton Occurrences, and locate similar or larger anomalies over the grid area with gravity surveying, completed by MWH Geo-Surveys Inc. (MWH) of Vernon BC. Both contractors completed the work under contract to VenCan Gold Corporation.
Each component of the 2006 exploration work program is discussed in the following sections.

VenCan Gold Corporation Cayenne-Chili Property Exploration
36
9.4.1 IP/resistivity Survey IP/resistivity surveying was completed by Exsics on 23 selected lines covering the Genoa Grid (Figures 9.4.1-1 and 9.4.1-2; maps in pocket) between June 29 and July 17, 2006. The survey was completed to test for chargeable sources (disseminated sulphides) associated with possible Zn-Pb-Cu mineralization similar to Jefferson Showing, and within the Woman River Iron Formation and adjacent mafic and felsic volcanic rocks. Exsics used a GDD 3600W transmitter, and Elrec Pro receiver, to acquire approximately 29 line kilometres of IP and resistivity data in a standard pole-dipole array with dipole “a” spacing of 25m and “n” levels 1 through 8. Data was acquired in the time domain with chargeability measurement window starting at 240 ms and extending to 1840 ms after transmitter current shut-off. The transmitter pulse was a 50% duty cycle alternating square wave with 2 sec on and 2 sec off duration. Readings were recorded at 25 metre station intervals along each surveyed line. Apparent resistivity and chargeability pseudosections were prepared by GeoVector (see Sections in pocket) and further survey instrument specifications with names of field personnel are documented in a survey logistics report (Appendix A) prepared by Exsics. The program suite was used to calculate an unconstrained, smooth model depth section of a possible resistivity and chargeability distribution with depth that explains the field data. The algorithms assume that subsurface anomalous features are 2D (i.e. of infinite strike length and orthogonal to the survey line). In practice, features will be modeled less accurately as the strike length, and angle with survey line, of anomalous features deviates from the 2D assumption. Each of the model sections is presented (see Sections in pocket) as a series of stacked sections at 1:2500 scale showing six panels of colour-contoured data. The top three panels illustrate the apparent resistivity pseudosection, the synthetic pseudosection predicted from the depth section model, and the resistivity depth section model. The bottom three panels show the same series of sections for apparent chargeability. Values of chargeability and resistivity derived from inversion model results at an arbitrary depth of 75 metres below surface, were extracted from each relevant model section and plotted as depth slice plans at 1:2500 scale (see maps in pocket). Most coincident high-chargeability/low resistivity anomalies are due to formational pyrite/pyrhotite/magnetite of the WRIF. Three zones of high chargeability stand out as follows:
• Coincident with the Jefferson Occurrence and residual gravity anomaly. • Within zones of structural or stratigraphic thickening proximal to the VenCan Occurrence
and drill holes VG-06-16 and VG-06-17 • Within zones of structural or stratigraphic thickening in the GV Target area
Except for the Jefferson anomaly, these high amplitude chargeability anomalies are not directly associated with higher resistivity and in some cases appear to cross-cut the dominant magnetic trends. They are of priority exploration interest as they may represent possible Zn-Pb-Cu zones or gold bearing, disseminated sulphides.

VenCan Gold Corporation Cayenne-Chili Property Exploration
37
.VenCan Gold CORPORATION

VenCan Gold Corporation Cayenne-Chili Property Exploration
38
Figure 9.4.1-1: Genoa Grid – Total Apparent Chargeability
.VenCan GOld CORPORATION
". .~
~ I "
v , C- .. "
"I "
, =
.,
/., '.
--, ,
-I I I
'!:J ' ,
, I " ' I \ r
t:J
\ \. \
I ,
, \ \' 'fJ-
\ \ -
I .'
\
, \ \ I'
i
I i
( \ ' \ \ .\
I I 0\-
i I
,1.1 ' \ \, ~.
i '.
i, \ I \ \ \ \
" ..
, I , \" \ '\ 1 ' ,'\Z'"
\ "\
" •
I I
' ' I I " \ I j M.~,
I I I ' \
i_ I
-. I 'I I' I \
I \.
\ I
~'~ \ I
' I
I I
I " \
' '. II _ 1 . ,
- •
' I \ ~
, " - ,.
."C ... ~01
• • , . ' ... ~~".
., "
I -'II!"'"
• 10 - .. •
.. •• " ,. c·

VenCan Gold Corporation Cayenne-Chili Property Exploration
39
Figure 9.4.1-2: Genoa Grid – Apparent Resistivity
.VenCan GOld CORPORATION
". .~
~ I "
v , C- .. ,.
"I " ., ---
, \
, , , . , . ., t:' , =
(, - , , , " r , , '. , \ '
':0:'
, .' ' ~ \ \' - ,
\ \ ' \
\'
I
, i
\ ' \
, \ , \ \ \ \.
i
.1.1 \ ~.
1 -'~T , ...
\, I . \ I
'" .... ,. ,
, I \
\ I, '\ \ ' \
1 •• ,M_ , ,,,,, _.
II ' '\
1'11""'",
\ ' ' \ ' " \ I j
-.~.
\ \ i \ \ \
,
\ -. , , ' " "
, \
~'~ \ , ,
\ , ' \.
, I
,
I , \
'. II _ 1 . ,
- •
' I \ ~
,
" - ,. ."C ... ~01
• • , . ' ... ~~".
., "
""'""4!' .....
• I. - .. ~, .. ... " ."~ c·

VenCan Gold Corporation Cayenne-Chili Property Exploration
40
9.4.2 Magnetometer Survey
Magnetic surveying was completed on the Genoa Grid (Figure 9.4.2-1); maps in pocket) by Exsics. A total of approximately 54 line-km of diurnal drift corrected magnetic survey was completed at 5m station intervals between June 27 and July 10th, 2006. The Genoa Grid was centered over highly magnetic iron formation of the WRIF where very high magnetic gradients were expected. Exsics utilized an Overhauser magnetometer (Hrvoic, 200?) that is tolerant of very high magnetic gradients, to collect tightly spaced data along the survey profiles. Further survey instrument specifications and names of field personnel are documented in a survey logistics report (Appendix A) prepared by Exsics. The survey clearly outlined a 100-200m wide, east-northeast trending, intense magnetic high of the WRIF trend and related parallel and sub-parallel trends. Correlation of magnetic anomalies line-to-line (see map in pocket) maps multiplicity of discrete units of the WRIF, and highlights local areas where magnetic layering thickens either structurally or stratigraphically. The most marked areas of stratigraphic thickening and discontinuity are highlighted as the VenCan Occurrence and GV Target areas (see map in pocket). Several magnetic trends discordant from the main east-northeast WRIF trend indicate structurally disrupted segments of the WRIF, and possibly dykes. Magnetic lows proximal to the Jefferson Occurrence that occur within the most intensely magnetic parts of the WRIF can be identified on profiles and are possibly related to the non-magnetic occurrence. The lows do not appear however, to be unique to the occurrence as similar lows are present along the length of the WRIF. There are no uniquely identifiable magnetic characteristics related to the Burton Occurrence. The majority of the WRIF trend is also conductive as indicated by a helicopter-borne EM survey completed by Aeroquest Limited in spring 2006 (Appendix A).
9.4.3 Gravity Survey Gravity and elevation surveys (Figures 9.4.3-1 and 9.4.3-2; maps in pocket) were completed on the Genoa Grid by MWH between July 12 and August 5, 2006. A total of 1809 unique stations, of which 110 were repeated for quality control, covered approximately 45 line-km at 25m intervals. Further survey and instrument specifications and names of field personnel are documented in a survey logistics report (Appendix A) prepared by MWH. The Bouguer Gravity survey results show a dominant regional gradient descreasing from north to south. The gradient clearly maps a regional density change due to the contact between dense mafic vlocanics to the north of the WRIF, with less dense felsic volcanics to the south of the WRIF. Local

VenCan Gold Corporation Cayenne-Chili Property Exploration
41
Figure 9.4.2-1: Genoa Grid – Total Field Magnetometer Survey
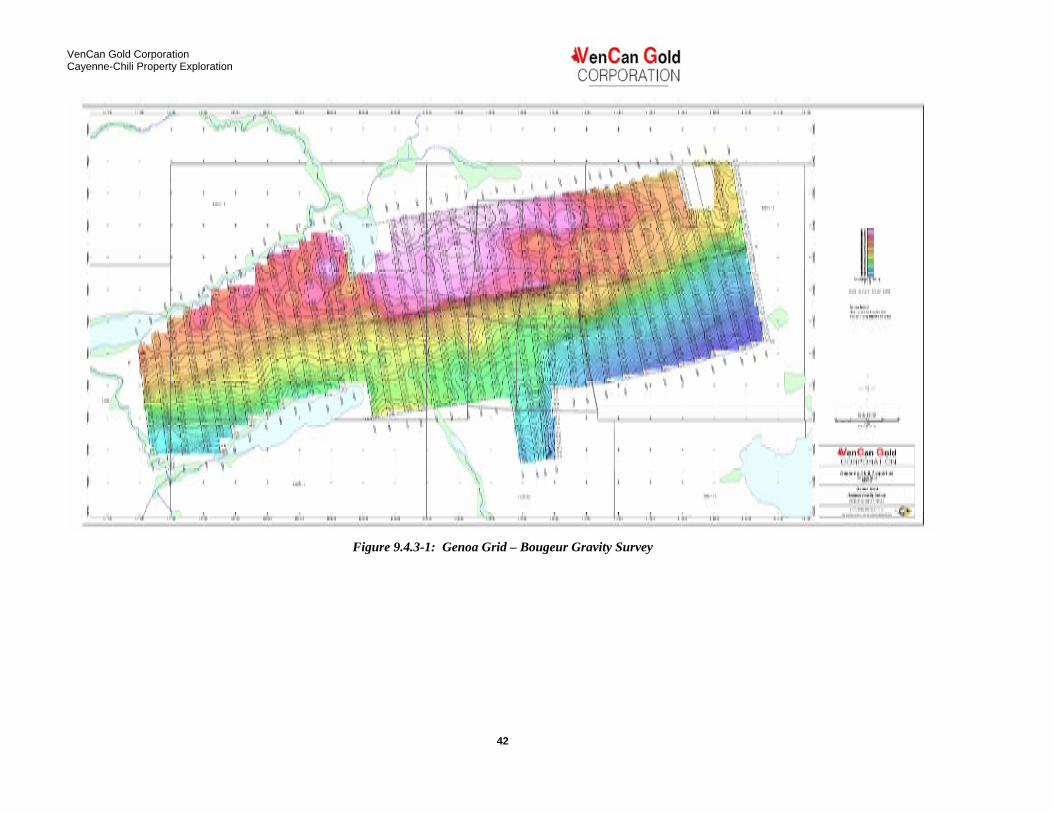
VenCan Gold Corporation Cayenne-Chili Property Exploration
42
Figure 9.4.3-1: Genoa Grid – Bougeur Gravity Survey -
I I
•• .. ••
c-
.VenCan GOld CORPORATION
.,
i
i
1 1
j I I I
.1 .... , . .. ;:i~:..: ....
'. II _ 1 • •
."C ... ~01 , ... ~~" . ""'11,,.... _-::.-.... , ... ,
c·
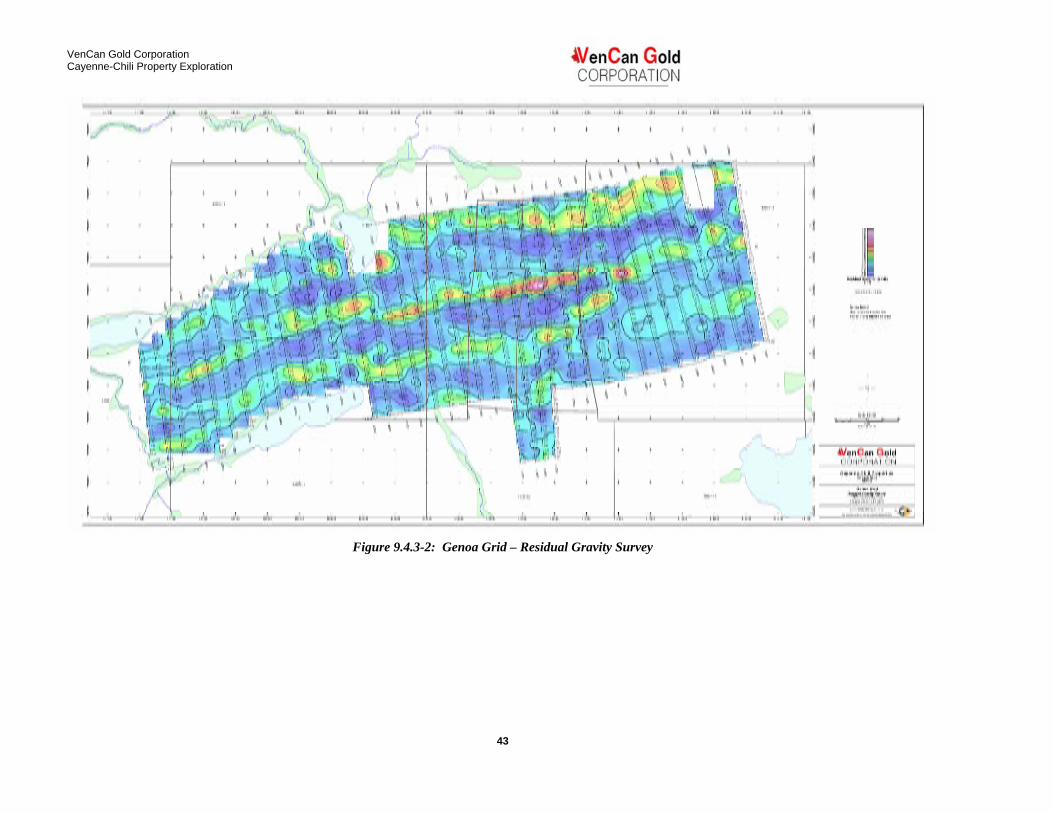
VenCan Gold Corporation Cayenne-Chili Property Exploration
43
Figure 9.4.3-2: Genoa Grid – Residual Gravity Survey
, I I
- •• • .• .1:0
c-
.VenCan GOld CORPORATION
.,
i
i
1 1
j I I I
JI.. • •
;:i~:..:.~
'. II _ 1 • •
."C ... ~01 , ... ~~". """11,,-. 7';--.,
c·

VenCan Gold Corporation Cayenne-Chili Property Exploration
44
anomalies due to the much higher density of the WRIF are superimposed on the regional Bouguer Gravity trend. A regional-residual separation (see map in pocket) was calculated by Geovector Management Inc. (Geovector) to highlight local anomalies superimposed on the regional trend. The highest amplitude residual anomaly of about 0.5 mGal is centered on the Jefferson Occurrence and strikes for about 500m along the WRIF. Several lesser amplitude residual anomalies occur elsewhere on the grid and particularly in the WRIF proximal to the VenCan Occurrence and GV target areas. Linear residual gravity trends are generally coincident with magnetic trends of the WRIF.
9.5 Channel Sampling A series of 70 channel samples averaging 0.9 meters in length were collected over 13 channels as part of the current exploration program. The samples were collected over massive sulphide occurrences located while prospecting or geologically mapping the gridded area. Figure 9.5-1 illustrates the channel sampling locations. Table 9.7-1 highlights channel sample assay results where values are of the 95th or higher percentile ranking.
Table 9.5-1 –Summary of Anomalous Channel Sample Results
Sample Channel Au Ag Cu Pb Zn UTMX UTMY # ppb ppm ppm ppm ppm
7768 13 1.1 155 538 1250 407754 52980907778 11 3 0.2 268 1 281 407864 52981347780 11 2 0.4 76 1110 1920 407861.5 52981317781 11 3 1.5 175 331 1060 407861.7 52981307842 1 96 0.3 64 1 40 410211 52985117843 1 27 0.8 83 560 459 410211 52985107853 4 10 0.1 216 1 45 410204 52985107857 5 124 0.5 106 1 195 410226 52985187861 6 2 182 980 1140 410335 52987407875 8 150 0.4 67 1 275 409671 52985737880 9 14 1.1 257 176 286 409642 52985647881 9 6 0.4 105 1200 1180 409639 52985647886 10 0.7 186 1 220 409299 5298538
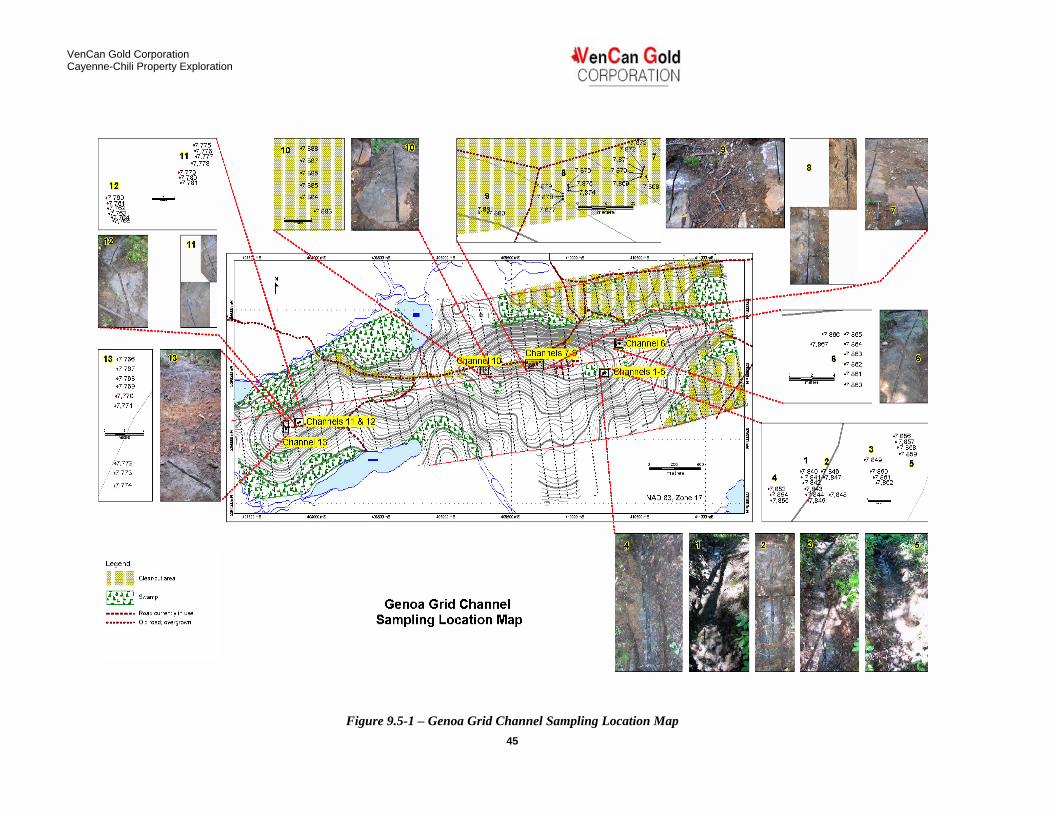
VenCan Gold Corporation Cayenne-Chili Property Exploration
45
Figure 9.5-1 – Genoa Grid Channel Sampling Location Map
12
13 . 7,766 . 7,767
+7,768
:~!!i/ /
'~ /
f, ,772 / .7,773
;' _7,774 ;
Legend
:i~i~i~i~i:i:i:i:i~~:i:i Clear-cut area
~£i~ Ja~£i1 Swamp
______ • Road currently in use
••••••••• Old road: overgrown
Genoa Grid Channel Sampling Location Map
.VenCan Gold CORPORATION
' 7,866 '7,865
.7,867 .7,864
S .7,863
-7,862
3 '7,849
-.. -.,-
,7,856 . 7,857 ' 7,858 ·7,859
5
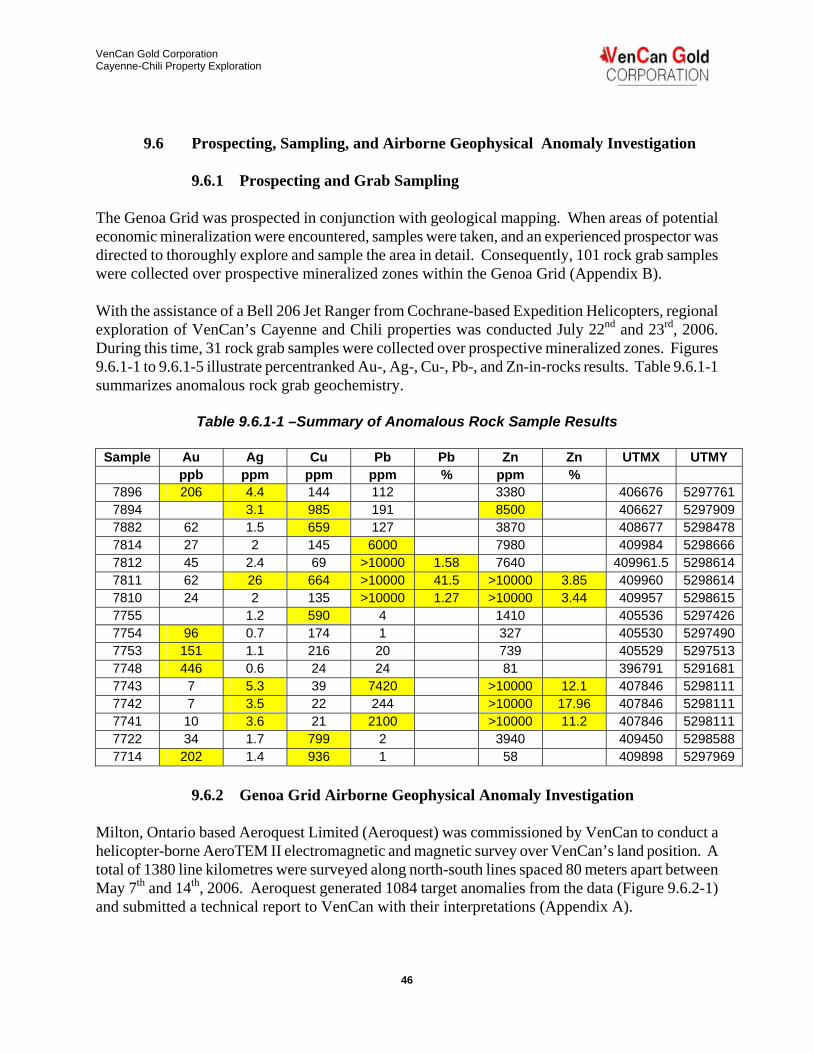
VenCan Gold Corporation Cayenne-Chili Property Exploration
46
9.6 Prospecting, Sampling, and Airborne Geophysical Anomaly Investigation
9.6.1 Prospecting and Grab Sampling
The Genoa Grid was prospected in conjunction with geological mapping. When areas of potential economic mineralization were encountered, samples were taken, and an experienced prospector was directed to thoroughly explore and sample the area in detail. Consequently, 101 rock grab samples were collected over prospective mineralized zones within the Genoa Grid (Appendix B). With the assistance of a Bell 206 Jet Ranger from Cochrane-based Expedition Helicopters, regional exploration of VenCan’s Cayenne and Chili properties was conducted July 22nd and 23rd, 2006. During this time, 31 rock grab samples were collected over prospective mineralized zones. Figures 9.6.1-1 to 9.6.1-5 illustrate percentranked Au-, Ag-, Cu-, Pb-, and Zn-in-rocks results. Table 9.6.1-1 summarizes anomalous rock grab geochemistry.
Table 9.6.1-1 –Summary of Anomalous Rock Sample Results
Sample Au Ag Cu Pb Pb Zn Zn UTMX UTMY ppb ppm ppm ppm % ppm %
7896 206 4.4 144 112 3380 406676 52977617894 3.1 985 191 8500 406627 52979097882 62 1.5 659 127 3870 408677 52984787814 27 2 145 6000 7980 409984 52986667812 45 2.4 69 >10000 1.58 7640 409961.5 52986147811 62 26 664 >10000 41.5 >10000 3.85 409960 52986147810 24 2 135 >10000 1.27 >10000 3.44 409957 52986157755 1.2 590 4 1410 405536 52974267754 96 0.7 174 1 327 405530 52974907753 151 1.1 216 20 739 405529 52975137748 446 0.6 24 24 81 396791 52916817743 7 5.3 39 7420 >10000 12.1 407846 52981117742 7 3.5 22 244 >10000 17.96 407846 52981117741 10 3.6 21 2100 >10000 11.2 407846 52981117722 34 1.7 799 2 3940 409450 52985887714 202 1.4 936 1 58 409898 5297969
9.6.2 Genoa Grid Airborne Geophysical Anomaly Investigation
Milton, Ontario based Aeroquest Limited (Aeroquest) was commissioned by VenCan to conduct a helicopter-borne AeroTEM II electromagnetic and magnetic survey over VenCan’s land position. A total of 1380 line kilometres were surveyed along north-south lines spaced 80 meters apart between May 7th and 14th, 2006. Aeroquest generated 1084 target anomalies from the data (Figure 9.6.2-1) and submitted a technical report to VenCan with their interpretations (Appendix A).
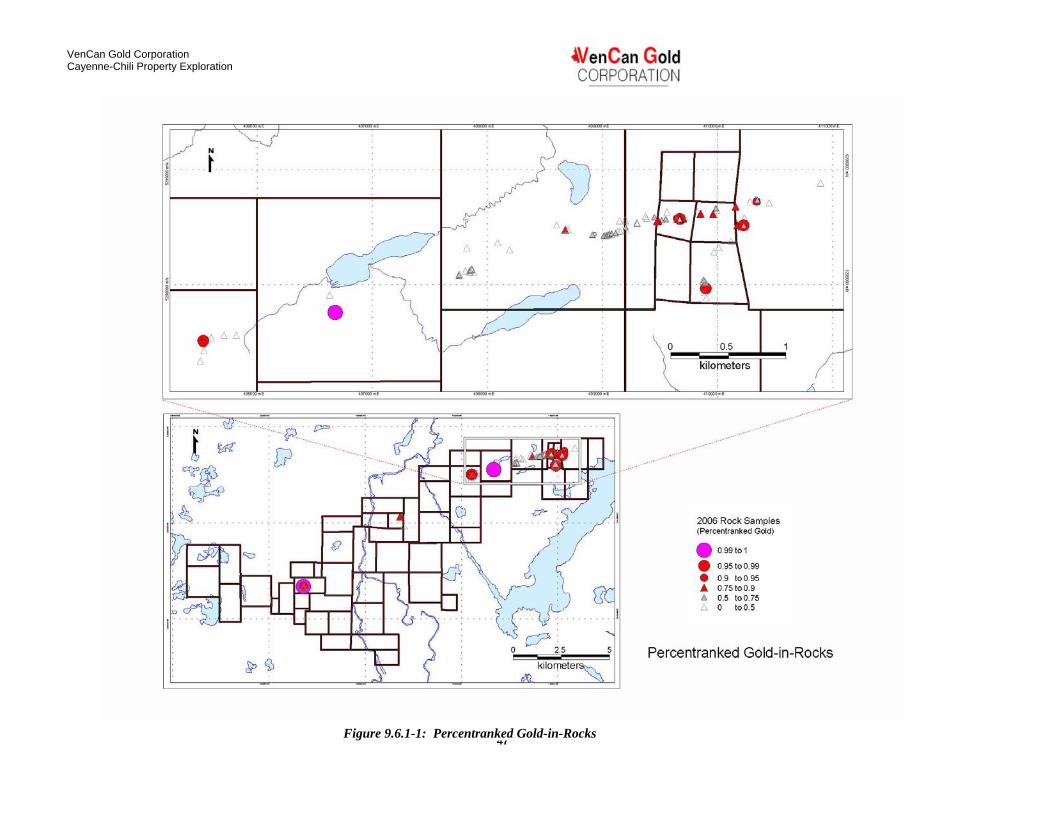
VenCan Gold Corporation Cayenne-Chili Property Exploration
47 Figure 9.6.1-1: Percentranked Gold-in-Rocks
•
.VenCan GOld CORPORATION
o
, .. " ..
"
2006 Rock Samples (P..,centranked GOd)
. 0,99 10\
• 0.95100.99 • 0.9 10 0.95 ... 075 100.9 .. 0.5 toO.75 iJ. 0 toO.S
".
Percentranked Gold-in-Rocks

VenCan Gold Corporation Cayenne-Chili Property Exploration
48 Figure 9.6.1-2: Percentranked Silver-in-Rocks
-- --- --[7 , ~ • t I
• d Ae "
.VenCan GOld CORPORATION
-
V ". 0 R4III' . ' "' '''''
I ..
p ~ "" ..... ~ ... . ..
:
l· o( 1// \0 0
- .
<IJ '. ' 0' c=
:- t.~ ,
• ! .. I ~ "" [? ., .. -
1'- I·-.
~ '1 "'"'" '. f.,
I ~~ .ft .c?-
h l\f cfI ,I'. I'"
(J Q>\ l.g I- I-lJ rf c.- 1 8t ::J ~~ . L11 ) .. .
0 .-o'
j • ... , J1 •
• , • '""
i : i • • ~ ..
: 0 .5 1
~ kilometer
.. .. -.. -..
2006 Rock Samples (p., r"~ntr" nked Silver)
• 0.99101 ' 'I • 0.95 100.99 '" • 0.9 toO.95 ' 0( .. 0.75toO.9 (27) • 0.5 to 075 (35)
0 toO.5 ( 100)
. c? ;. Percentranked Silver-in-Rocks
~ ",<;I M '"
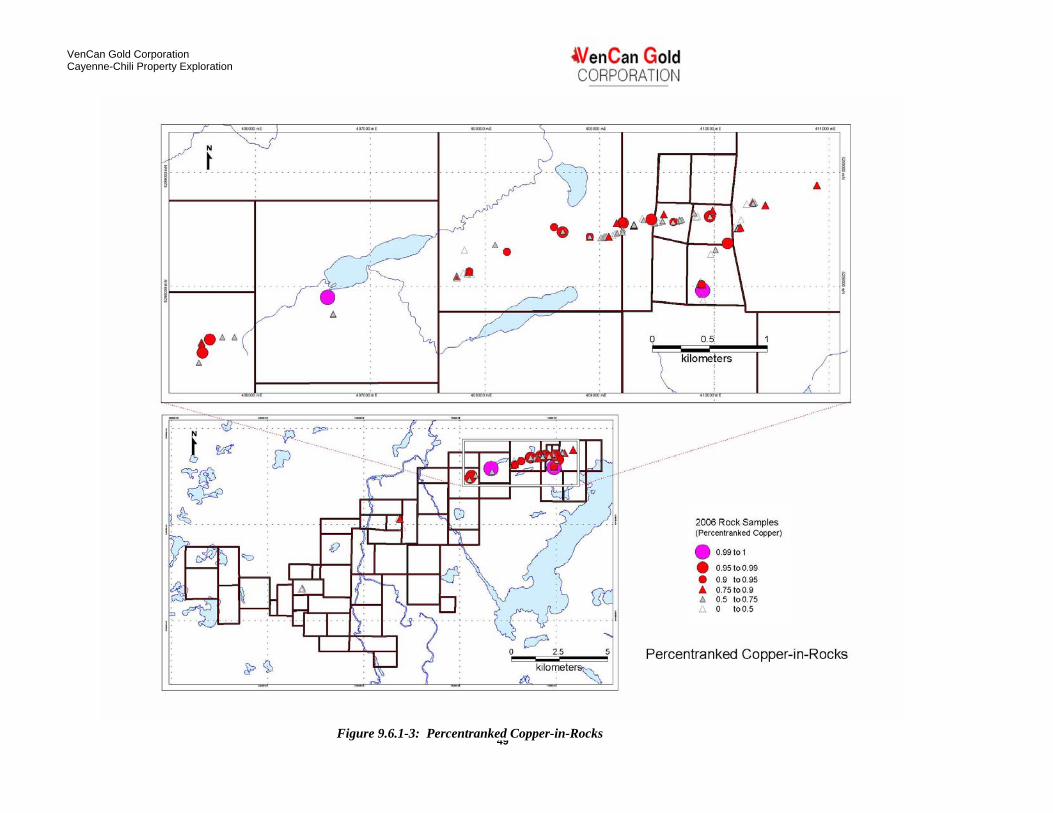
VenCan Gold Corporation Cayenne-Chili Property Exploration
49 Figure 9.6.1-3: Percentranked Copper-in-Rocks
" . . ---, ... •
"'0" , C>'"
[?
.VenCan GOld CORPORATION
v' -0 a
,
J> ..
, .' . ...
.. -. ' ,.--
2006 Rock Samples (~centranked Copper)
. 0 .99 101
• 0.95 100.99 • 0.9 100.95 ... 0.75 100.9 Q 0.5 100.75 l:J. 0 100.5
..
Percentranked Copper-in-Rocks

VenCan Gold Corporation Cayenne-Chili Property Exploration
50 Figure 9.6.1-4: Percentranked Lead-in-Rocks
.. ..
, ~' !r::- .+---}~~~ it
' .
.VenCan GOld CORPORATION
,'- -.. , -
--
200B Rock Samples (Pe<cenlranked Le.d)
. 0.99101
• O.9!'itoo.W
• 0.9 to0.95 ... 0.75100.9 ... 0.5 toO.75
o toO.5
•
.-.'--
b ..."."',,"= ""';5 Percentranked Lead-in-Rocks Kilol"(lete
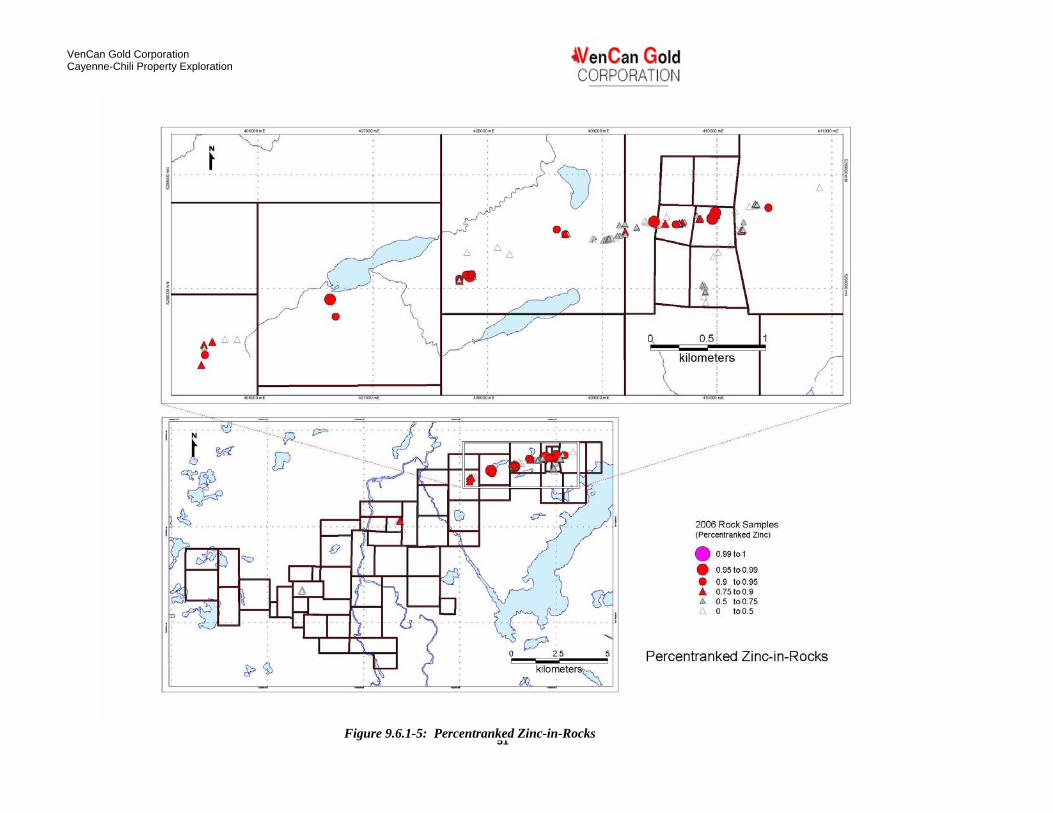
VenCan Gold Corporation Cayenne-Chili Property Exploration
51 Figure 9.6.1-5: Percentranked Zinc-in-Rocks
--~ '-'-J' •
t , I
I l~ ~& ~ 6( &
, ,
I • '" '-'-.C,
P c=
! !« ,
,
if ~ ~
I"
~~D 'O tg
If& r-:=~ .1
A
I ' o;j'. : I
&>0
-- --:
" . . l oe .'
"
.VenCan GOld CORPORATION
--
V -.. : ~~
• '4 .... ~ AIIi>
~ . .
Q
--, , , .,. ,
~ 1> _
t ,
{ , ~ , ,
0.5 : 1 j~ kilometers
\, . . .
'X ' I ~~'-, ..-_.
J .-.,-
.. ---... · r t · ~ '~ I"
o <? I 200B Rock Samples · ...L rt- (P.".centfanked Zinc)
• rt ~\ . 0.99101
• 0.9:5 100.99
-0.9 100.95
lit I & O.7~ toO_ 9
• 0.5 !00.75
~ )' " toO.5
'/- 6 : ,
,,_ ..
,
;: ~ .
..," ... ' .-~-
\ .
• }-1 2 " c? 2.5 • Percentranked Zinc- in-Rocks ,r" Ki lomete~
!
I ,

VenCan Gold Corporation Cayenne-Chili Property Exploration
52
Figure 9.6.2-1 – Aeroquest AeroTEM Targets (Aeroquest Total Field Airborne Magnetics Background)
N
* Aeroquest Anomaly
4VenCan Gold CORPORATION
c? o 2.5 5
kilom

VenCan Gold Corporation Cayenne-Chili Property Exploration
53
Due to the quantity of targets generated by Aeroquest, and a paucity of time for investigation due to the arrival of the data so late in the field program, the data was reviewed by the authors and targets pared down with the assistance of Bill Nielsen and of GeoVector Management Inc.’s Roman Tykajlo (Appendix A). These ‘short-listed’ targets were then further prioritized by the authors, with non-prioritized targets added to the target list if time permitted investigation (Table 9.6.2-1; Figure 9.6.2-2).
Table 9.6.2-1 – Prioritized Airborne Anomalies
Township Target GeoVector
# Nielsen
# UTMX UTMY Comments
Benton I 12 H 398520 528940013 and 26S anomalies with a mag association
Benton I 12 398579 5289366
major WNW faults inferred cutting through area of disrupted HTEM anomalies and mag trends
Benton II 24 399030 5289861
WNW faults inferred cutting through area of Benton-3 Au showing
Heenan III 8 D 396800 5291700
21 and 32S and 26S anomalies near a magnetic IF
Heenan III 8 397097 5291842
at least three parallel EW striking HTEM trends possibly along structures
Heenan III 13 397100 5291483
short, weak NW trending 100m length isolated HTEM anomaly trend along possible NW structure
Heenan IV 29 F 397930 5292950 isolated 42S anomaly
Heenan IV 29 398078 5292936
WNW faults inferred crosscutting IF through area of HALEX Au showing
Heenan V 28 398697 5293405
WNW faults inferred crosscutting IF through zone of elevated Au in bedrock
Marion VI 6 L 401860 5295340
isolated 45 and 21S anomalies west of a mag anomaly
Marion VI 6 402123 5295500
EW faults inferred cutting through IF and into Au bearing porphyry intrusion at Gagne prospect
Marion VII 5 402030 5294964
EW faults inferred cutting through IF and into Au bearing porphyry intrusion at Gagne prospect

VenCan Gold Corporation Cayenne-Chili Property Exploration
54
Marion VIII 4 N 405280 529705066 and 53S anomalies with a mag assoc
Marion VIII 4 405259 5297080
200m long conductive trend striking parallel with inferred NW fault
Marion IX 3 P 405530 5297360
stacked 54 and 31S anomalies with a mag assoc.
Marion IX 3 405535 5297366
IF trend disrupted by inferred WNW faults in proximity to mapped porphyry intrusive - analogue to Gagne target
Marion X 3 O 405530 5297550isolated 23S anomaly next to a mag anomaly
Marion XI 1 Q 406650 5297750
Stacked 59 and 56S anomalies with a mag assoc
Marion XI 1 406716 5297762 conductive trend disrupted by major NNW fault
Heenan Non-
prioritized 9 A 391770 5292100several 22S anomalies near a dyke (magnetic)
Heenan Non-
prioritized 20 B 394750 5292700several isolated 22S anomalies
Heenan Non-
prioritized I 390770 5292620isolated 22S anomaly with mag assoc
Marion Non-
prioritized K 401770 5293600isolated 19S anomaly with mag assoc
Marion Non-
prioritized R 408100 5298200
stacked 39 and 22S anomalies with a mag assoc.
Marion Non-
prioritized 27 S 408480 5298600AEM anomaly cluster in a mag low
Genoa Non-
prioritized T 409150 5298600AEM anomaly cluster in a mag low
Genoa Non-
prioritized V 410200 5298500
isolated 60 and 55S anomalies with a mag assoc
Genoa Non-
prioritized W 410700 5298740cluster of AEM responses in a mag trend break
Genoa Non-
prioritized X 410975 5299350isolated 20S anomaly with a mag association
Genoa Non-
prioritized 10 409883 5297981
250m long isolated HTEM anomaly, no direct mag association

VenCan Gold Corporation Cayenne-Chili Property Exploration
55
Marion Non-
prioritized 30 408409 5298731
conspicuous absence of HTEM and reduction of mag intensity along an otherwise conductive and magnetic trend
As many of the airborne geophysical targets selected for investigation fell within the Genoa Grid, they were investigated by foot. The following descriptions summarize the field observations of the Genoa Grid targets.
Nielsen Target R The target falls in an area of no outcrop exposure. Only glacially deposited diamict and sand was uncovered. This area falls on strike with drill holes VG-06-16 and VG-06-17, and is only 220 metres to the ENE of VG-06-17. As sphalerite and galena mineralization were encountered in

VenCan Gold Corporation Cayenne-Chili Property Exploration
56
Figure 9.6.2-2 – Prioritized 2006 Airborne Targets (Aeroquest Total Field Airborne Magnetics Background)
Roman Numeral· F'roritized Target Numeric - Tykjalo Targeh,. A Alpha-Numeric - N ielse~:arget?)
4VenCan Gold CORPORATION
o c=? 2.5 5
kil
VenCan Gold Corporation Cayenne-Chili Property Exploration
57
both holes, Target R may represent the strike extension of the mineralized zone. As such, the target should be drill tested during a future drill program. Nielsen Target S, GeoVector Targets 27 and 30 The targets fall in a swamp to the West of Smithette Lake. As a consequence, no outcrop exposure was found. Based on the recommendation of a Geophysicist, these targets could be drill tested in the future. Any drilling in these areas would need to be following freeze-up. Nielsen Target T The target is centered on metasedimentary rocks associated with the Woman River Iron Formation. A silicate-facies banded iron formation is found 30 metres to the South of the anomaly. This target is adequately explained by the outcrop exposure, and is not recommended for follow-up. Nielsen Target U, GeoVector Target 10 The outcrop exposure in the target area consists of massive sulphide (predominantly pyrite and pyrrhotite with trace to minor chalcopyrite and trace bornite), highly chloritic fissile metasediments with up to 35% disseminated pyrite, and an amphibole-rich mafic-ultramafic intrusive. Massive sulphide exposures to 3 by 10 metres have been uncovered and extensively grab sampled. All other outcrop exposures are small (<1 metre) in size, with the exception of an amphibolite exposure roughly 5 by 2 metres in size. This amphibolite exposure is brecciated in part, with rafts of highly metamorphosed xenoliths of banded iron formation. Based on field investigation, this target is determined to be a high priority gold target and should be drill tested during a future exploration program. Nielsen Target V The target is centered on 5 trenches exposing massive sulphide to 5 metres wide (predominantly pyrite and pyrrhotite with minor chalcopyrite and trace to minor bornite), and gneissose felsic volcanics. The sulphide mineralization appears to be structurally related and is considered to be a high priority gold target. A total of 20 channel samples (averaging 1 metre in length) were collected from the trenches. Sample 7843 from channel area 5 returned a Pb value of 560 ppm and a Zn value of 459 ppm, while sample 7845 from the same channel area returned a Zn value of 569 ppm. Sample 7857 from channel area 5 returned a Au value of 124 ppb. No other samples were anomalous, and as a consequence no additional work is recommended over this target at this time. Nielsen Target W The target falls in an area of no outcrop exposure on as East-facing gently sloping ridgeline. Quaternary sediments (diamict and sand) dominate, with angular boulders of metasediment, and rounded to sub-rounded boulders of diorite, granodiorite, and granite uncovered. A property-

VenCan Gold Corporation Cayenne-Chili Property Exploration
58
scale fault has been interpreted in the target area by GeoVector. Ground investigation could not determine the source of the anomaly, and any future exploration should be based on the recommendation of a Geophysicist. Nielsen Target X The target area falls within an area of mafic volcanic flows and tuffs which are bisected by a logging road. The anomaly could be cultural (i.e. equipment on the road during the survey), or caused by road fill sourced from an anomalous area (e.g. Banded Iron Formation). No further work is warranted for this anomaly.
9.6.3 Regional/Property Scale Investigation of Airborne Geophysical Anomalies
With the assistance of a Bell 206 Jet Ranger from Cochrane-based Expedition Helicopters, regional exploration of VenCan’s Cayenne and Chili properties was conducted July 22nd and 23rd, 2006. Benton Township
Target I (GeoVector target 12, Nielsen target H) The target falls on a WNW trending regional fault that parallels the Woman River Iron Formation, and is bisected by a NW trending dyke. A small outcrop (50 cm by 2 metres) of highly oxidized banded iron formation with 15-20% small (<5 cm wide) quartz veinlets and 10-15% pyrite (both disseminated and vein-hosted) was found and sampled, but yielded no significant results. No other significant sulphide occurrences were noted, but the area is heavily treed, with abundant Quaternary sediments. Lithologically, the area appears to be dominated by a lightly oxidized sheared rhyolite (BED 268/86 (Right Hand Rule)) with trace disseminated pyrite. A magnetic gabbro was also found during the investigation. Based on the brief field visit, this target appears to be a valid gold target. An overgrown local grid was identified over the target area. Data from previous exploration programs should be compiled for the target area before further ground investigations be conducted. Target II (GeoVector target 24) The target area consists of low, rolling, hummocky terrain rising from lowland swamp. The hummocks over the targeted area consist of glacially deposited sands and sandy diamict. A local grid was found to the immediate north (200 metres of the target). Data from previous exploration should be compiled for the area before further ground investigations be conducted.
Heenan Township
Target III (GeoVector targets 8 and 13, Nielsen target D)

VenCan Gold Corporation Cayenne-Chili Property Exploration
59
The target area lies on the western slope of a large hill. Abundant highly brecciated banded iron formation was encountered on the hillside amidst very dense replanted (~10 years old) coniferous forest. Pockets of massive sulphide (>1 m wide) with quartz veinlets (<5 cm wide) were found interspersed throughout the brecciated iron formation. Four samples were collected within the target area. Sample 7748 yielded a gold assay value of 446 ppb, while the other three samples returned negligible assay results. As the target area is aerially expansive, and appears highly brecciated, it appears to be a very good target for gold mineralization. Before further ground exploration is conducted however, previous data should be compiled for the area. Target IV (GeoVector target 29, Nielsen target F) The target location consists of a large pile of brush piled atop Quaternary sediments. Only a cursory examination of the immediate area was conducted however as the target falls on the gridded area from VanCan’s 2005 Heenan program. An examination of the data collected during last year’s program by GeoVector is recommended to explain the AeroTEM anomaly. Target V (GeoVector target 28) As per Target IV, this target falls on the gridded area from VanCan’s 2005 Heenan program. As such, an examination of the data collected during last year’s program by GeoVector is recommended to explain the AeroTEM anomaly.
Marion Township
Targets VI and VII (GeoVector targets 5 and 6, Nielsen target L) Targets VI and VII are both within the ‘Gagne Property’ of VenCan’s land package. The area has seen extensive work in the past, and no attempt to duplicate previous work was made. Rather, the four hours spent on the property were used to traverse East-West trending structures interpreted by GeoVector, and to visit the targets (VI and VII) identified from the AeroTEM data. A moderately to strongly oxidized cherty metasediment with trace to 2% pyrite and trace chalcopyrite was found in the area of Target VI and subsequently sampled with sample 7897 returning a Zn value of 700 ppm. The area is overlain by abundant overburden, and should be mechanically trenched in a future exploration program to follow up the anomalous Zn. Target VII is dominated by an East-West trending scarp of highly oxidized banded iron formation. No ‘fresh’ samples of the iron formation were obtained for assaying. A felsic volcanic with minor to 1% sub-mm cubic disseminated pyrite was sampled immediately adjacent to the iron formation with no significant results. A thorough examination of the

VenCan Gold Corporation Cayenne-Chili Property Exploration
60
East-West scarp should be conducted during a future exploration program, and this examination should include channel sampling. Targets VIII, IX, and X (GeoVector target 3, Nielsen targets O and P) Due to the thick vegetation over the targeted area, the helicopter had to land 600 metres East of Target X. During the traverse to the target, 6 samples were collected within outcrop exposed below the roots of ‘blown down’ trees. The samples were from brecciated iron formation and semi-massive sulphide with pyrite to 40%, pyrrhotite to 2%, galena to 1%, and trace chalcopyrite. Anomalous assays were identified from samples 7752 (500 ppm Cu, 505 ppm Zn), 7753 (151 ppb Au, 216 ppm Cu, 739 ppm Zn), and 7754 (96 ppb Au, 174 ppm Cu, 327 ppm Zn). During the traverse to Target IX from Target X, two samples were collected. One sample was from the contact between a rhyolite and a mafic volcanic with 10-15% contact-parallel pyrite (sample 7755 with 590 ppm Cu and 1410 ppm Zn), while the other was collected from a moderately oxidized felsic volcanic on a North-South striking scarp face (sample 7756 with 104 ppm Pb and 343 ppm Zn). There was a paucity of outcrop over the Target IX area, and as a consequence no further samples were collected. Due to the mineralization observed in outcrop within the vicinity of Target X, its being 2.4 kilometres west along strike from the ‘Zinc Zone’ (drill holes VG-06-16 and 17), and the anomalous rock grab sample results, this target is very prospective. The extension of the current Genoa grid by 2.5 kilometres to the WSW should be considered for future exploration to encompass what might be the strike extension of the mineralization encountered in holes VG-06-16 and 17. Target VIII, immediately south of IX, was not visited due to time constraints. Target XI (GeoVector target 1, Nielsen target Q) Target XI is roughly halfway, on strike, between the ‘Zinc Zone’ currently being drilled, and Target X. The area is heavily wooded with a paucity of outcrop. Three samples were collected from exposed outcrop beneath the roots of ‘blown down’ trees. The samples were from highly oxidized banded iron formation/semi-massive sulphide with pyrite to 35%, pyrrhotite to 20%, and chalcopyrite to 2%. Highly anomalous assays were returned for sample 7894 (3.1 ppm Ag, 985 ppm Cu, 191 ppm Pb, and 8500 ppm Zn), and sample 7896 (206 ppb Au, 4.4 ppm Ag, 144 ppm Cu, 112 ppm Pb, and 3380 ppm Zn). Due to the mineralization observed in outcrop within the vicinity of Target X, the anomalous assay results, and its being 1.3 kilometres west along strike from the ‘Zinc Zone’, this target is very prospective. The extension of the current Genoa grid by 2.5 kilometres to the WSW should be considered for future exploration to encompass targets IX through XI. Ground geophysics, mapping, channel sampling, and soil sampling is recommended over these areas to ascertain if they are strike extensions of the ‘VenCan Zinc’ showing.

VenCan Gold Corporation Cayenne-Chili Property Exploration
61
Non-Prioritized Target Observations Due to time constraints and/or poor landing conditions, some lower priority targets were not visited during the regional exploration. The following targets were observed through the air with observations summarized below.
Nielsen Target A The target area falls within an oxidized sand and gravel quarry. The surrounding area seems to be dominated by sand. It is highly likely that any anomalies identified by the AeroTEM survey were caused by glacial deposition of varying lithologies within the gravel pit area. Nielsen Target B The target area is on the edge of a swamp dominated by black spruce, and has no outcrop exposure. There was no suitable landing site available so the site was not visited. The site could be accessed via a logging road roughly 3 kilometres to the East. Any future ground investigation in the region should include a visit to the anomaly. Nielsen Target K No suitable landing site was available to visit this anomaly within a 3-5 kilometre radius. A ground investigation of the anomaly should be conducted however, as a large (roughly 10 by 20 metre) highly oxidized outcrop was observed from the air.
9.7 Diamond Drilling
Seventeen (17) drill holes, VG-06-01 to VG-06-17, comprising 2425 meters of diamond drilling were completed from June 14 to July 25, 2006 on the Genoa Grid area. The objective of the drill program was to investigate several historical Pb/Zn occurrences and/or geological targets defined during the course of exploration programs completed on the property, with the aim of confirming past exploration results and to investigate the mineral potential of targets defined. Pertinent drill hole data are listed below (Table 9.7-1).
Table 9.7-1: Drill Hole Data
Drill Hole # Easting Northing Elev Azi Dip HQ NQ Depth
(m) Start Finish VG-06-01 410356.01 5298911.84 394.27 0 -45 7 103 110 June 14,2006 June 15,2006 VG-06-02 409919.69 5298610.25 430.40 350 -45 5 51 56 June 16,2006 June 17,2006 VG-06-03 409921.58 5298579.95 428.05 350 -45 6 125 131 June 17,2006 June 19,2006 VG-06-04 409923.70 5298550.42 426.72 350 -45 4 169 173 June 19,2006 June 22,2006 VG-06-05 409927.51 5298519.52 421.52 360 -45 4 193 197 June 22,2006 June 24,2006 VG-06-06 409872.24 5298581.95 427.08 355 -45 4 118 122 June 24,2006 June 26,2006 VG-06-07 409880.70 5298518.13 423.00 354 -45 7 187 194 June 26,2006 July 4,2006 VG-06-08 409884.21 5298487.11 424.30 355 -45 4 223 227 July 5,2006 July 7,2006 VG-06-09 409832.31 5298513.94 419.33 355 -45 7 184 191 July 8,2006 July 10,2006 VG-06-10 409830.22 5298546.69 425.41 355 -45 4 148 152 July 10,2006 July 12,2006 VG-06-11 409831.01 5298473.97 419.58 355 -45 4 238 242 July 12,2006 July 17,2006 VG-06-12 409962.96 5298585.66 426.41 355 -45 4 106 110 July 17,2006 July 18,2006
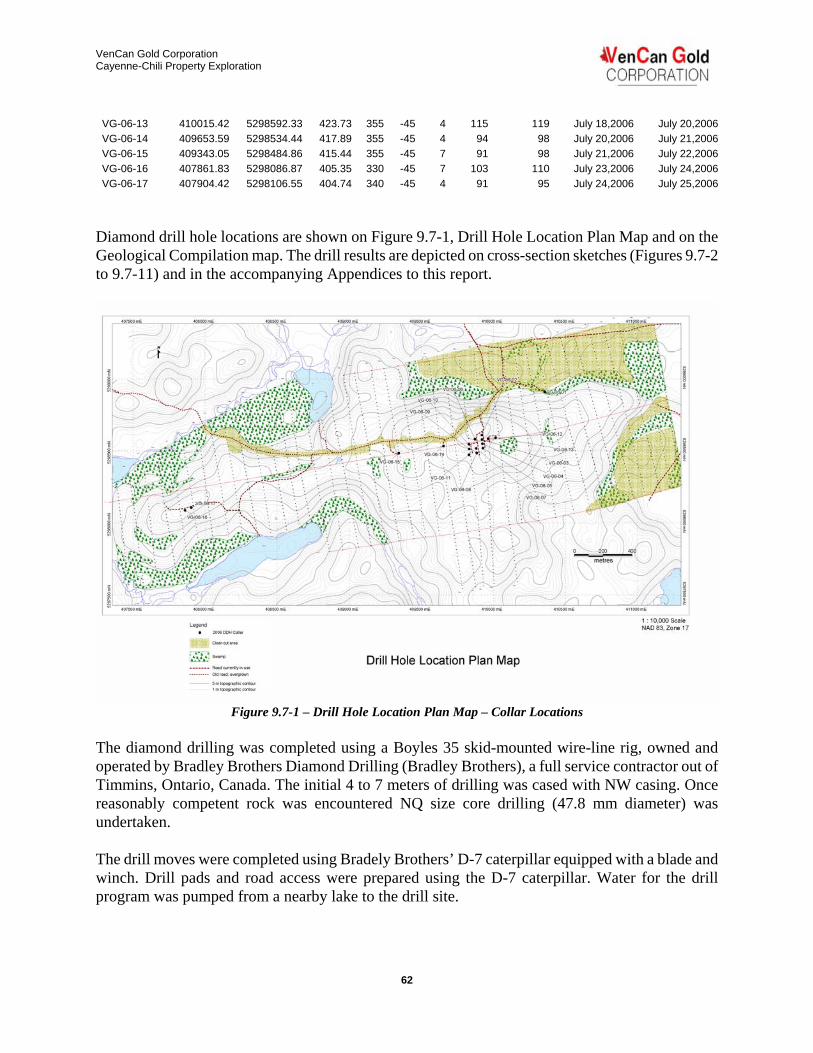
VenCan Gold Corporation Cayenne-Chili Property Exploration
62
VG-06-13 410015.42 5298592.33 423.73 355 -45 4 115 119 July 18,2006 July 20,2006 VG-06-14 409653.59 5298534.44 417.89 355 -45 4 94 98 July 20,2006 July 21,2006 VG-06-15 409343.05 5298484.86 415.44 355 -45 7 91 98 July 21,2006 July 22,2006 VG-06-16 407861.83 5298086.87 405.35 330 -45 7 103 110 July 23,2006 July 24,2006 VG-06-17 407904.42 5298106.55 404.74 340 -45 4 91 95 July 24,2006 July 25,2006
Diamond drill hole locations are shown on Figure 9.7-1, Drill Hole Location Plan Map and on the Geological Compilation map. The drill results are depicted on cross-section sketches (Figures 9.7-2 to 9.7-11) and in the accompanying Appendices to this report.
Figure 9.7-1 – Drill Hole Location Plan Map – Collar Locations
The diamond drilling was completed using a Boyles 35 skid-mounted wire-line rig, owned and operated by Bradley Brothers Diamond Drilling (Bradley Brothers), a full service contractor out of Timmins, Ontario, Canada. The initial 4 to 7 meters of drilling was cased with NW casing. Once reasonably competent rock was encountered NQ size core drilling (47.8 mm diameter) was undertaken. The drill moves were completed using Bradely Brothers’ D-7 caterpillar equipped with a blade and winch. Drill pads and road access were prepared using the D-7 caterpillar. Water for the drill program was pumped from a nearby lake to the drill site.

VenCan Gold Corporation Cayenne-Chili Property Exploration
63
Drill core was stored in wooden core boxes, 1.5 meters in length holding 4.5 meters NQ core. All core is stored in Timmins at the Moneta Mines core storage facility under corregated metal core hangers. Drill casing was retained for all drill holes and used to mark the location of the hole. All holes were subsequently surveyed by MWH Geo-Surveys by differential GPS.

VenCan Gold Corporation Cayenne-Chili Property Exploration
64
.VenCan Gold CORPORATION

VG-06-01
VG-06-01
NRNR
MAT
MATMAT
FELT
MATQFP
MATFELT
BRXMATQFP
MAT
MATQFPMATQFP
MATMAT
QFPMATQFPMATQFP
QFPMATQFP
VG-06-01110mVG-06-01110m
MATMAT
5298700mN
5298750mN
529
8750
mN
5298800mN
5298900mN
529
8850
mN
529
8900
mN
450mRL
400mRL
350mRL
300mRL
250mRL
5298850mN
529
8800
mN
5298950mN
529
9050
mN
5299000mN
529
9000
mN
529
8950
mN
529
9100
mN
529
9150
mN
5299050mN
5299100mN
5299150mN
450mRL
400mRL
350mRL
300mRL
250mRL
%
!7272
8
!7
8
7
,3030
VG-06-01110m
VG-06-01
25
metres
50
Diamond Drill Hole SectionVG-06-01
12.50
Date:6/9/2006
Scale: 1:1250 Projection: Non-Earth (meters)
Scale 1:1250Section Origin (top left)410353.66 m E5299075.82 m N492.097 m RLOrientation 178.4 deg
%
+
+++++++
+++
!
)!
8181
!
!
7272
84
!
7884 78 H
84
8888
,3030
!
) )
6078
6078
72
!))8068
80
7268
!
e
8181
74
!!H!!
74
86
84
80
!t
0 0 !
72
787878
72
78
72
!
!
8888
0
88
88
!
) 8282
80
!!!H
74
72
!H
t!t
7878
86
!!i83
0
H
&&&
62
72 74
80
!t
82
!tt
82
!
!
!
5298800 mN
5298700 mN
5298600 mN
5298500 mN
409900 mE
409900 mE
410000 mE
5299000 mN
5299
000
mN
5298900 mN
410000 mE
410400 mE
410200 mE
410100 mE
410100 mE
410200 mE 410300 mE
410300 mE
409800 mE
5298
800
mN
5298
700
mN
5298
600
mN
5298
500
mN
409800 mE
409700 mE
409700 mE
5298
900
mN
meters
0 100 200
410500 mE
411000 mE410000 mE 410500 mE
411000 mE410000 mE
409500 mE
5299
500
mN
408500 mE
408500 mE
409000 mE
409000 mE
5297
500
mN
5298
000
mN
5298000 mN
411500 mE
5298
500
mN
5298500 mN
5299
000
mN
5299000 mN
409500 mE408000 mE
407500 mE 408000 mE
500 1,000
meters
0
Index MapIndex MapIndex MapIndex MapIndex MapIndex MapIndex MapIndex MapIndex MapBoundsBoundsBoundsBoundsBoundsBoundsBoundsBoundsBounds
Index MapIndex MapIndex MapIndex MapIndex MapIndex MapIndex MapIndex MapIndex Map
Section BoundsSection BoundsSection BoundsSection BoundsSection BoundsSection BoundsSection BoundsSection BoundsSection Bounds
NR
QFP
QTZ
RHYO
BRX
DIOR
BIF
FET
FELT
FP
INTT
MAFD
IF
IND
MAFT
MAT
META
Lithology Legend
MFLO
Pb %Linegraph1 mm/% at 1:1250
HoleID
EOH
LithoTrace Shade
LithoText
Zn %Linegraph1 mm/% at 1:1250
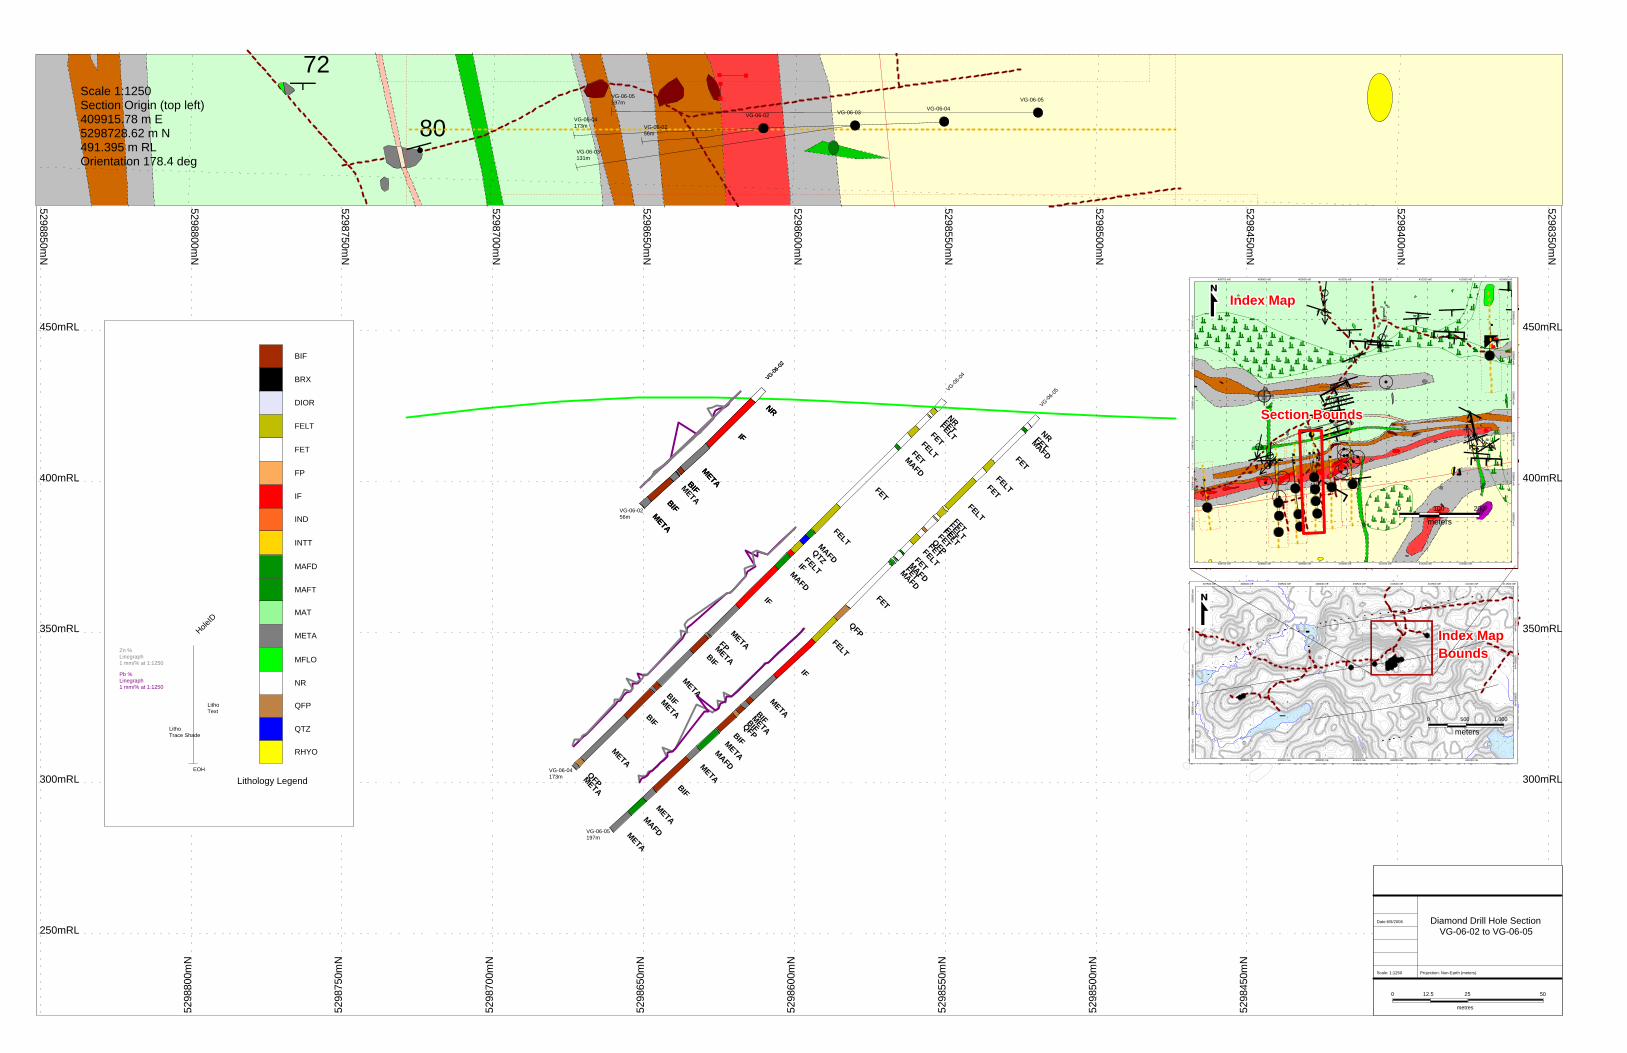
FETMAFDFETFELTFET
FELTFETFELTQFP
FETFELT
FETFETFET
FELT
VG-06-05
VG-06-04
NRFETFETFELTFETMAFD
FET
FELT
FELT
MAFDQTZIF
MAFD
MAFD
FET
QFPFELT
FELT NR
IF
METABIFMETA
BIF
NRNR
VG-06-02
VG-06-02
IFIF
FP
IF
BIFQFP
METAMAFD
METAMETABIF
METAMETA
META
BIFBIFMETA
BIF
META
BIF
METABIF
METABIF
METAMAFD
BIF
META
VG-06-0256m
META
QFP
METAVG-06-04173m
MAFD
FET
META
VG-06-05197m
400mRL
300mRL
350mRL
5298500mN
5298400mN
529
8400
mN
5298350mN
250mRL
5298450mN
5298550mN
529
8450
mN
529
8550
mN
529
8500
mN
529
8600
mN
5298650mN
529
8650
mN
5298600mN
350mRL
400mRL
450mRL 450mRL
300mRL
5298700mN
5298850mN
5298800mN
5298750mN
529
8700
mN
529
8750
mN
529
8800
mN
250mRL
!
&
72
80VG-06-05197m
VG-06-04173m VG-06-02
56m
VG-06-03131m
VG-06-02 VG-06-03VG-06-04
VG-06-05
25
metres
50
Diamond Drill Hole SectionVG-06-02 to VG-06-05
12.50
Date:6/9/2006
Scale: 1:1250 Projection: Non-Earth (meters)
Scale 1:1250Section Origin (top left)409915.78 m E5298728.62 m N491.395 m RLOrientation 178.4 deg
%
+
+++++++
+++
!
)!
8181
!
!
7272
84
!
7884 78 H
84
8888
,3030
!
) )
6078
6078
72
!))8068
80
7268
!
e
8181
74
!!H!!
74
86
84
80
!t
0 0 !
72
787878
72
78
72
!
!
8888
0
88
88
!
) 8282
80
!!!H
74
72
!H
t!t
7878
86
!!i83
0
H
&&&
62
72 74
80
!t
82
!tt
82
!
!
!
5298800 mN
5298700 mN
5298600 mN
5298500 mN
409900 mE
409900 mE
410000 mE
5299000 mN
5299
000
mN
5298900 mN
410000 mE
410400 mE
410200 mE
410100 mE
410100 mE
410200 mE 410300 mE
410300 mE
409800 mE
5298
800
mN
5298
700
mN
5298
600
mN
5298
500
mN
409800 mE
409700 mE
409700 mE
5298
900
mN
meters
0 100 200
410500 mE
411000 mE410000 mE 410500 mE
411000 mE410000 mE
409500 mE
5299
500
mN
408500 mE
408500 mE
409000 mE
409000 mE
5297
500
mN
5298
000
mN
5298000 mN
411500 mE
5298
500
mN
5298500 mN
5299
000
mN
5299000 mN
409500 mE408000 mE
407500 mE 408000 mE
500 1,000
meters
0
Index MapIndex MapIndex MapIndex MapIndex MapIndex MapIndex MapIndex MapIndex MapBoundsBoundsBoundsBoundsBoundsBoundsBoundsBoundsBounds
Index MapIndex MapIndex MapIndex MapIndex MapIndex MapIndex MapIndex MapIndex Map
Section BoundsSection BoundsSection BoundsSection BoundsSection BoundsSection BoundsSection BoundsSection BoundsSection Bounds
NR
QFP
QTZ
RHYO
BRX
DIOR
BIF
FET
FELT
FP
INTT
MAFD
IF
IND
MAFT
MAT
META
Lithology Legend
MFLO
Pb %Linegraph1 mm/% at 1:1250
HoleID
EOH
LithoTrace Shade
LithoText
Zn %Linegraph1 mm/% at 1:1250

VG-06-07
VG-06-08
NRFELTFET
FET
FET
FELT
FELTQFPFETFELTFETMAFDFET
MAFDFET
NRMFLOFETFELTDIORFELT
FET
FELTFETMAFDFELT
FET
MAFD
MAFDFETMAFDMAFD
QFPFETFELTFET
FET
QTZMAFD
FELT
VG-06-06
FETFELTINDFELT
FELT
IF
NR
MAFD
IFMETAMAFD
QFPFELT
METAQFP
IF
METAMAFD
META
META
BIFMETA
BIFMETAIFQFPIF
METABIF
METAMETABIF
BIF
BIFMETABIF
METABIF
MAFDMETA
VG-06-08227m
META
VG-06-07194m
BIF
META
VG-06-06122m
BIF
META
5298400mN
529
8350
mN
5298350mN
529
8400
mN
5298500mN
5298550mN
529
8550
mN
529
8500
mN
5298450mN
529
8450
mN
300mRL
350mRL
400mRL
450mRL 450mRL
300mRL
350mRL
400mRL
250mRL
5298650mN
529
8650
mN
5298600mN
529
8600
mN
250mRL
529
8700
mN
529
8750
mN
529
8800
mN
5298750mN
5298700mN
5298800mN
VG-06-07VG-06-08
VG-06-07194m
VG-06-06122m
VG-06-08227m
VG-06-06
25
metres
50
Diamond Drill Hole SectionVG-06-06 to VG-06-08
12.50
Date:6/9/2006
Scale: 1:1250 Projection: Non-Earth (meters)
Scale 1:1250Section Origin (top left)409870.28 m E5298700.29 m N487.682 m RLOrientation 178.4 deg
%
+
+++++++
+++
!
)!
8181
!
!
7272
84
!
7884 78 H
84
8888
,3030
!
) )
6078
6078
72
!))8068
80
7268
!
e
8181
74
!!H!!
74
86
84
80
!t
0 0 !
72
787878
72
78
72
!
!
8888
0
88
88
!
) 8282
80
!!!H
74
72
!H
t!t
7878
86
!!i83
0
H
&&&
62
72 74
80
!t
82
!tt
82
!
!
!
5298800 mN
5298700 mN
5298600 mN
5298500 mN
409900 mE
409900 mE
410000 mE
5299000 mN
5299
000
mN
5298900 mN
410000 mE
410400 mE
410200 mE
410100 mE
410100 mE
410200 mE 410300 mE
410300 mE
409800 mE
5298
800
mN
5298
700
mN
5298
600
mN
5298
500
mN
409800 mE
409700 mE
409700 mE
5298
900
mN
meters
0 100 200
410500 mE
411000 mE410000 mE 410500 mE
411000 mE410000 mE
409500 mE
5299
500
mN
408500 mE
408500 mE
409000 mE
409000 mE
5297
500
mN
5298
000
mN
5298000 mN
411500 mE
5298
500
mN
5298500 mN
5299
000
mN
5299000 mN
409500 mE408000 mE
407500 mE 408000 mE
500 1,000
meters0
Index MapIndex MapIndex MapIndex MapIndex MapIndex MapIndex MapIndex MapIndex MapBoundsBoundsBoundsBoundsBoundsBoundsBoundsBoundsBounds
Index MapIndex MapIndex MapIndex MapIndex MapIndex MapIndex MapIndex MapIndex Map
Section BoundsSection BoundsSection BoundsSection BoundsSection BoundsSection BoundsSection BoundsSection BoundsSection Bounds
NR
QFP
QTZ
RHYO
BRX
DIOR
BIF
FET
FELT
FP
INTT
MAFD
IF
IND
MAFT
MAT
META
Lithology Legend
MFLO
Pb %Linegraph1 mm/% at 1:1250
HoleID
EOH
LithoTrace Shade
LithoText
Zn %Linegraph1 mm/% at 1:1250
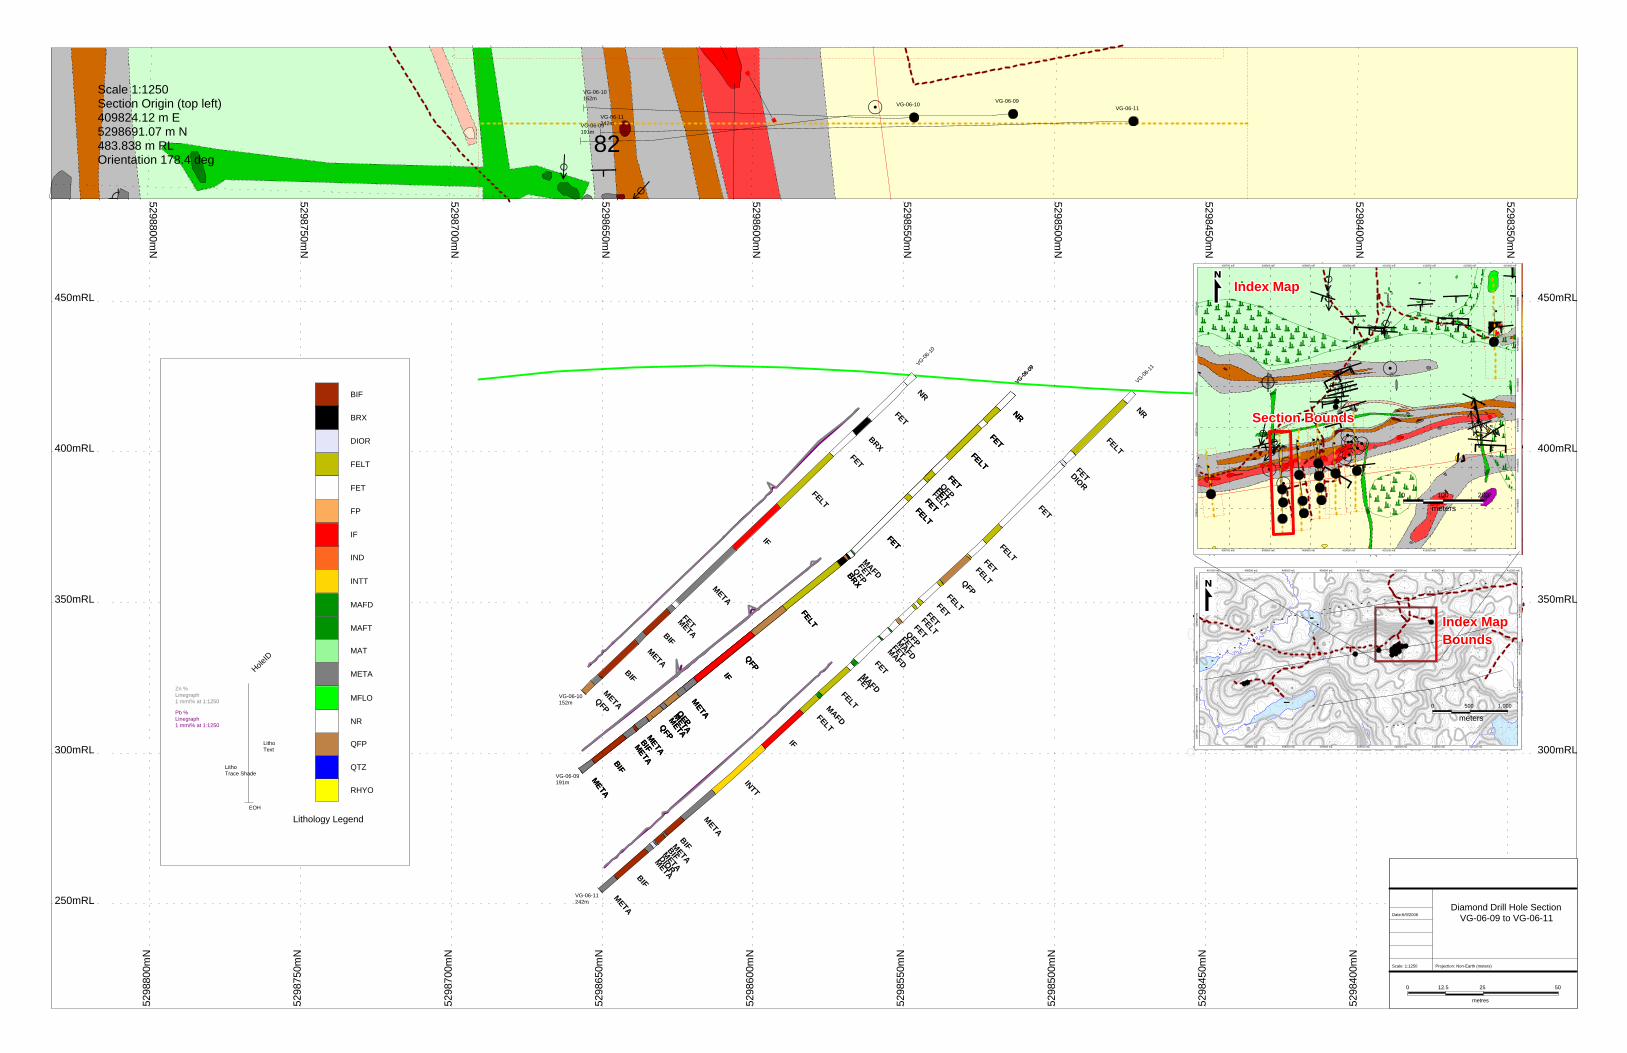
NRVG-06
-11
FELT
VG-06-09
VG-06-09
NRNR
FETDIOR
FET
FELTFETFELTFET
FELT
FET
VG-06-10
FET
FELT
FET
FELT
FETFET
FELTFET
QFP
FETFETFETFELTFET
QFP
NR
FET
QFPFETMAFD
BRXFET
FELT
FET
MAFDFET
FELT
FET
MAFD
FETQFPBRXBRX
FELTFELT
IF
BIF
META
FETMETA
META
FETFETMAFD
FELT
IF
QFPQFP
BIF
FELT
FELTMAFD
IF
IF
INTT
BIFMETA
META
BIFMETAMETAMETA
QFPMETA
QFPMETA
QFPMETA
QFPDIOR
METAMETA
META
BIFMETA
BIFMETAMETABIF
BIF
BIF
META
VG-06-11242m
METAQFP
VG-06-10152m
METAMETA
VG-06-09191m
529
8450
mN
5298400mN
529
8400
mN
5298350mN
529
8350
mN
250mRL
5298450mN
5298550mN
5298500mN
529
8550
mN
529
8600
mN
529
8650
mN
5298600mN
350mRL
400mRL
450mRL 450mRL
400mRL
300mRL
350mRL
300mRL
250mRL
529
8500
mN
5298750mN
5298700mN
5298650mN
5298800mN
529
8700
mN
529
8750
mN
529
8800
mN
+
+
!t82
t
VG-06-10VG-06-11
VG-06-09VG-06-10152m
VG-06-11242mVG-06-09
191m
25
metres
50
Diamond Drill Hole SectionVG-06-09 to VG-06-11
12.5
Date:6/9/2006
Scale: 1:1250 Projection: Non-Earth (meters)
0
Scale 1:1250Section Origin (top left)409824.12 m E5298691.07 m N483.838 m RLOrientation 178.4 deg
%
+
+++++++
+++
!
)!
8181
!
!
7272
84
!
7884 78 H
84
8888
,3030
!
) )
6078
6078
72
!))8068
80
7268
!
e
8181
74
!!H!!
74
86
84
80
!t
0 0 !
72
787878
72
78
72
!
!
8888
0
88
88
!
) 8282
80
!!!H
74
72
!H
t!t
7878
86
!!i83
0
H
&&&
62
72 74
80
!t
82
!tt
82
!
!
!
5298800 mN
5298700 mN
5298600 mN
5298500 mN
409900 mE
409900 mE
410000 mE
5299000 mN
5299
000
mN
5298900 mN
410000 mE
410400 mE
410200 mE
410100 mE
410100 mE
410200 mE 410300 mE
410300 mE
409800 mE
5298
800
mN
5298
700
mN
5298
600
mN
5298
500
mN
409800 mE
409700 mE
409700 mE
5298
900
mN
meters
0 100 200
410500 mE
411000 mE410000 mE 410500 mE
411000 mE410000 mE
409500 mE
5299
500
mN
408500 mE
408500 mE
409000 mE
409000 mE
5297
500
mN
5298
000
mN
5298000 mN
411500 mE
5298
500
mN
5298500 mN
5299
000
mN
5299000 mN
409500 mE408000 mE
407500 mE 408000 mE
500 1,000
meters0
Index MapIndex MapIndex MapIndex MapIndex MapIndex MapIndex MapIndex MapIndex MapBoundsBoundsBoundsBoundsBoundsBoundsBoundsBoundsBounds
Index MapIndex MapIndex MapIndex MapIndex MapIndex MapIndex MapIndex MapIndex Map
Section BoundsSection BoundsSection BoundsSection BoundsSection BoundsSection BoundsSection BoundsSection BoundsSection Bounds
NR
QFP
QTZ
RHYO
BRX
DIOR
BIF
FET
FELT
FP
INTT
MAFD
IF
IND
MAFT
MAT
META
Lithology Legend
MFLO
Pb %Linegraph1 mm/% at 1:1250
HoleID
EOH
LithoTrace Shade
LithoText
Zn %Linegraph1 mm/% at 1:1250

VG-06-12
FET
FELT
NR
IF
METAMAFDMFLO
BIFMETA
META
BIFQFP
BIF
BRXMETA
META
VG-06-12110m
BIF
5298400mN
529
8400
mN
5298450mN
5298500mN
5298600mN
250mRL 529
8450
mN
529
8550
mN
529
8600
mN
5298550mN
500mRL
450mRL
400mRL
350mRL
300mRL
529
8500
mN
529
8650
mN
529
8700
mN
5298650mN
529
8800
mN
5298700mN
5298750mN
5298800mN
5298850mN
250mRL 529
8750
mN
529
8850
mN
500mRL
450mRL
400mRL
350mRL
300mRL
+! 08888
)!H74
!
i
830
H&& 62
72
74VG-06-12110m
VG-06-12
25
metres
50
Diamond Drill Hole SectionVG-06-12
12.5
Date:6/9/2006
Scale: 1:1250 Projection: Non-Earth (meters)
0
Scale 1:1250Section Origin (top left)409956.67 m E5298738.5 m N520.59 m RLOrientation 178.4 deg
%
+
+++++++
+++
!
)!
8181
!
!
7272
84
!
7884 78 H
84
8888
,3030
!
) )
6078
6078
72
!))8068
80
7268
!
e
8181
74
!!H!!
74
86
84
80
!t
0 0 !
72
787878
72
78
72
!
!
8888
0
88
88
!
) 8282
80
!!!H
74
72
!H
t!t
7878
86
!!i83
0
H
&&&
62
72 74
80
!t
82
!tt
82
!
!
!
5298800 mN
5298700 mN
5298600 mN
5298500 mN
409900 mE
409900 mE
410000 mE
5299000 mN
5299
000
mN
5298900 mN
410000 mE
410400 mE
410200 mE
410100 mE
410100 mE
410200 mE 410300 mE
410300 mE
409800 mE
5298
800
mN
5298
700
mN
5298
600
mN
5298
500
mN
409800 mE
409700 mE
409700 mE
5298
900
mN
meters
0 100 200
410500 mE
411000 mE410000 mE 410500 mE
411000 mE410000 mE
409500 mE
5299
500
mN
408500 mE
408500 mE
409000 mE
409000 mE
5297
500
mN
5298
000
mN
5298000 mN
411500 mE
5298
500
mN
5298500 mN
5299
000
mN
5299000 mN
409500 mE408000 mE
407500 mE 408000 mE
500 1,000
meters0
Index MapIndex MapIndex MapIndex MapIndex MapIndex MapIndex MapIndex MapIndex MapBoundsBoundsBoundsBoundsBoundsBoundsBoundsBoundsBounds
Index MapIndex MapIndex MapIndex MapIndex MapIndex MapIndex MapIndex MapIndex Map
Section BoundsSection BoundsSection BoundsSection BoundsSection BoundsSection BoundsSection BoundsSection BoundsSection Bounds
NR
QFP
QTZ
RHYO
BRX
DIOR
BIF
FET
FELT
FP
INTT
MAFD
IF
IND
MAFT
MAT
META
Lithology Legend
MFLO
Pb %Linegraph1 mm/% at 1:1250
HoleID
EOH
LithoTrace Shade
LithoText
Zn %Linegraph1 mm/% at 1:1250
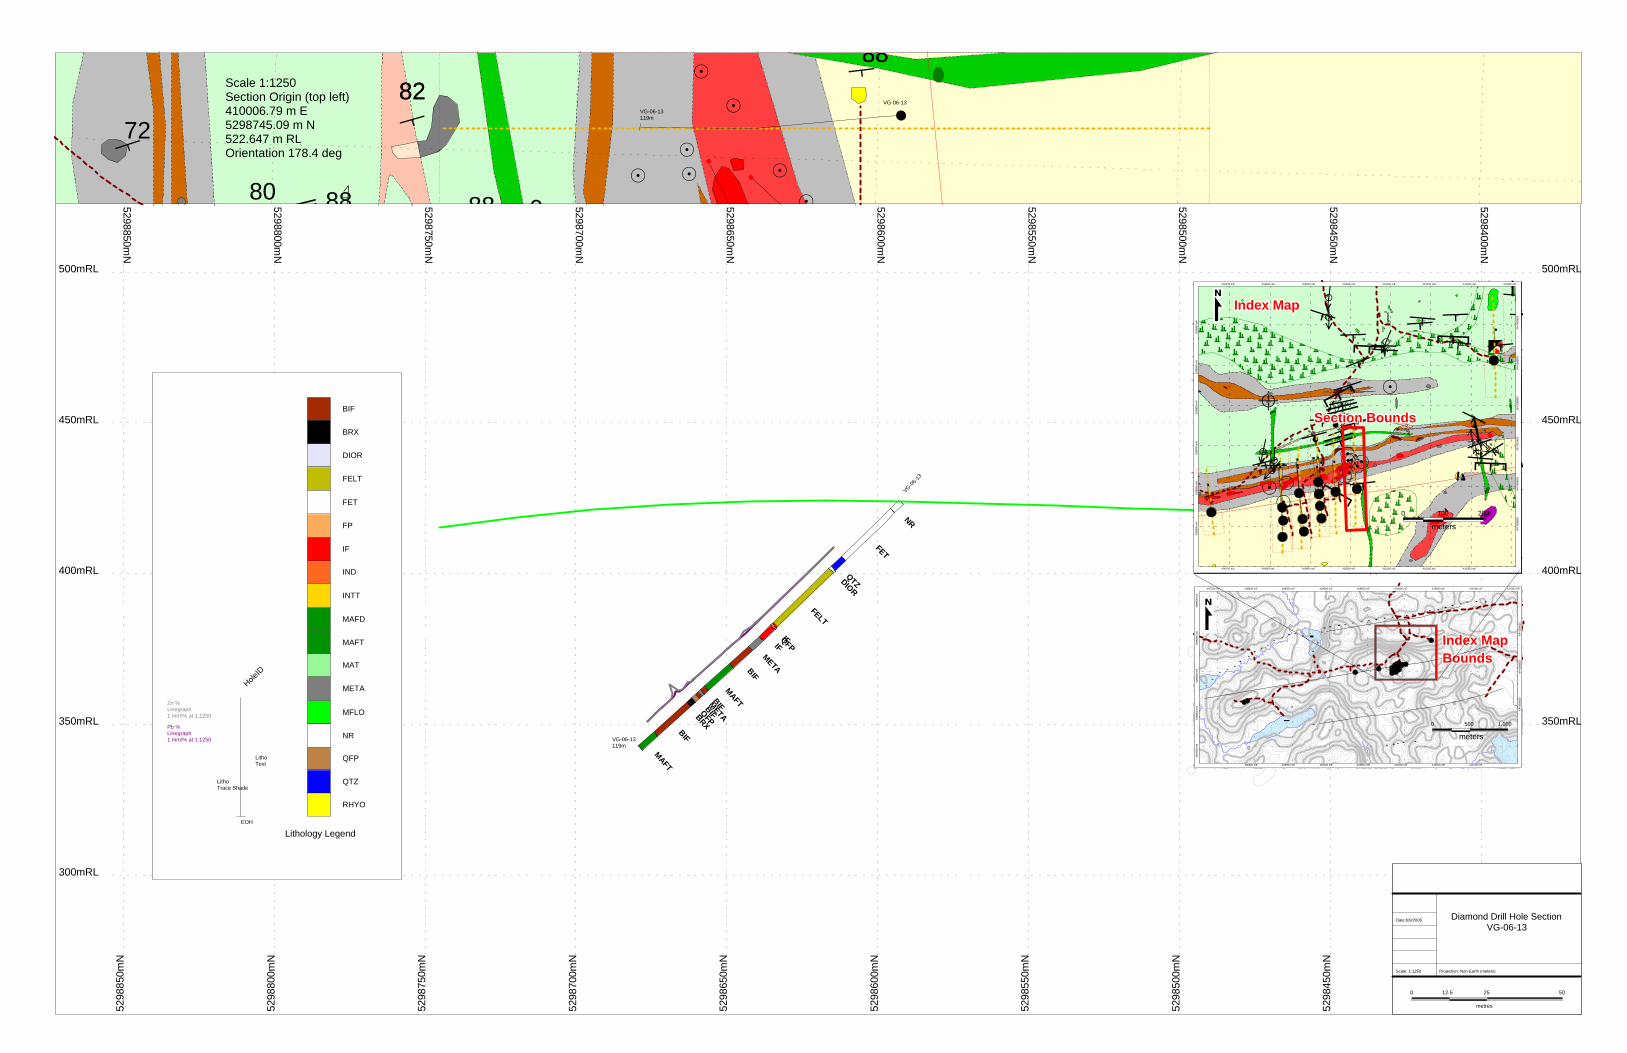
VG-06-13
NR
FET
QTZDIOR
BIFMETA
QFP
FELT
IFIF
BIFMETAMAFT
BRXBIFQFP
BIF
MAFT
VG-06-13119m
5298400mN
529
8400
mN
5298450mN
5298500mN
5298600mN
529
8450
mN
529
8550
mN
529
8600
mN
5298550mN
500mRL
450mRL
400mRL
350mRL
300mRL
529
8500
mN
529
8650
mN
529
8700
mN
5298650mN
529
8800
mN
5298700mN
5298750mN
5298800mN
5298850mN
529
8750
mN
529
8850
mN
500mRL
450mRL
400mRL
350mRL
300mRL
+
+
+
+ +
++
!8888
08888
!
)
8282
80
!72VG-06-13119m
VG-06-13
25
metres
50
Diamond Drill Hole SectionVG-06-13
12.5
Date:6/9/2006
Scale: 1:1250 Projection: Non-Earth (meters)
0
Scale 1:1250Section Origin (top left)410006.79 m E5298745.09 m N522.647 m RLOrientation 178.4 deg
%
+
+++++++
+++
!
)!
8181
!
!
7272
84
!
7884 78 H
84
8888
,3030
!
) )
6078
6078
72
!))8068
80
7268
!
e
8181
74
!!H!!
74
86
84
80
!t
0 0 !
72
787878
72
78
72
!
!
8888
0
88
88
!
) 8282
80
!!!H
74
72
!H
t!t
7878
86
!!i83
0
H
&&&
62
72 74
80
!t
82
!tt
82
!
!
!
5298800 mN
5298700 mN
5298600 mN
5298500 mN
409900 mE
409900 mE
410000 mE
5299000 mN
5299
000
mN
5298900 mN
410000 mE
410400 mE
410200 mE
410100 mE
410100 mE
410200 mE 410300 mE
410300 mE
409800 mE
5298
800
mN
5298
700
mN
5298
600
mN
5298
500
mN
409800 mE
409700 mE
409700 mE
5298
900
mN
meters
0 100 200
410500 mE
411000 mE410000 mE 410500 mE
411000 mE410000 mE
409500 mE
5299
500
mN
408500 mE
408500 mE
409000 mE
409000 mE
5297
500
mN
5298
000
mN
5298000 mN
411500 mE
5298
500
mN
5298500 mN
5299
000
mN
5299000 mN
409500 mE408000 mE
407500 mE 408000 mE
500 1,000
meters
0
Index MapIndex MapIndex MapIndex MapIndex MapIndex MapIndex MapIndex MapIndex MapBoundsBoundsBoundsBoundsBoundsBoundsBoundsBoundsBounds
Index MapIndex MapIndex MapIndex MapIndex MapIndex MapIndex MapIndex MapIndex Map
Section BoundsSection BoundsSection BoundsSection BoundsSection BoundsSection BoundsSection BoundsSection BoundsSection Bounds
NR
QFP
QTZ
RHYO
BRX
DIOR
BIF
FET
FELT
FP
INTT
MAFD
IF
IND
MAFT
MAT
META
Lithology Legend
MFLO
Pb %Linegraph1 mm/% at 1:1250
HoleID
EOH
LithoTrace Shade
LithoText
Zn %Linegraph1 mm/% at 1:1250
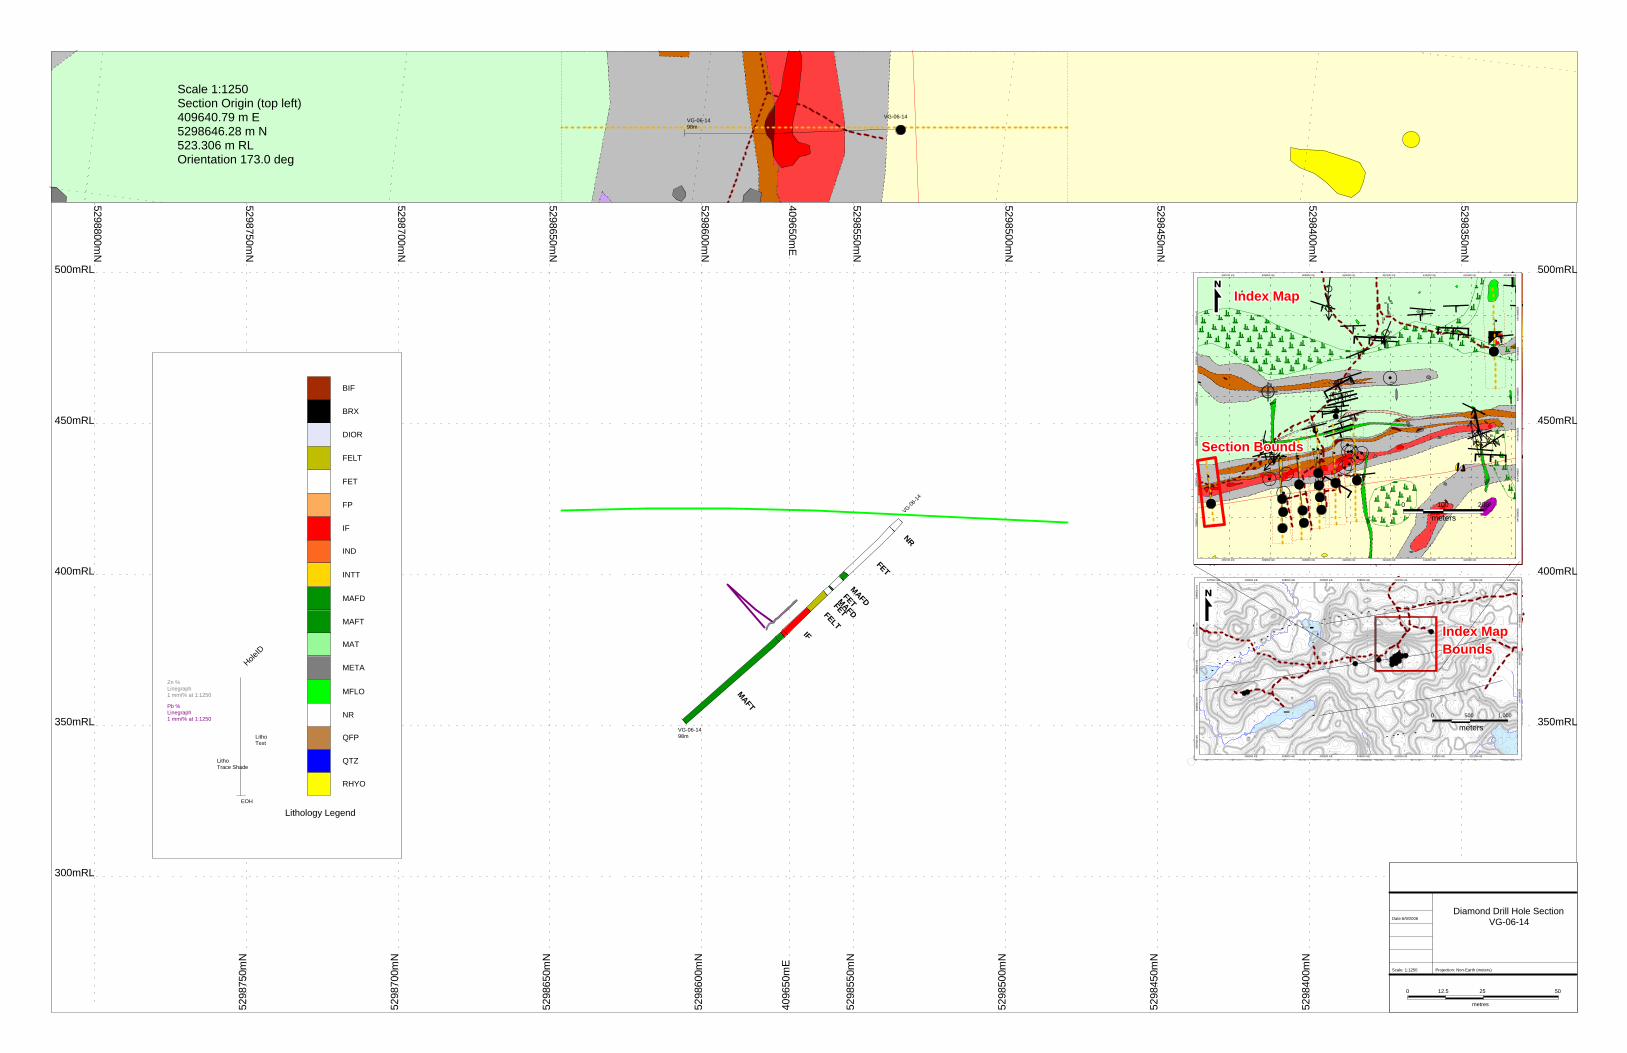
VG-06-1498m
VG-06-14
VG-06-14
NR
FET
FETFELTMAFD
MAFDFET
IF
MAFT
VG-06-1498m
529
8350
mN
300mRL
350mRL
400mRL
5298400mN
5298350mN
529
8400
mN
529
8450
mN
5298500mN
529
8500
mN
5298450mN
450mRL
350mRL
400mRL
300mRL
5298550mN
529
8650
mN
5298600mN
529
8600
mN
450mRL
500mRL 500mRL
529
8550
mN
5298700mN
5298650mN
529
8700
mN
529
8750
mN
409650mE
409
650m
E
5298800mN
5298750mN
Scale 1:1250Section Origin (top left)409640.79 m E5298646.28 m N523.306 m RLOrientation 173.0 deg
25
metres
50
Diamond Drill Hole SectionVG-06-14
12.5
Date:6/9/2006
Scale: 1:1250 Projection: Non-Earth (meters)
0
%
+
+++++++
+++
!
)!
8181
!
!
7272
84
!
7884 78 H
84
8888
,3030
!
) )
6078
6078
72
!))8068
80
7268
!
e
8181
74
!!H!!
74
86
84
80
!t
0 0 !
72
787878
72
78
72
!
!
8888
0
88
88
!
) 8282
80
!!!H
74
72
!H
t!t
7878
86
!!i83
0
H
&&&
62
72 74
80
!t
82
!tt
82
!
!
!
5298800 mN
5298700 mN
5298600 mN
5298500 mN
409900 mE
409900 mE
410000 mE
5299000 mN
5299
000
mN
5298900 mN
410000 mE
410400 mE
410200 mE
410100 mE
410100 mE
410200 mE 410300 mE
410300 mE
409800 mE
5298
800
mN
5298
700
mN
5298
600
mN
5298
500
mN
409800 mE
409700 mE
409700 mE
5298
900
mN
meters
0 100 200
410500 mE
411000 mE410000 mE 410500 mE
411000 mE410000 mE
409500 mE
5299
500
mN
408500 mE
408500 mE
409000 mE
409000 mE
5297
500
mN
5298
000
mN
5298000 mN
411500 mE
5298
500
mN
5298500 mN
5299
000
mN
5299000 mN
409500 mE408000 mE
407500 mE 408000 mE
500 1,000
meters0
Index MapIndex MapIndex MapIndex MapIndex MapIndex MapIndex MapIndex MapIndex MapBoundsBoundsBoundsBoundsBoundsBoundsBoundsBoundsBounds
Index MapIndex MapIndex MapIndex MapIndex MapIndex MapIndex MapIndex MapIndex Map
Section BoundsSection BoundsSection BoundsSection BoundsSection BoundsSection BoundsSection BoundsSection BoundsSection Bounds
NR
QFP
QTZ
RHYO
BRX
DIOR
BIF
FET
FELT
FP
INTT
MAFD
IF
IND
MAFT
MAT
META
Lithology Legend
MFLO
Pb %Linegraph1 mm/% at 1:1250
HoleID
EOH
LithoTrace Shade
LithoText
Zn %Linegraph1 mm/% at 1:1250
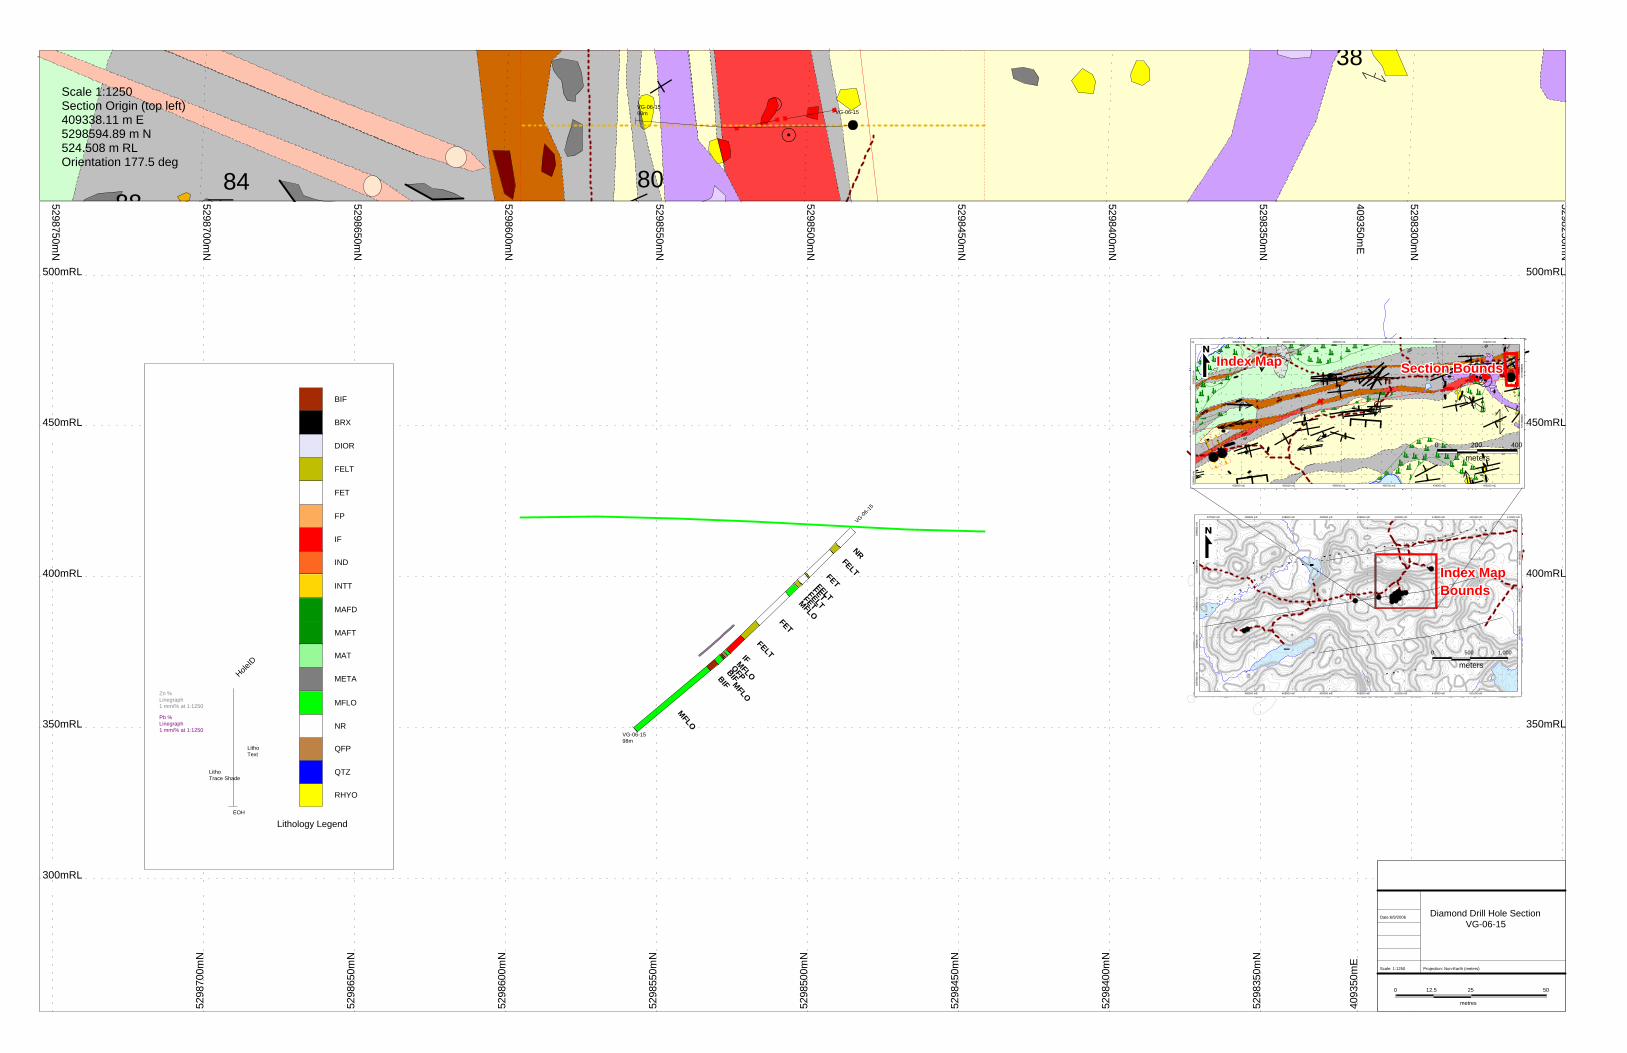
NRVG-06
-15
FET
FELTFET
FELTMFLO
FET
IFFELT
FELT
FET
QFPBIFMFLO
MFLO
BIF
MFLO
VG-06-1598m
400mRL
350mRL
529
8300
mN
5298250mN
300mRL
5298300mN
529
8350
mN
5298350mN
529
8450
mN
5298450mN
5298400mN
529
8400
mN
400mRL
5298500mN
529
8500
mN
529
8600
mN
450mRL 450mRL
500mRL 500mRL 409350m
E
409
350m
E
529
8550
mN
5298550mN
5298650mN
5298700mN
529
8700
mN
529
8650
mN
5298600mN
5298750mN
300mRL
350mRL
+
+
!
#
!808488
38)
VG-06-1598m VG-06-15
25
metres
50
Diamond Drill Hole SectionVG-06-15
12.50
Date:6/9/2006
Scale: 1:1250 Projection: Non-Earth (meters)
Scale 1:1250Section Origin (top left)409338.11 m E5298594.89 m N524.508 m RLOrientation 177.5 deg
+++ ++
5,600
!#!
!80
88
38
!!)
)
70
5876
!68
88!!280
28
!#)38
78
84
88
86
!! H!
!84
!!
!t
284
88
!!
78
e
82
8086
!H
60
80
88
!#!
86
88
#(
80
12
84
!
#!22
88
82
86
88
!!##H
t
80
80
88
!2
280
70
!#
)
22
82
409250 mE408750 mE
408750 mE
409000 mE
409000 mE
5298250 mN
409250 mE
5298500 mN
408500 mE
408500 mE
5298
500
mN
5298
000
mN
5298
250
mN
408250 mE
mE 408000 mE
408000 mE
408250 mE
meters
4000 200
410500 mE
411000 mE410000 mE 410500 mE
411000 mE410000 mE
409500 mE
5299
500
mN
408500 mE
408500 mE
409000 mE
409000 mE
5297
500
mN
5298
000
mN
5298000 mN
411500 mE
5298
500
mN
5298500 mN
5299
000
mN
5299000 mN
409500 mE408000 mE
407500 mE 408000 mE
500 1,000
meters
0
Index MapIndex MapIndex MapIndex MapIndex MapIndex MapIndex MapIndex MapIndex MapBoundsBoundsBoundsBoundsBoundsBoundsBoundsBoundsBounds
Index MapIndex MapIndex MapIndex MapIndex MapIndex MapIndex MapIndex MapIndex Map Section BoundsSection BoundsSection BoundsSection BoundsSection BoundsSection BoundsSection BoundsSection BoundsSection Bounds
NR
QFP
QTZ
RHYO
BRX
DIOR
BIF
FET
FELT
FP
INTT
MAFD
IF
IND
MAFT
MAT
META
Lithology Legend
MFLO
Pb %Linegraph1 mm/% at 1:1250
HoleID
EOH
LithoTrace Shade
LithoText
Zn %Linegraph1 mm/% at 1:1250

NR
VG-06-16
DIOR
FELT
IF
FELT
BIF
BIF
METABIF
MFLO
MFLORHYO
VG-06-16110m
407850mE
407900mE
407
900m
E
5297950mN
5298000mN
529
8000
mN
450mRL
250mRL
300mRL
350mRL
400mRL
529
7900
mN
529
7950
mN
5297900mN
529
8050
mN
529
8100
mN
5298050mN
5298100mN
5298350mN
407
850m
E
407800mE
407
800m
E
5298200mN
529
8200
mN
5298150mN
529
8150
mN
350mRL
529
8250
mN
5298250mN
250mRL
300mRL
529
8300
mN
5298300mN
400mRL
450mRL
VG-06-16110m
VG-06-16
25
metres
50
Diamond Drill Hole SectionVG-06-16
12.5
Date:6/9/2006
Scale: 1:1250 Projection: Non-Earth (meters)
0
Scale 1:1250Section Origin (top left)407814.78 m E5298194.98 m N508.032 m RLOrientation 159.6 deg
+++ ++
5,600
!#!
!80
88
38
!!)
)
70
5876
!68
88!!28028
!#)38
78
84
88
86
!! H!
!84
!!
!t
284
88
!!
78
e
82
8086
!H
60
80
88
!#!
86
88
#(
80
12
84
!
#!22
88
82
86
88
!!##H
t
80
80
88
!2
280
70
!#
)
22
82
409250 mE408750 mE
408750 mE
409000 mE
409000 mE
5298250 mN
409250 mE
5298500 mN
408500 mE
408500 mE
5298
500
mN
5298
000
mN
5298
250
mN
408250 mE
mE 408000 mE
408000 mE
408250 mE
meters
4000 200
410500 mE
411000 mE410000 mE 410500 mE
411000 mE410000 mE
409500 mE
5299
500
mN
408500 mE
408500 mE
409000 mE
409000 mE
5297
500
mN
5298
000
mN
5298000 mN
411500 mE
5298
500
mN
5298500 mN
5299
000
mN
5299000 mN
409500 mE408000 mE
407500 mE 408000 mE
500 1,000
meters
0
Index MapIndex MapIndex MapIndex MapIndex MapIndex MapIndex MapIndex MapIndex MapBoundsBoundsBoundsBoundsBoundsBoundsBoundsBoundsBounds
Index MapIndex MapIndex MapIndex MapIndex MapIndex MapIndex MapIndex MapIndex Map
Section BoundsSection BoundsSection BoundsSection BoundsSection BoundsSection BoundsSection BoundsSection BoundsSection Bounds
NR
QFP
QTZ
RHYO
BRX
DIOR
BIF
FET
FELT
FP
INTT
MAFD
IF
IND
MAFT
MAT
META
Lithology Legend
MFLO
Pb %Linegraph1 mm/% at 1:1250
HoleID
EOH
LithoTrace Shade
LithoText
Zn %Linegraph1 mm/% at 1:1250
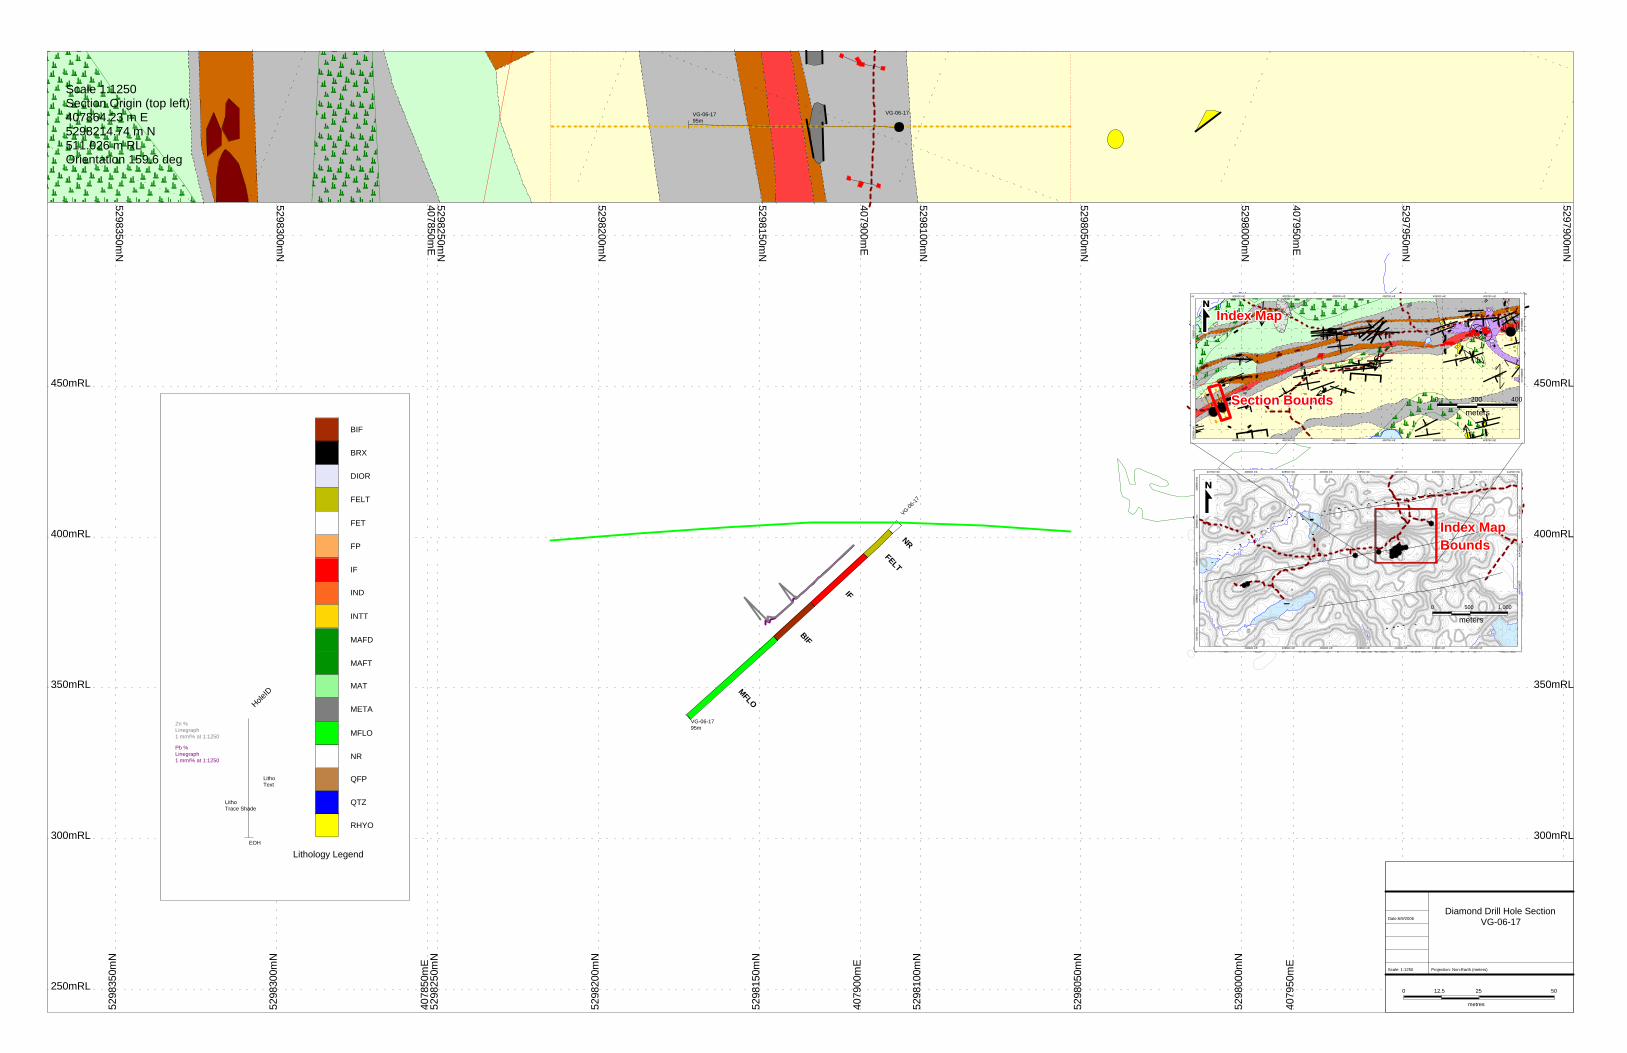
VG-06-17
NR
FELT
IF
MFLO
VG-06-1795m
BIF
450mRL
529
7950
mN
5297900mN
529
8050
mN
5298100mN
529
8100
mN
5298050mN
5298000mN
529
8000
mN
5297950mN
407900mE
407950mE
407
900m
E
407
950m
E
300mRL
250mRL
5298200mN
350mRL
400mRL
5298350mN
5298150mN
5298300mN
5298250mN
407850mE
407
850m
E
529
8150
mN
250mRL
300mRL
529
8200
mN
529
8250
mN
529
8350
mN
529
8300
mN
350mRL
400mRL
450mRL
VG-06-1795m
VG-06-17
25
metres
50
Diamond Drill Hole SectionVG-06-17
12.5
Date:6/9/2006
Scale: 1:1250 Projection: Non-Earth (meters)
0
Scale 1:1250Section Origin (top left)407864.23 m E5298214.74 m N511.026 m RLOrientation 159.6 deg
+++ ++
5,600
!#!
!80
88
38
!!)
)
70
5876
!68
88!!28028
!#)38
78
84
88
86
!! H!
!84
!!
!t
284
88
!!
78
e
82
8086
!H
60
80
88
!#!
86
88
#(
80
12
84
!
#!22
88
82
86
88
!!##H
t
80
80
88
!2
280
70
!#
)
22
82
409250 mE408750 mE
408750 mE
409000 mE
409000 mE
5298250 mN
409250 mE
5298500 mN
408500 mE
408500 mE
5298
500
mN
5298
000
mN
5298
250
mN
408250 mE
mE 408000 mE
408000 mE
408250 mE
meters
4000 200
410500 mE
411000 mE410000 mE 410500 mE
411000 mE410000 mE
409500 mE
5299
500
mN
408500 mE
408500 mE
409000 mE
409000 mE
5297
500
mN
5298
000
mN
5298000 mN
411500 mE
5298
500
mN
5298500 mN
5299
000
mN
5299000 mN
409500 mE408000 mE
407500 mE 408000 mE
500 1,000
meters
0
Index MapIndex MapIndex MapIndex MapIndex MapIndex MapIndex MapIndex MapIndex MapBoundsBoundsBoundsBoundsBoundsBoundsBoundsBoundsBounds
Index MapIndex MapIndex MapIndex MapIndex MapIndex MapIndex MapIndex MapIndex Map
Section BoundsSection BoundsSection BoundsSection BoundsSection BoundsSection BoundsSection BoundsSection BoundsSection Bounds
NR
QFP
QTZ
RHYO
BRX
DIOR
BIF
FET
FELT
FP
INTT
MAFD
IF
IND
MAFT
MAT
META
Lithology Legend
MFLO
Pb %Linegraph1 mm/% at 1:1250
HoleID
EOH
LithoTrace Shade
LithoText
Zn %Linegraph1 mm/% at 1:1250

VenCan Gold Corporation Cayenne-Chili Property Exploration
75
.VenCan Gold CORPORATION
VenCan Gold Corporation Cayenne-Chili Property Exploration
76
Bradley Brothers used Reflex equipment on all diamond drill holes to measure down hole azimuths and declinations. Measurement were taken after the casing, at an approximate depth of 20 meters, and at the end of the drill hole, and dependent of the hole depth towards the centre of the hole. All readings were subject to hole conditions and magnetism of the surrounding rocks. The drill core was hauled to the drill camp at the end of each drill shift where geological logging and RQD/recovery measurements were undertaken by qualified staff. Following the completion of all logging, the marked core was digitally photographed and subsequently cut in half using a diamond-bladed rock saw. For those intervals where the drill core was extremely silicious, a Longyear mechanical splitter was used to split the core in half in order to keep up with the drilling. The core was usually sampled in 1.0 to 1.5 meter intervals and according to lithological intervals. A copy of the core photos are included on a DVD disk located in the accompanying map folder. Samples were placed in doubled plastic bags along with a numbered Tyvek tag, with the sample numbers also marked on the outside of each sample bag. The samples were then re-bagged in rice sacks for transport to Swastika Laboratories Ltd. located in Swastika Ontario. Once a truck load of samples had been accumulated, the samples were trucked to Swastika Laboratories by VenCan personnel, generally once every two weeks. The reject material is being stored at the Swastika Laboratories until further notice. The remaining half of the sampled core is retained in the original core boxes at the Moneta Mines core storage facility in Timmins. An extensive QA/QC program was followed throughout the program consisting of the insertion of standards, blanks and duplicates, the parameters and results of which will be presented in a later section of this report. The analytical methods used for gold and silver are fire assay with atomic absorption or gravimetric finish. The analytical methods used for base metals (Cu, Pb, Zn) are aqua-regia digestion with atomic absorption finish. The geological logging was recorded in the field on hand written logs, with the hand written logs later entered into a Microsoft Excel template file formatted with data verification parameters. These files were then edited by a third party and then extracted and imported into an Excel database. Drill logs, assay results, and assay certificates are presented in the accompanying appendices.
9.7.1 Jefferson Deposit and Burton Shaft Area The primary focus of the summer 2006 exploration program was VMS style mineralization in the area of the Jefferson Zn-Pb deposit (Jefferson) which contains an historical (1948) non-NI 43-101 compliant resource estimate of 30,100 tons at 7.05% Zn and 4.58% Pb. The historical work defined “massive sulphides enriched in zinc and lead over a strike length of 150 meters and to a vertical depth of 30 metres”. Deeper drilling to a vertical depth of 85 metres in 1950 indicated continuity of the zinc-lead enriched sulphide body. Some of the better drill intersections documented by the historical work on the Jefferson deposit included 4.43% Zn and 1.25% Pb over 22.9 meters and 9.1% Zn and 11.5% Pb over 6.9 meters.

VenCan Gold Corporation Cayenne-Chili Property Exploration
77
Work by Falconbridge Limited in the 1980’s reinterpreted the mineralization at the Jefferson deposit as associated with cross-cutting fractures and so not strictly of the VMS type. The results of the 2006 exploration program conducted by VenCan supports this interpretation, however, the Company believes that the known mineralization may be stringer type mineralization that indicates that potential exists to discover a proximal VMS source on VenCan’s property. A total of 12 diamond drill holes were completed by VenCan during the 2006 exploration program in the area of the Jefferson (holes VG-06-02 through VG-06-13) in an attempt to replicate historical results. The best drill intersections encountered in the 2006 program include 7.24% Zn over 1.85 meters (VG-06-02), 2.34% Zn and 2.10% Pb over 8.70 meters (VG-06-04), 1.83% Zn and 1.29% Pb over 10.20 meters (VG-06-05), and 1.48% Zn over 13.60 meters (VG-06-12). Two holes were drilled to the west of the Jefferson to test for strike extension of known mineralization. HoleVG-06-14 was drilled 300 meters to the west and encountered 8.93% Pb over 3.10 meters. Drill-Hole VG-06-15 was drilled 600 meters to the west and encountered no significant mineralization. VenCan was not able to confirm the thickness or tenor of mineralization at the Jefferson as was historically reported. The gravity survey outlined a pronounced positive anomaly approximately 550 metres in length coincident with the Jefferson deposit. Drilling was also completed near the Burton Shaft Zn-Pb-Au occurrence located north-east of the Jefferson deposit which is interpreted to lie within a limb of a complementary syncline to the Jefferson “anticline”. A single drill hole by Hollinger in 1929 intersected 7.5% Zn, 1.5%Pb and 7.5 g/t Au over 4.8 meters. A hole drilled immediately adjacent to the Burton Shaft during the 2006 exploration program (VG-06-01) encountered 1.55% Zn and 0.35% Pb over 6.05 meters with no significant gold mineralization.
9.7.2 ‘VenCan Zinc Showing’ Area The area around the historical drill intersection of 11.98% Zn over 3.2 meters located approximately 2.0 km to the west of the Jefferson Deposit was investigated during the 2006 exploration program, and an outcrop of sphalerite-rich mineralization corresponding to an AeroTEM helicopter-borne EM/Magnetometer anomaly was discovered. Grab samples from this outcrop yielded assay values ranging from 11.2% Zn to 17.96% Zn. VenCan drill hole VG-06-16 later completed beneath the outcrop intersected 4.22% over 16.85 meters including 7.27% Zn over 8.50 meters on a IP, magnetometer and gravity anomaly that extends 500 meters to the west. Drill hole VG-06-17 drilled 50 meters east of VG-06-16 intersected 4.45% Zn over 1.38 meters and 2.94% Zn over 4.6 meters, the eastward extension of the mineralization encountered in VG-06-16.
Table 9.7-2 – Summary of Significant DDH Intersections
DDH # Area From (m)
To (m)
Interval (m)
Pb (%)
Zn (%)
VG-06-01 Burton 19.25 25.30 6.05 0.35 1.55 VG-06-02 Jefferson 14.20 17.90 3.70 1.10 2.96 26.40 28.25 1.85 7.24 0.13
VG-06-03 Jefferson 11.55 12.70 1.15 2.42 3.79 47.95 50.70 2.75 0.37 1.33
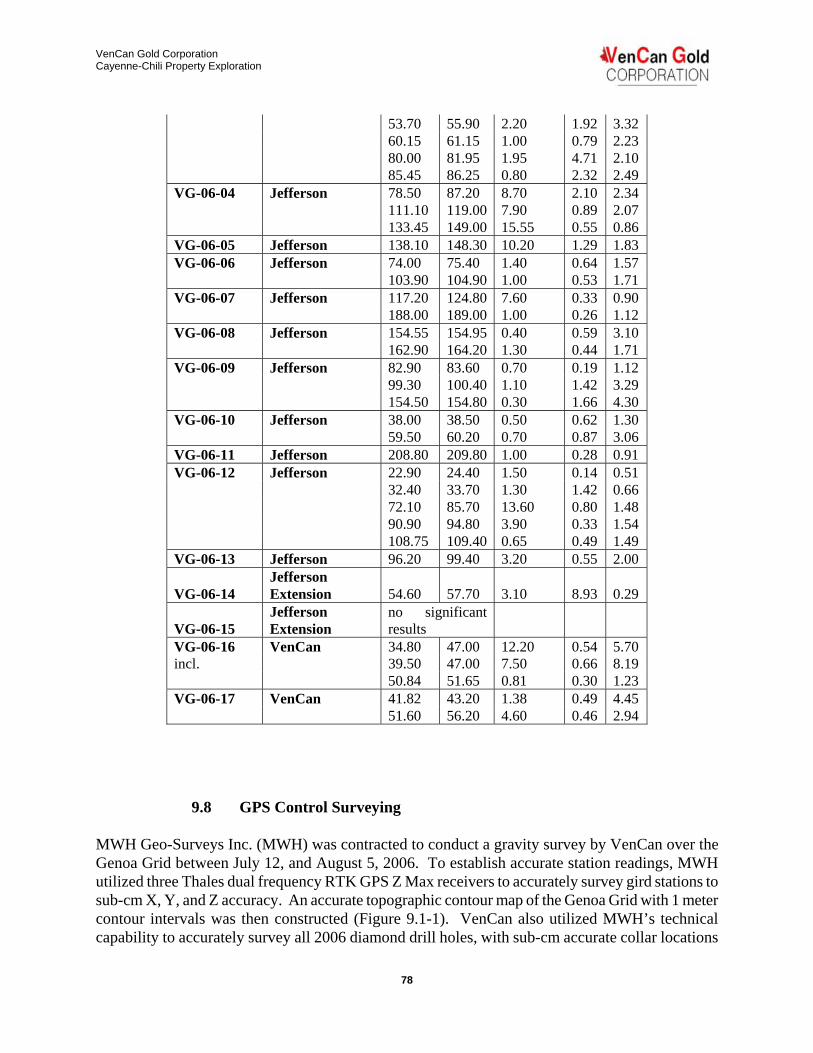
VenCan Gold Corporation Cayenne-Chili Property Exploration
78
53.70 55.90 2.20 1.92 3.32 60.15 61.15 1.00 0.79 2.23 80.00 81.95 1.95 4.71 2.10 85.45 86.25 0.80 2.32 2.49 VG-06-04 Jefferson 78.50 87.20 8.70 2.10 2.34 111.10 119.00 7.90 0.89 2.07 133.45 149.00 15.55 0.55 0.86 VG-06-05 Jefferson 138.10 148.30 10.20 1.29 1.83 VG-06-06 Jefferson 74.00 75.40 1.40 0.64 1.57 103.90 104.90 1.00 0.53 1.71 VG-06-07 Jefferson 117.20 124.80 7.60 0.33 0.90 188.00 189.00 1.00 0.26 1.12 VG-06-08 Jefferson 154.55 154.95 0.40 0.59 3.10 162.90 164.20 1.30 0.44 1.71 VG-06-09 Jefferson 82.90 83.60 0.70 0.19 1.12 99.30 100.40 1.10 1.42 3.29 154.50 154.80 0.30 1.66 4.30 VG-06-10 Jefferson 38.00 38.50 0.50 0.62 1.30 59.50 60.20 0.70 0.87 3.06 VG-06-11 Jefferson 208.80 209.80 1.00 0.28 0.91 VG-06-12 Jefferson 22.90 24.40 1.50 0.14 0.51 32.40 33.70 1.30 1.42 0.66 72.10 85.70 13.60 0.80 1.48 90.90 94.80 3.90 0.33 1.54 108.75 109.40 0.65 0.49 1.49 VG-06-13 Jefferson 96.20 99.40 3.20 0.55 2.00
VG-06-14 Jefferson Extension 54.60 57.70 3.10 8.93 0.29
VG-06-15 Jefferson Extension
no significant results
VG-06-16 VenCan 34.80 47.00 12.20 0.54 5.70 incl. 39.50 47.00 7.50 0.66 8.19 50.84 51.65 0.81 0.30 1.23 VG-06-17 VenCan 41.82 43.20 1.38 0.49 4.45 51.60 56.20 4.60 0.46 2.94
9.8 GPS Control Surveying MWH Geo-Surveys Inc. (MWH) was contracted to conduct a gravity survey by VenCan over the Genoa Grid between July 12, and August 5, 2006. To establish accurate station readings, MWH utilized three Thales dual frequency RTK GPS Z Max receivers to accurately survey gird stations to sub-cm X, Y, and Z accuracy. An accurate topographic contour map of the Genoa Grid with 1 meter contour intervals was then constructed (Figure 9.1-1). VenCan also utilized MWH’s technical capability to accurately survey all 2006 diamond drill holes, with sub-cm accurate collar locations
VenCan Gold Corporation Cayenne-Chili Property Exploration
79
listed in Table 9.7-1. Technical parameters of the GPS control surveying conducted by MWH, as well as accurate grid station coordinates, are attached in Appendix A 10.0 Quality Assurance/Quality Control VenCan implemented protocols for a quality assurance and quality control program incorporating: standards, blanks, and quartered duplicate samples during the 2006 exploration program. A quality assurance and quality control program incorporating: standards, blanks, and duplicate samples was also implemented during this same time period for the soil sampling survey. The samples were collected to develop the QA/QC database for the project in anticipation of the requirements for the completion of resource/reserve estimations for feasibility studies and to provide controls for data management and data quality of the data.
10.1 QA/QC Protocol – DDH Core Drill samples collected during the Genoa drill program were submitted to Swastika Laboratories Ltd. (Swastika) located in Swastika Ontario for analysis. The samples were analyzed for Au, Ag, Cu, Pb and Zn. Appendix A of this report provides a thorough description of the analytical procedures followed by Swastika. The QA-QC sample insertion protocol for the diamond drill sampling includes the following samples: • 4 certified standard control samples per 100 samples; • 3 blank samples of barren material per 100 samples; • 1 split and quartered core duplicate sample per 100 samples. Some 56 control samples were inserted within a sample sequence of 575 core samples from the Genoa drill program. The control samples make up 9.74% of the total sample analyses. The following sections briefly review each type of QA/QC sample and the results for the diamond drill samples.
10.2 Certified Standard Controls-DDH Core VenCan used one certified standard purchased from CDN Resource Laboratories Ltd. of Delta B.C. Canada. CDN Resources Laboratories provides reference material with a range of low-grade, mid grade, and high-grade precious and base metal standards with known values, and within statistically acceptable limits. The maximum and minimum limits are plus two standard deviations (+2st.dev.) and minus two standard deviations (-2st.dev.) from the mean value of the control sample. Table 10-1 lists the statistical values for the control samples.
Table 10.1: Standard Reference Material-DDH Core

VenCan Gold Corporation Cayenne-Chili Property Exploration
80
Standard ID Au Grade (ppm)
Cu Grade (%)
Zn Grade (%)
HLLC 0.85 1.47 3.0 A total of 28 certified standards were inserted within the drill core sample sequence. All of the results for the certified standards fell between the minimum and maximum range of acceptable values. Therefore Swastika Laboratories was not required to re-analyze any certificates because of unacceptable standard values.
10.3 Blank Samples-DDH Core VenCan sourced material for use as blank samples near the Genoa property. The rock employed as a blank consisted of massive unaltered granite. Although the samples are considered to consist of barren rock without any appreciable precious metal or base metal content, occasionally low levels of mineralization may occur which could negate the usefulness of these samples. A total of 22 blank samples were submitted within the sample sequence for the recent program. The results for the blanks all fell within acceptable limits for all the elements.
10.4 Duplicate Samples-DDH Core The duplicate samples were prepared by splitting the diamond drill core sample and submitting two samples for the same sample interval. Differences between the sample values normally reflect the inherent nugget effect of the mineralization. A total of six (6) samples were submitted and the results are presented on graphs in Appendix A. The distribution for the elements analysed follows the reference with a correlation coefficient for gold-0.0309, Ag-0.9911, Cu-0.9824, Pb-0.992, and Zn-0.9987.
10.5 QA/QC Conclusions and Recommendations-DDH Core The results for the QA-QC samples are acceptable, and the QA-QC program has performed as intended. VenCan has identified where potential problems could occur in the sample preparation and analytical stages. Recommendations are as follows:
• A designated individual should solely be responsible for preparation and insertion of QA-QC samples. This person would also be responsible for inventory control of standard materials.
• Pulp blanks, material with known values, should be inserted in the sample stream, 1 per 100
samples, while cleaner blank material should be sourced to reduce the possibility of low-grade mineralization contamination.
• A selection of pulp duplicates from Swastika should be sent to a second laboratory for an
external check. About 3% covering all grade ranges for each metal should be submitted to the lab.
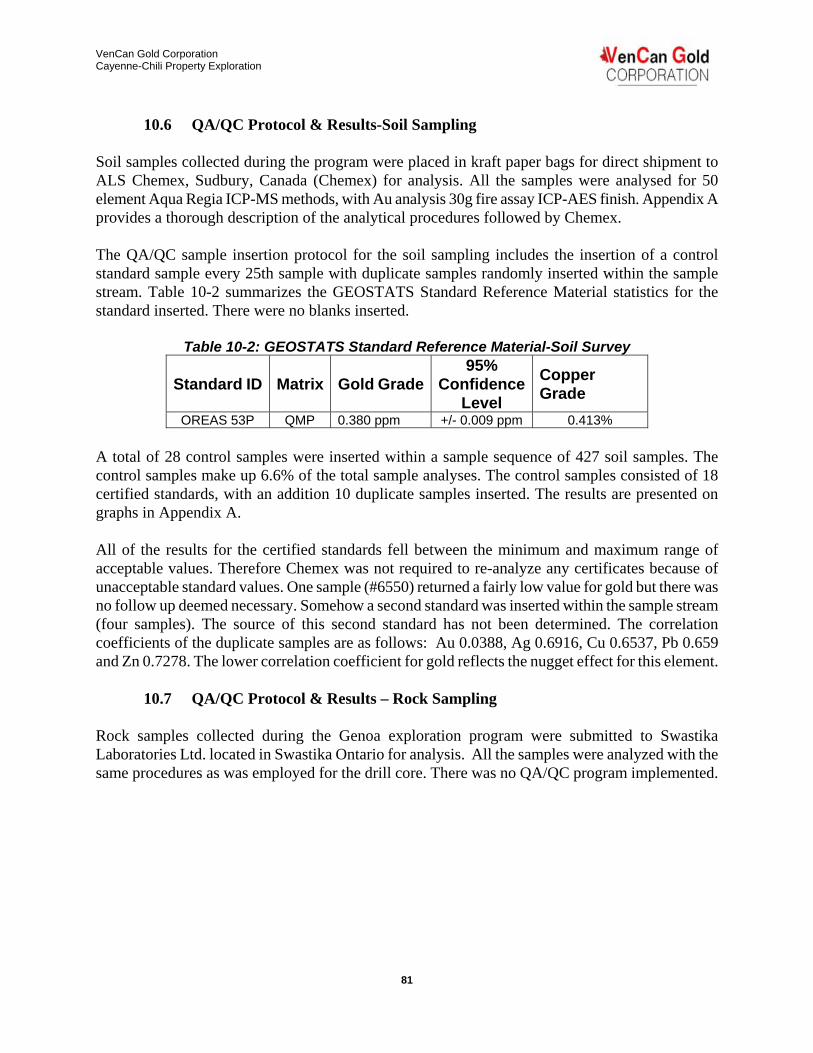
VenCan Gold Corporation Cayenne-Chili Property Exploration
81
10.6 QA/QC Protocol & Results-Soil Sampling Soil samples collected during the program were placed in kraft paper bags for direct shipment to ALS Chemex, Sudbury, Canada (Chemex) for analysis. All the samples were analysed for 50 element Aqua Regia ICP-MS methods, with Au analysis 30g fire assay ICP-AES finish. Appendix A provides a thorough description of the analytical procedures followed by Chemex. The QA/QC sample insertion protocol for the soil sampling includes the insertion of a control standard sample every 25th sample with duplicate samples randomly inserted within the sample stream. Table 10-2 summarizes the GEOSTATS Standard Reference Material statistics for the standard inserted. There were no blanks inserted.
Table 10-2: GEOSTATS Standard Reference Material-Soil Survey
Standard ID Matrix Gold Grade95%
Confidence Level
Copper Grade
OREAS 53P QMP 0.380 ppm +/- 0.009 ppm 0.413% A total of 28 control samples were inserted within a sample sequence of 427 soil samples. The control samples make up 6.6% of the total sample analyses. The control samples consisted of 18 certified standards, with an addition 10 duplicate samples inserted. The results are presented on graphs in Appendix A. All of the results for the certified standards fell between the minimum and maximum range of acceptable values. Therefore Chemex was not required to re-analyze any certificates because of unacceptable standard values. One sample (#6550) returned a fairly low value for gold but there was no follow up deemed necessary. Somehow a second standard was inserted within the sample stream (four samples). The source of this second standard has not been determined. The correlation coefficients of the duplicate samples are as follows: Au 0.0388, Ag 0.6916, Cu 0.6537, Pb 0.659 and Zn 0.7278. The lower correlation coefficient for gold reflects the nugget effect for this element.
10.7 QA/QC Protocol & Results – Rock Sampling Rock samples collected during the Genoa exploration program were submitted to Swastika Laboratories Ltd. located in Swastika Ontario for analysis. All the samples were analyzed with the same procedures as was employed for the drill core. There was no QA/QC program implemented.

VenCan Gold Corporation Cayenne-Chili Property Exploration
82
11.0 Interpretation and Conclusions
11.1 Jefferson Deposit and Burton Shaft Area The primary focus of the summer 2006 exploration program was VMS style mineralization in the area of the Jefferson Zn-Pb deposit (Jefferson) which contains an historical (1948) non-NI 43-101 compliant resource estimate of 30,100 tons at 7.05% Zn and 4.58% Pb. The historical work defined “massive sulphides enriched in zinc and lead over a strike length of 150 meters and to a vertical depth of 30 metres”. Deeper drilling to a vertical depth of 85 metres in 1950 indicated continuity of the zinc-lead enriched sulphide body. Some of the better drill intersections documented by the historical work on the Jefferson deposit included 4.43% Zn and 1.25% Pb over 22.9 meters and 9.1% Zn and 11.5% Pb over 6.9 meters. Work by Falconbridge Limited in the 1980’s reinterpreted the mineralization at the Jefferson deposit as associated with cross-cutting fractures and so not strictly of the VMS type. The results of the 2006 exploration program conducted by VenCan supports this interpretation, however, the authors believe that the known mineralization may be stringer type mineralization that indicates that potential exists to discover a proximal VMS source on VenCan’s property. A total of 12 diamond drill holes were completed by VenCan during the 2006 exploration program in the area of the Jefferson (holes VG-06-02 through VG-06-13) in an attempt to replicate historical results. The best drill intersections encountered in the 2006 program include 7.24% Zn over 1.85 meters (VG-06-02), 2.34% Zn and 2.10% Pb over 8.70 meters (VG-06-04), 1.83% Zn and 1.29% Pb over 10.20 meters (VG-06-05), and 1.48% Zn over 13.60 meters (VG-06-12). Two holes were drilled to the west of the Jefferson to test for strike extension of known mineralization. HoleVG-06-14 was drilled 300 meters to the west and encountered 8.93% Pb over 3.10 meters. Drill-Hole VG-06-15 was drilled 600 meters to the west and encountered no significant mineralization. VenCan was not able to confirm the thickness or tenor of mineralization at the Jefferson as was historically reported. The gravity survey conducted by MWH outlined a pronounced positive anomaly approximately 550 metres in length coincident with the Jefferson deposit. Based on geological mapping and interpretation of ground geophysical data, the authors conclude that the Jefferson lies on the northern limb of an overturned east-north-east plunging isoclinal anticline with vergence to the north, indicating a possible proximal VMS source more deeply buried to the north and/or east of the Jefferson. Drilling completed near the Burton Shaft Zn-Pb-Au occurrence located north-east of the Jefferson deposit has led the authors to conclude that the Burton Shaft occurrence lies within a limb of a complementary syncline to the Jefferson anticline. A single drill hole by Hollinger in 1929 intersected 7.5% Zn, 1.5%Pb and 7.5 g/t Au over 4.8 meters. A hole drilled immediately adjacent to the Burton Shaft during the 2006 exploration program (VG-06-01) encountered 1.55% Zn and 0.35% Pb over 6.05 meters with no significant gold mineralization.
11.2 Base Metal and Gold Targets Geologic mapping in conjunction with the ground magnetometer survey identified a previously unknown anticline fold nose of the Woman River Iron Formation 500 meters to the east of the Jefferson deposit which the authors believe is a highly prospective base metal-gold target. The anticline appears to plunge shallowly to the east and the gravity survey revealed a weak but

VenCan Gold Corporation Cayenne-Chili Property Exploration
83
continuous positive anomaly that is coincident with the projected plunge and which extends for 800 meters in this direction. Considering that the amplitude of the gravity effect is attenuated by even modest depths of burial the “anticline” target merits thorough exploration follow up.
11.3 Soil Sampling The orientation soil sampling survey was highly successful in identifying the known mineralized zones, as well as highlighting a previously unknown area south of the Burton which is anomalous in gold, silver, copper, lead, and zinc. This multi-element anomaly is also coincident with the western edge of the “anticline” gravity anomaly at the eastern limit of the present soil survey coverage.
11.4 ‘VenCan Zinc Showing’ Area The area around the historical drill intersection of 11.98% Zn over 3.2 meters located approximately 2.0 km to the west of the Jefferson Deposit was investigated during the 2006 exploration program, and an outcrop of sphalerite-rich mineralization corresponding to an AeroTEM helicopter-borne EM/Magnetometer anomaly was discovered. Grab samples from this outcrop yielded assay values ranging from 11.2% Zn to 17.96% Zn. VenCan drill hole VG-06-16 later completed beneath the outcrop intersected 4.22% over 16.85 meters including 7.27% Zn over 8.50 meters on a IP, magnetometer and gravity anomaly that extends 500 meters to the west. Subsequent to the field exploration program, inversion modeling of the 2006 IP data has identified a pronounced anomaly 100 meters to the north-west of the VG-06-16 collar that is open to the west. A channel sample of massive sulphide 100 meters west of hole VG-06-16 assayed 1250 ppm Zn, 538 ppm Pb, and 155 ppm Cu over 1.1 meter, and a regional highly anomalous grab sample taken 1.25 kilometers to the west assayed 8500 ppm Zn and 985 ppm Cu. The potential to discover Zn-rich mineralization with a strike length in excess of 1 kilometer makes this area highly prospective and it is the opinion of the authors that it merits thorough exploration follow up.
11.5 Ground Magnetics Magnetic surveys successfully mapped the complex interior character of the northeast trending WRIF and adjacent stratigraphy and revealed local stratigraphic or structural thickening of magnetic units. Discrete detection of the Jefferson Occurrence with magnetics remains problematic. 12.0 Recommendations
• Linecutting - To cover the prospective area to the west of the VenCan Zinc Showing, the existing Genoa Grid should be augmented/extended with the addition of lines 3900E to 5000E from stations 200N to 800S, and lines 2400E to 3800E from stations 0 to 1000S. In total 26 new lines, each 1 kilometer in length, should be cut.
• IP – IP/RES surveys and inversion modeling be completed on L51+00E, L52+00E,
L57+00E, L58+00E, L61+00E and L66+00E on the existing Genoa grid to complete mapping of anomalies over the VenCan Occurrence and GV Target Areas.
VenCan Gold Corporation Cayenne-Chili Property Exploration
84
• IP/RES surveys and inversion modeling be completed westward over the extended grid to map the limits and extents of VenCan Showing IP anomaly and possibly similar anomalies along strike westward.
• Magnetometer – Detailed magnetic surveying be completed over the extended grid to
continue mapping internal complexity of the WRIF and adjacent startigraphy.
• Soil Sampling - As the previous exploration program illustrated, soil sampling is efficacious on the property and should be completed over the newly established grid extension (1066 samples over 26 line km). Time permitting, infill soil sampling over the previously established Genoa Grid would entail 1681 samples over 41 line km, and could aid in identifying new mineral occurrences.
• Prospecting - The area around the newly identified antiformal nose (~300 meters to the east
of the Jefferson), the western portion of the Genoa Grid on strike with the VenCan Showing, and the newly established ‘Genoa Grid Extension’ should be thoroughly prospected and sampled. Additionally, two weeks of helicopter-supported exploration is proposed for inaccessible areas of VenCan’s broader land position.
• Drilling - Initially, 6 holes at the VenCan Showing are proposed over 900 meters, with 2
additional holes in the vicinity of the antiformal nose east of the Jefferson and/or the gravity anomaly east of the Burton (over 300 meters). Three drill sections, of 2 holes each, and spaced 100 meters apart are envisioned at the VenCan Showing to test strike extension and grade.
• Mapping – The Genoa Grid geology map should be augmented with additional mapping over
the newly established ‘Genoa Grid Extension’. 13.0 Acknowledgements and Certificates
13.1 Acknowledgements A list of personnel from VenCan and a variety of contractors cited in Appendix A of this report, acknowledges those workers who were directly concerned with the conduct of the 2006 June to August Genoa exploration program. They provided the myriad of technical and support services needed to make the program a success. The authors gratefully acknowledge the strong support of the many people whose efforts allowed the 2006 summer Genoa program to be completed. Without their valuable contributions, the program would not have been possible. Many people contributed to this report, however, the primary authors listed on the cover page are C. H. Aussant, P. Geol. And C. Scherba, P. Geol. The former acted as drill manager, while the later acted as project manager both contracted from Taiga Consultants Ltd. For practical purposes relating to the filing of documents with the various stock exchanges and securities commissions, the author

VenCan Gold Corporation Cayenne-Chili Property Exploration
85
list was confined to the primary Qualified Persons responsible for the conduct of the program. The authors would like to personnally acknowedge the contributions of the following personnel: Jacob Mckinnon, for his excellent logistical organization. Ian Kirkwood, for his diligence and perseverance while swamped by core waiting to be sampled. Graham Cameron, for his perseverance to getting the job done even under adverse weather conditions or insect infestations/allergic reactions. Don Lashbrook, for his excellent work ethics and prospecting skills. The authors also acknowledge the contributions of GeoVector Exploration. Without their diligence and expertise the program would have suffered. We thank Bradly Brothers for their cooperation and highly professional drilling services. Lastly but not least, the authors acknowledge the contributions of the line cutting crews and the geophysical crews from Exsics Exploration Services and MWH Geo-Surveys. Certificates for the primary authors are presented below.

VenCan Gold Corporation Cayenne-Chili Property Exploration
86
13.2 Certificate of Qualification – C.H. Aussant I, Claude H. Aussant, of #4, 1922-9th Ave S.E. in the City of Calgary in the Province of Alberta, do hereby certify that:
• I am a Consulting Geologist with the firm of Taiga Consultants Ltd. with offices at #4, 1922 - 9th Avenue SE, Calgary, Alberta.
• I am a graduate of the University of Calgary, B.Sc. Geology (1976), and I have practiced my
profession continuously since graduation.
• I am a member in good standing of the Association of Professional Engineers, Geologists and Geophysicists of Alberta; and I am a Fellow of the Geological Association of Canada.
• I am a “qualified person” as defined by National Instrument 43-101.
• I am not aware of any material fact or material change with respect to the subject matter of
the technical report that is not reflected in the technical report, the omission to disclose which makes the technical report misleading.
• I am the co-author of this report.
• I do not own or expect to receive any interest (direct, indirect, or contingent) in the property
described herein nor in the securities of VenCan Gold Corporation or any of its related companies in respect of services rendered in the preparation of this report.
• I have read National Instrument 43-101 and Form 43-101F1 and the technical report has
been prepared in compliance with National Instrument 43-101 and Form 43-101F1. DATED at Calgary, Alberta, this _____ day of ___________, A.D. 2006. Respectfully submitted, signed Claude H. Aussant, B.Sc., P.Geol.

VenCan Gold Corporation Cayenne-Chili Property Exploration
87
13.3 Certificate of Qualifications-C. S. Scherba
I, Craig S. Scherba, of #35, Royal Birch Point N.W. in the City of Calgary in the Province of Alberta, do hereby certify that: • I am a Consulting Geologist with the firm of Taiga Consultants Ltd. with offices at #4, 1922
- 9th Avenue SE, Calgary, Alberta. • I have practiced my profession continuously since 2000, and am a graduate of the University
of Alberta, B.Sc. Biology (1994) and Geology (2001). • I am a member in good standing of the Association of Professional Engineers, Geologists
and Geophysicists of Alberta. • I am a “qualified person” as defined by National Instrument 43-101. • I am not aware of any material fact or material change with respect to the subject matter of
the technical report that is not reflected in the Technical Report, the omission to disclose which makes the Technical Report misleading.
• I am the co-author of this report. • I have visited the site that is the subject of the Technical Report, and was present for the
duration of the reported program. • I have had no prior involvement with the property that is the subject of the Technical Report. • I have read National Instrument 43-101 and Form 43-101F1 and the technical report has
been prepared in compliance with National Instrument 43-101 and Form 43-101F1. • I consent to the filing of the Technical Report with any stock exchange and other regulatory
authority and any publication by them for regulatory purposes, including electronic publication in the public company files of their websites accessible by the public, of the Technical Report.
DATED at Calgary, Alberta, this _____ day of ___________, A.D. 2006.
Respectfully submitted, signed Craig S. Scherba, B.Sc., P.Geol.

STATEMENT OF QUALIFICATIONS I, Roman Tykajlo of 74 Stonebriar Drive, Ottawa, in the Province of Ontario DO HEREBY CERTIFY: 1. THAT I am a Consulting Geoscientist with GeoVector
Management Inc. with an office at 10 Green Street, Suite 312, Ottawa, Ontario, K2J 3Z6.
2. THAT I am a graduate of Lakehead University with a Bachelor of
Science Honours degree in Geology/Physics (1978) and I have been practicing my profession since graduation.
3. THAT I am a Professional Geoscientist (P.Geo.) registered in good
standing with the Association of Professional Geoscientists of Ontario (APGO), member # 0685.
4. THAT this report describes property geophysics work conducted
by Exsics Exploration Limited and MWH Geo-Surveys Inc., and supervised by me for VenCan Gold Corporation on the Cayenne and Chili Property during summer 2006.
DATED at Ottawa, Ontario, this 29th day of September, 2006.
_________________________________ Roman Tykajlo, H.B.Sc., P.Geo.

VenCan Gold Corporation Cayenne-Chili Property Exploration
89
14.0 References Allen, R.L., P. Weihed, and Global VMS Research Project Team. 2002. Global comparisons of volcanic-associated massive sulphide districts, in Blundell, D.J., F. Neubauer, and A. Von Quadt, eds., The Timing and Location of Major Ore Deposits in an Evolving Orogen: Geological Society of London Special Publication; 204: p.13-37. Barrie, C.T., and M.D. Hannington. 1999. Introduction: Classification of VMS deposits based on host rock composition, in Barrie, C.T. and M.D. Hannington eds., Volcanic-Associated Massive Sulphide Deposits: Processes and Examples in Modern and Ancient Settings: Reviews in Economic Geology; 8, p.2-10. DCIP2D. 2001. A Program Library for Forward Modelling and Inversion of DC Resistivity and Induced polarization Data over 2D Structures, version 3.2. Developed under the consortium research project Joint/Cooperative Inversion of Geophysical and Geological Data, UBC-Geophysical Inversion Facility, Department of Earth and Ocean Sciences, University of British Columbia, Vancouver, British Columbia.
Goodwin, A. M. 1965. Geology of Heenan, Marion, and the Northern Part of Genoa Townships; Ontario department of Mines, Geological Report No. 38. Goodwin, A.M.. 1973. Archean iron-formations and tectonic basins in the Canadian Shields: Economic Geology; 68, p. 915-933. Gross, G.A. 1996. Algoma-type Iron Formation, in Selected British Columbia Mineral Deposit Profiles, Volume 2 – Metallic Deposits, Lefebure, D.V. and Hoy, T., Editors, British Columbia Ministry of Employment and Investment, Open File 1996-13, pp. 25-28. Hamade, T., K.O. Konhauser, R. Raiswell, S. Goldsmith, and R.C.Morris. 2003. ‘Using Ge/Si ratios to decouple iron and silica fluxes in Precambrian banded iron formations’, Geology; 31 (1): p. 35-38. Harnmeijer, J.P. 2003. Banded Iron-Formation: A Continuing Enigma of Geology. Internet discussion document. Heather, K.B. and G.T. Shore. 1999. Geology, Swayze Greenstone Belt, Ontario. Geological Survey of Canada, Open File 3384a, scale 1:50 000. Hrvoic, I. 200?. Proton Magnetometers for Measurement of the Earth’s Magnetic Field, GEM System Inc., http://www.ultramag.com/overhaus.htm Klein, C. 2005. Some Precambiran banded iron formations (BIFs) from around the world: Their age, geologic setting, mineralogy, metamorphism, geochemistry, and origins. American Mineralogist; 90(10): p. 1473-1499.

VenCan Gold Corporation Cayenne-Chili Property Exploration
90
Krapex, B., M.E. Barley, and A.L. Pickard. 2003. Hydrothermal and resedimented origins of the precursor sediments to banded iron formation: Sedimentological evidence from the Early Palaeoproterozoic Brockman Supersequence of Western Australia. Sedimentology; 50(5): p. 979. Manchuk, B. 1982. Geological Survey Report, Falconbridge Limited Internal Report. Map No. 2067-Heenan, Marion and Northern Part of genoa townships, Sudbury District-Geological report No. 38 (Scale 1 inch to ½ mile). James H.L. 1954. Sedimentary facies of iron formation, Economic Geology; 49, pp. 235-293. Morris, R.C.. 1993. Genetic modeling for banded iron formation of the Hamersley Group, Pilbara Craton, Western Australia. Precambrian research; 60: p. 243-286. Polat, A. and R. Frei. 2005. The origin of early Archean iron formations and of continental crust, Isua, southern West Greenland. Precambrian Research; 138: p. 151-175. Tykajlo, R., A. Sexton, and T. Sagriff. 2006. Report of the VenCan Gold Corporation Cayenne-Chili Property, 2005 geophysical exploration program. VenCan Gold Corporation Internal Report.