Embed Size (px)
Citation preview

Exploiting the Link Structure in Mining Network Data
By
Jerry Scripps
A DISSERTATIONSubmitted to
Michigan State University in partial fulfillment of the requirements
for the degree of
DOCTOR OF PHILOSOPHY IN COMPUTER SCIENCE
Department of Computer Science and Engineering 2009

Network Data
C
D
B
A
E
0 1 1 0 1
1 0 1 1 0
1 1 0 0 0
0 1 0 0 1
1 0 0 1 0
Adjacency matrix A
0 0 1 0.70
7 0 .707 0
.707 0 0 .70
70 1 0 0
0 .577
.577
.577
normalizeddata matrix X
Let a network =(G,X,C) G=(V,E) where V={1,2,...,|V|} is a set of nodes and E is a set of edges
X=[xik]nd be the attribute matrix, xik is the kth attribute of vi
C={c1,...,cc} be a set of communities
G can also be represented by adjacency matrix A=[a ij]nn where aij=1 if vi and vj are linked

Network Mining Tasks
Predictive link prediction collective classification ranking
Descriptive community finding node characterization

Issues in Network Mining
Real networks have complex dependencies between the links, attributes, communities and labels. An accurate model should capture as many of these relationships as possible.
Real networks are dynamic. A realistic model needs to account for a changing network.

Research Contributions
Matrix Alignment Framework Link Prediction Collective Classification Kernel Based Matrix Alignment
Modeling Dynamic Networks

Link Prediction
yij{0,1}vi,viVlink
classifier
outputinput
arg min
wL [ y , f vi , v j]
network link application
web pages hyper-links missing links
bibliographic coauthor collaborations
terrorist conspirators potential participation

Link PredictionPrevious Work
Node-pair metrics (Liben-Nowell & Kleinberg)
Classifier approach (Al Hasan, et al.; Popescul & Unger)
Graphical Models (Taskar, et al.; Neville & Jensen; Hanneke & Xing, etc.)(ex. ergm )p N = 1
Ze−∑N

Link PredictionLimitations
Many models are not flexible to make use of the different relationships in networks
Need to consider effects of community (even if communities are not given)
assume relationship of attribute to link is linear (kernel functions needed)
Current methods are not descriptive Graphical models often generative making
inference time-consuming

Link PredictionMatrix Alignment Approach
A:1,3
B:1,3 C:1,1
D:2,3 F:2,1
E:2,1 G:2,3H:1,1
I:1,3
J:1,3

Link PredictionFormulation for link prediction
L=∥A−XWX T∥F2=∑i=1
n ∑ j=1
n a ij−∑k=1
dxik x jk wk
2Objective function to minimize:
L=∥A−XWX T∥F2∥W − I∥F
2
∂ L∂wm
=∑i=1
n
∑ j=1
n aij−∑k=1
dxik x jk wk−xi m x jm
∑i=1
n
∑ j=1
n
∑k=1
dx ik x jk xi m x jmwk=∑i=1
n
∑ j=1
naij xi m x jm
Z w=b
Z mk=∑i=1
n
∑ j=1
n
∑k=1
dx ik x jk xi m x jmbm=∑i=1
n
∑ j=1
naij xi m x jm
With regularizer:

Link PredictionInferring the links
Given a network with N={A',X} where a'ij{0,1,?}, predict link where a'ij=?.
xiWxjT is a relative measure of the
likelihood of vi and vj forming a link. Set aij=1 if g1(xiWxj
T)>g0(xiWxjT)
0 otherwise

Link PredictionTopological Features
Let Y(i) be an n n matrix of topological statistics between the nodes of the network
Objective function becomes:
Solve for the weights w={u,v} as before
L=∑i=1
n
∑ j=1
n a ij−∑k=1
d 1
x ik x jk uk−∑k=1
d 2
y ijk vk
2
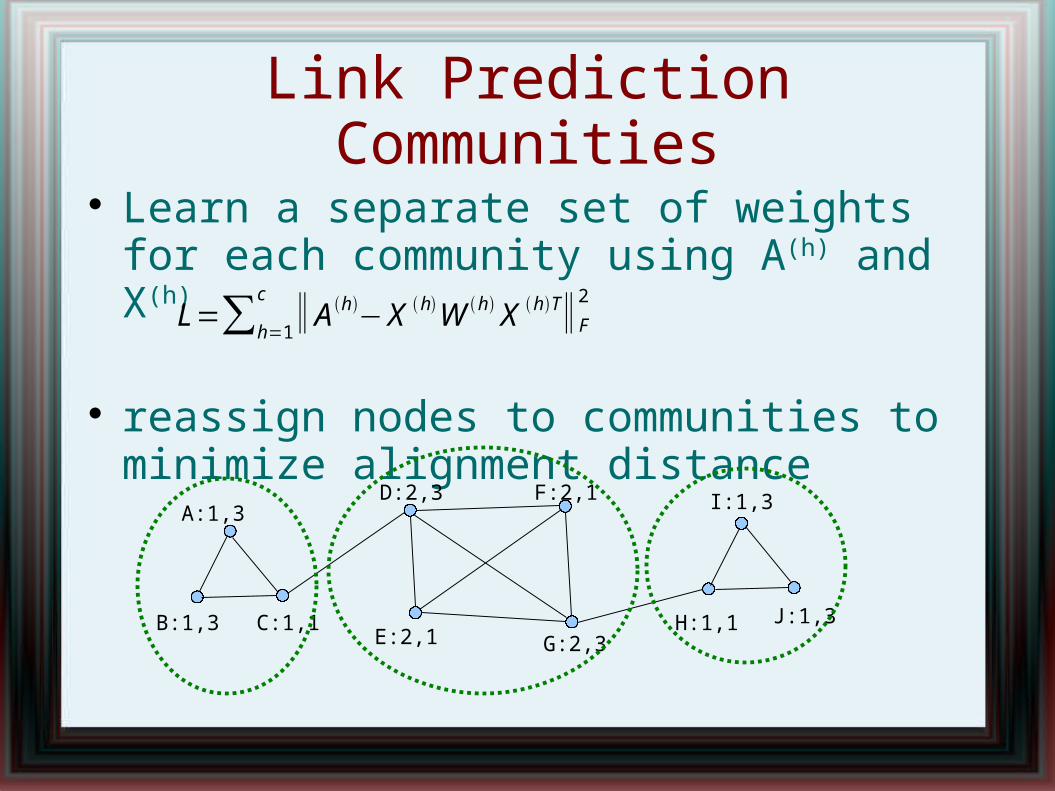
Link PredictionCommunities
Learn a separate set of weights for each community using A(h) and X(h)
reassign nodes to communities to minimize alignment distance
A:1,3
B:1,3 C:1,1
D:2,3 F:2,1
E:2,1 G:2,3H:1,1
I:1,3
J:1,3
L=∑h=1
c ∥Ah−X hW h X hT∥F2

Link PredictionAlgorithm
Input: adjacency matrix A, data matrix X, kOutput: adjacency matrix A, weights W,
communities CC ← Kmeans(X,k);repeat W ← calcWeights(A,X); // missing link assignment foreach missing link aij A ∈ do aij ← assignLink(i, j, A,X,W); end C ← assignCommunities(A,X,W,C);until W converge ;return W,A,C;

Link PredictionData Sets and Experimental Setup
attrsLinksNodes
1,703530265 3:Wisconsin
1,703446230 2:Washington
1,703328187 1:Texas
1,703304195 0:Cornell
Webkb
123674304 5:Middle East
1231,095334 4:South America
1234,2211,258 3:North America
123593368 2:Europe
1231,778855 1:Asia
1232,3871,128 0:Africa
12329,7765,852TakingItGlobal.org
4102,0421,238 3:soft.eng.5245,5862,855 2:networks5565,7973,492 1:art.intel.5428,5473,445 0:database
58022,31510,709DBLP for each data set: 10 test runs using 10% of links equivalent
number of non-links
reported accuracy

Link PredictionResults for Weighted Alignment
synTIG 0
TIG 1TIG 2
TIG 3TIG 4
TIG 5TIG 6
TIG 7
0.0000
0.5000
1.0000Unweighted vs. Weighted without topological
unwgtdweighteda
ccura
cy
HEPWebKb0
WebKb1WebKb2
WebKb3DBLP0
DBLP1DBLP2
DBLP3
0.0000
0.5000
1.0000Unweighted vs. Weighted without topological
unwgtdweighteda
ccura
cy
Synthetic, TIG and WebKb showed improvements
In dblp, linked authors have same attributes by design

Link PredictionTopological Features
All sets showed improvement
With dblp, topological features reduce accuracy for unweighted but not for weighted
synTIG 0
TIG 1TIG 2
TIG 3TIG 4
TIG 5TIG 6
TIG 7
0.0000
0.5000
1.0000Unweighted vs. Weighted with topological features
unwgtdweighteda
ccura
cy
HEPWebKb0
WebKb1WebKb2
WebKb3DBLP0
DBLP1DBLP2
DBLP3
0.0000
0.5000
1.0000Unweighted vs. Weighted with topological features
unwgtdweighteda
ccura
cy

Link PredictionWithin Communities
TIG0TIG1
TIG2TIG3
TIG4TIG5
TIG6TIG7
0.00000.10000.20000.30000.40000.50000.60000.7000
Using Communities
XX'EMcomm
accu
racy
Using weights improves within-community accuracy
Using community weights improves it even more

Link PredictionSummary
Developed a flexible matrix alignment approach applied to link prediction
Weights provide a descriptive rationale for link decisions
Framework allows inclusion of topological features Communities can be utilized for link prediction and
learned simultaneously during link prediction Framework is appropriate for kernel extension
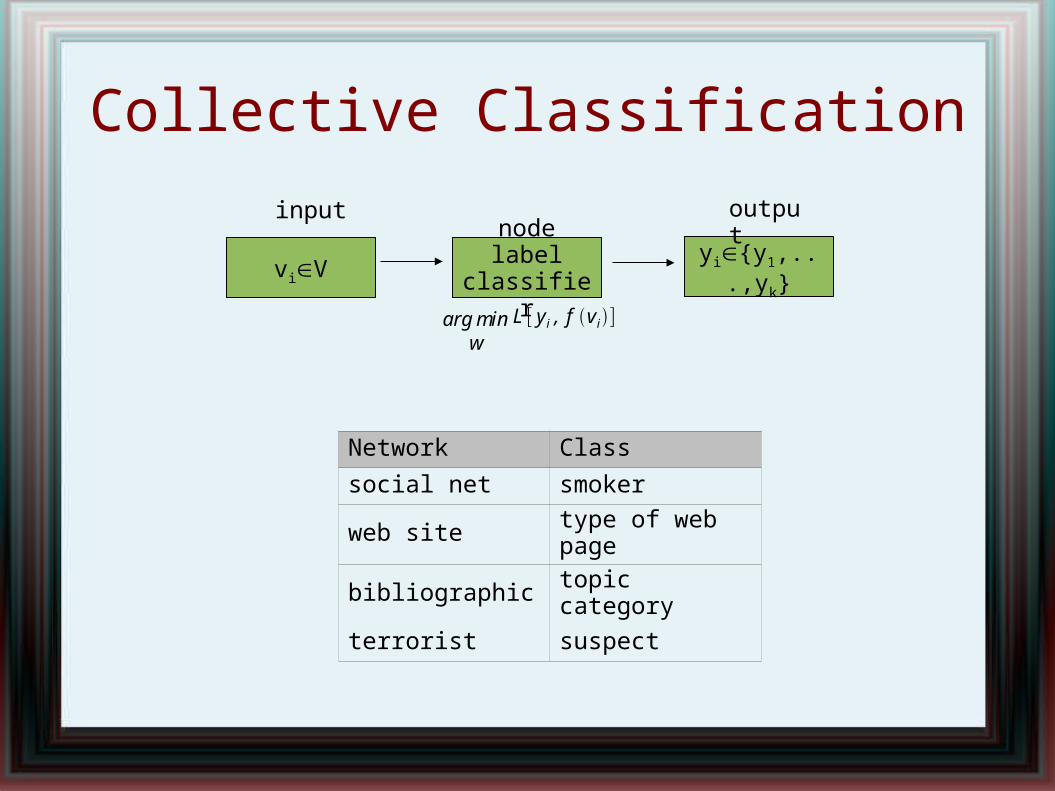
Collective Classification
yi{y1,...,yk}viVnode labelclassifier
outputinput
arg min
wL [ yi , f vi]
Network Class
social net smoker
web site type of web page
bibliographic topic category
terrorist suspect

Collective ClassificationRelated Work
Web page classification (Chakrabarti, et al.)
Local approach ICA (Lu & Getoor) Gibbs sampling (Macskassy & Provost)
Global models Loopy belief propagation (Yedidia, et al.) Relaxation labeling (Weiss, et al.)

Collective ClassificationFormulation
L=∥Y−w0 A−XWXT ° A−XVX T ° Ac∥F
2
Using a co-class matrix Y=[yij]nn , where yij=1 if vi and vj are in the same class, objective function to minimize becomes:
Solve using Gaussian elimination, conjugate gradient or other method
L=∥Y−w0 A−XWXT ° A−XVX T ° Ac∥F
2
w0∥W − I∥F2∥V − I∥F
2
With regularizer, it becomes:

Collective ClassificationCreating the Features for the classifier scoring function sij is a relative measure of
likelihood of i and j being in the same class
each row si represents the co-class similarity between i and all other nodes
sij=w0 a ij∑k=1
da ij x ik x jk w k∑k=1
d1−a ij x ik x jk v k
X
S
A
featurecreation
w0,W,V

Collective ClassificationInferring the Labels
Summarize S by class for better accuracy and scalability
Train classifier using S' – labeled nodes Infer labels from S' of unlabeled nodes
labels
by class
classifier
weighted link and attribute similarity
summarize by class
trainclassifier
yS'S

Collective ClassificationData Sets
teen CiteSeer Cora
type social net bibliographic bibliographic
nbr of classes 2 6 7
nbr of nodes 50 3,312 2,708
nbr of attr. 5 3,703 1,433
nbr of periods 3 1 1

Collective ClassificationComparison of Accuracy
attr ICA wgted
teenYr1 .6200 .8000 .8200
teenYr2 .6600 .6600 .7000
teenYr3 .8200 .8600 .8600
CiteSeer .7310 .7732 .7667
Cora .7580 .8796 .8774

Collective ClassificationWeights of the teen Data
teenYr1 teenYr2 teenYr3
w v w v w v
link (w0) 1.438 1.363 0.554
drugs 0.155 0.337 0.086 0.105 0.460 0.113
family 1.000 1.000 0.260 0.110 0.887 0.412
smoke -0.022 0.124 -0.006 0.101 0.351 0.083
sport -0.001 0.028 0.004 0.037 0.329 0.094
w0=weight for links, w=weights for linked attributes, v=weights for non-linked attributes
Observations agree with Snijder's conclusions
Collective ClassificationSummary
Developed matrix alignment approach - a fast alternative to iterative approaches
Weights describe the rationale behind classification decisions
Approach has potential for kernel function extension
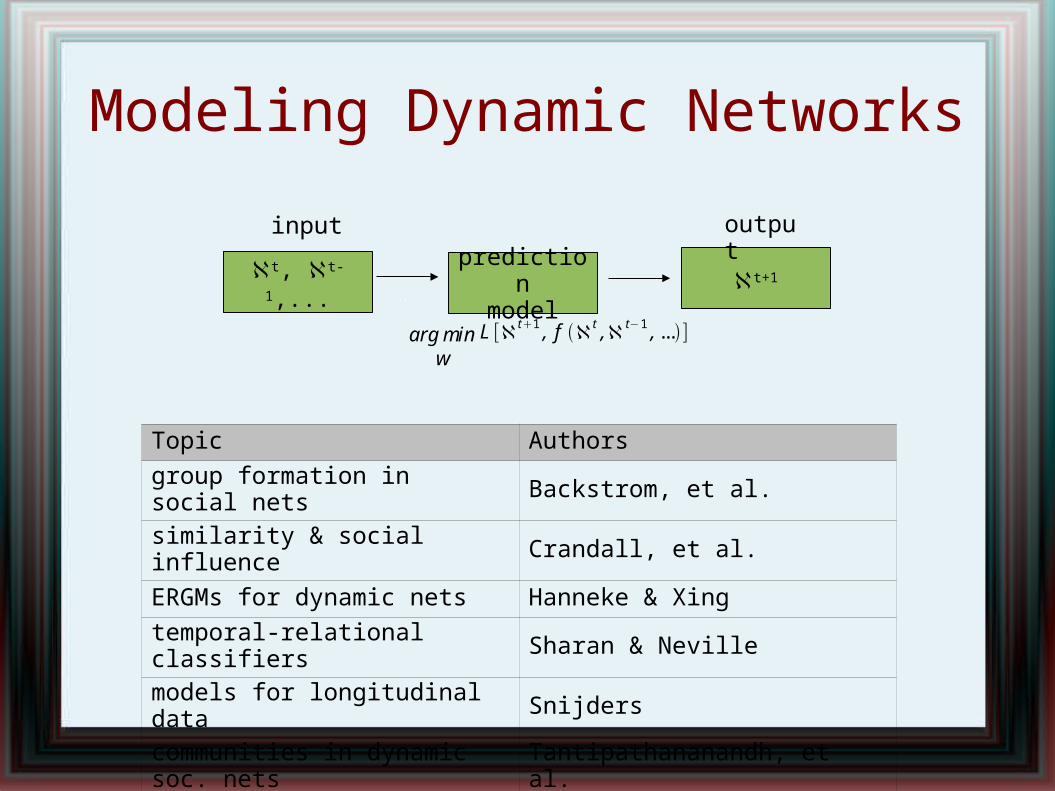
Modeling Dynamic Networks
t+1t, t-1,...prediction
model
outputinput
arg min
wL [ℵt1 , f ℵt ,ℵ t−1 , ... ]
Topic Authors
group formation in social nets Backstrom, et al.
similarity & social influence Crandall, et al.
ERGMs for dynamic nets Hanneke & Xing
temporal-relational classifiers Sharan & Neville
models for longitudinal data Snijders
communities in dynamic soc. nets Tantipathananandh, et al.

Modeling Dynamic NetworksNetwork Forces
Social selection – choosing friends with similar attributes
Social influence – changing one's attributes to match those of friends

Modeling Dynamic NetworksChallenges
What are effects of influence and selection? Issues for constructing network from data:
should links and attribute data be accumulated?
how much historical data is necessary for accurate predictions?
do attribute weights change over time? A model to account for all forces, consider
dynamic nets and represent all relationships

Modeling Dynamic NetworksMeasuring Network Forces
Selection
Influence
Distance measures:
Weights can be calculated using one or more historical snapshots
influence=p xi
t x j t xi
t−1 x jt−1 |aij
t−1=0,a ijt =1
p xit x j
t xit−1 x j
t−1 |a ijt−1=0
selection=p a ij
t =1|a ijt−1=0, xi
t−1 x jt−1
p aijt =1|aij
t−1=0
dist0t =∥At −X t WX t T∥F2
dist−1 t =∥At −X t1WX t1 T∥F2
dist1 t =∥At1−X t WX t T∥F2

Modeling Dynamic NetworksData sets
teen wiki dblp1 dblp2 dblp3 levant
τ 3 8 8 8 8 25
d 5 5027 613 613 613 18
n(1) 50 445 473 336 57 130
dist0 / n(1) 3.13 1.08 0.83 1.00 0.23 2.10
n(t) 50 2344 1483 1410 878 129
dist0 / n(T) 3.31 2.60 1.87 1.99 1.48 2.05
| XXT ○ A |F2 0.70 0.06 0.84 0.88 0.87 0.50
| XXT ○ A C|F2 0.56 0.01 0.03 0.04 0.04 0.29

Modeling Dynamic NetworksGoals of Experiments
Learn the extent of selection and influence and how they relate to alignment distance
Find how the different accumulation strategies affect alignment
Track the value of historical data in terms of improving prediction
Discover if the weights of attributes (used in aligning attributes to links) change over time

dblp2
Modeling Dynamic NetworksSelection and Influence Experiments
wikilevant
2 3 4 5 6 7 80.000
20.000
40.000
60.000
80.000
100.000
120.000
-2000
0
2000
4000
6000
8000
10000
12000
14000
16000
selectioninfluencedist+1dist-1
2 3 4 5 6 7 80
500
1000
1500
2000
2500
-1000
0
1000
2000
3000
4000
5000
6000
7000
selectioninfluencedist+1dist-1
2 3 4 5 6 7 8 9 10 11 12 13 14 15 16 17 18 19 20 21 22 23 24 250.000
1.000
2.000
3.000
4.000
5.000
6.000
0
100
200
300
400
500
600
selection influence dist+1 dist-1
strong evidence for both selection and influence
inverse relationship between selection and dist+1 and between influence and dist-1
strong evidence for selection but not influence
many authors have similar keywords in titles but will not necessarily coauthor in the future
inverse relationship between selection and dist+1
again, strong evidence for selection but not influence
entities that have increasing similarity (threatening gestures) may begin fighting but fighting parties do not increase their threaten gestures
relationship between selection/influence and dist+1/dist-1 not as clear

Modeling Dynamic NetworksAccumulation Experiments
wikidblp1levant
1 2 3 4 5 6 7 80
10000
20000
30000
40000
50000
60000
neitherlinksattrboth
time periods
alig
nmen
t
2 3 4 5 6 7 80
10000
20000
30000
40000
50000
60000
70000
80000
neitherlinksattrboth
time periods
alig
nm
en
t
1 2 3 4 5 6 7 8 9 10 11 12 13 14 15 16 17 18 19 20 21 22 23 24 250
500
1000
1500
2000
2500
3000
3500
neither links attr both time periods
alig
nm
en
t
alignment distance grows as network grows
accumulating both links and data results in highest distance
accumulating links worsens alignment – so links are dropped for a reason

Modeling Dynamic NetworksLearning from History
wikilevant
5 6 7 8 9 10 11 12 13 14 15 16 17 18 19 20 21 22 23 24 250
100
200
300
400
500
600
1 yr 2 yrs 3 yrs all yrs
alig
nm
en
t dis
tan
ce
5 6 7 80
2000
4000
6000
8000
10000
12000
14000
16000
1 yr 2 yrs 3 yrs all yrs
alig
nmen
t di
s-ta
nce
Using historical data to learn weights does not narrow alignment distance much if at all
In sets where past data is helpful, it could be due to attribute drift

Modeling Dynamic NetworksAttribute Drift Experiments
teen wiki dblp1 dblp2 dblp3 levant-0.2
00.20.40.60.8
11.2
yearly first to last
corr
elat
ion
average yearly correlation is much higher than correlation between first and last years
clear tendency for changes in attribute weights with respect to linking
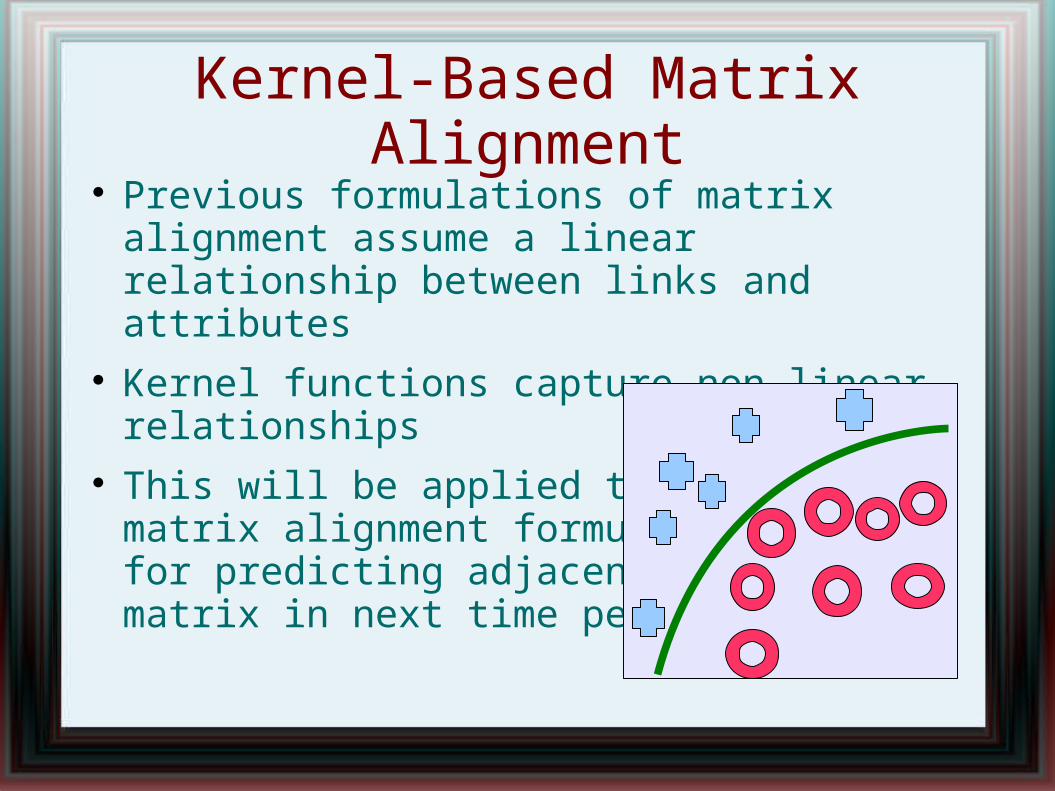
Kernel-Based Matrix Alignment Previous formulations of matrix alignment
assume a linear relationship between links and attributes
Kernel functions capture non-linear relationships
This will be applied to thematrix alignment formula for predicting adjacency matrix in next time period

Kernel-Based Matrix AlignmentLink Prediction Formulation
Same objective function using full W matrix:
Take partial derivative and set to zero:
where δxy=1 when x=y, zero otherwise, and
plugging wkl from (1) into (2) results in
which in matrix form is
X can be replaced by φ(X) so that K=φ(X)φ(X)T
L=∥A−XWX T∥F2∥W− I∥F
2
w pq=1 ∑ i=1
n
∑ j=1
nx piT v ij x jq pq 1
v ij=aij−∑k=1
d
∑ l=1
dx ik wkl x lj
T 2
=a ij−1∑k=1
d
∑m=1
n
∑ z=1
n
∑ l=1
dx ik xkm
T vmz x zl x ljT∑k=1
d
∑ l=1
dx ik kl x lj
T
KVKV=AK where K=XX T

Kernel-Based Matrix AlignmentSolving for V
Using Schur decomposition
starting with matrix formula:
K=UDU T
KVKV=KA
D=U T KU
KUU TVUUT KV=KA
U T KUU TVUU T KUU TVU=U T KAU
D V D V=F vij=f ij
d ii d jjV =U V U T
to predict new links, calculate V using A(t) and K=φ(X(t))φ(X(t))T, then predict A(t+1) using V and K=φ(X(t+1))φ(X(t+1))T
A= 1 KVKV−K

Kernel-Based Matrix AlignmentF-measure for accumulative
1 2 3 4 5 6 70.0000.1000.2000.3000.4000.5000.6000.7000.8000.9001.000
Wiki
A-XWX' linear kernel rbf kernel Classifier1 2 3 4 5 6 7
0.0000.1000.2000.3000.4000.5000.6000.7000.8000.9001.000
DBLP 1
A-XWX' linear kernel rbf kernel Classifier1 2 3 4 5 6 7
0.0000.1000.2000.3000.4000.5000.6000.7000.8000.9001.000
DBLP 2
A-XWX' linear kernel rbf kernel Classifier1 2 3 4 5 6 7
0.0000.1000.2000.3000.4000.5000.6000.7000.8000.9001.000
DBLP 3
A-XWX' linear kernel rbf kernel Classifier1 2 3 4 5 6 7 8 9 10 11 12 13 14 15 16 17 18 19 20 21 22 23 24 25 26 27 28 29
0.0000.1000.2000.3000.4000.5000.6000.7000.8000.9001.000
Levant
A-XWX' linear kernel rbf kernel Classifier

Summary
Developed an unified framework that can integrate link structure, attributes, class labels and communities that:
provides descriptive explanation for predictions can be extended it to non-linear relationships (via kernel
functions) can also be extended to apply to dynamic networks
Examine temporal networks studying the effects of network forces and preprocessing decisions

Future Work
Extension to matrix alignment framework to incorporate kernels with collective classification
Extend matrix alignment framework for collective classification to incorporate dynamic networks
Incremental approach to learning weights for scalability
Integrated approach to combined link prediction and collective classification
Extensions to the framework to incorporate links of different types and directional links

References Jerry Scripps, Pang-Ning Tan, Clustering in the Presence of Bridge-Nodes. SDM 2006 Jerry Scripps, Pang-Ning Tan and Abdol-Hossein Esfahanian, Node Roles and
Community Structure in Networks, WebKDD 2007 Jerry Scripps, Pang-Ning Tan and Abdol-Hossein Esfahanian, Exploration of Link
Structure and Community-based Node Roles in Network Analysis, ICDM, 2007 Jerry Scripps, Feilong Chen, Pang-Ning Tan and Abdol-Hossein Esfahanian, A Matrix
Alignment Approach for Link Prediction, ICPR, 2008 Jerry Scripps, Ronald Nussbaum, Pang-Ning Tan and Abdol-Hossein Esfahanian,
Link-based Network Mining, in Structural Analysis of Complex Networks, Birkhäuser Publishing, 2008, in press
Jerry Scripps, Pang-Ning Tan and Abdol-Hossein Esfahanian, A Matrix Alignment Approach for Collective Classification, ASONAM 2009
Jerry Scripps, Pang-Ning Tan and Abdol-Hossein Esfahanian, Measuring the Effects of Preprocessing Decisions and Network Forces in Dynamic Network Analysis, KDD 2009
J. Scripps and P. N. Tan. Constrained overlapping clusters: Minimizing the negative effects of bridge-nodes. IEEE Transactions on Knowledge and Data Engineering, submitted
J. Scripps, P. N. Tan, F. Chen, and A-H Esfahanian. A matrix alignment approach for link prediction. Data Mining and Knowledge Discovery, submitted.

Additional Slides

Community Node Roles Designates the role that a node plays in
relationship to the network and other nodes
Limitation: no node characterization in relation to communities
measure
yi{y1,...,yk}viVnode roleclassifier
Role Metric
popularity degree
centrality closeness
authority PageRank
outputinput

Community Node RolesrawComm
1/4
1/4
1/4
1/4
1/21/3
1/21/3
1/3
A
)1(1
1)(
)()(
)(
1
1)(
)(
21
)(
qnpnjE
gjg
gPjE
Cj
jrawC omm
i
gi
iji
iNji
i

Community Node RolesrawComm Experiments
p=.73 q=.82 SSE=6.68
21 12 14 20 11 17 18 15 16 25 3 26 24 22 7 30 29 23 19 6 5 4 1 13 10 8 9 33 31 32 2 28 27 0
0
1
2
3
4
Com parison of actua l com munity a ttachm ent to rawComm m etric
Actual rawCom m