Embed Size (px)
Citation preview

Vlahogianni, Kepaptsoglou, Tsetsos, Karlaftis 1
EXPLOITING NEW SENSOR TECHNOLOGIES FOR REAL-TIME PARKING PREDICTION IN URBAN AREAS
Eleni I. Vlahogianni*, Ph.D. Department of Transportation Planning & Engineering
School of Civil Engineering National Technical University of Athens
5 Iroon Polytechniou Str, Zografou Campus, 15773 Athens Greece Tel: +30 210 772 1369; Fax: +30 210 772 1454
e-mail: [email protected]
Kostanstinos Kepaptsoglou, Ph.D. School of Rural and Surveying Engineering
National Technical University of Athens, 5 Iroon Polytechniou Str, Zografou Campus, 157 73 Athens Greece
Tel: +30 210 772 3167; Fax: +30 210 772 2404 e-mail: [email protected]
Vassileios Tsetsos, Ph.D.
Mobics Ltd 27 Kifissias Avenue, 11523 Athens Greece
Tel: +30 210 643 3525; Fax: +30 210 643 3407 e-mail: [email protected]
Matthew G. Karlaftis, Ph.D.
Department of Transportation Planning & Engineering School of Civil Engineering
National Technical University of Athens 5 Iroon Polytechniou Str, Zografou Campus, 15773 Athens Greece
Tel: +30 210 772 1280; Fax: +30 210 772 2404 e-mail: [email protected]
Word Count: 6241
Tables: 2 Figures: 9
*corresponding author
TRB 2014 Annual Meeting Original paper submittal - not revised by author

Vlahogianni, Kepaptsoglou, Tsetsos, Karlaftis 2
ABSTRACT This paper proposes a methodological framework - based on survival analysis and neural networks - to provide parking availability forecasts for extended prediction horizons. Two different types of predictions are provided: i. the probability of a free space to continue being free in subsequent time intervals, and ii. the short-term parking occupancy prediction in selected regions of an urban road network. The available data comes from a wide network of parking sensors installed on-street in the “smart” city of Santander, Spain. The sensor network is segmented in four different regions and, then, survival and neural network models are developed for each region separately. Findings show that the Weibull parametric models best describe the probability of a space continuing to be free in the forthcoming time intervals. Simple genetically optimized Multilayer Perceptrons accurately predict region parking occupancy up to 1 hour in the future by only exploiting 5 minute data. Finally, the real time, web based, implementation of the proposed parking prediction availability system is presented. Keywords: Parking occupancy, parking duration, parking sensors, smart city, internet of things
TRB 2014 Annual Meeting Original paper submittal - not revised by author

Vlahogianni, Kepaptsoglou, Tsetsos, Karlaftis 3
INTRODUCTION AND BACKGROUND Parking availability and provision are among the most important factors affecting both private car based trip decisions and traffic conditions in urban areas. Driver decisions are temporally dependent, implying that they are influenced by past experience, as well as real-time (on road) perceptions. Parking is such a case where prior knowledge on possible prevailing conditions (e.g. difficulty in finding a parking space, off-street parking costs, and so on) affects parking decisions. At the same time, vehicles in search of vacant parking spaces negatively impact traffic conditions and the environment. In such a context, parking information provision is a research area of particular interest since modern communication technologies offer alternative ways of delivering information to travelers in a timely and effective manner.
Systems developed for providing parking information and guidance have been proposed by researchers in the past (1-4); in such systems, information is usually disseminated by variable message signs or through the internet, cellular phones, PDA, and GIS technologies (2, 4). Teodorovic and Lucic (5) argue that although parking guidance systems may not affect the occupancy rate or average parking duration, drivers tend to greatly appreciate the information provided by such systems. This is the case since such systems significantly increase the probability of finding vacant parking spaces, mitigate frustration of those drivers/visitors unfamiliar with the city center, decrease queues in front of parking garages, decrease total vehicle-miles travelled (particularly in the city center), decrease average trip time, energy consumption, and air pollution.
The usefulness of such predictive parking information is straightforwardly understood. If all drivers act without information and make “uninformed” choices, they will probably resort to similar optimal decisions leading to induced long waiting times, queues and increased parking circling. On the other hand, dissemination of accurate and timely parking availability information may lead to improved driver decisions and parking searching (6). From a transport operator perspective, accurate parking availability forecasts may lead to better management of the system, congestion mitigation due to queue formation avoidance, and so on.
Parking modeling has been a topic of interest since the 1970s. An early review by Young et al. (7) reported three categories of parking related models: driver behavior with respect to parking (parking choice), optimal positioning of parking lots (parking allocation), and interaction of parking operations with other transportation system elements and infrastructures (parking interaction). A decade later, Arnott and Rowse (8) indicated that parking has been investigated from several perspectives including parking patterns, impacts on traffic, off-street parking technologies, parking policy, choice and location models, as well as economic models describing parking conditions. Parking availability prediction on the other hand, was introduced in recent years, coupled with modern capabilities on data collection and processing, along with ITS based exploitation of such information (a fact already indicated since the early 1990s (9)). In the early 2000s, David et al. (10) proposed a model for event-oriented forecasting of parking occupancy based on standardized daily distribution occupancy rate curves and on-line data obtained from parking lots equipped with detectors. On-street occupancy estimation in the absence of detectors was investigated by David and Keller (11). An event driven model was developed for that purpose using historical socioeconomic and parking specific data; the model was successfully validated for the city of Munich, Germany. Teodorovic and Lucic (5) developed a system based on fuzzy logic, simulation and optimization models, which decides whether to accept or reject new parking requests in real-time, according to estimated availability for
TRB 2014 Annual Meeting Original paper submittal - not revised by author

Vlahogianni, Kepaptsoglou, Tsetsos, Karlaftis 4
parking lots. Martens and Benenson (12) exploited agent-based modeling for representing parking behavior by integrating the effect of considering real-time and expected parking availability, prices, and parking enforcement. Caicedo (13) developed a discrete choice model for combining on-line and historical data for real-time, off street parking availability prediction; this model was later used by Caicedo et al. (3). A fuzzy logic model for estimating the uncertainty of peak period parking availability in park-and-ride facilities was proposed by Chen et al. (14). Recently, Fubuyasi et al. (15) developed ParkPGH, a system for predicting parking availability in eight Pittsburg parking facilities using historical and real-time data.
Modern technological advances have revolutionized the ways of monitoring and recording transportation operations and data; these have, however, been exploited for parking prediction to a lesser extent, and have mainly focused on off-street parking facilities. The objective of this paper is to exploit statistical and computational intelligence methods for developing a methodology that can be used for multiple step ahead on-street parking prediction in “smart” urban areas. This work takes advantage of massive real-time parking data availability, obtained by an extended parking sensor network available in the “smart” city of Santander, Spain. Models are developed for predicting expected parking occupancy along with the probability of finding vacant parking spaces. Traditional survival analysis models as well as neural network models are developed. The methodology is evaluated and a real-time, web based system exploiting the proposed prediction models, for the city of Santander, Spain, is presented.
SMART CITIES AND PARKING PREDICTION CHALLENGES Cities are characterized as “smart” when their transportation and communication (ICT) infrastructures along with their human and social capital investments cooperate and actively support sustainable growth and high quality of life, through participatory action and engagement while preserving natural resources (16). Indeed, as noted by Komninos (17), innovation and use of ICT for improving capacity of infrastructures are key elements of “smart” cities. A novel type of “smart” city infrastructure, applicable to the transportation sector is the so-called Internet of Things (IoT). IoT consists of a variety of devices or objects – such as Radio-Frequency IDentification (RFID) tags, sensors, actuators, mobile phones, and so on – which, through unique addressing schemes, are able to interact with each other and cooperate with their neighbors to reach common goals (18). By continuously collecting, analyzing and redistributing transportation information, IoT networks can offer valuable, real time information to both travelers and operators, and thus support and improve the operations of ITS, traffic and public transportation systems. Although one can trace several reasons that may prevent IoT to be fully developed in urban environments, this unique technological paradigm is expected to substantially support sustainable development of future smart cities (19).
The SmartSantander project is such a case of an IoT architecture deployed in the city of Santander, to achieve a massive deployment of sensors and network communications in order to provide efficient and equitable transportation and other services to citizens (http://www.smartsantander.eu/). The IoT network of the SmartSantander project consists of (20): IoT nodes: these are responsible for sensing and collecting information from the
natural and socioeconomic environment and activities (temperature, CO, noise, light, car presence etc.).
TRB 2014 Annual Meeting Original paper submittal - not revised by author
Vlahogianni, Kepaptsoglou, Tsetsos, Karlaftis 5
Repeaters: These nodes are placed high above ground in street lights, semaphores, information panels, etc, and behave as forwarding nodes of Iot information.
Gateways: Both IoT nodes and repeaters are configured to send all the information to gateways. Once information is received by gateways it can be either stored locally or sent to central processing units through different interfaces (for example, WiFi, GPRS/UMTS or Ethernet).
SmartSantander and similar testbeds fuse high resolution datasets stemming
from both static and mobile sensors. Such data refer to macroscopic traffic flow in road sections of interest, detailed parking information in real-time in urban areas, as well as high resolution transit information. In the case examined in this paper, having parking sensors collecting real time information on their occupancy provides accurate high resolution parking information. New technologies can replace common parking metrics of average duration, turnover rate and occupancy in extended time windows of 1 to 3 hours (which are manually collected in small scale regions) with accurate, both aggregate and disaggregate information, on occupancy and parking duration. In this framework there are several questions that may arise; this paper focuses on the following:
Is it possible to predict parking occupancy using time series modeling approaches based on data collected from an IoT network of sensors?
How accurate are parking occupancy predictions produced by such models in relation to the predictive horizon?
What are the statistical properties of parking space duration and how can we predict the probability of having free parking spaces in the area of interest?
MODELING PARKING AVAILABILITY BASED ON SENSOR DATA Methodology The architecture of the proposed parking occupancy prediction system is presented in FIGURE 1. In each sliding time window T , parking efficiency is defined by the following metrics:
Duration ( tD ) of free parking space: The time period that a slot is free,
Occupancy ( tO ): The percentage of parking slots occupied during a predefined
time period.
The free space duration is an indication of how frequently a parking space becomes available, whereas occupancy relates the parking accumulation, meaning the number of parked vehicles in the study area at any specific time period, to the parking capacity.
The proposed methodology has two modules. The first module is a real-time time series occupancy prediction scheme based on recurrent artificial neural networks. Simple yet flexible memory mechanisms will be applied in order to replicate the temporal dynamics of parking occupancy tO . The model is presented with past
information of occupancy ( ( 1),...,t t mO O ) to predict occupancy in one step ahead tO
. The characteristics of the model’s memory (the time delay τ and the dimension m) will be evaluated through a nonlinear analysis of the dynamics of parking occupancy. The use of exogenous variables such as traffic volume will be evaluated relative to the
TRB 2014 Annual Meeting Original paper submittal - not revised by author

Vlah
impthanwee
FIGsche
in aon peffe(23)funcpredpredaccesimpstudstru
prop(andthe time(mesaveerro
avaiente(peaParaformprovavai
hogianni, Ke
provement on one neurekdays) will
GURE 1. Fueme.
When can “intelligepredicting
ectiveness d). The comctional formdiction sysdiction acceptable resuple and fle
died in a pructural and l
Neverthposed approd unobserveextent of tr
e operation ean relativeed for retraor systemati
The seilable parkiering the prak, off-peakametric hazms. The movided by thilable parkin
epaptsoglou,
on the accurral networkl be evaluat
unctional a
considering ent” technoltraffic info
depends bothmputational m of the pstems that curacy but ults (21). Foexible as poreliminary learning parheless, to enoach may eed) patternsraining dataof the pred percept er
aining. The ically increacond is a ing space wroject’s areak, morning zard based odel will behe first modng space an
Tsetsos, Kar
racy of predk models ed.
rchitecture
short-term logy-based
ormation in h on the res
time for prediction s
include reneed exte
or this, the ossible. Thestage of anrameters of nsure the opencompass s. The uncea in each c
diction systerror exceedsystem wi
ases. static appr
with relationa, the type oevening). Tmodeling me also prese
dule. The ound the antici
rlaftis
dictions thewith relati
of the pro
prediction environmena timely m
sults and onmaking a
system; empecursive daensive comfinal structue trade-off nalysis usinthe differenptimal perfa real-time
ertainty in tcategory of em data wheding a pre-sll automati
roach for en to a serieof day (wee
The modelinmay be devented with utput of theipated numb
ey impose. Mon to the
oposed park
systems thant, the effecmanner (21
n the time inprediction
pirical resuata-search
mputational ure of the pbetween si
ng genetic ant models. formance of
training sttraining timneural netw
ere inaccuraspecified thcally promp
estimating tes of factorekday, weekng will be bveloped und
the predicte model (theber of avail
Moreover, ttype of d
king occupa
at operate ictiveness de
1), (22). Ren which thesn mainly dults show talgorithms time for c
prediction mimplicity analgorithms t
f the predictrategy to a
me is treatedwork modelate predictiohreshold fopt for retra
the probabirs such the kend), and based on suder a varietted value oe probabilitable space)
the use of mday (weeke
ancy predic
in real-timeepends, moeal-time sysse are produ
depends on that data-dr
exhibit ‘bconvergenc
model is kepnd efficiencto optimize
tion systemaccount for d by controlls. During rons are deteor example)aining when
ility of fin traffic volthe time pe
urvival analyty of functif occupancty of findincan be visu
6
more ends,
ction
and ostly, stem uced
the riven best’ e at pt as cy is e the
m the new lling real-
ected ) are n the
nding lume eriod ysis. ional cy as g an ually
TRB 2014 Annual Meeting Original paper submittal - not revised by author

Vlahogianni, Kepaptsoglou, Tsetsos, Karlaftis 7
depicted using various graph methods (such as heat maps), to provide useful information to users. Neural Network Models for Time Series Prediction Time series modeling is a popular approach for making predictions in transportation problems (24). This approach is suitable for analyzing parking occupancy due to the temporal structure of the performance measures of parking systems. A common prediction strategy implemented in transportation problems is based on the autoregressive moving average family of models. These models are relatively straightforward mathematically and easy to produce; however, they are severely constrained by stationarity and linearity, characteristics that most frequently violated in real transportation time series. Treating non-stationarity and nonlinearity may lead to a tedious process without achieving the desired levels of accuracy in predictions and modeling reliability (25). Neural Networks (NNs) for time series provides a good alternative, as they relax many of these constraints (25), and also appear to provide short-term forecasting models that are more adaptable to sudden shifts in the data (27). A recent study on traffic time series prediction has shown the structural equivalencies between nonlinear univariate and multivariate ARIMA models with exogenous variables and dynamic forms of Multilayer Perceptrons (MLPs) (27). The simplest of all is the NAR(p) structure of order p. In general, The MLP presented with p lagged values of parking occupancy Ok ( k=1,…,n) may act as a predictor of the form (28):
11 1
ˆˆ ( ,..., )pI
k k k p i ij k j ii j
O h O O W f w O
(1)
Where f is a smooth monotonic function, iW and ijw are the weights of the
connections (synapses) - coefficients - estimated through learning (training) thereby obtaining an estimate of the nonlinear approximation h . The network converges to an
estimate of h by minimizing the residuals 2ˆk kk
O O using a learning algorithm
(usually back-propagation). For a time series consideration in a NN framework, the MLP should be
modified to account for the time sequence of events under study. This is usually accomplished by adding memory structures in than MLP that retain the effect of past information to the system and use it during learning. The memory is accomplished using local - at an intra-neuron level - and global - between neurons of different layers - recurrent connections in a neural network. Memory mechanisms may be of a simple tap delay form realizing structures:
( ) ( ),..., ( ( 1) )t O t O t m O (2)
where τ is the delay and m the dimension of the horizon of past information introduced to the model or of other more complex mathematical forms (Gamma memory and so on). The networks with memory usually require cumbersome and slow learning procedures that may not be always stable (27). To avoid this, static MLPs can be externally modified to represent the temporal characteristics of transportation time series (e.g. parking occupancy) in a manner resembling the common statistical prediction techniques. The introduction of such data inputs in
TRB 2014 Annual Meeting Original paper submittal - not revised by author
Vlahogianni, Kepaptsoglou, Tsetsos, Karlaftis 8
MLPs that are unchanged in their internal structural logic may conceptually approximate very complex and multivariate statistical structures with equal efficiency as classical MLPS. Hazard-Based Free Parking Duration Modeling Hazard-based duration modeling deals with the statistical representation of time to event data, a very frequent form of data in transportation problems; typical example of such transportation data is the time to clear and incident (29), (30), the time until the end of congested phenomena (31),(32), the time until the end of transit vehicle repair (33), the time to an activity (34), (35), the time to household evacuation under the emergence of a physical disaster (36), the time for a pedestrian to cross a signalized intersection approach (37), the time to vehicle transaction (38) and so on. Extensive review on the hazard based transportation modeling applications may be found in Hensher and Mannering (39) and Bhat (40). Moreover, methodological, computational and estimation issues in duration modeling with focus on transportation problems may be found in Washington et al. (25).
Parametric hazard-based modeling is based on two concepts: the survival function and the hazard function. Let T be a non-negative random variable representing the time a vehicle occupy a space, the survival function is defined as the probability that T is of length at least t (i.e. a parking space is occupied at least t min) and is given by:
( ) ( ) 1 ( ), 0 ,S t P T t F t t (3) where ( )F t is the cumulative probability. The survival function ( )S t can have a variety of shapes following certain restrictions; it is bounded by 0 and 1 and, as T cannot be negative, S(0) = 1. Moreover, the larger the t, S never increases (and usually decreases).
For continuous survival data, the hazard function specifies the instantaneous failure rate at T=t conditional upon survival to time t and defined as (25):
0
Pr( | ) ( )( ) lim ,
( )t
t T t T t f th t
t S t
(4)
where ( )f t is the probability density function:
( ) ( )
( )dF t dS t
f tdt dt
(5)
By combining (2) and (3) we get:
( ) log ( )d
h t S tdt
(6)
The hazard function h(t) is always nonnegative and, unlike survival functions, has no upper bound. Parametric hazard based models may have a range of different functional forms aiming at modeling different distributional characteristics. The hazard rate ( )h t X with covariates is given by:
0( ) ( )exp( )h t h tX βX (7)
where 0 ( )h t is the baseline hazard rate, β is a vector of estimated parameters and X is a vector of covariates.
TRB 2014 Annual Meeting Original paper submittal - not revised by author

Vlah
IMP DatParkSaneachpossoccua spvehnumparkcharfourwhiFIG
FIGwww
turnshowweeoccucritiperian o
hogianni, Ke
PLEMENT
taset king inform
ntander (FIGh sensor evsible to straupancy, durpecific areaicles within
mber of vehking space racteristics r (4) regionile searchin
GURE 2.
GURE 2: Pw.ploigos.gr
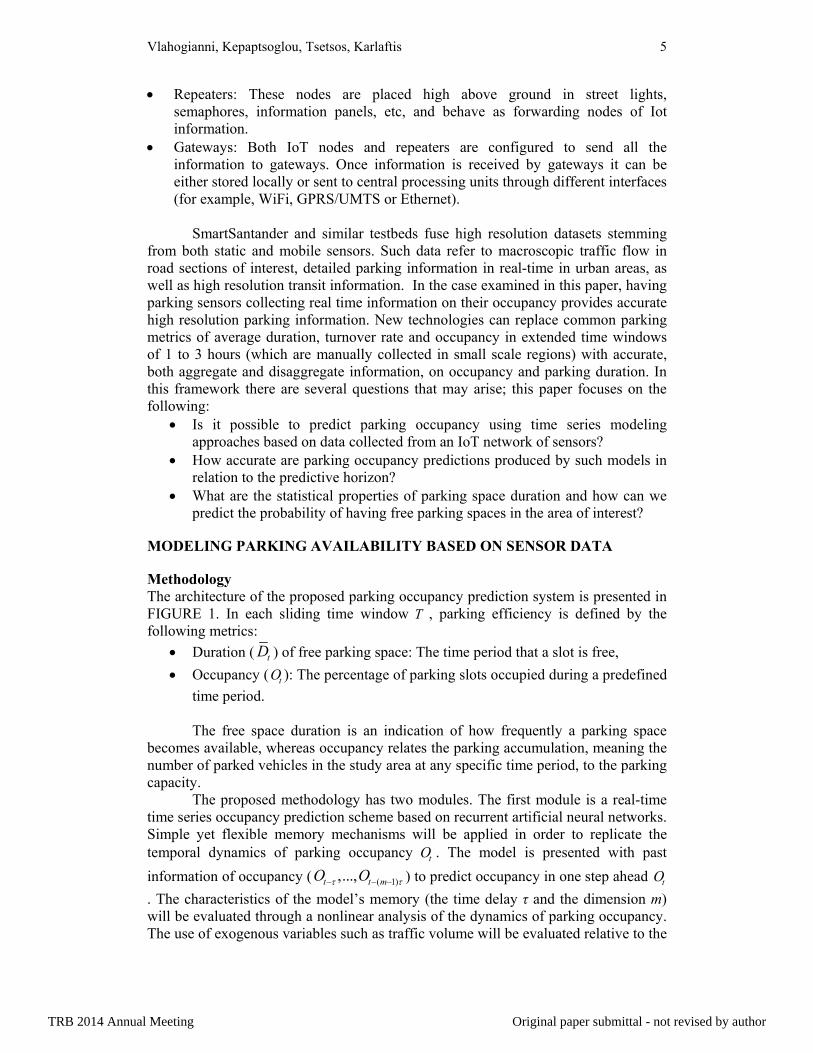
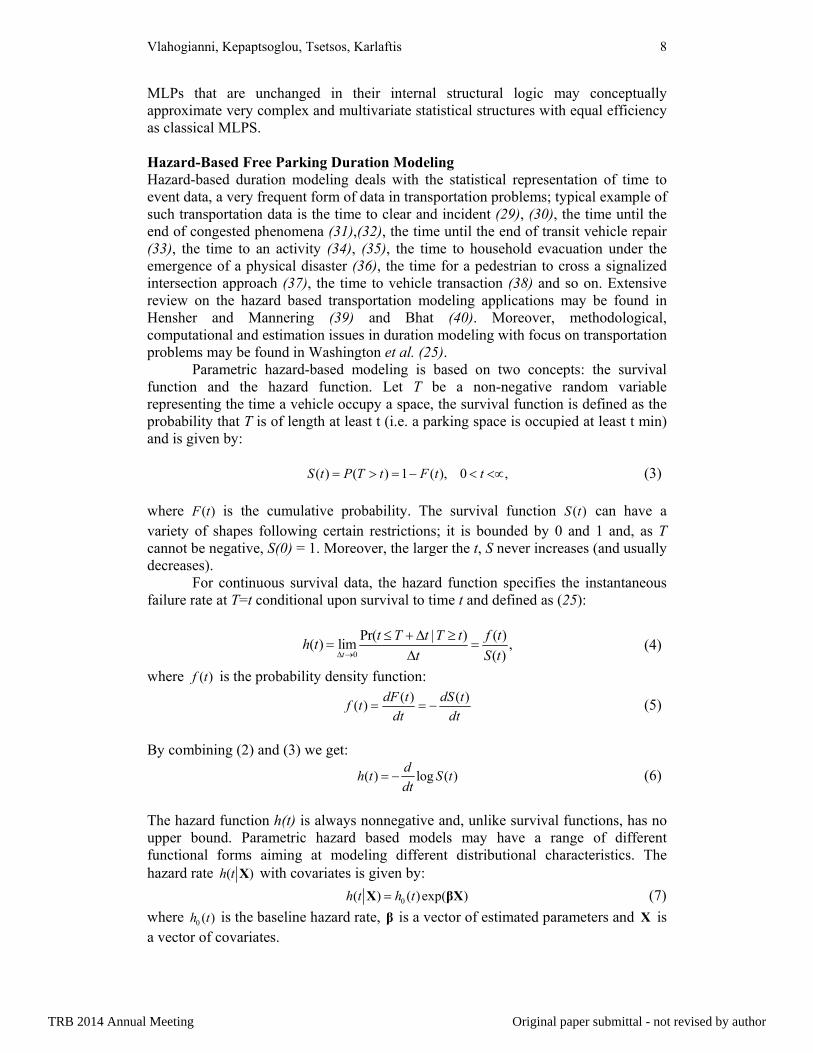
FIGURnover rate (ws that therekdays and wupancy for ical occupaiods within occupancy t
epaptsoglou,
TATION A
mation comGURE 2). Tvery 1 minuaightforwardration and sa, which isn a time intehicles per pa
is not octhe entire a
ns; this segmng for avail
arking sensr/es)
RE 3 and 4 (veh/space/hre exist diffeweekends fRegion I in
ancy, we maa day. High
threshold of
Tsetsos, Kar
AND RESU
mes from a The availabute for the mdly calculato on. In this the perceerval; ii) thearking spaccupied by
area coveredmentation ilable parkin
sors locatio
show theh) per regioferences in tfor all regionn the morninay distinguih/low occupf 90%.
rlaftis
LTS
network ofble dataset cmonth of Apte parking ms study we
entage of pe turnover race in a time
vehicles. Fd by the parks done base
ng spaces.
on in the a
time serieson for a typthe mean of ns. Moreovng and afteish betweenpancy perio
f 253 sensoconsists of pril 2013. Wmetrics suchfocus on: i)
parking spaate (veh/spae interval; aFor correctking sensored on driveThe specifi
area of San
s of parkinpical week.
f occupancyver, high varrnoon is ob
n high occuods for the o
ors located time series
With this inh as parking) parking ocaces that arace/t), whichand, iii) the tly analyzinrs is further ers’ feasiblefic regions
ntander (ma
ng occupanc. Further st
y and turnovriability in abserved; settupancy and other parkin
in the ares of the statnformation, g accumulatccupancy (%re occupiedh is equal toduration th
ng the parsegmented
e cruising pare depicte
ap accessed
cy (%) andtatistical tesver rate betwaverage parting 85% aslow occupa
ng regions h
9
ea of te of it is
tion, %) of d by o the hat a rking
into paths ed in
d at:
d the sting ween rking s the ancy have
TRB 2014 Annual Meeting Original paper submittal - not revised by author
Vlahogianni, Kepaptsoglou, Tsetsos, Karlaftis 10
FIGURE 3: Hourly evolution of parking occupancy (%) and turnover rate (veh/space/h) for Regions I and II for a typical week.
FIGURE 4: Hourly evolution of parking occupancy (%) and turnover rate (veh/space/h) for Regions III and IV for a typical week.
TRB 2014 Annual Meeting Original paper submittal - not revised by author

Vlah
distrparaduraon aIV,
FIGregi SurHazregiformTypWee TAB
park
hogianni, Ke
Duratioribution; thameters λ anation of occaverage are where the p
GURE 5: Suion.
rvival Analyzard based ion. Based ms of WeibpeDay (weekekday (1 to
BLE 1: Surv
Variable
Constant TypeDayPeriod WeekdayLog likelLR chi2(Prob > ch
As can king region
epaptsoglou,
on of occuphe survivalnd p to be ecupied parkexpected in
probability o
urvival prob
ysis of Freefree parkinon prelimin
bull regressikend/weekd7, from Mo
vival analysi
y
y lihood 1) hi2
be observn when mod
Tsetsos, Kar
pied spaces l curve ha
estimated. Fking spaces n Region I aof a space b
babilities fo
e Parking Sng space dunary analysion models day), the Peonday to Su
is results.
Region-2.980.43
- -
770.8610.150.000
ed, differendeling free
rlaftis
for all regas the folloFIGURE 5 s
per region. and II whenbeing occup
or the dura
Spaces uration modsis, a Weibu
are tested eriod of dayunday). Resu
n I Region8 -2.9
-0.1
-6 -1764
5 9.70 0.00
nt independparking spa
gions is besowing formhows the suHigher pro
n compared pied after 60
ation of occ
dels are deull survivalwith indepe (high /low ults are seen
βi n II Regi90 -2
3 0
4.64 -198 8
02 0.
dent variablace duratio
st describedm: ( ) exS t urvival probobabilities ato those of
0 minutes dr
cupied park
eveloped fol function iendent varioccupancy
n in TABLE
ion III Re2.65
- 0.15
- 32.55 -
8.28 .002
les are signn. In Regio
d by a Weixp( )pt , babilities forafter 60 minRegions IIIrops below
king spaces
or each pars used. Seviables beingperiod) and
E 1.
egion IV -2.06
- -
-0.04 -4367.82
14.36 0.0002
nificant in eon I, free sp
11
ibull with r the
nutes I and 0.5.
per
rking veral g the d the
each pace
TRB 2014 Annual Meeting Original paper submittal - not revised by author

Vlah
duraRegRegdem(FIGforthis awee
FIGthe
and spacrespbut abov ParA uoccuoccubackusefthe minnetwto tconlear
hogianni, Ke
ations are gion II and gion IV, fremand. IntereGURE 6) thhcoming in
a probabilityekdays; this
GURE 6: Sufour regions
The sam
increases tce to be frepectively. Fsignificant ve survival
rking Occupunique MLPupancy (%upancy. Thk time winful, multipldeveloped m
nutes ahead)works in tratheir structducted usin
rning rate a
epaptsoglou,
dependent III, free spe space duresting resuhat show whntervals, givy of a parkiincreases to
rvival curves under stud
me probabilto 0.79 in
ee after 5 mFinally, in R
the probabicurves may
pancy PredP for each p
%) of parkie input spac
ndow rangine steps ahemodels is e). Followinansportationtural and lng a simpland momen
Tsetsos, Kar
on the typpace duratiorations chanults arise frhether the p
ven it has laing space co 0.83 for w
es based ondy.
lity for Reglow occupa
minutes is 0.Region IV tility ranges y be used as
diction parking reging spaces ce is introdung from 5 ad predictio
extended frong previous n problems,earning pro
le back protum. The s
rlaftis
pe of day (ons depend nge with regrom observphenomeno
asted up to tcontinuing tweekends.
the models
gion II spaceancy period69 and 0.73the differenfrom 0.63 i
s a predictiv
gion is deveusing pas
uced with ito 10 minuons are requom 1 step to
research o, the neuraloperties usopagation astructure of
(weekend oon the per
gard to the ving the suon will conttime t. For eto be free a
s developed
es is 0.77 fds. In Regio3 for high aces of the sin Mondays
ve tool for p
eloped in ost informatinformation utes. For thuired. Hereo 60 steps aon short ter networks a
sing geneticalgorithm wf the hidden
or weekdayiod of the daily evolu
urvival protinue to be example, inafter 5 minu
for free spa
for high occon III the pand low occsame probas and 0.69 iparking avai
order to pretion on theon occupan
he predictio, the predic
ahead (that irm predictioare optimizc algorithm
with geneticn layer (num
ys), whereaday. Finally
ution of parbability cuobserved in
n Region I tutes of 0.76
ace duration
cupancy perprobability cupancy perability are sin Sundays. ilability.
dict the ove evolutionncy with a n system to
ction horizois, from 1 ton using nezed with resms. Trainincally optimmber of hid
12
as in y, in rking urves n the there 6 for
ns in
riods of a
riods mall The
verall n of look o be
on of o 60 eural spect ng is mized dden
TRB 2014 Annual Meeting Original paper submittal - not revised by author

Vlahogianni, Kepaptsoglou, Tsetsos, Karlaftis 13
units) is also optimized using genetic algorithms. The model’s look back time window is also genetically optimized. The available data is divided into the training (60%), cross-validation (20%) and test set (20%) used for training the models, evaluating the training of the models, and testing the generalization power of the models, respectively. The genetic optimization showed that an MLP of 8 hidden layers and a look back time window of 5 minutes in the past may be efficiently used to predict parking occupancy (%) up to 60 steps in the future with high accuracy. Prediction results (test set) are seen in TABLE 2 with respect to the following forecasting metrics:
Mean Absolute Error (MAE): ˆi i
i
y y
N
Root mean squared error (RMSE): 2
ˆi ii
y y
N
Mean absolute percentage error (MAPE): ˆ1 i i
i i
y y
N y
Root relative squared error (RRSE): 2 2ˆ ˆi i i i
i i
y y y y
N N
where iy and ˆiy is the actual and predicted value with 1,..,i N , I is the time step, N is the number of samples, iy is the last known value relative to the prediction step. Results seem encouraging particularly for longer prediction horizons. For example, the models are able to predict each region’s parking occupancy 15 minutes into the future with less than 4.2% MAPE. TABLE 2: Results for different prediction horizons (prediction step τ equals to 1 minute) for each parking region (test set).
Prediction Horizon Region 1 1 min 5 min 15 min 30 min 60 min
MAE 0.011 0.028 0.034 0.036 0.037 RMSE 0.018 0.036 0.043 0.045 0.047 MAPE 1.374 3.437 4.188 4.377 4.490 RRSE 92.057 95.666 71.883 60.379 54.060
Region 2 MAE 0.007 0.010 0.012 0.013 0.014 RMSE 0.010 0.013 0.015 0.017 0.017 MAPE 0.816 1.103 1.312 1.449 1.488 RRSE 76.843 71.500 75.652 76.849 61.916
Region 3 MAE 0.007 0.0105 0.01 0.010 0.010 RMSE 0.010 0.014 0.013 0.013 0.013 MAPE 0.702 1.11 1.062 1.037 1.033 RRSE 83.768 69.759 53.292 48.397 43.354
Region 4 MAE 0.011 0.019 0.024 0.026 0.026 RMSE 0.016 0.025 0.030 0.033 0.033 MAPE 1.237 2.169 2.611 2.873 2.835 RRSE 87.012 90.657 81.631 70.029 54.740
TRB 2014 Annual Meeting Original paper submittal - not revised by author

Vlah
accuof paccugraphoridevprobdiffReg
FIGnetw
withevoprovarea REATheTranprojis tocaptinfrhavplatcitizguidserv S R E
hogianni, Ke
Interesturate than aprediction) urate the Mphical repreizons. As eloped are blems met iferent betwegions 2 and
GURE 7: Mwork parkin
It is to nh acceptablelution of 1 ve to be cras.
AL WORLe above monspOrt planject (http://mo deliver noture perceiastructure ie on the datform provizens and vidance beforvices:
Stop/Line/PRoute GuideEstimation o
epaptsoglou,
tingly, all ma naïve predas seen fro
MLP becomesentation ocan be obvery satis
in transporteen the fou3, whereas
Mean Absolung occupanc
note that Me levels of minute par
ritical in de
LD APPLICodels havenning Systemitos.smartovel Intelligived user is available,aily transporides an intsitors to opre and durin
OI Survey ae, of Next Bus
Tsetsos, Kar
models perfdiction (e.gom the RRSmes relativof the MAPbserved, onsfactory, paation (24). I
ur Regions. the least ac
ute Percent cy prediction
MLPs managaccuracy. Arking occupelivering us
CATION e been impem). MITOStsantander.egent Transpoexperience., provides nrtation of thtegrated m
ptimally chong their tri
and Search
s arrival,
rlaftis
form well an. taking theSE. The lar
ve to a naïPE evolutionn average,articularly InterestinglMore accu
ccurate pred
Error (MAn models (te
ge to producAlthough thpancy data,seful inform
plemented S is a systeeu), in the cortation Ser. The factnew ways ohe commute
multi-modal oose their trip. The MIT
for public t
nd producee last knownrger the prïve predictin with respthe errors when comply, parking ourate predicdictions are a
APE) for mest set).
ce predictiohis may hint, the efficiemation serv
in the MITem developcity of Santarvices (ITS)t that an Iof quantifyiners and the
transportatrips and getTOS platfo
transport,
e predictionn value relaredictive hoion. FIGURpect to diffe
produced pared to ooccupancy p
ctions are aaccomplish
multiple step
ons up to 60t a rather smency of thevices to trav
TOS systemped within Sander, Spai) to smart cIoT (Internng the effecenvironmen
tion guide,t accurate irm include
ns that are mative to the orizon the mRE 7 showerent predic
by the Mother predicpredictabili
accomplisheed in Regio
p ahead ne
0 minutes ahmooth temp
ese models velers in u
m (Multi-ISmartSantain. MITOS city citizensnet of Thict that ITS nt. The MIT which all
informations the follow
14
more step
more ws a ction
MLPs ction ity is ed in on I.
eural
head poral may
urban
nput ander
goal s and ings) may TOS lows
n and wing
TRB 2014 Annual Meeting Original paper submittal - not revised by author

Vlahogianni, Kepaptsoglou, Tsetsos, Karlaftis 15
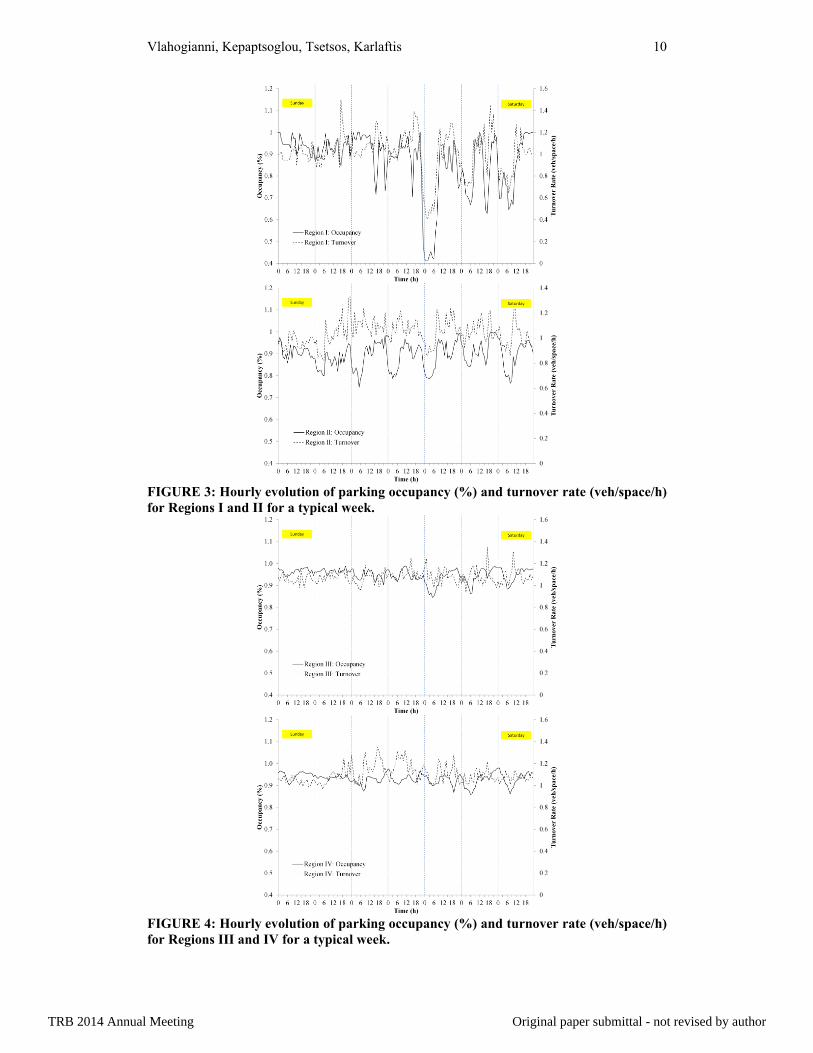
Parking monitoring and short-term parking occupancy prediction. The architecture of the MITOS platform is seen in FIGURE 8. The services and applications deployed and demonstrated in the context of MITOS include a Web portal for transportation information, which is used as a city guide for citizens and tourists, and a mobile application for advanced transportation services. The last provides all type of information required by commuters and enables intuitive ways for searching routes and geo-referenced information based on the personal preferences and abilities of each user.
FIGURE 8: Architecture of MITOS platform.
An added value of the MITOS platform comes from the exploitation of various diverse sensor sources such as: Participatory sensors: users will act as sensors that provide relevant traffic and
travel information in the form of free text or predefined messages (e.g. “heavy traffic”, “too much noise”, etc.) and/or image.
Environmental data sensors, measuring noise, temperature and CO/ CO2 emissions On-street parking space occupancy sensors. Traffic occupancy sensors On-vehicle devices (GPS) installed in buses.
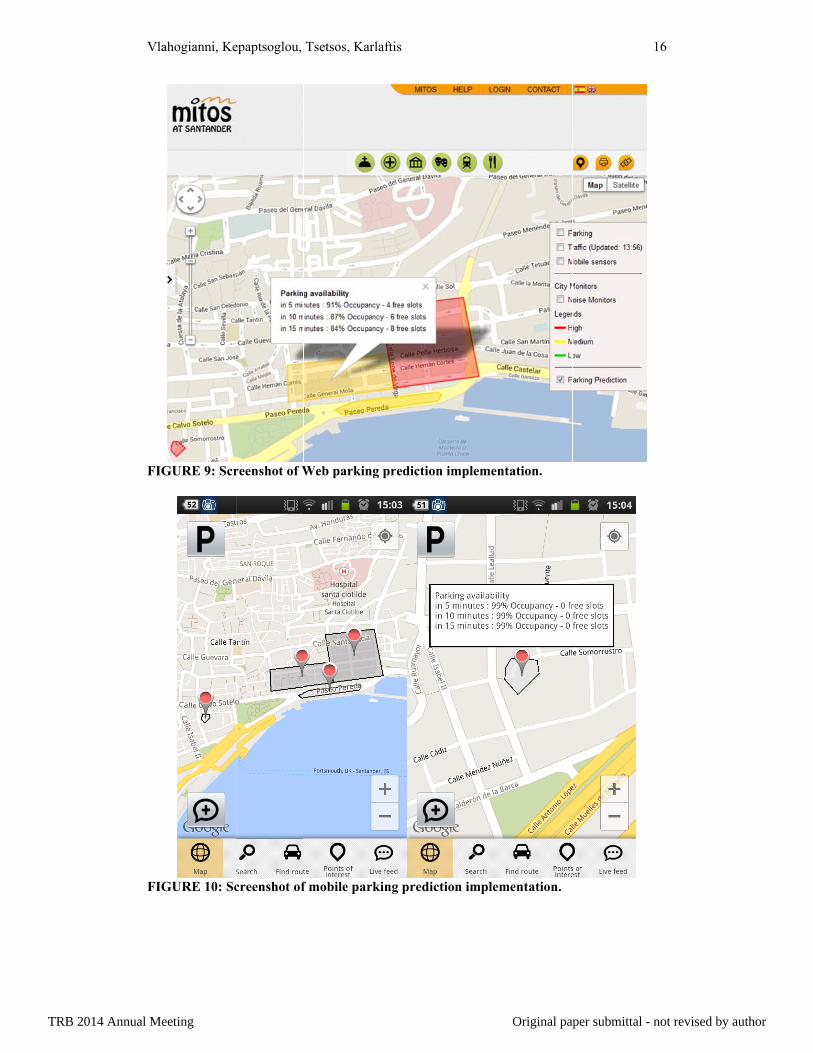
The implementation of a parking prediction service involves retrieving parking sensor data every minute (through the SmartSantander framework APIs) and storing them in a relational database (MITOS DB). Next, the algorithms described earlier are executed, and a continuous stream of predictions is generated. Those predicted values are stored back in the database, so that related user requests on parking availability can be served as fast as possible. Following user requests for parking occupancy, data are retrieved and visualized on a digital Web map (FIGURE 8) and on a mobile phone (FIGURE 9). The visualization involves data easily perceived by the end users, such as estimated occupancy and estimated number of free parking slots in the short-term future (5, 10 and 15 minutes ahead).
TRB 2014 Annual Meeting Original paper submittal - not revised by author
Vlah
FIG
FIG
hogianni, Ke
GURE 9: Scr
GURE 10: Sc
epaptsoglou,
reenshot of W
creenshot of
Tsetsos, Kar
Web parkin
f mobile par
rlaftis
ng prediction
rking predic
n implement
ction implem
tation.
mentation.
16
TRB 2014 Annual Meeting Original paper submittal - not revised by author

Vlahogianni, Kepaptsoglou, Tsetsos, Karlaftis 17
CONCLUSIONS Driver decisions increasingly rely on technologies and information services that deliver high resolution transportation information. Parking availability prediction is a critical problem that has been recently investigated by researchers with the use of advanced algorithms combined with novel technological capabilities in data collection and processing. In this paper we exploited high resolution parking occupancy data and developed and tested a system for short and longer term parking availability prediction in urban areas.
The system encompasses two modules; the first applies survival analysis to predict the probability that a parking space will be free in the following time intervals. The second module introduces neural networks for the prediction of the time series of parking occupancy in different regions of an urban network. Findings show that the duration of free parking space follows a Weibull distribution. Moreover, the neural networks adequately captures the temporal evolution of parking occupancy and may accurately predict occupancy up to one hour ahead. The system is successfully incorporated within an innovative routing service (MITOS) for Santander, Spain, using real time data from the city’s “smart” infrastructure. ACKNOLEDGEMENTS
This work is part of the MITOS experiment, incorporated in the SmartSantader project and funded by the European Union Seventh Framework Programme (FP7). REFERENCES 1. Oh, B., Lee, S., Kim, M., & Yang, Y. Spatial applications using 4S technology for
mobile environment. In Proceedings of the geoscience and remote sensing symposium, Toronto, Canada, 2002.
2. Liu, Q., Lu, H., Zou, B., & Li, Q. Design and development of parking guidance information systems based on Web and GIS technology. In Proceedings of the 6th international conference on ITS telecommunications, Chengdu, China, 2006.
3. Caicedo, F., Blazquez, C., Miranda, P. Prediction of parking space availability in real time. Expert Systems with Applications, Vol. 39, No. 8, 2012, pp. 7281-7290.
4. Giuffrè, T., Siniscalchi, M.S., Tesoriere, G. A Novel Architecture of Parking Management for Smart Cities, Procedia - Social and Behavioral Sciences, Vol. 53, No. 3, 2012, pp. 16-28.
5. Teodorovic, D., Lucic, P. Intelligent parking systems. European Journal of Operational Research, Vol. 175, No. 3, 2006, pp. 1666-1681.
6. Caicedo, F., Robuste, F., Lopez-Pita, A. (2006). Parking management and modeling of car park patron behavior in underground facilities. Transportation Research Record, No. 1956, 2006, pp. 60–67.
7. Young, W., Thompson, R.G., Taylor, M.A.P., A review of urban parking models. Transport Reviews Vol. 11, No. 1, 1991, pp. 63–84.
8. Arnott, R., Rowse, J. Modeling parking. Journal of Urban Economics, Vol. 45, No. 1, 1991, pp. 97–124.
9. Bonsall. P.W. The changing face of parking-related data collection and analysis: The role of new technologies. Transportation Vol. 18, No. 1, 1991, pp. 83-106.
10. David, A., Overkamp, K., Scheuerer, W. Event-oriented forecast of the occupancy rate of parking spaces as part of a parking information service. Proceedings of the 7th World Congress on Intelligent Systems, Turin, Italy, Nov 6th-9th, 2000.
TRB 2014 Annual Meeting Original paper submittal - not revised by author

Vlahogianni, Kepaptsoglou, Tsetsos, Karlaftis 18
11. David, A., & Keller, H. Event-Driven Modelling Of On-Street Parking Probability. Proceedings of the 8th World Congress on Intelligent Transport Systems, Sydney, New South Wales, Australia, 2001.
12. Martens, K., & Benenson, I. Evaluating urban parking policies with agent-based model of driver parking behavior. Transportation Research Record, No. 2046, 2008, pp. 37–44.
13. Caicedo, F. The use of space availability information in “PARC” systems to reduce search times in parking facilities. Transportation Research Part C: Emerging Technologies, Vol. 17, No. 1, 2009, pp. 6–68.
14. Chen, Z., Xia, J., Irawan, B., Development of Fuzzy Logic Forecast Models for Location-Based Parking Finding Services, Mathematical Problems in Engineering, vol. 2013, Article ID 473471, 6 pages, 2013.
15. Fabusuyi, T., Hampshire, R.C., Hill, V., Sasanuma, K. A Predictive Model and Evaluation Framework for Smart Parking: The Case of ParkPGH. Proceedings of the 18th ITS World Congress, Orlando, Oct 16th-20th, 2011.
16. Caragliu, A; Del Bo, C. & Nijkamp, P. Smart cities in Europe. Serie Research Memoranda 0048 (VU University Amsterdam, Faculty of Economics, Business Administration and Econometrics), 2009.
17. Komninos, N. Intelligent cities: towards interactive and global innovation environments". International Journal of Innovation and Regional Development, Vol. 1, No. 4, 2009, pp. 337–355.
18. Atzori, L., Iera, A., Morabito, F., The Internet of Things: A survey, Computer Networks, Vol. 54, No. 15, 2010, pp. 2787-2805.
19. Vlacheas, P.; Giaffreda, R.; Stavroulaki, V.; Kelaidonis, D.; Foteinos, V.; Poulios, G.; Demestichas, P.; Somov, A.; Biswas, A.R.; Moessner, K., Enabling smart cities through a cognitive management framework for the internet of things. IEEE Communications Magazine, IEEE , vol.51, no.6, 2013.
20. Gutiérrez, V., Galache, J.A., Sánchez, L., Muñoz, L., Hernández, J.M., Fernandes, J., Presser, M., SmartSantander: Internet of Things Research and Innovation through Citizen Participation, Future Internet Assembly - Dublin (Ireland), Lecture Notes in Computer Science, Vol.7858, 2013, pp 173-186
21. Smith B. L., Oswald, R. K. Meeting Real-Time Requirements with Imprecise Computations: A Case Study in Traffic Flow Forecasting. Computer Aided Civil and Infrastructure Engineering. vol. 18, no. 3, 2003, pp. 201-213.
22. Vlahogianni E. I., Karlaftis, M. G., Golias, J. C. and Kourbelis, N. D. (2006). Pattern-based Short-term Urban Traffic Predictor. Proceedings of the 9th International IEEE Conference on Intelligent Transportation Systems, September, Torondo, Canada.
23. Shin K., Ramanathan P. Real-time computing: A new discipline of computer science and engineering. Proceedings of the IEEE, vol. 82, 1994, pp. 6-24.
24. Karlaftis, M. G. and Vlahogianni, E. I. Statistics versus Neural Networks in Transportation Research: Differences, Similarities and Some Insights, Submitted to Transportation Research Part C: Emerging Technologies, Vol. 19, No. 3, 2011, pp. 387-399.
25. Washington S., Karlaftis M.G. and Mannering F.L. Statistical and econometric methods for transportation data analysis, 2nd Edition. Chapman & Hall/CRC Press, Boca Raton, FL., 2010.
26. Vlahogianni, E. I. Enhancing Predictions in Signalized Arterials with Information on Short-Term Traffic Flow Dynamics, Journal of Intelligent Transportation Systems, Vol. 13, No. 2, 2009, pp. 73-84.
TRB 2014 Annual Meeting Original paper submittal - not revised by author

Vlahogianni, Kepaptsoglou, Tsetsos, Karlaftis 19
27. Vlahogianni, E. I., Karlaftis, M G. Testing And Comparing Neural Network and Statistical Approaches for Predicting Transportation Time Series, Transportation Research Record, In press.
28. Mandic D. P., Chambers J. A., Recurrent Neural Networks for Prediction: Learning Algorithms, Architectures, and Stability, Wiley Series in Adaptive and Learning Systems for Signal Processing, Communications, and Control, ISBN 0471495174 (Print), John Wiley & Sons, 2001.
29. Chung, Y. Development of an accident duration prediction model on the Korean Freeway Systems, Accident Analysis and Prevention, Vol. 42, No., 2, 2010, pp.282–289.
30. Vlahogianni E.I., Karlaftis, M.G., Golias, J. C., Halkias, B. Freeway Operations, Spatio-temporal Incident Characteristics, and Secondary-Crash Occurrence, Transportation Research Record: Journal of the Transportation Research Board No 2778, 2010, pp. 1-9.
31. Stathopoulos, A., Karlaftis, M. G. Modeling duration of urban traffic congestion. J. Transp. Eng., Vol. 128, No. 6, 2002, pp. 587–590.
32. Vlahogianni, E.I., Karlaftis, M.G., Kepaptsoglou, K.. Nonlinear Autoregressive Conditional Duration Models For Traffic Congestion Estimation, Journal of Probability and Statistics, Article ID 798953, 2011.
33. Karlaftis, M. G.. Modeling transit vehicle repair duration and active service time, Transportation Planning and Technology, Vol. 34, No. 5, 2011, pp. 433-442.
34. Zhong, M., Hunt, J.D. Exploring best-fit hazard functions and lifetime regression models for urban weekend activities: Case study, Journal of Transportation Engineering, Vol. 136, No. 3, 2010, pp 255-266.
35. Habib, K. M. N. Modeling commuting mode choice jointly with work start time and work duration, Transportation Research Part A: Policy and Practice, Vol. 46, No. 1, 2012, pp. 33-47.
36. Hasan, S., Mesa-Arango, R. Ukkusuri, S. A random-parameter hazard-based model to understand household evacuation timing behavior, Transportation Research Part C: Emerging Technologies, Vol. 27, No. 1, 2013, pp. 108–116.
37. Tiwari G., Bangdiwala, S., Saraswat, A. Gaurav, S. Survival analysis: Pedestrian risk exposure at signalized intersections Transportation Research Part F, Vol. 10, No.1, 2007, pp. 77–89.
38. Rashidi, T. H., Mohammadian A., Koppelman, F. S. Modeling interdependencies between vehicle transaction, residential relocation and job change, Transportation, Vol. 38, No. 6, 2011, pp. 909-932.
39. Hensher, D. A. and Mannering, F.L. Hazard-based duration models and their application to transport analysis, Transport Reviews: A Transnational Transdisciplinary Journal, Vol. 14, No. 1, 1994, 63-82.
40. Bhat, C.R. (2000). Duration modeling. In: D.A. Hensher and K.J. Button, eds. Handbook of transport modeling. London: Elsevier Science.
TRB 2014 Annual Meeting Original paper submittal - not revised by author