Embed Size (px)
Citation preview
1
Exploiting Delay Budget Flexibility forEfficient Group Delivery in the Internet of Things
Yuhui Yao, Yan Sun, Chris Phillips, Yue Cao, Member, IEEE and Jichun Li
Abstract—Further accelerated by the Internet of Things (IoT)concept, various devices are being continuously introduced intodiverse application scenarios. To achieve unattended updatesof IoT smart object(s), there remains a challenging problemconcerning how to efficiently deliver messages to specific groupsof target nodes, especially considering node mobility. In thispaper, the relay selection problem is investigated on the basis ofdirectional movement with randomness (e.g. typically associatedwith the searching or migrating behaviour of animals). Unlikenumerous works tackling one-to-one communication, we focuson efficient group delivery (one-to-many). A two-level delaybudget model is considered to reflect the flexibility of delay tol-erance, which brings potential efficiency gains for group deliverycompared with using a single budget boundary. Following thedescription of the system model, a combinatorial bi-objectiveoptimisation problem is formulated and solutions are proposed.Simulation results show that the greedy algorithm can achievecomparable performance to an evolutionary algorithm when thedelivery satisfaction outweighs efficiency. Furthermore, we showthat our proposed greedy scheme can outperform the state-of-the-art when the delivery efficiency becomes increasingly important.
Index Terms—Internet of Things, group delivery, relay selec-tion, delay budget, directional movement
I. INTRODUCTION
Along with the fast evolution of information technologies,Internet services have now widely penetrated into our dailylives. Further accelerated by the Internet of Things (IoT)concept, various devices are being continuously introducedinto diverse application scenarios that promise a ubiquitousmeans to sense and control everything [1]. In contrast withthe conventional Internet, a network node in this IoT contextcould be different types of device embedded with networkinterface(s), such as intelligent appliances [2], multimediasensors [3], and robotic actuators [4]. Within the context ofIoT, the term ‘smart object’ (interchangeably used with theterm ‘node’ in the remainder of this paper) is used to representany possible thing that can provide data and/or undertakeactions for IoT applications [5].
For long-term continuous operation of IoT systems, recon-figurations and upgrades are usually inevitable. As discussedin [6], it has been realised that the unattended updating ofsmart object(s) can be achieved by disseminating a packageof updated instructions (called a code package). Without loss
Y. Yao, Y. Sun, and C. Phillips are with the Department of ElectronicEngineering and Computer Science, Queen Mary University of London,London E1 4NS, U.K. (e-mail: [email protected]; [email protected];[email protected])
Y. Cao is with the School of Computing and Communications, LancasterUniversity, Lancaster LA1 4WA, U.K. (e-mail: [email protected])
J.Li is with the Department of Engineering, Teesside University, Middles-brough TS1 3BX, U.K. (e-mail: [email protected])
of generality, this paper assumes that code packages are sentfrom the network gateway that serves as an interface to outsidenetworks. Because IoT smart objects are typically battery-powered and rely on wireless multi-hop communications [7],blind broadcasting/flooding is not a feasible way of packagedelivery especially when some packages have a certain toler-ance of delivery failure1 and are only aimed at a subset ofthe nodes. Given specific package targets, how to efficientlyperform group delivery remains a challenging problem (espe-cially considering mobility), which is the research focus ofthis paper.
It is worth noting that delayed delivery of a code packagecould be acceptable in many cases. Larger delay budgets canresult from either non-urgent packages or planned updates(e.g. scheduled minutes or even hours in advance). Basedon research concerning Delay/Disruption Tolerant Networks(DTNs) [8] and Mobile Opportunistic Networks (MONs) [9],it is possible to facilitate the dissemination of delay-tolerantinformation by making full use of node mobility. However,as suggested in [8], most of the existing studies are limitedto individual deliveries where data is destined for a singledestination, and thus more studies are needed to address multi-destination group delivery.
Based on knowledge of vehicular navigation, delay-tolerantdelivery has been utilised to reduce forwarding hops in theliterature such as [10] and [11]. Nevertheless, the exactmovement trajectory of mobile nodes can hardly be knownin advance with regard to some IoT scenarios (e.g. a sensordeployed upon animals). Although our previous work [12] hasprovided an analysis of directional movement (e.g. foragingor migrating behaviour of animals [13]) for the delivery toindividual destinations, it has hitherto been an open issueregarding how to take advantage of such random movementswith directional correlation for the group delivery.
In this paper, feasible exploitation of directional movementis further investigated for efficient group delivery based on thecontact prediction model proposed in [12]. Compared with theindividual delivery, group delivery brings more optimisationopportunities (relay sharing between targets) but introducesmore complexity (in terms of metrics and algorithms) formaking decisions. Considering delivery efficiency and reliabil-ity, suitable selection of relay node(s) is a key challenge forgroup delivery based on the delay-tolerant routing. With an
1Failure tolerance is related to factors such as package importance and/orbackup schemes. Possible backup schemes for delivery failure are out-of-scopefor this paper but could be researched in the future.
2
awareness of directional correlation2, it is possible to leveragerandom movement for optimised group relay selection, whichis beneficial for reducing energy consumption and prolongingsystem lifetime. The main contributions of this paper are listedas follows:
• An analytical framework is proposed to formulate thegroup relay selection as a combinatorial bi-objectiveoptimisation problem. Our research considers a two-leveldelay budget model to reflect the flexibility of delaytolerance, which allows more optimisation opportunitieswhilst maintaining delivery satisfaction within acceptablebounds.
• Both an evolutionary approach and a greedy approach areproposed to solve the formulated problem. Our proposedevolutionary algorithm reveals a trade-off between deliv-ery satisfaction and cost reduction, which approximates atheoretical limit of delivery performance. Our greedy al-gorithm can make better decisions than the existing state-of-the-art to improve group delivery efficiency becausethe two-level delay budget is considered in group relayselection.
The rest of this paper is organized as follows. In SectionII, related works are reviewed and the research motivationis summarised. In Section III, the system model is describedfor later problem formulation and evaluation. In Section IV,the research problem is formulated and the proposed solutionsare demonstrated. In Section V, the performance of proposedsolutions are further analysed and discussed. The paper finallyconcludes in Section VI.
II. BACKGROUND AND MOTIVATION
A. Delivery Strategy
As surveyed in [8], the Store-Carry-Forward (SCF) strategyhas been widely researched for routing in DTNs. Two simplestSCF schemes are: Direct Delivery (DD) [14], which requiresno replication and source node keeps the message until thedestination node is in proximity; and Epidemic [15], whichblindly replicates the message to every encountered nodewithout relay selection. Despite their simplicity, these twobasic schemes are usually not enough to meet the efficien-cy/reliability of delivery requirements so many later workshave been proposed for replication control and relay selection,such as [16], [17], [18].
In literature, a Forward-Wait-Deliver (FWD) strategy hasbeen proposed for efficient delivery [12]. The FWD strategydelivers a package in three steps:
• Forward to stationary relay;• Wait for mobile target;• Deliver when target contacts the relay.
Similar to SCF routing, the FWD strategy relies on oppor-tunistic contacts resulting from node mobility. However, theFWD scheme is also supported by the multi-hop forwardingover connectible nodes and the research focus is to achieve
2The directional correlation means the temporal dependency of movementdirection for each individual node. The correlation of movement directionbetween different nodes is beyond the scope of this paper.
delivery by the shortest-possible forwarding route. To this end,FWD research is distinct from the traditional DTN works andis aimed at multi-hop wireless networking scenarios.
Compared with the approach of immediate delivery (via amulti-hop route) to the package targets, shorter routes (i.e.fewer hops) are most likely to be employed by the FWDstrategy, as it makes the full use of predictable contacts.Consequently, the FWD strategy brings a potential efficiencygain given tolerance of delivery delay. In [10], the FWDstrategy is adopted in a scenario where sensors send data toa mobile sink moving according to a predefined trajectory.The feasibility of the FWD strategy is further investigatedin [12] on the basis of directional movement with randomness.However, it is worth noting that the possibility of relay sharingis overlooked in the aforementioned works as each individualdelivery is assumed to be independent.
B. Group Delivery
In some recent works such as [19], [20], [11], the adoptionof the FWD strategy has been investigated for group delivery.With the FWD strategy, it attempts to identify a shareablerelay for a (sub)group of targets, which further reduces trans-mission times compared with treating each delivery separately.In [19] and [20], the storage constraint is considered tomaximise the overall rate of successful delivery. In [11], themaximum acceptable delay is given to minimise the overallforwarding cost. However, these approaches all rely on exactknowledge of the vehicular route in advance. Consequently,they are not directly applicable to the scenarios where mobiletargets do not strictly follow predefined trajectories, such asanimals in the wild.
With regard to partially predictable mobility, further studiesare required to apply the FWD strategy for efficient groupdelivery. Specifically, our research focus is on the scenariowhere mobile nodes (e.g. deployed on animals) tend to movewith more-or-less directional correlation (e.g. searching ormigrating behaviour) while their movement trajectories cannotbe exactly predicted. In [12], the directional correlation ofrandom movement has been investigated for efficient delivery.However, considering optimised group relay selection, the fea-sible exploitation of directional movement for group deliveryis still an unsolved problem.
To exploit the optimisation opportunities in group de-livery, algorithms are required to be designed. As provedin [19] and [11], the group relay selection problem is at leastNP-hard (i.e. non-deterministic polynomial-time hardness) andit is infeasible to search for an optimal solution [21]. Heuristicalgorithms are therefore proposed to find an approximationto the optimum in a reasonably short time [22]. As a typ-ical paradigm of heuristic algorithms, the greedy algorithmis commonly considered to solve the group relay selectionproblem, such as in [19], [20], [11]. However, none of theseexisting works have evaluated the performance of their greedyalgorithms in multi-objective optimisation.
To this end, we propose to further investigate the feasibilityof the FWD strategy for efficient group delivery. Based ondirectional correlation of random movements, the opportunity

3
for relay sharing can be exploited to reduce the overallforwarding hops. We make the first attempt to provide suchan analytical framework for group relay selection. Over manyliterature works on the topological routing, our work alsocontributes to the group delivery based on the geographicrouting (as node positions are considered for the contactprediction), which is an issue overlooked by the existingresearch [23]. Following the system model described in thenext section, our proposal will be further explained.
III. SYSTEM MODEL
A. Overview
In this section, the group delivery system model is describedfrom three aspects. Firstly, the package targets and candidaterelays are specified in Section III-B. Then a two-level delaybudget model is discussed in Section III-C as the deliveryrequirement. Finally, the contact prediction model is brieflyintroduced from [12] in Section III-D. Although this papermainly takes habitat monitoring [24] as an example IoTsystem, the application of our research can be generalised toother similar scenarios that involve directional movement withrandomness.
An illustrative example of the group delivery system isprovided in Figure 1 where three mobile nodes are the deliverytargets and twenty-five stationary nodes are the candidaterelays. With the consideration of acceptable delivery delay,one or more candidate relays are to be selected as the relaynode, to deliver a package from the sink node to target nodes.Based on contact prediction, the package is forwarded to theselected relay for later delivery when the target node is directlycontactable. In this way, fewer overall forwarding hops needto be employed leading to more efficient group delivery, asthe feasible opportunities of relay sharing can be exploited.
Fig. 1. Example scenario of the group delivery system
B. Node Deployment
Let N denote a finite set of smart objects (i.e. wirelessdevices referred as nodes) and let n ∈ N denote a single node.There is a special node that serves as the gateway (denotedby ngw) and the remaining nodes are divided into two typesaccording their mobility:
• 1) stationary nodes (denoted by Nsn) which are motion-less after deployment (e.g. fixed to environments);
• 2) mobile nodes (denoted byNmn) which can change theirpositions over time (e.g. deployed on animals).
A self-organised network can be constructed with these nodeswithout relying on additional communication infrastructures.Given a constant transmission radius (denoted by R) foreach node, network connectivity depends on node positionsas defined by a unit disk model [25].
Consider a package from the gateway ngw to a group oftarget nodes (denoted by Ntgt). To make the problem moretractable, we narrow down our research to the case where onlymobile nodes are the package target, i.e. Ntgt ⊂ Nmn.
Let N crly denote a set of candidate relay nodes. To avoid
the costly maintenance of topological dynamics caused bynode mobility, the relay candidates are limited to stationarynodes, i.e. N c
rly ⊂ Nsn. It is assumed that the delivery can beaccomplished when the target node is directly in contact rangeof the selected relay(s).
To reach candidate relay nodes from the gateway, hop-by-hop forwarding is required. The topology knowledge ofstationary nodes is assumed to be available at the gateway ngw,as the positions of stationary nodes are certain once deployed.A hop distance function fhd (ni) denotes the minimum numberof forwarding hops from the gateway to any stationary nodeni ∈ Nsn.
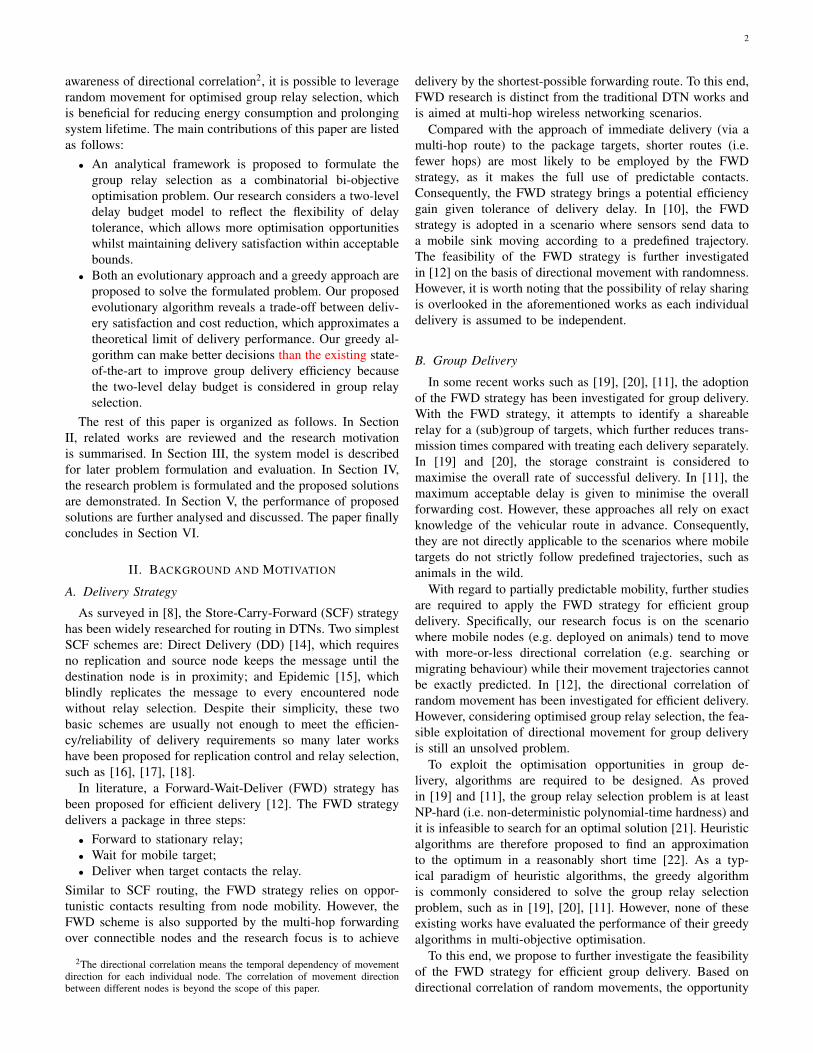
C. Delay Budget
Traditionally, the delivery is simply required to be fin-ished before a maximum acceptable delay in previous workssuch as [11]. However, for many package delivery scenarios,there exists more-or-less flexibility regarding acceptable delay,which brings optimisation opportunities that are overlooked byexisting works. To this end, our research describes the delaysensitivity by a two-level budget model:
• The first-level budget (called the main budget) has a softboundary and any earlier delivery is considered to be afully satisfied delivery.
• The second-level budget (called the extra budget) has afirm boundary and any later delivery is considered to bea fully unsatisfactory delivery.
• For the delivery delay between these two boundaries (i.e.within the range of the extra budget), it contributes todecreasing satisfaction of delivery.
This two-level budget model describes the relationshipbetween delivery satisfaction and delivery delay, called a delaybudget function. Although factors such as buffer limitation canbe considered in the budget modelling (e.g. a stricter budgetresults from more limited storage), this paper assumes that thebudget function is only related to the message delay tolerance,as our research focus is on investigating the utilisation ofdirectional movement. In other word, all relay candidates areconsidered to have sufficient resource to support the delay-tolerant relaying mechanism.
Theoretically, the delay budget function can be any type ofmonotonically decreasing function. In this paper, we focus onthe sigmoid curve (a special case of the logistic function [26])which allows smooth transition to reflect a realistic tolerance
4
of acceptable delay. Thus, the raw delay budget function isgiven as
f∗db (τ) =
1
1 + eµ(τ−τ1+τ2
2 )(1)
where τ > 0 denotes the delivery delay3, τ1 > 0 denotes thefirst-level budget boundary, τ2 > τ1 denotes the second-levelbudget boundary4, and µ denotes a functional factor.
Given τ1 and τ2, the functional factor µ determines the curveshape. To calculate the value of µ, we consider f∗
db (τ1) =1 − ϵ, where ϵ ∈ (0, 1). A smaller ϵ brings more accuracy(because the budget function can have fewer decrements beforeτ1) and ϵ is set to be 0.001 which is sufficiently accurate forour research. Then the functional factor µ can be calculatedas
µ =2 ln
((1− ϵ)
−1 − 1)
τ1 − τ2. (2)
Let the delivery satisfaction be a degree value between 0and 1, so the budget function is further normalised as
fdb (τ) =1 + e−µ( τ1+τ2
2 )
1 + eµ(τ−τ1+τ2
2 )(3)
In Figure 2, the delay budget function is illustrated forthe example where the main budget is 500 seconds. Tokeep this figure concise, only one case of extra budget isindicated (which can be shown similarly for the other twoexample cases). This figure shows that the delivery satisfactionstarts to decrease from the first-level budget boundary andbecomes zero at the second-level budget boundary. With sucha transition range, a larger delivery delay is still allowed(but less encouraged) even if the main budget is exceeded,which provides more flexibility in relay selection. For instance,the possibility of 510 seconds delay can be considered formaking a possible better offer in other respects (e.g. muchfewer forwarding hops). The optimisation opportunity broughtby this flexible delivery delay requirement will be furtherinvestigated in the remainder of this paper.
D. Contact Opportunity
An analytical model referred from [12] is used to describethe contact opportunity between mobile target and stationaryrelay. This contact model is derived from an analysis of cor-related random walks, which reflects the opportunistic contactcaused by random movements with directional correlation.
Based on the random walk mobility model [27], the mobiletarget is assumed to take successive steps (each step has aconstant length denoted by L = V · T , where V denotes anaverage movement speed and T denotes a constant step period)and takes a random turn after each step. The random turningangle between two successive steps is assumed to follow thezero-centred Normal distribution, where the Standard Devia-tion of the Turning Angles (SDTA) is denoted by σ. When the
3As the delivery delay of FWD strategy is dominated by the waiting timeat the stationary relay, the transmission delay is considered to be negligiblein our research, and the case of zero delay represents direct delivery withoutwaiting.
4When the two budget boundaries are close enough ((τ2 − τ1) < 0.001for this paper), it is treated as no extra budget as mentioned in Section V.
0 500 1000 1500 2000 2500
Delivery Delay (seconds)
0
0.1
0.2
0.3
0.4
0.5
0.6
0.7
0.8
0.9
1
Sat
isfic
tion
Deg
ree
of In
divi
dual
Del
iver
y
100015002000
Second-Level BudgetBoundary (seconds)
First-LevelBoundary
Main Budget
Second-Level Boundary(Case: 2000s)
Extra Budget (Case: Second-Level Boundary 2000s)
Fig. 2. Delay budget function when the main budget is 500 seconds
directional correlation is strong (i.e. σ is small), the mobiletarget tends to keep moving in the current direction, whichresults in a directional movement.
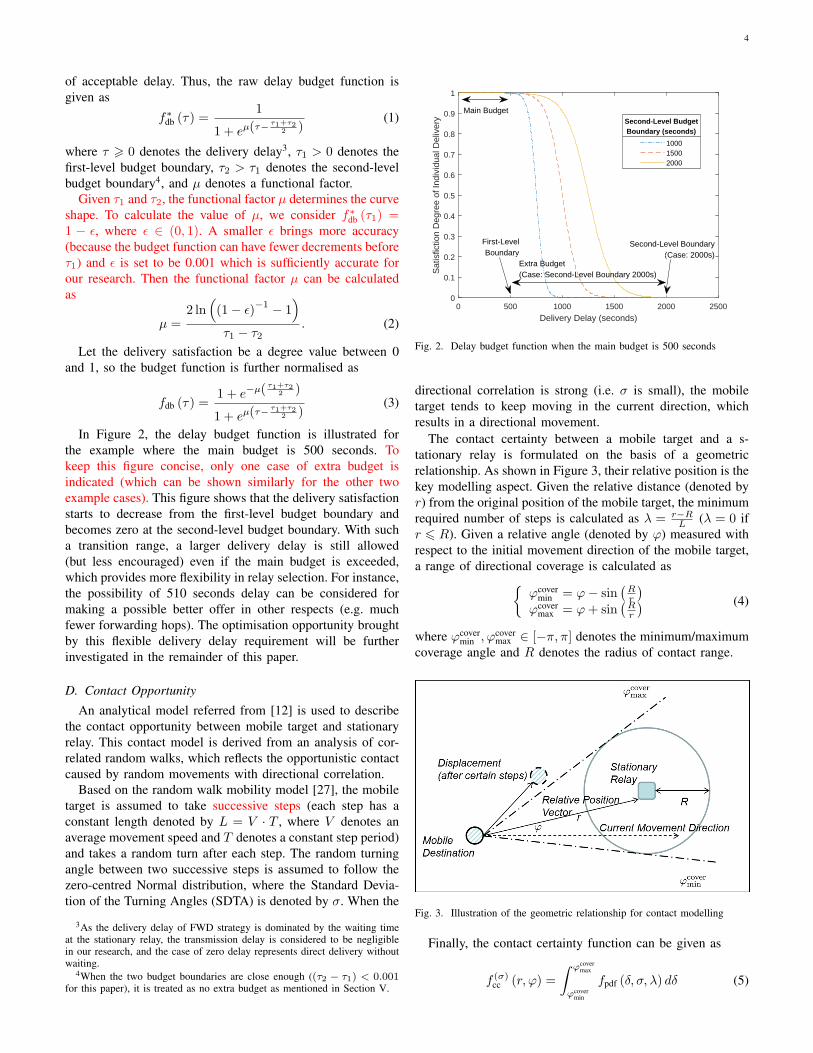
The contact certainty between a mobile target and a s-tationary relay is formulated on the basis of a geometricrelationship. As shown in Figure 3, their relative position is thekey modelling aspect. Given the relative distance (denoted byr) from the original position of the mobile target, the minimumrequired number of steps is calculated as λ = r−R
L (λ = 0 ifr 6 R). Given a relative angle (denoted by φ) measured withrespect to the initial movement direction of the mobile target,a range of directional coverage is calculated as
φcovermin = φ− sin
(Rr
)φcover
max = φ+ sin(Rr
) (4)
where φcovermin , φcover
max ∈ [−π, π] denotes the minimum/maximumcoverage angle and R denotes the radius of contact range.
Fig. 3. Illustration of the geometric relationship for contact modelling
Finally, the contact certainty function can be given as
f (σ)cc (r, φ) =
∫ φcovermax
φcovermin
fpdf (δ, σ, λ) dδ (5)
5
where fpdf denotes the parametric function obtained fromsimulations referring [12], which reflects the probability dis-tribution of displacement angle after λ steps given certain σ.
IV. RELAY STRATEGY FOR EFFICIENT GROUP DELIVERY
Given the underlying schemes that are already described inSection III, the research problem now focuses on the optimi-sation of the relay strategy. The relay strategy is consideredto be a decision (made by the gateway) that determines relayselection and target assignment for achieving a group delivery.
Different from individual delivery, relay nodes can be sharedby multiple target nodes, and therefore more optimisation ispossible. Based on knowledge of predictable node contact andtolerable delivery delay, how to identify feasible opportunitiesfor relay sharing is the key issue to be addressed. In thissection, the research problem is formulated and solutions areproposed.
A. Problem Formulation
Two optimisation objectives are considered to formulatethe research problem: 1) maximise the cost reduction ofgroup delivery; 2) maximise the requirement satisfaction ofgroup delivery. To reflect potential conflicts between these twoobjectives, this optimisation problem is required to be formallyformulated for further analysis.
Let xij denote a binary indicator of the target assignmentdecision, such that
xij =1 if relay ni is responsible for target nj
0 otherwise (6)
where ni ∈ N crly denotes a candidate relay node and nj ∈ Ntgt
denotes a target node. For the sake of simplicity, it is assumedthat N c
rly = Nsn and Ntgt = Nmn in the remainder of this paper.Then a relay strategy matrix (denoted by X) can be repre-
sented as
X =
x11 x12 x13 . . . x1J
x21 x22 x23 . . . x2J
......
.... . .
...xI1 xI2 xI3 . . . xIJ
= (xij)I×J (7)
where I denotes the number of candidate relay nodes, and Jdenotes the number of delivery target nodes.
For the strategy matrix X , each row represents the relaynode selection for a specific target node nj and each columnrepresents the target node assignment for a specific candidaterelay node ni. The whole set of selected relays can berepresented as
Nrly = ni|xij = 1 , nj ∈ Ntgt (8)
Note that multiple target nodes may have the same relaynode, which is equivalent to sharing a relay node for a sub-group of targets. The subgroup of targets which are assignedto ni can be represented as
Ntgt|ni= nj |xij = 1 , ni ∈ N c
rly (9)
Referring Section III-D, let ρij = (rij , φij) denote therelative position between stationary node ni and mobile node
nj . The contact delay between ni and nj (denoted by τij)can be estimated given the minimum required steps so thatτij = λ · T . For each nj ∈ Ntgt, its best selected relay isdenoted as n∗ = argmaxni∈Nrly (fcc (ρij) · fdb (τij)), subjectto nj ∈ Ntgt|ni
. Pairing nj with its best selected relay, ρ∗jdenotes their relative position and τ∗j denotes their estimatedcontact delay.
Under the relay strategy X , let C∗X denote the overall
reduction5 of forwarding hops and D∗X denote the overall
satisfaction6 of delivery requirement, i.e.
C∗X = H −
∑ni∈Nrly
fhd (ni) (10)
D∗X =
∑nj∈Ntgt
(fcc (ρ∗j) · fdb (τ∗j)) (11)
where H denotes the sum of least forwarding hops for grouprelay selection based on immediate delivery (i.e. no movementprediction).
Then two optimisation objectives are defined as
f obj1 (X) =
H −∑
ni∈Nrlyfhd (ni)
H= CX (12)
f obj2 (X) =
∑nj∈Ntgt
(fcc (ρ∗j) · fdb (τ∗j))
J= DX (13)
where J denotes the number of targets, CX is called thereduction degree of overall cost (the objective denoted by thefunction f obj
1 ), and DX is called the satisfaction degree ofgroup delivery (the objective denoted by the function f obj
2 ).The optimisation problem can finally be formulated as
maxX∈Ω
(f obj (X)
)(14)
subject to|Nrly| 6 J (15)∑
ni∈Nrly
fhd (ni) < H (16)
where Ω denotes the feasible strategies under the subjectcondition, and f obj (X) = [f obj
1 (X) , f obj2 (X)] denotes the
vector of two objectives. Equation (15) is the constraint thatthe number of selected relays (denoted by |Nrly|) should beno more than the number of targets. Equation (16) is theconstraint that the sum of forwarding hops should be less thanemploying the strategy of immediate delivery.
Referring [11], the formulated problem for efficient groupdelivery is NP-hard. To solve this problem, algorithms aredesigned and evaluated in the remainder of this paper. Withthe consideration of a two-level delay budget model in bi-objective combinatorial optimisation, our study is distinct fromthe existing research.
5Multicast tree construction is not considered in this paper but furtherresearch can be conducted from this basic case.
6It is assumed that each individual delivery independently contributes to thegroup delivery, so the overall satisfaction is a sum of individual satisfaction.

6
B. Group Relay Selection (Evolutionary Approach)
As a popular approach to solving multi-objective optimisa-tion problems, evolutionary algorithms can produce a numberof potential solutions for making further decisions. Whenthese solutions are Pareto optimal (i.e. an improvement inany objective requires a degradation in other objective(s)), aPareto front (i.e. the set of all Pareto optimal solutions) can beapproximated to analyse the trade-off between objectives [28].
In our research, the Multi-Objective Genetic Algorithm(MOGA) [29] is adopted because it is a standard evolutionaryalgorithm which is suitable for solving combinatorial opti-misation problems. Based on the MOGA implementation7,the group relay selection is considered from following threeaspects:
1) Population: The main issue to be addressed in theevolutionary approach design is to reduce the solution spacefor better and faster searching. Without such reduction, it isfound hard to obtain a suitable solution in limited time due tothe existence of too many possibilities.
Therefore, instead of using the strategy matrix X , a chro-mosome is proposed to be a binary selection vector (denotedby z) as
z =
z1z2...zI
= (zi)I (17)
Then a combination of selected relays can be indicated by
Nrly = ni|zi = 1, ni ∈ N crly (18)
Let Z denote a population which consists of a numberof chromosomes. An initial population (generation zero) isgenerated randomly8 as
Z(0) = z1, z2, . . . , zK (19)
where K denotes the number of chromosomes in the popula-tion.
2) Calculation: Although the searching space can be re-duced by using the selection vector z, a strategy matrix isstill required to evaluate the chromosome fitness (i.e. the twooptimisation objectives). For generating the strategy matrixfrom a selection vector, a default assignment matrix is definedas X = (xij)I×J such that,
xij =1 if fcc (ρij) · fdb (τij) > 00 otherwise. (20)
which means that each target node is assigned to all possiblerelay candidates.
Given a selection vector z, corresponding raw strategymatrix (denoted by X∗) based on the default assignment canbe generated as
X∗ =(x∗ij
)I×J
= z · X (21)
7A controlled, elitist genetic algorithm (a variant of NSGA-II [29]) providedby the MATLAB Global Optimization Toolbox. The algorithm follows defaultsettings of this standard implementation unless otherwise stated.
8For Section V-D, the solutions found by four greedy schemes are includedin the initial population to ensure the searching performance.
Note that the raw strategy matrix brings redundant assign-ments (i.e. a target node is assigned to more than one relays).Although this redundancy can improve the delivery reliability,our research focuses on the analysis of the relay sharingopportunity to reduce the delivery cost and therefore a basiccase is considered that one target is only assigned to one relay(but further research can be conducted from this basic case).Based on Algorithm 1, the raw strategy matrix is adjusted toeliminate the redundancy and then corresponding fitness valuescan be calculated.
Algorithm 1 Raw Strategy Matrix Adjustment and Evaluation1: input: ni ∈ N c
rly, nj ∈ Ntgt, X∗
2: (xij)I×J ← (0)I×J //initialise an I-by-J matrix of zeros3: for each nj do4: var ← 0 //initialise a variable for finding maximum5: for each ni do6: if x∗
ij = 1 and fcc (ρij) · fdb (τij) > var then7: record ni as the best relay for nj
8: var ← fcc (ρij) · fdb (τij) //record a bigger value9: end if
10: end for11: xi′j ← 1, where ni′ denotes the recorded best relay for
nj // the target is assigned to only one best relay12: end for13: X ← (xij)I×J // obtain the strategy matrix14: calculate CX based on Equation (12)15: calculate DX based on Equation (13)16: return X , CX , DX
3) Iteration: Given an initial population and the specifiedfitness calculation, the algorithm leads later generations to e-volve towards the optimal solutions iteratively. The productionof a new generation follows a general procedure as:
• select parents from the current population;• create children by using genetic operators (crossover and
mutation) on the selected parents;• calculate fitness using the Algorithm 1 and eliminate
inferior chromosomes to retain a fixed size of population.
The iterative mechanism finally terminates when the processreaches a specified generation/time limit or there is sufficientconvergence in the solutions. A set of Pareto optimal solutionsis provided when the algorithm terminates along with theirachieved fitness values.
C. Group Relay Selection (Greedy Approach)
Because evolutionary algorithms always require iterativecomputation which can be inefficient, the relay selectionbased on a greedy algorithm is proposed as an alternative.The principle of a greedy algorithm is choosing the bestsolution for each sub-problem until the whole problem can besolved [22]. It is a straightforward approach which is fast andsimple especially when solving complex problems. Despite itssimplicity, the performance of a greedy algorithm should becarefully evaluated because greedy searching towards a localoptimum may not lead to global optimisation.
7
In [11], a greedy algorithm is proposed for trajectory-basedgroup message delivery. With the relay selection performedby this algorithm, relay sharing opportunities can be exploitedfor group delivery so that the overall forwarding hops can bereduced for a given delay budget. Specifically, the problemof group relay selection is solved in two phases (as shown inAlgorithm 2):
• For the first phase, the serving list is identified as a list oftargets who can be served by a certain stationary relay.
• For the second phase, one stationary relay is selected eachround until the serving lists of the selected relays cancover all mobile targets.
Algorithm 2 Greedy Algorithm for Group Relay Selection
1: input: ni ∈ Nη|nj
rly , nj ∈ Ntgt, τ//Initialisation
2: Sed ← ∅ //initialise an empty set of covered targets3: (xij)I×J ← (0)I×J //initialise an I-by-J matrix of zeros4: for each pair of ni and nj do5: Sij ← nj //initialise its serving list6: end for
//The first phase: serving list identification7: for each pair of ni and nj do8: for each nj′ = nj do9: if tij 6 tij′ and tij′ 6 τ then
10: Sij = Sij ∪ nj′ //add this target node to the list11: end if12: end for13: end for
//The second phase: group relay selection14: while |Sed| < |Ntgt| do15: var ←∞ //initialise a variable for finding minimum16: Snew ← ∅ //an empty list to record newly covered targets17: for each pair of ni and nj do18: Sdiff ← ((Sij∪Sed)−Sed) //find newly covered targets19: if fmc(ni,Sdiff) < var then20: record ni as the relay to be selected this round21: var ← fmc(ni,Sdiff), Snew ← Sdiff22: end if23: end for24: Sed ← Sed ∪ Snew //update the set of covered targets25: xi′j ← 1 for nj ∈ Snew, where ni′ denotes the recorded
relay to be selected this round26: end while27: X ← (xij)I×J // obtain the strategy matrix28: return X
However, it is highlighted that the algorithm in [11] is notdirectly applicable to our research scenario in regard to thefollowing two aspects:
• Firstly, accurate trajectory knowledge, assumed by [11],is unavailable so the serving list cannot be explicitlyknown.
• Secondly, an exact budget boundary may not exist dueto the existence of the extra budget. This situation is notconsidered by [11].
In order to achieve greedy relay selection based on direc-tional movement with awareness of extra budget, we decouplethe problem solving into two complementary steps:
• The method of Delay Boundary based Relay Selection(DBRS) is proposed for the scenario where mobile nodesrandomly move with directional correlation. The DBRSis considered as the performance benchmark because ithas no awareness of the extra delay budget as with themethod proposed in [11].
• A new method of Satisfaction Degree based Relay Se-lection (SDRS) is proposed to consider the extra delaybudget in group relay selection. Based on the designof DBRS, the SDRS has additional awareness so betterperformance can be expected.
1) DBRS Design: The main issue to be addressed in theDBRS design is the identification of the serving list in thefirst phase of the problem solution. Without accurate trajectoryknowledge, it becomes hard to identify a list of targets whocan be served by a certain stationary relay.
To overcome the difficulty brought about by the randomnessof node movement, a threshold (denoted by η) of contactcertainty is proposed to qualify a set of candidate stationaryrelays as
N η|nj
rly = ni|fcc (ρij) > η , ni ∈ N crly (22)
With the qualified candidates, a serving list (denoted by Sij)can be found for each pair of Stationary Relay ni and MobileTarget nj (called the SRMT pair) according to the conditionthat
Sij = nj′ |τij 6 τij′ 6 τ nj ∈ Ntgt, nj′ ∈ Ntgt (23)
where τ denotes a budget boundary to identify a serving list.Then, the second phase of problem solution starts from an
empty set of covered targets. After each evaluation round, onestationary relay will be selected and the number of coveredtargets will increase (added from corresponding serving list).The procedure of relay selection ends when the selected relayscan cover all mobile targets.
Given the current set of covered targets, each SRMT paircan be evaluated by a cost metric (the hop distance averaged bythe number of newly covered targets). The calculation of thiscost metric is same as the cost calculation proposed by [11]as
fDBmc (ni,Sdiff) =
fhd(ni)
|Sdiff|(24)
where fDBmc denotes the metric calculation used in DBRS, fhd
denotes the hop distance function (hops from the gateway)defined in Section III-B, Sdiff denotes a list of newly coveredtargets (obtained from line 18 in Algorithm 2), and |Sdiff|denotes the size of this list.
Note that this DBRS scheme relies on the assumption thatall deliveries before a given delay τ contribute the same degreeof delivery satisfaction. However, in our research scenario,the satisfaction degree gradually decreases after the first-levelbudget boundary is exceeded. Without this awareness in thealgorithm, optimisation opportunities can be overlooked andtherefore the SDRS design is proposed.
8
2) SDRS Design: The main issue to be addressed in theSDRS design is the consideration of the extra delay budgetin the second phase of the problem solution. During the firstphase, it is similar to our DBRS design except that the budgetboundary is fixed to the second-level budget boundary (i.e.τ = τ2) to provide all possible candidate stationary relays.
After the first phase, all the contactable targets within thesecond-level budget boundary are included in the serving list.Thus the cost metric should reflect the difference in deliverysatisfaction. Instead of treating all the newly served targetsthe same, the hop distance is averaged by the sum of theirsatisfaction degree as
fSDmc (ni,Sdiff) =
fhd(ni)∑nj∈Sdiff
fdb (τij)(25)
where fSDmc denotes the metric calculation used in SDRS and
fdb denotes the delay budget function defined in Section III-C.Compared with DBRS, a more generalised form of cost
calculation is provided by SDRS. Because the delivery sat-isfaction is considered in relay selection, SDRS can makeimproved decisions and therefore better delivery performancecan be achieved. In the next section, DBRS and SDRS willbe compared and evaluated, together with the evolutionaryapproach proposed in Section IV-B.
V. SIMULATION AND EVALUATION
In Section IV, the research problem is formulated andsolutions are proposed to select relay node(s) for group de-livery. Now, we further evaluate the performance of proposedsolutions in simulation scenarios.
A. Scenario Description
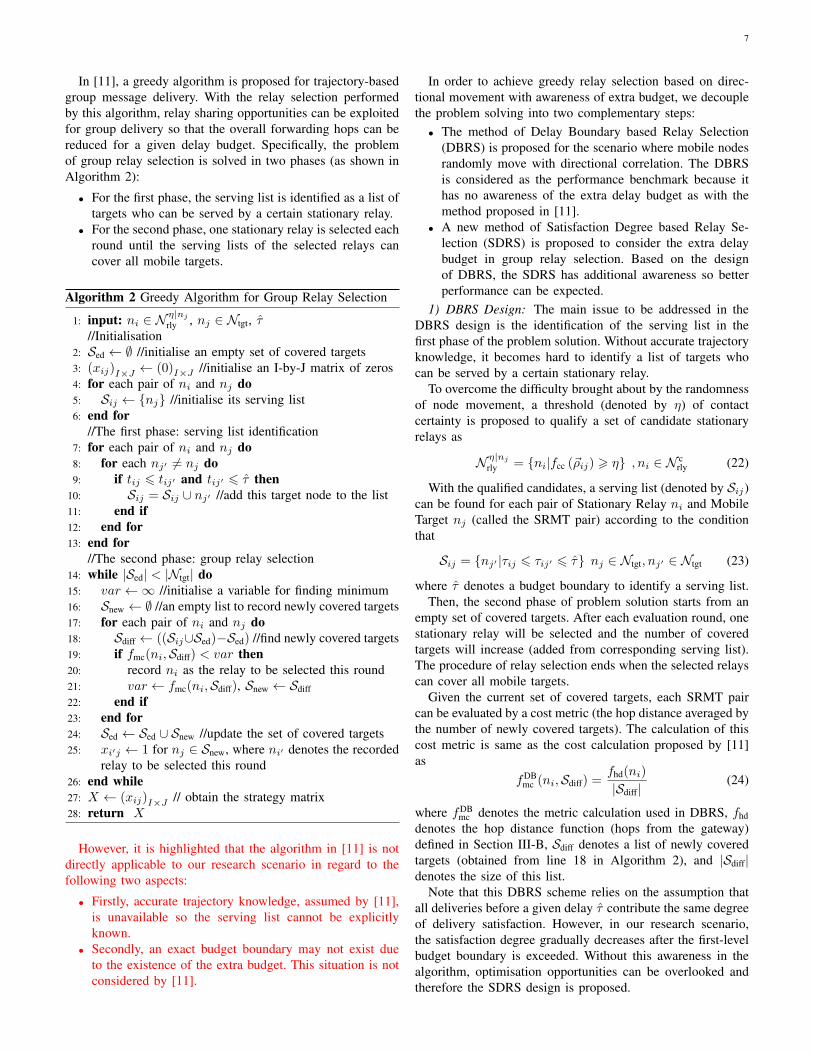
Figure 4 shows a scenario where a number of stationarynodes (denoted by squares) are deployed over a geographicalarea. Without loss of generality, a base scenario is defined forour simulations that stationary nodes are uniformly distributedover 10000*10000 metre area as a 21*21 grid. At certain timepoint during network operations (treated as the current time), apackage is planned to be delivered to a group of mobile nodes(denoted by circles) which are randomly located within thebase scenario area. For the sake of simplicity, it is assumedthat the package source (i.e. the gateway) is the stationary nodeat the bottom right corner. Although a group can include anynumber of targets, we focuses on a moderate size of the targetgroup (around 20 mobile nodes) because neither unicast andbroadcast is efficient in such range.
In our research, the radio coverage is considered to belimited (e.g. subject to device size and/or surrounding en-vironment such as forest or underwater) and therefore thepackage delivery mainly relies on multi-hop forwarding. It isassumed that the stationary nodes can form a grid topologyto perform forwarding. Considering the base scenario used forour simulations, the communication radius of wireless nodesis set to be 750m (which is a feasible range referring [30])so that each stationary node is able to contact its neighbournodes.
-5000 -4000 -3000 -2000 -1000 0 1000 2000 3000 4000 5000
Coordinate in X Axis
-5000
-4000
-3000
-2000
-1000
0
1000
2000
3000
4000
5000
Coo
rdin
ate
in Y
Axi
s
Fig. 4. Example simulation scenario (relay sharing without movementprediction)
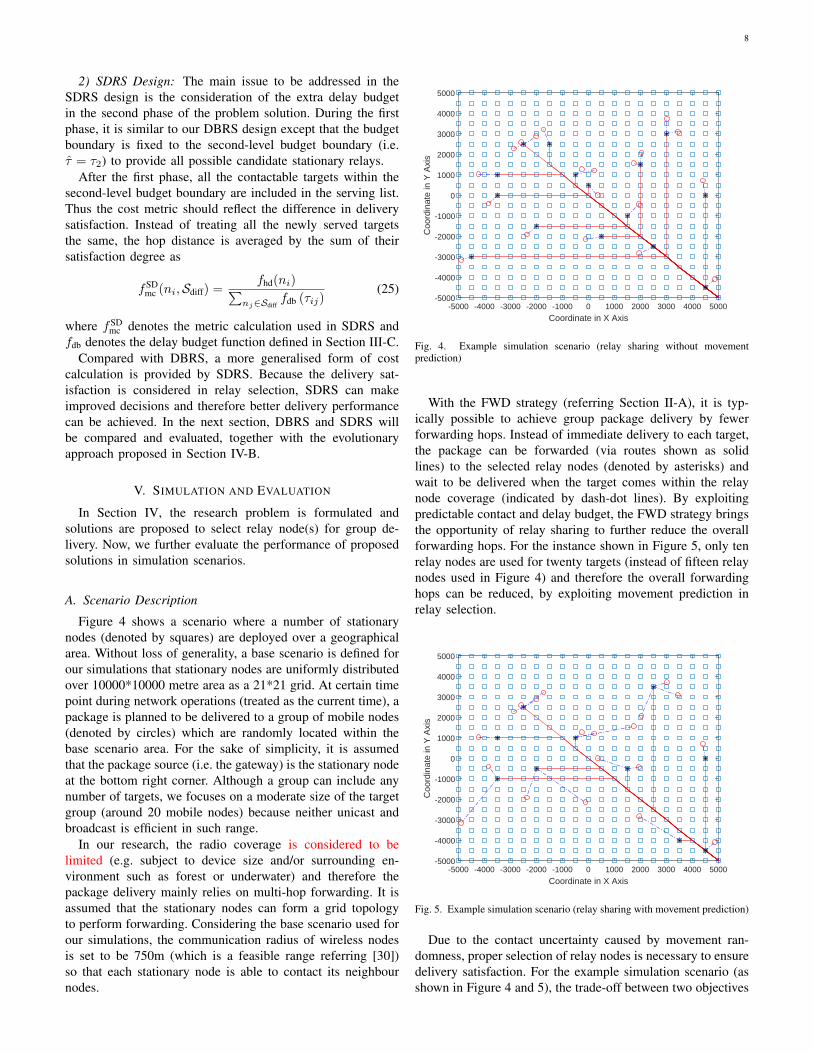
With the FWD strategy (referring Section II-A), it is typ-ically possible to achieve group package delivery by fewerforwarding hops. Instead of immediate delivery to each target,the package can be forwarded (via routes shown as solidlines) to the selected relay nodes (denoted by asterisks) andwait to be delivered when the target comes within the relaynode coverage (indicated by dash-dot lines). By exploitingpredictable contact and delay budget, the FWD strategy bringsthe opportunity of relay sharing to further reduce the overallforwarding hops. For the instance shown in Figure 5, only tenrelay nodes are used for twenty targets (instead of fifteen relaynodes used in Figure 4) and therefore the overall forwardinghops can be reduced, by exploiting movement prediction inrelay selection.
-5000 -4000 -3000 -2000 -1000 0 1000 2000 3000 4000 5000
Coordinate in X Axis
-5000
-4000
-3000
-2000
-1000
0
1000
2000
3000
4000
5000
Coo
rdin
ate
in Y
Axi
s
Fig. 5. Example simulation scenario (relay sharing with movement prediction)
Due to the contact uncertainty caused by movement ran-domness, proper selection of relay nodes is necessary to ensuredelivery satisfaction. For the example simulation scenario (asshown in Figure 4 and 5), the trade-off between two objectives
9
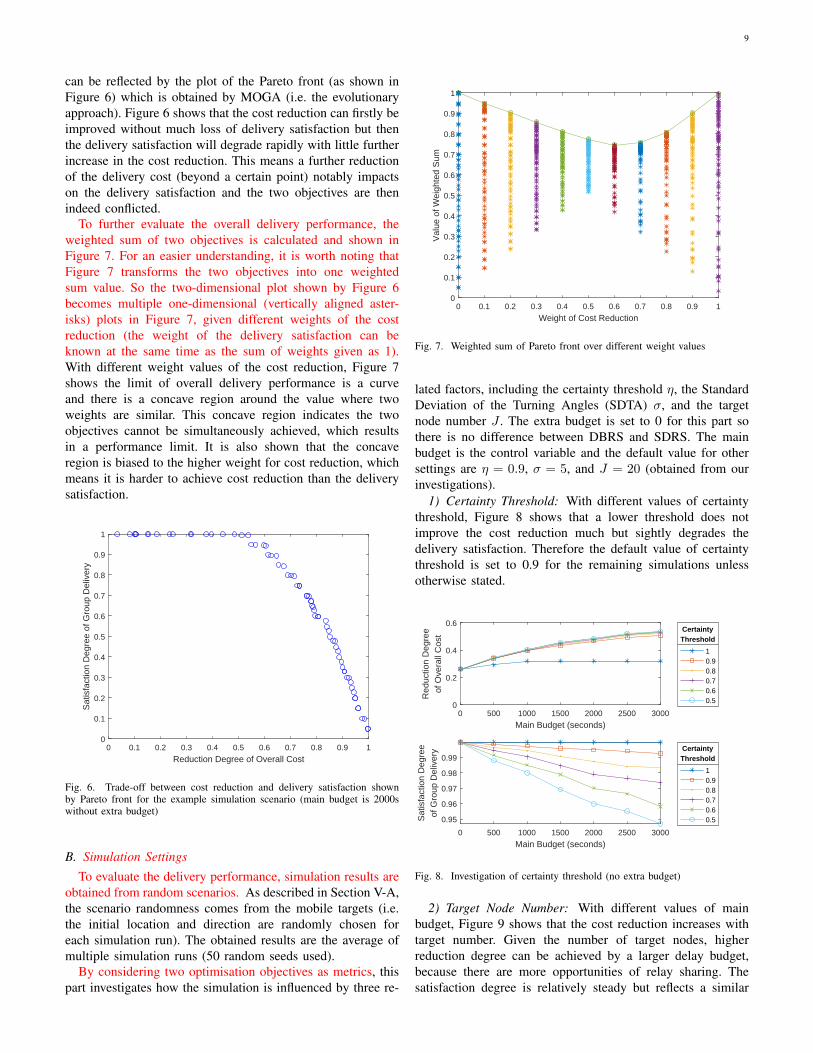
can be reflected by the plot of the Pareto front (as shown inFigure 6) which is obtained by MOGA (i.e. the evolutionaryapproach). Figure 6 shows that the cost reduction can firstly beimproved without much loss of delivery satisfaction but thenthe delivery satisfaction will degrade rapidly with little furtherincrease in the cost reduction. This means a further reductionof the delivery cost (beyond a certain point) notably impactson the delivery satisfaction and the two objectives are thenindeed conflicted.
To further evaluate the overall delivery performance, theweighted sum of two objectives is calculated and shown inFigure 7. For an easier understanding, it is worth noting thatFigure 7 transforms the two objectives into one weightedsum value. So the two-dimensional plot shown by Figure 6becomes multiple one-dimensional (vertically aligned aster-isks) plots in Figure 7, given different weights of the costreduction (the weight of the delivery satisfaction can beknown at the same time as the sum of weights given as 1).With different weight values of the cost reduction, Figure 7shows the limit of overall delivery performance is a curveand there is a concave region around the value where twoweights are similar. This concave region indicates the twoobjectives cannot be simultaneously achieved, which resultsin a performance limit. It is also shown that the concaveregion is biased to the higher weight for cost reduction, whichmeans it is harder to achieve cost reduction than the deliverysatisfaction.
0 0.1 0.2 0.3 0.4 0.5 0.6 0.7 0.8 0.9 1
Reduction Degree of Overall Cost
0
0.1
0.2
0.3
0.4
0.5
0.6
0.7
0.8
0.9
1
Sat
isfa
ctio
n D
egre
e of
Gro
up D
eliv
ery
Fig. 6. Trade-off between cost reduction and delivery satisfaction shownby Pareto front for the example simulation scenario (main budget is 2000swithout extra budget)
B. Simulation Settings
To evaluate the delivery performance, simulation results areobtained from random scenarios. As described in Section V-A,the scenario randomness comes from the mobile targets (i.e.the initial location and direction are randomly chosen foreach simulation run). The obtained results are the average ofmultiple simulation runs (50 random seeds used).
By considering two optimisation objectives as metrics, thispart investigates how the simulation is influenced by three re-
0 0.1 0.2 0.3 0.4 0.5 0.6 0.7 0.8 0.9 1
Weight of Cost Reduction
0
0.1
0.2
0.3
0.4
0.5
0.6
0.7
0.8
0.9
1
Val
ue o
f Wei
ghte
d S
um
Fig. 7. Weighted sum of Pareto front over different weight values
lated factors, including the certainty threshold η, the StandardDeviation of the Turning Angles (SDTA) σ, and the targetnode number J . The extra budget is set to 0 for this part sothere is no difference between DBRS and SDRS. The mainbudget is the control variable and the default value for othersettings are η = 0.9, σ = 5, and J = 20 (obtained from ourinvestigations).
1) Certainty Threshold: With different values of certaintythreshold, Figure 8 shows that a lower threshold does notimprove the cost reduction much but sightly degrades thedelivery satisfaction. Therefore the default value of certaintythreshold is set to 0.9 for the remaining simulations unlessotherwise stated.
0 500 1000 1500 2000 2500 3000
Main Budget (seconds)
0
0.2
0.4
0.6
Red
uctio
n D
egre
eof
Ove
rall
Cos
t
10.90.80.70.60.5
CertaintyThreshold
0 500 1000 1500 2000 2500 3000
Main Budget (seconds)
0.95
0.96
0.97
0.98
0.99
Sat
isfa
ctio
n D
egre
eof
Gro
up D
eliv
ery
10.90.80.70.60.5
CertaintyThreshold
Fig. 8. Investigation of certainty threshold (no extra budget)
2) Target Node Number: With different values of mainbudget, Figure 9 shows that the cost reduction increases withtarget number. Given the number of target nodes, higherreduction degree can be achieved by a larger delay budget,because there are more opportunities of relay sharing. Thesatisfaction degree is relatively steady but reflects a similar
10
trend, due to the trade-off between the cost reduction anddelivery satisfaction. As our research focus is on the groupdelivery, a relative large group is considered and the defaultvalue of target number is set to 20 for remaining simulationsunless otherwise stated.
5 10 15 20 25 30
Delivery Target Node Number
0
0.2
0.4
0.6
Red
uctio
n D
egre
eof
Ove
rall
Cos
t
050010001500200025003000
Main Budget(seconds)
5 10 15 20 25 30
Delivery Target Node Number
0.99
0.995
1
Sat
isfa
ctio
n D
egre
eof
Gro
up D
eliv
ery
050010001500200025003000
Main Budget(seconds)
Fig. 9. Investigation of target node number (no extra budget)
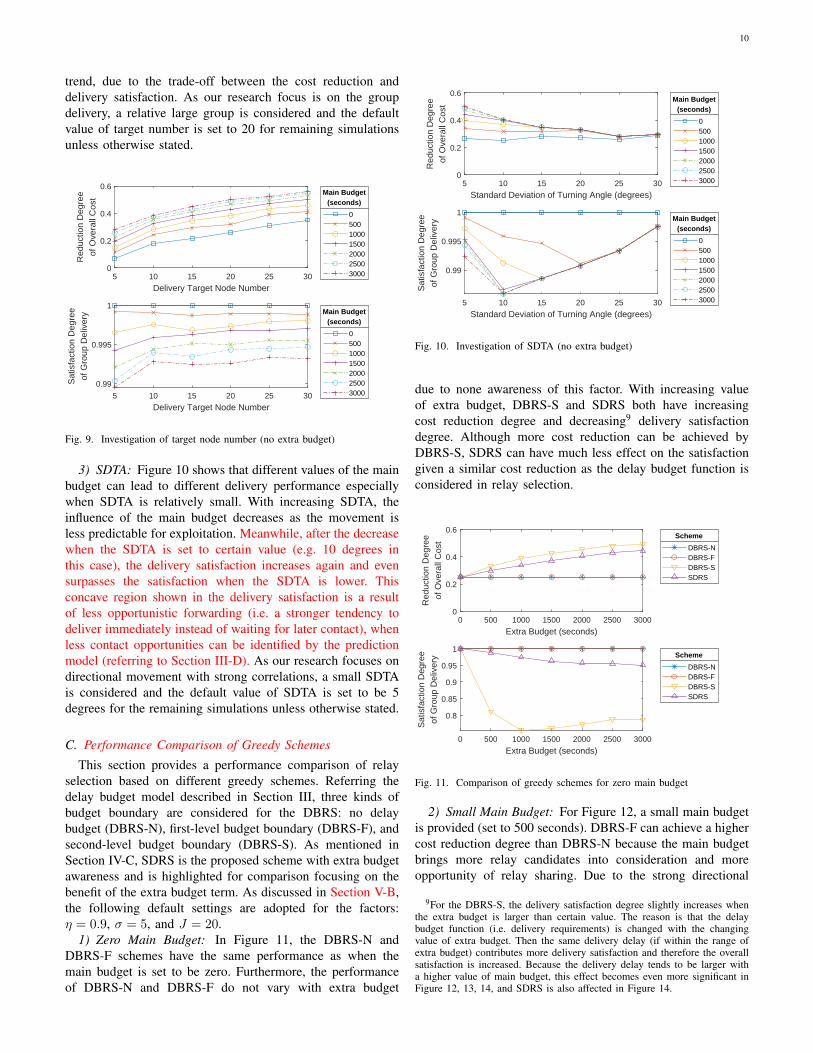
3) SDTA: Figure 10 shows that different values of the mainbudget can lead to different delivery performance especiallywhen SDTA is relatively small. With increasing SDTA, theinfluence of the main budget decreases as the movement isless predictable for exploitation. Meanwhile, after the decreasewhen the SDTA is set to certain value (e.g. 10 degrees inthis case), the delivery satisfaction increases again and evensurpasses the satisfaction when the SDTA is lower. Thisconcave region shown in the delivery satisfaction is a resultof less opportunistic forwarding (i.e. a stronger tendency todeliver immediately instead of waiting for later contact), whenless contact opportunities can be identified by the predictionmodel (referring to Section III-D). As our research focuses ondirectional movement with strong correlations, a small SDTAis considered and the default value of SDTA is set to be 5degrees for the remaining simulations unless otherwise stated.
C. Performance Comparison of Greedy Schemes
This section provides a performance comparison of relayselection based on different greedy schemes. Referring thedelay budget model described in Section III, three kinds ofbudget boundary are considered for the DBRS: no delaybudget (DBRS-N), first-level budget boundary (DBRS-F), andsecond-level budget boundary (DBRS-S). As mentioned inSection IV-C, SDRS is the proposed scheme with extra budgetawareness and is highlighted for comparison focusing on thebenefit of the extra budget term. As discussed in Section V-B,the following default settings are adopted for the factors:η = 0.9, σ = 5, and J = 20.
1) Zero Main Budget: In Figure 11, the DBRS-N andDBRS-F schemes have the same performance as when themain budget is set to be zero. Furthermore, the performanceof DBRS-N and DBRS-F do not vary with extra budget
5 10 15 20 25 30
Standard Deviation of Turning Angle (degrees)
0
0.2
0.4
0.6
Red
uctio
n D
egre
eof
Ove
rall
Cos
t
050010001500200025003000
Main Budget(seconds)
5 10 15 20 25 30
Standard Deviation of Turning Angle (degrees)
0.99
0.995
1
Sat
isfa
ctio
n D
egre
eof
Gro
up D
eliv
ery
050010001500200025003000
Main Budget(seconds)
Fig. 10. Investigation of SDTA (no extra budget)
due to none awareness of this factor. With increasing valueof extra budget, DBRS-S and SDRS both have increasingcost reduction degree and decreasing9 delivery satisfactiondegree. Although more cost reduction can be achieved byDBRS-S, SDRS can have much less effect on the satisfactiongiven a similar cost reduction as the delay budget function isconsidered in relay selection.
0 500 1000 1500 2000 2500 3000
Extra Budget (seconds)
0
0.2
0.4
0.6
Red
uctio
n D
egre
eof
Ove
rall
Cos
t
DBRS-NDBRS-FDBRS-SSDRS
Scheme
0 500 1000 1500 2000 2500 3000
Extra Budget (seconds)
0.8
0.85
0.9
0.95
1
Sat
isfa
ctio
n D
egre
eof
Gro
up D
eliv
ery
DBRS-NDBRS-FDBRS-SSDRS
Scheme
Fig. 11. Comparison of greedy schemes for zero main budget
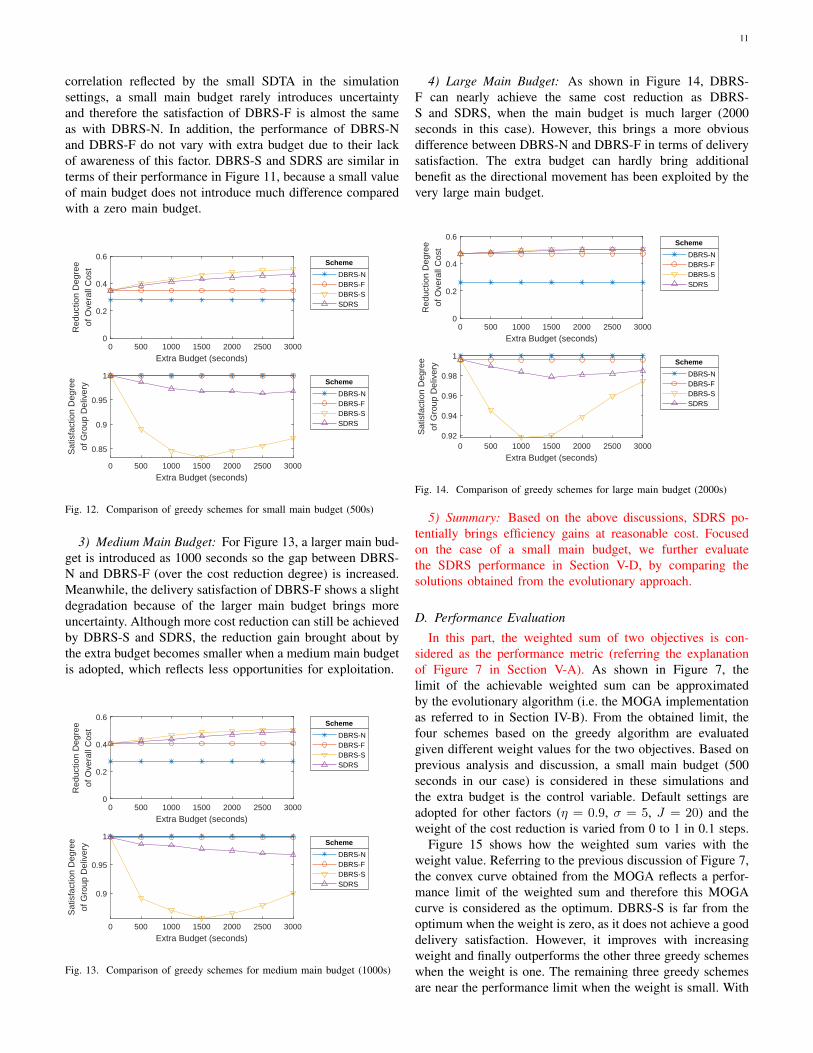
2) Small Main Budget: For Figure 12, a small main budgetis provided (set to 500 seconds). DBRS-F can achieve a highercost reduction degree than DBRS-N because the main budgetbrings more relay candidates into consideration and moreopportunity of relay sharing. Due to the strong directional
9For the DBRS-S, the delivery satisfaction degree slightly increases whenthe extra budget is larger than certain value. The reason is that the delaybudget function (i.e. delivery requirements) is changed with the changingvalue of extra budget. Then the same delivery delay (if within the range ofextra budget) contributes more delivery satisfaction and therefore the overallsatisfaction is increased. Because the delivery delay tends to be larger witha higher value of main budget, this effect becomes even more significant inFigure 12, 13, 14, and SDRS is also affected in Figure 14.
11
correlation reflected by the small SDTA in the simulationsettings, a small main budget rarely introduces uncertaintyand therefore the satisfaction of DBRS-F is almost the sameas with DBRS-N. In addition, the performance of DBRS-Nand DBRS-F do not vary with extra budget due to their lackof awareness of this factor. DBRS-S and SDRS are similar interms of their performance in Figure 11, because a small valueof main budget does not introduce much difference comparedwith a zero main budget.
0 500 1000 1500 2000 2500 3000
Extra Budget (seconds)
0
0.2
0.4
0.6
Red
uctio
n D
egre
eof
Ove
rall
Cos
t
DBRS-NDBRS-FDBRS-SSDRS
Scheme
0 500 1000 1500 2000 2500 3000
Extra Budget (seconds)
0.85
0.9
0.95
1
Sat
isfa
ctio
n D
egre
eof
Gro
up D
eliv
ery
DBRS-NDBRS-FDBRS-SSDRS
Scheme
Fig. 12. Comparison of greedy schemes for small main budget (500s)
3) Medium Main Budget: For Figure 13, a larger main bud-get is introduced as 1000 seconds so the gap between DBRS-N and DBRS-F (over the cost reduction degree) is increased.Meanwhile, the delivery satisfaction of DBRS-F shows a slightdegradation because of the larger main budget brings moreuncertainty. Although more cost reduction can still be achievedby DBRS-S and SDRS, the reduction gain brought about bythe extra budget becomes smaller when a medium main budgetis adopted, which reflects less opportunities for exploitation.
0 500 1000 1500 2000 2500 3000
Extra Budget (seconds)
0
0.2
0.4
0.6
Red
uctio
n D
egre
eof
Ove
rall
Cos
t
DBRS-NDBRS-FDBRS-SSDRS
Scheme
0 500 1000 1500 2000 2500 3000
Extra Budget (seconds)
0.9
0.95
1
Sat
isfa
ctio
n D
egre
eof
Gro
up D
eliv
ery
DBRS-NDBRS-FDBRS-SSDRS
Scheme
Fig. 13. Comparison of greedy schemes for medium main budget (1000s)
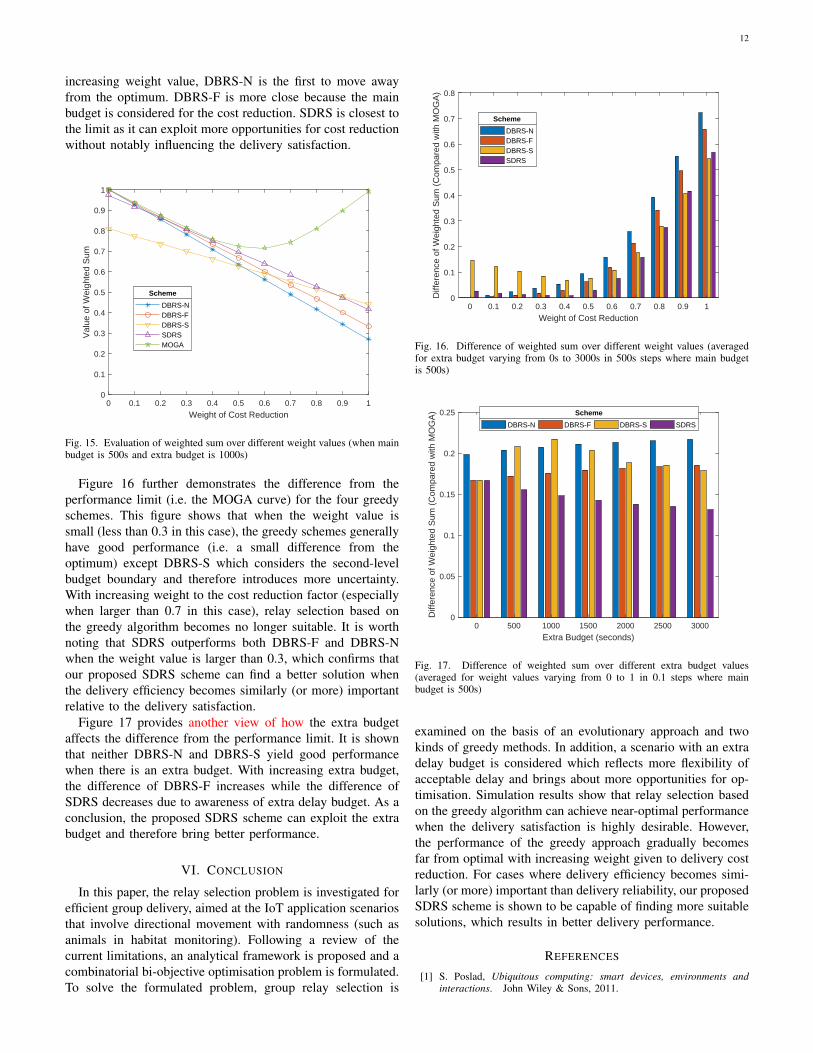
4) Large Main Budget: As shown in Figure 14, DBRS-F can nearly achieve the same cost reduction as DBRS-S and SDRS, when the main budget is much larger (2000seconds in this case). However, this brings a more obviousdifference between DBRS-N and DBRS-F in terms of deliverysatisfaction. The extra budget can hardly bring additionalbenefit as the directional movement has been exploited by thevery large main budget.
0 500 1000 1500 2000 2500 3000
Extra Budget (seconds)
0
0.2
0.4
0.6
Red
uctio
n D
egre
eof
Ove
rall
Cos
t
DBRS-NDBRS-FDBRS-SSDRS
Scheme
0 500 1000 1500 2000 2500 3000
Extra Budget (seconds)
0.92
0.94
0.96
0.98
1
Sat
isfa
ctio
n D
egre
eof
Gro
up D
eliv
ery
DBRS-NDBRS-FDBRS-SSDRS
Scheme
Fig. 14. Comparison of greedy schemes for large main budget (2000s)
5) Summary: Based on the above discussions, SDRS po-tentially brings efficiency gains at reasonable cost. Focusedon the case of a small main budget, we further evaluatethe SDRS performance in Section V-D, by comparing thesolutions obtained from the evolutionary approach.
D. Performance Evaluation
In this part, the weighted sum of two objectives is con-sidered as the performance metric (referring the explanationof Figure 7 in Section V-A). As shown in Figure 7, thelimit of the achievable weighted sum can be approximatedby the evolutionary algorithm (i.e. the MOGA implementationas referred to in Section IV-B). From the obtained limit, thefour schemes based on the greedy algorithm are evaluatedgiven different weight values for the two objectives. Based onprevious analysis and discussion, a small main budget (500seconds in our case) is considered in these simulations andthe extra budget is the control variable. Default settings areadopted for other factors (η = 0.9, σ = 5, J = 20) and theweight of the cost reduction is varied from 0 to 1 in 0.1 steps.
Figure 15 shows how the weighted sum varies with theweight value. Referring to the previous discussion of Figure 7,the convex curve obtained from the MOGA reflects a perfor-mance limit of the weighted sum and therefore this MOGAcurve is considered as the optimum. DBRS-S is far from theoptimum when the weight is zero, as it does not achieve a gooddelivery satisfaction. However, it improves with increasingweight and finally outperforms the other three greedy schemeswhen the weight is one. The remaining three greedy schemesare near the performance limit when the weight is small. With
12
increasing weight value, DBRS-N is the first to move awayfrom the optimum. DBRS-F is more close because the mainbudget is considered for the cost reduction. SDRS is closest tothe limit as it can exploit more opportunities for cost reductionwithout notably influencing the delivery satisfaction.
0 0.1 0.2 0.3 0.4 0.5 0.6 0.7 0.8 0.9 1
Weight of Cost Reduction
0
0.1
0.2
0.3
0.4
0.5
0.6
0.7
0.8
0.9
1
Val
ue o
f Wei
ghte
d S
um
DBRS-NDBRS-FDBRS-SSDRSMOGA
Scheme
Fig. 15. Evaluation of weighted sum over different weight values (when mainbudget is 500s and extra budget is 1000s)
Figure 16 further demonstrates the difference from theperformance limit (i.e. the MOGA curve) for the four greedyschemes. This figure shows that when the weight value issmall (less than 0.3 in this case), the greedy schemes generallyhave good performance (i.e. a small difference from theoptimum) except DBRS-S which considers the second-levelbudget boundary and therefore introduces more uncertainty.With increasing weight to the cost reduction factor (especiallywhen larger than 0.7 in this case), relay selection based onthe greedy algorithm becomes no longer suitable. It is worthnoting that SDRS outperforms both DBRS-F and DBRS-Nwhen the weight value is larger than 0.3, which confirms thatour proposed SDRS scheme can find a better solution whenthe delivery efficiency becomes similarly (or more) importantrelative to the delivery satisfaction.
Figure 17 provides another view of how the extra budgetaffects the difference from the performance limit. It is shownthat neither DBRS-N and DBRS-S yield good performancewhen there is an extra budget. With increasing extra budget,the difference of DBRS-F increases while the difference ofSDRS decreases due to awareness of extra delay budget. As aconclusion, the proposed SDRS scheme can exploit the extrabudget and therefore bring better performance.
VI. CONCLUSION
In this paper, the relay selection problem is investigated forefficient group delivery, aimed at the IoT application scenariosthat involve directional movement with randomness (such asanimals in habitat monitoring). Following a review of thecurrent limitations, an analytical framework is proposed and acombinatorial bi-objective optimisation problem is formulated.To solve the formulated problem, group relay selection is
0 0.1 0.2 0.3 0.4 0.5 0.6 0.7 0.8 0.9 1
Weight of Cost Reduction
0
0.1
0.2
0.3
0.4
0.5
0.6
0.7
0.8
Diff
eren
ce o
f Wei
ghte
d S
um (
Com
pare
d w
ith M
OG
A)
DBRS-NDBRS-FDBRS-SSDRS
Scheme
Fig. 16. Difference of weighted sum over different weight values (averagedfor extra budget varying from 0s to 3000s in 500s steps where main budgetis 500s)
0 500 1000 1500 2000 2500 3000
Extra Budget (seconds)
0
0.05
0.1
0.15
0.2
0.25
Diff
eren
ce o
f Wei
ghte
d S
um (
Com
pare
d w
ith M
OG
A)
DBRS-N DBRS-F DBRS-S SDRS
Scheme
Fig. 17. Difference of weighted sum over different extra budget values(averaged for weight values varying from 0 to 1 in 0.1 steps where mainbudget is 500s)
examined on the basis of an evolutionary approach and twokinds of greedy methods. In addition, a scenario with an extradelay budget is considered which reflects more flexibility ofacceptable delay and brings about more opportunities for op-timisation. Simulation results show that relay selection basedon the greedy algorithm can achieve near-optimal performancewhen the delivery satisfaction is highly desirable. However,the performance of the greedy approach gradually becomesfar from optimal with increasing weight given to delivery costreduction. For cases where delivery efficiency becomes simi-larly (or more) important than delivery reliability, our proposedSDRS scheme is shown to be capable of finding more suitablesolutions, which results in better delivery performance.
REFERENCES
[1] S. Poslad, Ubiquitous computing: smart devices, environments andinteractions. John Wiley & Sons, 2011.

13
[2] Y. Lin, Y. Lin, C. Hsiao, and Y. Wang, “Iottalk-rc: Sensors as universalremote control for aftermarket home appliances,” IEEE Internet ofThings Journal, vol. 4, no. 4, pp. 1104–1112, Aug 2017.
[3] G. Xu, E. C. . Ngai, and J. Liu, “Ubiquitous transmission of multimediasensor data in internet of things,” IEEE Internet of Things Journal, vol. 5,no. 1, pp. 403–414, Feb 2018.
[4] N. H. Motlagh, T. Taleb, and O. Arouk, “Low-altitude unmanned aerialvehicles-based internet of things services: Comprehensive survey andfuture perspectives,” IEEE Internet of Things Journal, vol. 3, no. 6, pp.899–922, Dec 2016.
[5] M. Stecca, C. Moiso, M. Fornasa, P. Baglietto, and M. Maresca, “Aplatform for smart object virtualization and composition,” IEEE Internetof Things Journal, vol. 2, no. 6, pp. 604–613, Dec 2015.
[6] X. Liu, T. Wei, and A. Liu, “Fast program codes dissemination for smartwireless software defined networks,” Scientific Programming, p. 21,2016.
[7] A. olakovi and M. Hadiali, “Internet of things (iot): A review of enablingtechnologies, challenges, and open research issues,” Computer Networks,vol. 144, pp. 17 – 39, 2018.
[8] Y. Cao and Z. Sun, “Routing in delay/disruption tolerant networks:A taxonomy, survey and challenges,” IEEE Communications SurveysTutorials, vol. 15, no. 2, pp. 654–677, Second 2013.
[9] S. Batabyal and P. Bhaumik, “Mobility models, traces and impact ofmobility on opportunistic routing algorithms: A survey,” IEEE Commu-nications Surveys Tutorials, vol. 17, no. 3, pp. 1679–1707, thirdquarter2015.
[10] M. T. Nuruzzaman and H. W. Ferng, “A low energy consumption routingprotocol for mobile sensor networks with a path-constrained mobilesink,” in 2016 IEEE International Conference on Communications(ICC), May 2016, pp. 1–6.
[11] G. L. Chiou, S. R. Yang, and W. T. Yen, “On trajectory-based i2v groupmessage delivery over vehicular ad-hoc networks,” IEEE Transactionson Vehicular Technology, vol. 65, no. 9, pp. 7389–7402, Sept 2016.
[12] Y. Yao, Y. Sun, C. Phillips, and Y. Cao, “Movement-aware relay selectionfor delay-tolerant information dissemination in wildlife tracking andmonitoring applications,” IEEE Internet of Things Journal, vol. 5, no. 4,pp. 3079–3090, Aug 2018.
[13] C.-M. Yu, C.-S. Lu, and S.-Y. Kuo, “Habitual behavior-based oppor-tunistic data forwarding in wildlife tracking,” in 2007 4th InternationalSymposium on Wireless Communication Systems. IEEE, 2007, pp. 807–808.
[14] M. Grossglauser and D. N. C. Tse, “Mobility increases the capacityof ad hoc wireless networks,” IEEE/ACM Transactions on Networking,vol. 10, no. 4, pp. 477–486, Aug 2002.
[15] A. Vahdat and D. Becker, “Epidemic routing for partially-connected adhoc networks,” 06 2000.
[16] T. Spyropoulos, K. Psounis, and C. S. Raghavendra, Efficient routing inintermittently connected mobile networks: the multiple-copy case. IEEEPress, 2008.
[17] Y. Wang, X. Li, and J. Wu, “Multicasting in delay tolerant network-s: Delegation forwarding,” in 2010 IEEE Global TelecommunicationsConference GLOBECOM 2010, Dec 2010, pp. 1–5.
[18] Y. Cao, K. Wei, G. Min, J. Weng, X. Yang, and Z. Sun, “A geographicmulticopy routing scheme for dtns with heterogeneous mobility,” IEEESystems Journal, vol. PP, no. 99, pp. 1–12, 2017.
[19] Y. Li, D. Jin, P. Hui, and S. Chen, “Contact-aware data replication inroadside unit aided vehicular delay tolerant networks,” IEEE Transac-tions on Mobile Computing, vol. 15, no. 2, pp. 306–321, Feb 2016.
[20] R. Kim, H. Lim, and B. Krishnamachari, “Prefetching-based data dis-semination in vehicular cloud systems,” IEEE Transactions on VehicularTechnology, vol. 65, no. 1, pp. 292–306, Jan 2016.
[21] C. H. Papadimitriou and K. Steiglitz, Combinatorial Optimization:Algorithms and Complexity. Upper Saddle River, NJ, USA: Prentice-Hall, Inc., 1982.
[22] T. H. Cormen, C. E. Leiserson, R. L. Rivest, and C. Stein, Introductionto algorithms. MIT press, 2009.
[23] T. Wang, Y. Cao, Y. Zhou, and P. Li, “A survey on geographic routingprotocols in delay/disruption tolerant networks,” International Journalof Distributed Sensor Networks, vol. 12, no. 2, p. 3174670, 2016.
[24] A. Cerpa, J. Elson, D. Estrin, L. Girod, M. Hamilton, and J. Zhao,“Habitat monitoring: Application driver for wireless communication-s technology,” ACM SIGCOMM Computer Communication Review,vol. 31, no. 2 supplement, pp. 20–41, 2001.
[25] B. N. Clark, C. J. Colbourn, and D. S. Johnson, “Unit disk graphs,”Discrete Mathematics, vol. 86, no. 1, pp. 165 – 177, 1990.
[26] N. Gershenfeld, The nature of mathematical modeling. CambridgeUniversity Press, 1999.
[27] E. A. Codling, M. J. Plank, and S. Benhamou, “Random walk modelsin biology,” Journal of the Royal Society Interface, vol. 5, no. 25, pp.813–834, 2008.
[28] Y. Censor, “Pareto optimality in multiobjective problems,” AppliedMathematics and Optimization, vol. 4, no. 1, pp. 41–59, 1977.
[29] K. Deb and D. Kalyanmoy, Multi-Objective Optimization Using Evolu-tionary Algorithms. New York, NY, USA: John Wiley & Sons, Inc.,2001.
[30] K. Sohraby, D. Minoli, and T. Znati, Wireless sensor networks: technol-ogy, protocols, and applications. John Wiley & Sons, 2007.


![Human Action Recognition Using Time Delay Input Radial ... · [21] D. Wu and L. Shao, "Silhouette analysis-based action recognition via exploiting human poses," IEEE Transactions](https://img.pdfslide.us/doc/110x75/5f08d2eb7e708231d423e598/human-action-recognition-using-time-delay-input-radial-21-d-wu-and-l-shao.jpg)


![Exploiting Variable Impedance for Energy Efficient ...adjust physical impedance at transition phases to improve arXiv:2002.12075v1 [cs.RO] 27 Feb 2020 2 subsequent movements. 3) Relative](https://img.pdfslide.us/doc/110x75/5fee280dfd798b5b2e547944/exploiting-variable-impedance-for-energy-eficient-adjust-physical-impedance.jpg)