Embed Size (px)
Citation preview

MARINE ECOLOGY PROGRESS SERIESMar Ecol Prog Ser
Vol. 400: 207–219, 2010doi: 10.3354/meps08387
Published February 11
INTRODUCTION
Estuaries are particular ecosystems, where the abi-otic environment is characterized by rapid and largespatio-temporal fluctuations in physico-chemical char-acteristics (e.g. oxygen, temperature, salinity) in bothwater column and bed sediment dynamics (McLusky &Elliott 2004). This high environmental variability leadsto a high spatio-temporal heterogeneity of the biologi-cal communities (McLusky & Elliott 2004, David et al.2005), with a low diversity of all components, yet oftenwith high abundances of adapted species (Mc Lusky &Elliott 2004). Thus, this strong biological variability is
related to the ability of the estuarine biota to cope withnatural stress, a key element in estuarine resilience(Elliott & Quintino 2007).
In addition, estuaries are generally exposed tohigh degrees of anthropogenic pressures that canmodify their ecological status. Recent works under-line the similarity between the features of organismsand assemblages in estuaries, subject to naturalstress, and, those in anthropogenically stressedareas and, hence, the difficulty of distinguishing nat-ural from human-induced stress in estuaries (‘Estu-arine quality paradox’; Elliott & Quintino 2007, Dau-vin & Ruellet 2009).
© Inter-Research 2010 · www.int-res.com*Email: [email protected]
Exploitation of trophic resources by fish understressful estuarine conditions
Stéphanie Pasquaud1,*, Valérie David2, Jérémy Lobry1, Michel Girardin1, Benoît Sautour3, Pierre Elie1
1Cemagref, Estuarine Ecosystems and Diadromous Fish Research Unit, 50 avenue de Verdun 33612 Cestas Cedex, France2UMR LIENSs 6250 CNRS/Université de La Rochelle, Institut du Littoral et de l’Environnement, 2 rue Olympes de Gouges,
17000 La Rochelle, France3UMR 5805 EPOC–OASU, Université de Bordeaux 1, 2 Rue du Professeur Jolyet, 33120 Arcachon, France
ABSTRACT: Despite their high complexity and variability, estuaries are very productive and play animportant role in fish feeding. We investigated how fish optimize their use of the available trophicresources by studying trophic preference variability and feeding strategies of some pelagic and dem-ersal fish in the Gironde estuary (southwest France). Fish and their prey were collected approxi-mately every 2 mo from July 2003 to June 2004 in the upstream area of the saline estuary. Stomachcontents were analysed to assess the variability of fish feeding in relation to their size and the time ofyear. Intra- and interspecific food niche overlap was evaluated using Schoener’s index, and a cross-calculation method was used to highlight general fish trends in predation strategy. Stomach contentresults showed interspecific and intraspecific variability in feeding by fish, which can be explained bytheir different or ontogenetically changing ecomorphology. Their diets are composed mainly of zoo-plankton and hyperbenthic crustaceans, with temporal variations in the consumed taxa. Optimizationof available trophic resource use, a key element in estuarine resilience, is thus possible due to thetemporal adaptation of this structural trophic web. However, in spite of their temporal adaptationcapacity, most fish species exhibited a specialist feeding strategy. This result was not expected. Sincezooplankton and hyperbenthic crustaceans exhibit a low specific richness in estuaries, especially inthe high turbidity of the Gironde estuary, the loss of one of these species could affect the fish trophicweb structure and hence the resilience of the system.
KEY WORDS: Pelagic and demersal fish · Stomach contents · Diet composition · Feeding strategy ·Prey characteristics · Estuarine ecosystem · Gironde estuary
Resale or republication not permitted without written consent of the publisher

Mar Ecol Prog Ser 400: 207–219, 2010
Because of these characteristics, monitoring and as-sessing the biodiversity and ecological status of marineecosystems requires a substantial knowledge and acomprehensive understanding of properties across theentire biological system, in particular its structure (e.g.species composition) and functional properties (e.g.ecosystem processes; Hooper et al. 2005, de Jonge etal. 2006). Studying interactions between the biologicalcompartments of an ecosystem, especially trophic rela-tionships, provides a good picture of the biologicalcommunity structure and is an essential step to under-standing how an aquatic system functions (e.g. Elliott& Hemingway 2002, Livingston 2002, Pasquaud et al.2007, 2008).
Topological approaches in trophic models are usedto better understand estuarine ecological structure andfunctioning (Baird & Ulanowicz 1993, Wolff et al. 2000,Lin et al. 2007, Lobry et al. 2008). Most authors (in par-ticular Lobry et al. 2008) suggest that estuarine com-munities have to optimize use of available trophic re-sources to successfully cope with stressful conditionsThis suggests that: (1) a temporal adaptation of thetrophic web would be observed and (2) most estuarinespecies would be opportunists. The present paper con-stitutes a preliminary investigation to test both of theseassumptions by analyzing the food preferences andfeeding strategies of the main fish species of theGironde estuary.
The first objective was thus to describe the trophicrelationship variability according to fish size and timeof year of the main Gironde estuarine demersal andpelagic fish species using stomach content analysis,which appears to be the most reliable method to deter-mine fish feeding (Pasquaud et al. 2007). The secondobjective was to analyze the dynamics of the fish feed-ing preferences using characteristics of their diet andof their prey population (abundance in the environ-ment, mean weight).
MATERIALS AND METHODS
Study area. The Gironde estuary (45° 20’ N, 0° 45’ W;Fig. 1) is located in SW France and opens onto the Bayof Biscay. Its surface area is approximately 625 km2 athigh tide. It is 76 km long between the ocean and theBec d’Ambès, where the Dordogne and GaronneRivers meet and which generally constitutes the up-stream salinity limit. The watershed covers 81 000 km2,and the mean annual rate of freshwater discharge isaround 760 m3 s–1. These characteristics make it thelargest estuary in western Europe (Salomon 2002,Lobry et al. 2003). The tidal range is 4.5 m at the mouthof the estuary and >5 m at Bordeaux. The Gironde isone of the most turbid estuaries in Europe (Sautour &
Castel 1995). River systems carry annually between 1.5and 3 × 10⁶ t of suspended particulate matter (SPM;David et al. 2005) to the estuary, with a fairly perma-nent maximum turbidity zone (SPM about 1 g l–1 at thesurface and 10 g l–1 near the bed; Sottolichio 1999). Asa consequence, primary production in the Gironde isreduced (10 g C m–2 yr–1), and the food-web base con-sists, for the most part, of a varied nutritional poolcontaining a high proportion of detritus (Irigoien &Castel 1995).
The climate of the region is temperate under oceanicinfluence. Typically, water temperature variability ismoderate (between 2°C in January and 26°C in Au-gust) and monthly rainfall fluctuates between 50 mm insummer and 100 mm in winter (Klein Tank et al. 2002).During the sampling period (from July 2003 to June2004), the water temperature ranged from 9.78°C inFebruary to 25.42°C in July in the study area. The riverflow remained very low from July to December 2003,in spite of a few strong freshwater inputs in December.The first half of 2004 was relatively dry, characterizedonly by episodes of flooding in January and April toMay (authors’ unpubl. data). Because of these hydro-logical conditions, a very strong marine intrusion wasobserved during summer 2003, with maximum salinityvalues in September (average salinity 11.43 in the sam-pling area), and low salinities were recorded in Febru-ary (0.08), April (0.41) and June (3.48).
Fish sampling. To analyze temporal feeding variabil-ity, fish were collected approximately every 2 mo from
208
Bordeaux
0°45’W 0°30’
45°20’ N
45°00’
Bay o
f B
iscay
Lower estuary
N
Middle estuary
Upper estuary
Dordogne
Garonne
Bec d’Ambès
0 10
20 m
10 m
10 m
20 km
Fig. 1. Location of sampling stations in the Gironde estuary. Stars: fish; circles: shrimps; lines: the 4 transects

Pasquaud et al.: Are fishes opportunistic in estuaries?
July 2003 to June 2004 in the upper and middle areaof the Gironde estuarine haline part (Table 1, Fig. 1).Specimens were caught once per sampled month at5 stations (Fig. 1) using an otter trawl (4 m opening anda cod-end with a mesh size of 8 mm). Trawling wasrestricted to daylight at high tide in order to standard-ize the samplings, and only when the tidal coefficientwas <75 (trawling at a coefficient >80 in this system isnot reliable). Haul duration was limited to 15 min tooptimize the analysis of the stomach contents by mini-mizing regurgitation and feeding under abnormalconditions in the trawl (Pasquaud et al. 2007). All thesampled fish were identified, counted, measured (totallength) and weighed. Fish <200 mm long were imme-diately placed on dry ice in order to stop the digestionprocesses. The digestive tract of the largest specimenswas conserved on dry ice. The samples were stored at–18°C in the laboratory. Using this protocol, all theanalyses could be carried out on fresh material, afterdefrosting, thus facilitating handling and also the iden-tification of the fish species and their prey.
Stomach content analyses. The fish species analyzedwere selected because they were considered typical ofthe estuarine ichthyofauna both in terms of occurrenceand of functional guilds, i.e. ecological and feedingcategories (see Lobry et al. 2003 for details; Table 1).Prey sampled in the system for which data were avail-able (cf. ‘prey data’ paragraph) were zooplankton andhyperbenthos. We thus focused on their fish predatorspecies.
The stomach contents of 538 individuals from the 8fish species caught in the sampling area were analyzed(Table 1). A minimum of 5 specimens per taxa and persampled month, with food items in their stomachs, wereselected for analysis (minimum required to obtain a dietpicture). Two size ranges were distinguished for Po-matoschistus minutus (small <40 mm; large ≥40 mm)and Argyrosomus regius (2 age classes) to test onto-genic changes in feeding. All the items in the stomachswere examined under a binocular microscope, identi-fied to the highest possible taxonomic level, countedand weighed (dry weight, to nearest 10–4 g). Dietaryanalysis is traditionally assessed by occurrence (i.e. thepercentage of non-empty stomachs where a certainprey item occurred), numerical and volumetric/gravi-metric methods (see Hynes 1950, Hyslop 1980 for moredetails). Each of these measures provides a differentinsight into predator feeding habits (Cortès 1997). Thenumerical percentage of the prey (%N) is well adaptedto our objective as it describes feeding behavior (Mac-donald & Green 1983). This was calculated for eachitem consumed by a fish species per month.
The mean weight (⎯W in g) of each prey was also esti-mated from these stomach content analyses (averageof the dry weights of each item consumed by a pre-dator species per month).
Prey data. Sampling data for shrimps and zooplank-ton from the same estuarine area and the same monthsas the fish sampling data were used to characterizeprey populations in the environment (Table 1).
Shrimps were collected from 4 tran-sects, established since 1991 for moni-toring the smaller components of theestuarine fauna around the Blayais nuc-lear power plant on a monthly basis (Lo-bry et al. 2006). Each transect consists of3 sites, 1 close to each bank and 1 in themain channel of the estuary (Fig. 1). Ateach site, sampling was carried out si-multaneously near the surface and nearthe bottom, with the water surface sam-pled using 2 pushnets located one oneach side of the boat (section 4 × 1 m,stretched mesh of 1 mm in the cod-end)and the bottom sampled using a dragnetwith a 2.0 × 1.2 m frame, kept at 0.2 mabove the bed by runners. The netmeshes were identical to those used forsurface sampling. Sampling was carriedout in daytime, between the halfwaystage of the flood tide and high tideslack. Each tow lasted about 7 min. Allthe samples collected were preserved in10% formaldehyde, before being identi-fied and counted at the laboratory.
209
Organism EG TG Jul Sep Nov Feb Apr Jun 2003 2003 2003 2004 2004 2004
FishesN 5 5 5 5 5 5Sprattus sprattus MS P 5Engraulis encrasicolus MS P 27 9 6Pomatoschistus microps ER IS 20 10 11 15Pomatoschistus minutus (S) ER IS 15 21 15Pomatoschistus minutus (L) ER IS 30 25 20 6 20Dicentrarchus labrax MJ IF 6 5 9 26 11Dicentrarchus punctatus MJ IF 5Argyrosomus regius (S) MS IF 68 15Argyrosomus regius (L) MS IF 29 36 20 40Merlangius merlangus MS IF 5 8
ShrimpN 12 12 12 12 12 12
ZooplanktonN 23 22 16 12 16 16
Table 1. Functional guilds (EG: ecological guild; TG: trophic guild) and numberof fish used for stomach content analyses for each sampled month. N: numberof sampled stations for fish, shrimp and zooplankton; S: small; L: large; ER: trulyestuarine resident fish; MS: marine seasonal migrant fish; MJ: marine juvenilemigrant fish; P: planktivore; IS: invertebrate feeder; IF: invertebrate and fish
feeder

Mar Ecol Prog Ser 400: 207–219, 2010
Zooplankton was collected along the estuary every 3units of salinity using a standard 200 µm WP-2 net forzooplankton and a 500 µm bongo net, which is betteradapted to mysid and amphipod sampling. Verticalhauls were carried out at each station for each net. Thecatch was preserved in 5% seawater/formalin beforebeing identified and counted at the laboratory.
Abundance of the different prey categories was cal-culated for each month, and expressed as the numberof individuals per cubic meter of filtered water at thesampling site.
Data analyses. In order to determine whether theconsumption of the different prey varied with time orpredator size, permutation tests based on inertia analy-sis (Chessel et al. 2004), with a 0.05 significance level,were performed on matrices of the diet compositionper each fish predator using the relative abundance(%N) of the prey items.
Intra- and interspecific food niche overlap was eval-uated using Schoener’s index (SI), defined as
(1)
where Nxi is the relative abundance of prey category iin the stomach content of species x and Nyi the samerelative abundance in the species y (Hurlbert 1978).According to Wallace (1981) and Wallace & Ramsay(1983), overlap values >0.6 should be considered bio-logically significant.
The general trends in predation strategy for each spe-cies (or size group) and each sampled month were stud-ied using the cross-calculation method described byAzémar et al. (2007). This method allows us to test if apredator diet can be determined by prey characteristics(e.g. abundance or mean weight/size) in the environ-ment. It consists of: (1) ranking prey i of each fish of apredator group (species or size class) as a function ofrelative abundance (N) in the stomach contents(Ni ranks; e.g. for Engraulis encrasicolus, Stomach Con-tent 1: NAcartia = Rank 1; Stomach Content 9: NM. slabberi =Rank 1, Ncirripedes = Rank 2, NAcartia = Rank 3), and (2)ranking these same prey according to their abundance(Ab ranks) and their mean weight (
–––W ranks) in the envi-
ronment (e.g. in July, AbAcartia = Rank 1, AbM. slabberi =Rank 2, Abcirripedes = Rank 3). As only prey that appearedin the stomach contents are considered, predator feedingstrategy is assessed within the context of its trophicniche. Moreover, non-sampled prey in the present study(e.g. nauplius crustacean stage) were excluded from theanalysis. Next, (3) the frequencies (i.e. number of occur-rences observed from all the stomach contents) of eachcombination Ni ranks × Abi ranks and Ni ranks × Wi
ranks were calculated for each prey of a predator group.Finally, (4) the shape of the distribution was tested usinga Spearman rank test at p < 0.05. If these frequencies
increased or decreased as a function of the prey charac-teristic ranking (Ab or
–––W ), the predation was considered
to be selective according to prey abundance (Ab) ormean weight (
–––W ); otherwise, the predation was unselec-
tive with regard to the prey characteristic considered (Abor
–––W ).Three different types of predation strategy were
determined: (1) generalist, when the Spearman corre-lation coefficient was not significant for either abun-dances or mean weights; (2) opportunistic, when fre-quencies increased significantly with abundances; and(3) specialist, when the highest frequencies were con-centrated around a narrow mean weight (Fig. 2).
RESULTS
Interspecific feeding variability
Fish species showed different feeding ecology andstrategy (Fig. 2, Table 2 & Appendix 1). Small marinepelagic fish Sprattus sprattus and Engraulis encrasicolusbased their diet on mesozooplankton, feeding mainly onthe nauplius stage of crustaceans and on copepods of thegenus Acartia. However, their trophic niches did notoverlap (SI < 0.6) and their predation strategy was differ-ent: E. encrasicolus was an opportunist, i.e. among itsfood spectrum, this species mainly consumed the mostabundant prey in the system (e.g. Acartia in September),whereas S. sprattus was a specialist, focusing on prey ofa specific weight (size) range (e.g. selection of cirripedlarvae in September, not the most abundant prey).
Small estuarine resident species Pomatoschistusminutus and P. microps also consumed a high quantityof mesozooplankton, but their diet differed from that ofSprattus sprattus and Engraulis encrasicolus due to ahigh consumption of hyperbenthos, essentially themysid Mesopodopsis slabberi and the amphipodsGammarus spp. (no overlap; SI < 0.6). The 2 species ofPomatoschistus were seldom present together in thearea studied, and, if they were, they tended to show atrophic niche overlap (February, SI > 0.8). Both werecharacterized by specialist feeding, essentially on thelargest zooplankton (the copepod Eurytemora affinis)and the smallest hyperbenthos (mysids M. slabberi andNeomysis integer).
Finally, the feeding of marine demersal fish (e.g. Di-centrarchus labrax, D. punctatus, Argyrosomus regiusand Merlangius merlangus) was mainly characterizedby hyperbenthic prey such as the mysids Mesopodop-sis slabberi and Neomysis integer, the amphipodsGammarus spp. and the shrimps Palaemon spp.
The 2 species of Dicentrarchus did not show trophicniche overlap, and presented different predationstrategies: D. labrax was a specialist and D. punctatus
SIxy xi yii
n
N N= − −⎛⎝⎜
⎞⎠⎟=
∑1 0 51
.
210

Pasquaud et al.: Are fishes opportunistic in estuaries?
was an opportunist. In contrast to Dicentrarchus spp.,the trophic niches of Argyrosomus regius and Mer-langius merlangus sometimes overlapped, either witheach other or with Pomatoschistus minutus. M. merlan-gus is a specialist predator, whereas A. regius was ableto feed on either a wide range of prey (generalist) or anarrow range of prey (specialist).
Temporal feeding variability
Except for Pomatoschistus microps, all fish speciesshowed a significant temporal feeding variability(p-values of the permutation tests < 0.05):
• Engraulis encrasicolus consumed a large quantityof mollusk eggs (40%) and nauplius larvae (44%) inJuly, whereas it mostly ate the copepods Acartia spp.(94%) in September and Eurytemora affinis (88%)in November. Its feeding strategy was opportunisticwhatever the season.
• Pomatoschistus microps based its feeding essen-tially on eggs (40 and 24% of indeterminate and mol-lusk eggs, respectively) in July and on Eurytemoraaffinis in November (55%), February (94%) and April(62%). However, this species showed no significanttemporal feeding variability (p-value = 0.301). It was aspecialist, focusing on prey from a specific weight(size) range whatever the considered month.
• The feeding of Pomatoschistus minutus consisted ofmollusk eggs (39%) and the mysid Mesopodopsisslaberri (22%) in July, almost exclusively M. slabberi(60% for small individuals and 79% for large individu-als) in September, M. slaberri (37%) and Gammarus spp.(21%) in November, mainly Eurytemora affinis (84% forthe small individuals and 82% for the large individuals)in February, and finally Gammarus spp. (82 or 64%) andNeomysis integer (18 or 28%) in June. Both size classesof P. minutus showed a specialist strategy, except in No-vember, when the numerous prey in their stomach werethe most abundant in the system (opportunism).
211
E. encrasicolusSeptember 2003
47–77 mm
n = 9
OPPORTUNIST
P. micropsJuly 2003
27–37 mm
n = 15
SPECIALIST
Abundance, Ab Mean weight, W
A. regiusJuly 2003
30–104 mm
n = 68
GENERALIST
Ab WRg1-2 ** ns
Rg1 ns ns
Ab WRg1-2 ns ns
Rg1 ns ns
Spearman test
Ab WRg1-4 ns ns
Rg1 ns ns
fish fishshr shr
mysismysispol pol
NintNintMsla
Mslaamp ampAc
Acmol
pol polmysid mysid
isopisopcir
cirMsla Mslaamp
ampmolmolEaff Eaff
eggs eggs
– + – +
mol
MslacirAcMslacir Ac
45
0
20
45
0
20
0
60
30
0
60
30
0
30
15
0
30
15
Fig. 2. Examples of cumulated frequencies of relative abundance (N) ranks (y-axis) versus prey abundances (Ab) or meanweights (
–––W ) in the environment for each predation strategy: Argyrosomus regius in July 2003 for generalist species (Spearman
correlation coefficients were not significant for Ab or –––W ), Engraulis encrasicolus in September 2003 for opportunistic species (fre-
quencies significantly increased with Ab), and Pomatoschistus microps in July 2003 for specialist species (the highest frequencieswere concentrated around a narrow
–––W value). Cir: cirripede larvae; mol: mollusk larvae; pol: polychaete larvae; Ac: Acartia spp.;
Eaff: Eurytemora affinis; mysis: mysis larvae; Nint: Neomysis integer; Msla: Mesopodopsis slabberi; mysid: other mysids; shr:shrimps; amp: amphipods, essentially Gammarus spp.; isop: isopods; Rg1, Rg2, Rg3: first, second and third N ranks; n: number ofstomach contents used to calculate frequencies. Significant positive correlations between N-rank frequencies and an increase/decrease in the prey characteristic frequencies are shown on the right. Spearman rank correlation was applied to each
of the cumulative series of the positive %N ranks, from the first and total N rank; **significant trend at p < 0.01

Mar Ecol Prog Ser 400: 207–219, 2010
• For the 2003 cohort of Argyrosomus regius, thediet was dominated numerically by Mesopodopsisslabberi (78%) in July, by the shrimps Palaemon spp.in September (54%) and November (64%) and byNeomysis integer and Gammarus spp. in April(respectively, 44 and 28%) and June (31 and 59%). A.regius oscillated between a generalist and specialistfeeding strategy.
• Dicentrarchus labrax fed essentially on the amphi-pods Gammarus spp. (24%) and the shrimps Palaemonspp. (32%) in February and on Gammarus spp. (57%)and Neomysis integer (14%) in April.
• The most abundant prey consumed by Merlangiusmerlangus were Mesopodopsis slabberi (88%) in Sep-tember and Palaemon spp. (50%) in November. Dicen-
trarchus labrax and M. merlangus always showed aspecialist feeding strategy.
Intraspecific feeding variability
Intra-specific feeding variability according to fish sizewas tested for Pomatoschistus minutus and Argyrosomusregius. No significant difference was observed betweenthe diets of the 2 size groups for P. minutus (p-values >0.05), in contrast to A. regius, e.g. only small specimensfed on small zooplankton. Moreover, whatever its size, P.minutus presented a specialist strategy, whereas A.regius exhibited generalist predation when small andspecialist predation when large.
212
Environment Size (mm) Prey no. (range) Prey strategyAvailable prey Prey density (ind. l–1) (replicates)
Engraulis encrasicolus (Eenc)Jul 2003 10 7.8 38–127 (18) 6 (naup–Nint) Opportunist*Sep 2003 11 3.1 47–77 (9) 3 (cir–Msla) Opportunist*Nov 2003 5 5.0 47–62 (6) 4 (Ac–mysid) Opportunist*
Sprattus sprattus (Sspr)Sep 2003 11 3.1 60–115 (5) 4 (naup–Eaff) Specialistns
Pomatoschistus microps (Pmic)Jul 2003 10 7.8 27–37 (15) 9 (eggs–pol) Specialistns
Nov 2003 5 5.0 27–38 (9) 6 (eggs–isop) Specialistns
Feb 2004 5 10.7 26–50 (11) 4 (eggs–amp) Specialistns
Apr 2004 9 18.6 33–39 (11) 5 (Ac–amp) Specialistns
Pomatoschistus minutus (small) (PminS)Sep 2003 11 3.1 23–39 (8) 5 (Ac–isop) Specialistns
Feb 2004 5 10.7 26–38 (21) 5 (eggs–amp) Specialistns
Jun 2004 10 13.1 21–39 (11) 2 (Nint–amp) Specialistns
Pomatoschistus minutus (large) (PminL)Jul 2003 10 7.8 40–73 (17) 9 (mol–shr) Specialistns
Sep 2003 11 3.1 40–65 (20) 5 (cops–amp) Specialistns
Nov 2003 5 5.0 41–65 (11) 5 (Msla–fish) Opportunist*Feb 2004 5 10.7 41–60 (5) 3 (eggs–amp) Specialistns
Jun 2004 10 13.1 40–55 (19) 3 (Nint–amp) Opportunist*Argyrosomus regius (small) (AregS)
Jul 2003 10 7.8 30–104 (68) 9 (mol–fish) Generalistns
Jun 2004 10 13.1 30–52 (14) 7 (Eaff–fish) Generalistns
Argyrosomus regius (large) (AregL)Sep 2003 11 3.1 130–235 (25) 4 (Msla–fish) Specialistns
Nov 2003 5 5.0 130–249 (36) 6 (Msla–fish) Specialistns
Apr 2004 9 18.6 126–260 (20) 6 (Msla–shr) Generalistns
Jun 2004 10 13.1 118–263 (38) 9 (eggs–fish) Specialistns
Merlangius merlangus (Mmer)Sep 2003 11 3.1 90–102 (5) 3 (Ac–fish) Specialistns
Nov 2003 5 5.0 114–150 (6) 5 (Msla–fish) Specialistns
Dicentrarchus labrax (Dlab)Feb 2004 5 10.7 80–147 (21) 7 (Eaff–crab) Specialistns
Apr 2004 9 18.6 83–140 (8) 5 (cops–fish) Specialistns
Dicentrarchus punctatus (Dpun)Apr 2004 9 18.6 95–135 (8) 5 (Msla–pol) Opportunist*
Table 2. Predation strategy for each fish species according to size and time. Results were deduced from the form of N frequencies ofprey versus abundances (Ab) and mean weights (
–––W ). Three different types of food behavior were determined: (1) opportunistic
when frequencies increased significantly with Ab, (2) generalist when the Spearman correlation coefficient was null, (3) specialistwhen the highest frequencies were concentrated around a narrow⎯W (cf. Fig. 2). See Fig. 2 for the definition of prey abbreviations;naup: nauplius larvae; copepods: other copepods. Prey range: the lowest and the highest weght (size) prey; ns: non-significant
trend; *significant trend at p < 0.05

Pasquaud et al.: Are fishes opportunistic in estuaries?
DISCUSSION
Sample representativeness
The present study was based on analyses, on the onehand, of fish stomach contents and, on the other hand,of hyperbenthic invertebrate samples, all from thesame estuarine area, i.e. the upstream part of thesaline Gironde estuary.
As in the saline areas of other European estuaries(Mees et al. 1995, McLusky & Elliott 2004), hyperbenthicinvertebrate samples were characterized by a low spe-cific diversity and high densities, features which varysignificantly over time. In previous investigations, tem-poral variability has been linked to fluctuations in envi-ronmental factors (David et al. 2005, Lobry et al. 2006). Inaddition, the specific compositions observed in 2003(David 2006, Lobry et al. 2006) were similar to those ob-served in other Gironde estuary studies (Castel 1981,Sorbe 1981, Mees et al. 1995): the copepods consistedpredominantly of Engraulis affinis in the spring andAcartia spp. in summer; the suprabenthos consisted ofNeomysis integer in the spring and Mesopodopsis sla-berri and Gammarus spp. in summer, which was similarto in other European estuaries (Soetaert & van Rijswijk1993, Mouny et al. 2000, Mouny & Dauvin 2002). Thestudy area was also representative for zooplankton andestuarine suprabenthos, which were fairly homogenous(David 2006). Thus, the samples collected give a goodpicture of hyperbenthic prey availability in the brackishpart of the estuary for the pelagic and demersal fish se-lected, i.e. those feeding mainly on these communities.
For some fish species chosen, only a few specimenswere included in the analysis due to a small number ofindividuals collected and/or because few individualshad a non-empty stomach, e.g. Sprattus sprattus andDicentrarchus punctatus. Moreover, these sampleswere sometimes collected from only one particulartrawl, i.e. concerned only a small part of the study area.However, for various reasons, these data have beentaken into consideration in the present study:
• These species showed a low intra-group feedingvariability, which can be explained by the characteris-tic of consumed hyperbenthic communities, i.e. fewspecies, high densities. The statistical minimum of5 individuals would therefore appear sufficient todefine the diet of these species.
• In the brackish part of the Gironde estuary, therewas no significant spatial variability in the prey com-munities either in composition or density (David et al.2005, David 2006). Whatever the location of the fishsampling, analysis of their stomach contents was rep-resentative of the feeding strategy in the area studied.
• The choice of these species allowed us to makestrategy comparisons between fish exhibiting ecologi-
cal and feeding similarities, e.g. Sprattus sprattus andEngraulis encrasicolus and Dicentrarchus punctatusand D. labrax, and provided assumptions on the struc-turing mechanisms of fish communities in an estuarineenvironment.
Inter- and intraspecific fish feeding variability
Fish stomach content analyses provide more thanjust a snapshot of what and how much an individualhas ingested at a given moment: they give essentialinformation to help understanding of species feedingrequirements and strategies.
Investigation of the diet compositions of the 8 mainpelagic and demersal fish species during the study pe-riod in the Gironde estuary enabled us to show inter-specific feeding variability. Despite the differences intaxa, geographical distribution and environmental con-ditions, similar feeding requirements have been ob-served in other estuarine and marine systems: the smallpelagic fish Sprattus sprattus and Engraulis encrasico-lus are zooplanktivores (e.g. Plounevez & Champalbert1999, Maes & Ollevier 2002); demersal fish, repre-sented by Argyrosomus regius, Dicentrarchus labrax,D. punctatus and Merlangius merlangus, consume hy-perbenthos (Moore & Moore 1976, Ktari et al. 1978,Cabral & Ohmert 2001, Laffaille et al. 2001); and Poma-toschistus minutus and P. microps eat both mesozoo-plankton and hyperbenthic prey (Salgado et al. 2004,Leitão et al. 2006). This interspecific feeding variabilitycould be linked to different body structures, i.e. eco-trophomorphology or ecomorphology (Wootton 1990).Morphological characteristics (e.g. position, shape andsize of the mouth, shape and ability to protrude the jaw,body form and size) determine position in the water col-umn, locomotive abilities and the size of prey they canintake (e.g. Schafer et al. 2002).
The present study highlights the fact that speciesthat have ecological and trophic similarities (e.g.Sprattus sprattus and Engraulis encrasicolus, or Dicen-trarchus labrax and D. punctatus) do not necessarilyshow diet overlap. Moreover, they present differentfeeding strategies. For example, the small pelagicfish S. sprattus is a specialist, whereas E. encrasicolusshows opportunistic predation strategies, and the dem-ersal fish D. labrax is a specialist, whereas D. punctatusis an opportunist. This feeding strategy variabilitycould narrow diet overlap, minimize interspecific com-petition and allow the co-occurrence of these species(Oscoz et al. 2006).
For species presenting ecological and morphologicalsimilarities and the same feeding strategies. Either (1)there is no feeding niche overlap. These cases occurwhen the species considered do not belong to the same
213

Mar Ecol Prog Ser 400: 207–219, 2010
size class, e.g. Pomatoschistus minutus and P. micropsin November and February, Argyrosomus regius andMerlangius merlangus in September. Salgado et al.(2004) have already highlighted a decrease in feedingoverlap between these 2 Pomatoschistus species due toan increased difference in length. Or (2) there is afeeding overlap when the resource is not limited, e.g.Pomatoschistus minutus and P. microps in Februaryand Argyrosomus regius and Merlangius merlangus inNovember, the time of year when the environmentis very poor in species numbers, but those that arepresent remain abundant, thus limiting any feedingcompetition.
Feeding variability according to size was tested onlyfor Pomatoschistus minutus and Argyrosomus regius,and not for any other species, either because too fewsamples per species were available or because theirsize distribution was too uniform. No significant feed-ing variation was observed between the 2 size classesof P. minutus (small <40 mm; large ≥40 mm). For thisspecies, a dietary shift has already been highlightedfor individuals with a total length >50 mm, with aprogressive disappearance of copepods and a con-siderable increase in larger prey (Hamerlynck & Cat-trijsse 1994, Salgado et al. 2004). This size range(≥50 mm) has not been differentiated in the presentstudy because of the small number of specimens. Avariation in feeding according to fish length wasobserved for A. regius, but also for Merlangius merlan-gus with their growth in time. Their diets varied, withlarger fish showing an increased consumption of largerprey. Body size effects on feeding shifts have alreadybeen identified for these predators (Quéro & Vayne1987, Pederson 1999, Cabral & Ohmert 2001), as wellas for Sprattus sprattus (Arrhenius 1996, Casini et al.2004), Engraulis encrasicolus (Conway et al. 1998) andDicentrarchus labrax (Kennedy & Fitzmaurice 1972,Labourg & Stequert 1973). Diet variations according tofish size have already been explained by ontogeneticchanges in morphology, especially by the increase inpredator gape width and swimming speed with theincrease in predator size (e.g. Garrison & Link 2000a,Pasquaud et al. 2004). The relative body size of thecomponent species has often been identified as a majordeterminant of food-web structure (Warren & Lawton1987). Garrison & Link (2000b) suggest that differentsize classes within a species may therefore be consid-ered functionally as different species in terms of tro-phic dynamics. These diet changes are particularlymarked when different ontogenetic stages are con-sidered (e.g. Garrison & Link 2000a, Woodward &Hildrew 2002), but these have not been highlighted inthis work.
The study of feeding strategies according to fish sizereveals different behaviors for Argyrosomus regius
(generalist/specialist) and Pomatoschistus minutus(specialist/opportunist). Marshall & Elliott (1996), whostudied the feeding ecology of the main fish speciesrecorded in the Humber estuary (United Kingdom),also emphasized specialization by the largest speci-mens for some species and an increase in nichebreadth with size for other species.
Temporal feeding variability
In relation to the naturally variable environmentalconditions, estuarine biological communities exhibitdistinctive temporal patterns at both low (David et al.2005, 2006) and high trophic levels (see, for instance,Elliott & Hemingway 2002, Lobry et al. 2006), suggest-ing that the resilience of estuarine ecosystems is linkedto the temporal trophic structure and perhaps to fishspecies’ ability to adapt their diet according to avail-able prey in the environment.
As in other estuarine systems (e.g. Hajisamae et al.2003, Hampel et al. 2005, West et al. 2006, Reum & Ess-ington 2008), the present work emphasizes a temporalvariability in estuarine fish diets and thus in trophictopology. The use of the cross-calculation method en-abled us to identify how fish exploit trophic resourcesaccording to time. As a result, most species were iden-tified as specialist, whichever month is being consid-ered. The present study therefore invalidates the com-mon hypothesis that estuarine fish are generallyopportunists (e.g. Moore & Moore 1976, Cabral &Ohmert 2001, Laffaille et al. 2001, Baldoa & Drake2002, Elliott & Hemingway 2002). Only a minority ofthe pelagic and demersal fish community in theGironde estuary — characterized by the marine juve-niles Engraulis encrasicolus and Dicentrarchus punc-tatus and by the resident species Pomatoschistus min-utus — were found to feed on the predominantabundant prey which differed from month to month.
This difference in conclusions, specialist versusopportunist, can be explained by the precision of themethod used for the present study, as it enabled us totest whether, among all the prey that can be the mostabundant in the system, a particular weight (size)range is selected. In the estuarine context, where spe-cific diversities are low and densities are high, the useof this method to draw conclusions about fish feedingstrategy would seem particularly appropriate.
It is interesting to note that this study reveals thespecialist feeding strategy of Pomatoschistus micropsand P. minutus, always described as opportunistic fishin the literature (e.g. Pihl 1985, Pasquaud et al. 2004,Leitão et al. 2006). Nevertheless, the dietary analysisfor both size and time emphasizes the capacity of P.minutus to adapt its feeding strategy according to prey
214
Pasquaud et al.: Are fishes opportunistic in estuaries?
availability. We can assume that the other residentspecies P. microps is able to adapt too.
The present study highlights the specialist feedingstrategy of the Sprattus sprattus, Merlangius merlangusand Dicentrarchus labrax species, whatever the monthconsidered. This strategy had already been shown for S.sprattus, which may have a major impact on the zoo-plankton community (Brooks & Dodson 1965, Rudstam etal. 1994, Casini et al. 2004). Thus, a decrease in the abun-dance of these 3 marine juvenile species or their absencefrom the system could be linked to a decrease in/disap-pearance of their preferential prey, associated with anincrease in competition pressure (prey availability). ForS. sprattus, a decrease in its zooplanktonic prey, as wellas trophic competition pressure from Engraulis encrasi-colus could explain its departure from the study area inNovember. The temporal segregation of M. merlangusand D. labrax, species that show feeding similarities,could also support this hypothesis. An ability to avoidniche overlap by spatio-temporal segregation has al-ready been shown for these 2 species in relation to otherfish species (Bromley et al. 1997, Cabral & Ohmert 2001).These results suggest a structuring of the fish communi-ties according to prey–predator relationships.
However, as suggested by prey abundances, shrimpsare probably not limited in winter. The absence of Mer-langius merlangus and Argyrosomus regius — also spe-cialist but trending towards generalist — in Februarycould be correlated with environmental conditions,especially low salinities and low water temperatures(Quéro & Vayne 1987, Pasquaud 2006). These observa-tions suggest that the fish assemblages in that brackishpart of the estuary are structured more by abiotic fac-tors than by trophic relationships during this period ofthe year. In other studies (e.g. Costa & Elliott 1991,Thiel et al. 1995, Kupschus & Tremain 2001, Harrison &Whitfield 2006, Lobry et al. 2006), this estuarine fishcommunity structuring has also been related to envi-ronmental variables, especially temperature and salin-ity, which depend on temporal variations in water flow(Lobry et al. 2006).
The estuarine fish communities are structured intime, both by environmental conditions and trophicrelationships (Marshall & Elliott 1996, Kimmerer 2002),but we can hypothesize that these structuring factorsdo not take effect on the same spatial scales as sug-gested by Martino & Able (2003): ‘large-scale patternsin the structure of estuarine fish assemblage are pri-marily a result of individual species’ responses to dom-inate environmental gradients, as well as ontogeneticmigrations, whereas smaller-scale patterns appear tobe the result of habitat associations that are most likelydriven by foraging, competition, and/or predatoravoidance’. This remark confirms theoretical views oncommunity structure, which maintain that physiologi-
cal tolerances to environmental factors set up the com-munity framework, while biotic interactions refine spe-cies distribution patterns within this structure (Wein-stein et al. 1980, Menge & Olson 1990) and underlinesthe need to consider the spatial feeding variability,which was not studied in this work.
CONCLUSIONS
Analysis of fish stomach contents gave a picture ofthe temporal patterns of the Gironde estuary fish foodweb, describing interspecific and intraspecific trophicrelationships and the dynamics of the food-web struc-ture. Comparisons of the relative abundance of prey inthe stomach contents, numerical abundance of theseprey in the environment and mean weight appear par-ticularly relevant for studying fish feeding strategy inestuaries and assessing the trophic functions providedby this system for these species.
The present study highlights a strong trophic dy-namism and suggests a resource partitioning dependenton predator/prey size (according to predator/prey life cy-cle), prey availability and predator presence (accordingto predator life cycle and environmental conditions). Op-timization of available trophic resource use, a key ele-ment in estuarine resilience (Elliott & Quintino 2007), ispossible due to the temporal adaptation of this structuraltrophic web. This trophic dynamism could play a majorrole in the stability/resilience of this ecosystem (cf. Link2002), as suggested by recent statements in the biodiver-sity–stability debate (see for instance Navarrete &Berlow 2006, Elliott & Quintino 2007).
In spite of their adaptation capacity, most fish speciesexhibited a specialist feeding strategy. In the Girondeestuary there are few invertebrate species. We canimagine that the loss of one species will affect the fishtrophic web structure and hence the resilience of thesystem. Comparative spatial studies are envisaged, i.e.intra-system studies, or comparisons with other estuar-ies or marine systems, to examine whether our conclu-sions can be generalized, to give a better understand-ing of the mechanisms of prey–predator structuringand to ascertain the degree of marine fish speciesdependence on estuarine systems.
The present study has enabled us to go beyond thestructural aspects of biological communities and accessfunctional aspects, in accordance with some recentrecommendations by de Jonge et al. (2006) and Elliott& Quintino (2007) concerning the implementation ofmonitoring programs in estuarine areas. In addition,this approach provides the data needed to developand/or validate trophic models (i.e. Lobry et al. 2008),in order to identify keystone species (Libralato et al.2006) and predict the development of these systems.
215

Mar Ecol Prog Ser 400: 207–219, 2010
Acknowledgements. We thank B. Ballion, R. Le Barh, J. F.Bigot, F. Daverat, M. Lepage and everyone who took part insampling surveys. This investigation was supported by theFrench Institute of Agricultural and Environmental Engineer-ing Research (Cemagref), the Regional Council of Aquitaineand the Ecology and Economics of the Garonne basin program.
LITERATURE CITED
Arrhenius F (1996) Diet composition and food selectivity of0-group herring (Clupea harengus L) and sprat (Sprattussprattus L) in the northern Baltic Sea. ICES J Mar Sci 53:701–712
Azémar F, Boulêtreau S, Lionard M, Muylaert K, VyvermanW, Meire P, Tackx M (2007) Looking for general trends introphic interactions among estuarine micro- and mesozoo-plankton. J Plankton Res 29:i135–i147
Baird D, Ulanowicz RE (1993) Comparative study on thetrophic structure, cycling and ecosystem properties of fourtidal estuaries. Mar Ecol Prog Ser 99:221–237
Baldoa F, Drake P (2002) A multivariate approach to the feed-ing habits of small fishes in the Guadalquivir Estuary.J Fish Biol 61:21–32
Bromley PJ, Watson T, Hislop JRG (1997) Diel feeding pat-terns and the development of food webs in pelagic 0-group cod (Gadus morhua L.), haddock (Melanogrammusaeglefinus L.), whiting (Merlangius merlangus L.), saithe(Pollachius virens L.), and Norway pout (Trisopterusesmarkii Nilsson) in the northern North Sea. ICES J MarSci 54:846–853
Brooks JL, Dodson SI (1965) Predation, body size and compo-sition of plankton. Science 150:28–35
Cabral HN, Ohmert B (2001) Diet of juvenile meagre, Argyro-somus regius, within the Tagus estuary. Cah Biol Mar 42:289–293
Casini M, Cardinale M, Arrhenius F (2004) Feeding prefer-ences of herring (Clupea harengus) and sprat (Sprattussprattus) in the southern Baltic Sea. ICES J Mar Sci 61:1267–1277
Castel J (1981) Aspects de l’étude écologique du plancton del’estuaire de la Gironde. Oceanis 6:535–577
Chessel D, Dufour AB, Thioulouse J (2004) The ade4 pack-age. I. One-table methods. R News 4:5–10. http://cran.r-project.org/doc/Rnews/
Conway DVP, Coombs SH, Smith C (1998) Feeding ofanchovy Engraulis encrasicolus larvae in the northwest-ern Adriatic Sea in response to changing hydrobiologicalconditions. Mar Ecol Prog Ser 175:35–49
Cortès E (1997) A critical review of methods of studying fishfeeding based on analysis of stomach contents: applicationto elasmobranch fishes. Can J Fish Aquat Sci 54:726–738
Costa MJ, Elliott M (1991) Fish usage and feeding in twoindustrialised estuaries — the Tagus, Portugal, and theForth, Scotland. In: Elliott M, Ducrotoy JP (eds) Estuariesand coasts: spatial and temporal intercomparisons. Olsenand Olsen, Fredensborg, p 289–297
Dauvin JC, Ruellet T (2009) The estuarine quality paradox: Isit possible to define an ecological quality status for specificmodified and naturally stressed estuarine ecosystems?Mar Pollut Bull 59:38–47
David V (2006) Variabilité spatio-temporelle du zooplanctondans l’estuaire de la Gironde et implications au sein duréseau trophique planctonique. PhD thesis, Université deBordeaux I, Bordeaux
David V, Sautour B, Chardy P, Leconte M (2005) Long-termchanges of the zooplankton variability in a turbid environ-
ment: the Gironde estuary (France). Estuar Coast Shelf Sci64:171–184
David V, Sautour B, Galois R, Chardy P (2006) The paradoxhigh zooplankton biomass–low vegetal particulateorganic matter in high turbidity zones: What way forenergy transfer? J Exp Mar Biol Ecol 333:202–218
de Jonge VN, Elliott M, Brauer VS (2006) Marine monitoring:its shortcomings and mismatch with the EU water frame-work directive’s objectives. Mar Pollut Bull 53:5–19
Elliott M, Hemingway K (eds) (2002) Fishes in estuaries.Blackwell, London
Elliott M, Quintino V (2007) The estuarine quality paradox,environmental homeostasis and the difficulty of detectinganthropogenic stress in naturally stressed areas. Mar Pol-lut Bull 54:640–645
Garrison LP, Link JS (2000a) Dietary guild structure of the fishcommunity in the Northeast United States continentalshelf ecosystem. Mar Ecol Prog Ser 202:231–240
Garrison LP, Link JS (2000b) Fishing effects on spatial distrib-ution and trophic guild structure of the fish community inthe Georges Bank region. ICES J Mar Sci 57:723–730
Hajisamae S, Chou LM, Ibrahim S (2003) Feeding habits andtrophic organization of the fish community in shallowwaters of an impacted tropical habitat. Estuar Coast ShelfSci 58:89–98
Hamerlynck O, Cattrijsse A (1994) The food of Pomaroschis-tus minutus (Pisces, Gobiidae) in Belgian coastal waters,and a comparison with the food of its potential competitorP. lozanoi. J Fish Biol 44:753–771
Hampel H, Cattrijsse A, Elliott M (2005) Feeding habits ofyoung predatory fishes in marsh creeks situated along thesalinity gradient of the Schelde estuary, Belgium and TheNetherlands. Helgol Mar Res 59:151–162
Harrison TD, Whitfield AK (2006) Temperature and salinity asprimary determinants influencing the biogeography offishes in South African estuaries. Estuar Coast Shelf Sci66:335–345
Hooper DU, Chapin FS, Ewel JJ, Hector A and others (2005)Effects of biodiversity on ecosystem functioning: a consen-sus of current knowledge. Ecol Monogr 75:3–35
Hurlbert ST (1978) The measurement of niche overlap andsome relatives. Ecology 59:67–77
Hynes HBN (1950) The food of freshwater sticklebacks (Gas-terosteus aculeatus and Pygosteus pungitius) with areview of methods used in studies of the food of fishes.J Anim Ecol 19:36–58
Hyslop EJ (1980) Stomach contents analysis — a review ofmethods and their application. J Fish Biol 17:411–429
Irigoien X, Castel J (1995) Feeding rates and productivity ofthe copepod Acartia bifilosa in a highly turbid estuary —the Gironde (SW France). Hydrobiologia 311:115–125
Kennedy M, Fitzmaurice P (1972) The biology of the bass,Dicentrarchus labrax, in Irish waters. J Mar Biol Assoc UK52:557–597
Kimmerer WJ (2002) Effects of freshwater flow on abundanceof estuarine organisms: Physical effects or trophic link-ages? Mar Ecol Prog Ser 243:39–55
Klein Tank A, Wijngaard JB, Konnen GP, Bohm R and others(2002) Daily dataset of 20th-century surface air tempera-ture and precipitation series for the European ClimateAssessment. Int J Climatol 22:1441–1453
Ktari MH, Bouain A, Quignard JP (1978) Régime alimentairedes loups (Poissons, Téléostéens, Serranidae) Dicentrar-chus labrax (Linné, 1778) et Dicentrarchus punctatus(Bloch, 1892) des côtes tunisiennes. Bull Inst Natl Sci TechOcéanogr Pêches 5:5–15
Kupschus S, Tremain D (2001) Associations between fish
216

Pasquaud et al.: Are fishes opportunistic in estuaries?
assemblages and environmental factors in nearshore habi-tats of a subtropical estuary. J Fish Biol 58:1383–1403
Labourg PJ, Stequert B (1973) Régime alimentaire du barDicentrarchus labrax L. des réservoirs à poissons de larégion d’Arcachon. Bull Ecol 4:187–194
Laffaille P, Lefeuvre JC, Schricke MT, Feunteun E (2001)Feeding ecology of 0-group sea bass, Dicentrarchuslabrax, in salt marshes of Mont Saint Michel Bay (France).Estuaries 24:116–125
Leitão R, Martinho E, Neto JM, Cabral H, Marques JC, PardalMA (2006) Feeding ecology, population structure and dis-tribution of Pomatoschistus microps (Kroyer, 1838) andPomatoschistus minutus (Pallas, 1770) in a temperate estu-ary, Portugal. Estuar Coast Shelf Sci 66:231–239
Libralato S, Christensen V, Pauly D (2006) A method for iden-tifying keystone species in food web models. Ecol Modell195:153–171
Lin HJ, Shao KT, Jan RQ, Hsieh HL, Chen CP, Hsieh LY,Hsiao YT (2007) A trophic model for the Danshuei Riverestuary, a hypoxic estuary in northern Taiwan. Mar PollutBull 54:1789–1800
Link J (2002) Does food web theory work for marine eco-systems? Mar Ecol Prog Ser 230:1–9
Livingston RJ (2002) Trophic organization in coastal systems.CRC Press, Boca Raton, FL
Lobry J, Mourand L, Rochard E, Elie P (2003) Structure of theGironde estuarine fish assemblages: a comparison of Euro-pean estuaries perspective. Aquat Living Resour 16:47–58
Lobry J, Lepage M, Rochard E (2006) From seasonal patternsto a reference situation in an estuarine environment: ex-ample of the small fish and shrimp fauna of the Girondeestuary (SW France). Estuar Coast Shelf Sci 70:239–250
Lobry J, David V, Pasquaud S, Lepage M, Sautour B, RochardE (2008) Diversity and stability of an estuarine trophic net-work. Mar Ecol Prog Ser 358:13–25
Macdonald JS, Green RH (1983) Redundancy of variablesused to describe importance of prey species in fish diets.Can J Fish Aquat Sci 40:635–637
Maes J, Ollevier F (2002) Size structure and feeding dynamicsin estuarine clupeoid fish schools: field evidence for theschool trap hypothesis. Aquat Living Resour 15:211–216
Marshall S, Elliott M (1996) The structure of the fish assem-blage in the Humber estuary, United Kingdom. Publ EspecInst Esp Oceanogr 21:231–242
Martino EJ, Able KW (2003) Fish assemblages across themarine to low salinity transition zone of a temperate estu-ary. Estuar Coast Shelf Sci 56:969–987
McLusky DS, Elliott M (2004) The estuarine ecosystem: eco-logy, threats and management. Oxford University Press,Oxford
Mees J, Fockedey N, Hamerlynck O (1995) Comparativestudy of the hyperbenthos of three European estuaries.Hydrobiologia 311:153–174
Menge BA, Olson AM (1990) Role of scale and environmentalfactors in regulation of community structure. Trends EcolEvol 5:52–57
Moore JW, Moore IA (1976) The basis of food selection insome estuarine fishes. Eels, Anguilla anguilla (L.), whit-ing, Merlangius merlangus (L.), sprat, Sprattus sprattus(L.) and stickleback, Gasterosteus aculeatus (L.). J FishBiol 9:375–390
Mouny P, Dauvin JC (2002) Environmental control of meso-zooplankton community structure in the seine estuary(English Channel). Oceanol Acta 25:13–22
Mouny P, Dauvin JC, Zouhiri S (2000) Benthic boundary layerfauna from the Seine estuary (eastern English Channel,France): spatial distribution and seasonal changes. J Mar
Biol Assoc UK 80:959–968Navarrete SA, Berlow EL (2006) Variable interaction
strengths stabilize marine community pattern. Ecol Lett 9:526–536
Oscoz J, Leunda PM, Miranda R, Escala MC (2006) Summerfeeding relationships of the co-occurring Phoxinus phoxi-nus and Gobio lozanoi (Cyprinidae) in an Iberian river.Folia Zool (Brno) 55:418–432
Pasquaud S (2006) Les relations trophiques: éléments destructuration des peuplements ichtyologiques en milieuestuarien — Application à l’estuaire de la Gironde. Thesede doctorat, Université de Bordeaux 1, Bordeaux
Pasquaud S, Girardin M, Elie P (2004) Diet of gobies of thegenus Pomatoschistus (P. microps and P. minutus), in theGironde estuary (France). Cybium 28:99–106
Pasquaud S, Lobry J, Elie P (2007) Facing the necessity ofdescribing estuarine ecosystems: a review of food webecology study techniques. Hydrobiologia 588:159–172
Pasquaud S, Elie P, Jeantet C, Billy I, Martinez P, Girardin M(2008) A preliminary investigation of the fish food web inthe Gironde estuary, France, using dietary and stable iso-tope analyses. Estuar Coast Shelf Sci 78:267–279
Pederson J (1999) Diet comparison between pelagic and dem-ersal whiting in the North Sea. J Fish Biol 63:197–212
Pihl L (1985) Food selection and consumption of mobileepibenthic fauna in shallow marine areas. Mar Ecol ProgSer 22:169–179
Plounevez S, Champalbert G (1999) Feeding behaviour andtrophic environment of Engraulis encrasicolus (L.) in theBay of Biscay. Estuar Coast Shelf Sci 49:177–191
Quéro JC, Vayne JJ (1987) Le maigre, Argyrosomus regius(Asso, 1801) (Pisces, Perciformes, Sciaenidae) du Golfe deGascogne et des eaux plus septentrionnales. Rev Trav InstPech Marit 49:35–66
Reum JCP, Essington TE (2008) Seasonal variation in guildstructure of the Puget Sound demersal fish community.Estuaries Coasts 31:790–801
Rudstam LG, Aneer G, Hildén M (1994) Top-down control inthe pelagic Baltic ecosystems. Dana 10:105–129
Salgado JP, Cabral HN, Costa MJ (2004) Feeding ecology ofthe gobies Pomatoschistus minutus (Pallas, 1770) andPomatoschistus microps (Kroyer, 1838) in the upper Tagusestuary, Portugal. Sci Mar 68:425–434
Salomon JN (2002) L’inondation dans la basse vallée de laGaronne et l’estuaire de la Gironde lors de la ‘tempête dusiècle’ (27–28 décembre 1999). Géomorphologie: relief,processus, environnement 2:127–134
Sautour B, Castel J (1995) Comparative spring distribution ofzooplankton in three macrotidal European estuaries.Hydrobiologia 311:139–151
Schafer LN, Platell ME, Valesini FJ, Potter IC (2002) Compar-isons between the influence of habitat type, season andbody size on the dietary compositions of fish species innearshore marine waters. J Exp Mar Biol Ecol 278:67–92
Soetaert K, Van Rijswijk P (1993) Spatial and temporal pat-terns of the zooplankton in the Westerschelde estuary.Mar Ecol Prog Ser 97:47–59
Sorbe JC (1981) La macrofaune vagile de l’estuaire de laGironde: distribution et migration des espèces, modes dereproduction et régimes alimentaires. Oceanis 6:579–592
Sottolichio A (1999) Modélisation de la dynamique des struc-tures turbides (bouchon vaseux et crème de vase) dansl’estuaire de la Gironde. Thèse de doctorat, Université deBordeaux I, Bordeaux
Thiel R, Sepulveda A, Kafemann R, Nellen W (1995) Environ-mental factors as forces structuring the fish community ofthe Elbe Estuary. J Fish Biol 46:47–69
217

Mar Ecol Prog Ser 400: 207–219, 2010
Wallace RK (1981) An assessment of diet-overlap indexes.Trans Am Fish Soc 110:72–76
Wallace H, Ramsay JS (1983) Reliability in measuring dietoverlap. Can J Fish Aquat Sci 40:347–351
Warren PH, Lawton JH (1987) Invertebrate predator–preybody size relationships — an explanation for upper-triangular food webs and patterns in food web structure.Oecologia 74:231–235
Weinstein MP, Weiss SL, Walters MF (1980) Multiple determi-nants of community structure in shallow marsh habitats,Cape Fear River Estuary, North Caraolina, USA. Mar Biol58:227–243
West JB, Bowen GJ, Cerling TE, Ehleringer JR (2006) Stableisotopes as one of nature’s ecological recorders. TrendsEcol Evol 21:408–414
Wolff M, Koch V, Isaac V (2000) A trophic flow model of theCaeté mangrove estuary (North Brazil) with considera-tions for the sustainable use of its resources. Estuar CoastShelf Sci 50:789–803
Woodward G, Hildrew AG (2002) Body-size determinants ofniche overlap and intraguild predation within a complexfood web. J Anim Ecol 71:1063–1074
Wootton RJ (1990) Ecology of teleost fishes. Chapman & Hall,London
218
Jul 2003 Sep 2003Eenc Pmic PminL AregS Eenc Sspr PminS PminL AregL Mmer
Size range (TL; mm) 38–127 27–37 40–73 30–104 45–77 60–115 23–39 40–65 130–235 90–102Number of full stomachs 18 15 17 68 9 5 8 20 29 5Zooplankton
Eggs 40Nauplius larvae 44.4 2.8 2.4 54.4Mysis larvae 1.7Mollusk eggs 39.6 24.4 38.9 0.3Mollusk larvae 1.5Polychaete larvae 0.2Cirriped larvae 8.3 11.1 2. 8 0.3
CopepodsEurytemora affinis 13.3 3.9 10 3.4Acartia spp. 4.4 4.7 94 41.7 10 5.9Copepods ind. 3.4
HyperbenthosMysidacea
Neomysis integer 1.5 11.1 4.3 10.3Mesopodopsis slabberi 0.8 2.2 22.2 78.5 3.6 60 79.3 22.2 88.2Mysids ind. 2.2 8.3 10
IsopodaSynidotea laticauda 2.2 10 6.4Isopods ind. 2.8
AmphipodaGammarus spp. 2.2 5.6 0.2 3.4
Decapoda natantiaPalaemon spp. 0.3 54.1Crangon crangon 2.8 9.5 9.2
NektonTeleost fishes 0.2 8.3 5.9
BenthosAnnelida Polychaeta
Nereis succinea 2.2 2.8Other
Pollen 0.1
Appendix 1. Relative abundance diet composition (%N) of the main pelagic and demersal fish according to size and time in the upstream area of the saline Gironde estuary. See Table 2 for abbreviations
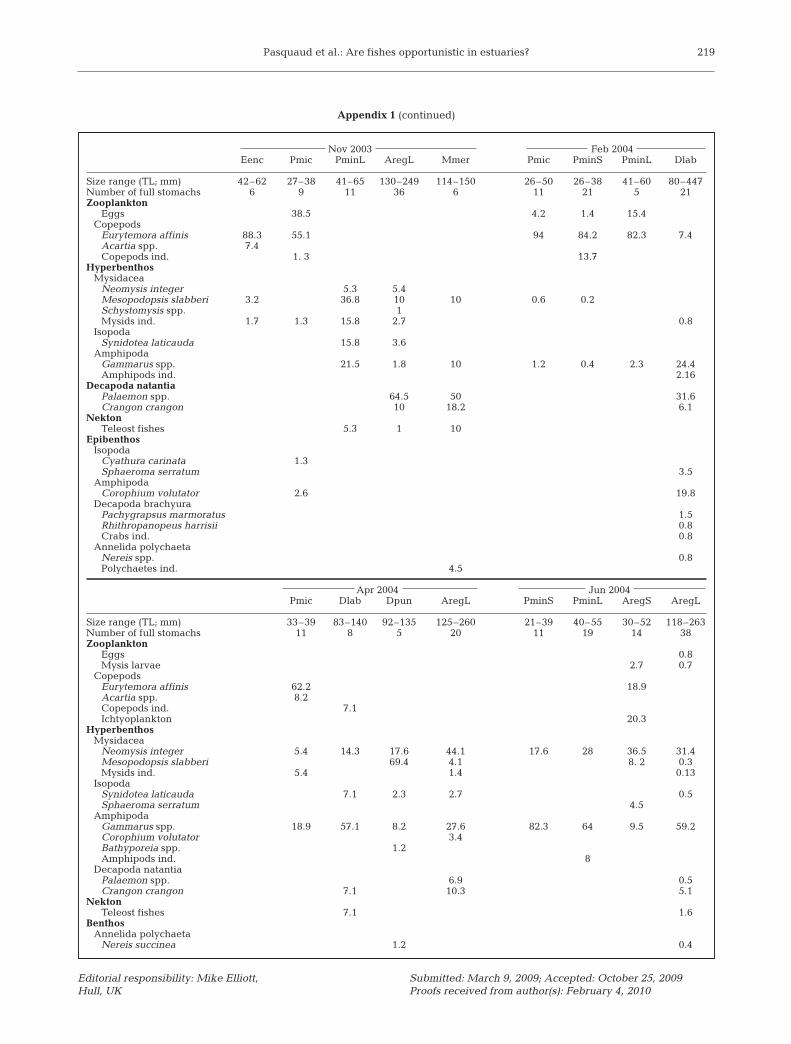
Pasquaud et al.: Are fishes opportunistic in estuaries? 219
Nov 2003 Feb 2004Eenc Pmic PminL AregL Mmer Pmic PminS PminL Dlab
Size range (TL; mm) 42–62 27–38 41–65 130–249 114–150 26–50 26–38 41–60 80–447Number of full stomachs 6 9 11 36 6 11 21 5 21Zooplankton
Eggs 38.5 4.2 1.4 15.4Copepods
Eurytemora affinis 88.3 55.1 94 84.2 82.3 7.4Acartia spp. 7.4Copepods ind. 1. 3 13.7
HyperbenthosMysidacea
Neomysis integer 5.3 5.4Mesopodopsis slabberi 3.2 36.8 10 10 0.6 0.2Schystomysis spp. 1Mysids ind. 1.7 1.3 15.8 2.7 0.8
IsopodaSynidotea laticauda 15.8 3.6
AmphipodaGammarus spp. 21.5 1.8 10 1.2 0.4 2.3 24.4Amphipods ind. 2.16
Decapoda natantiaPalaemon spp. 64.5 50 31.6Crangon crangon 10 18.2 6.1
NektonTeleost fishes 5.3 1 10
EpibenthosIsopoda
Cyathura carinata 1.3Sphaeroma serratum 3.5
AmphipodaCorophium volutator 2.6 19.8
Decapoda brachyuraPachygrapsus marmoratus 1.5 Rhithropanopeus harrisii 0.8 Crabs ind. 0.8
Annelida polychaetaNereis spp. 0.8Polychaetes ind. 4.5
Apr 2004 Jun 2004Pmic Dlab Dpun AregL PminS PminL AregS AregL
Size range (TL; mm) 33–39 83–140 92–135 125–260 21–39 40–55 30–52 118–263Number of full stomachs 11 8 5 20 11 19 14 38Zooplankton
Eggs 0.8Mysis larvae 2.7 0.7
CopepodsEurytemora affinis 62.2 18.9Acartia spp. 8.2Copepods ind. 7.1Ichtyoplankton 20.3
HyperbenthosMysidacea
Neomysis integer 5.4 14.3 17.6 44.1 17.6 28 36.5 31.4Mesopodopsis slabberi 69.4 4.1 8. 2 0.3Mysids ind. 5.4 1.4 0.13
IsopodaSynidotea laticauda 7.1 2.3 2.7 0.5Sphaeroma serratum 4.5
AmphipodaGammarus spp. 18.9 57.1 8.2 27.6 82.3 64 9.5 59.2Corophium volutator 3.4Bathyporeia spp. 1.2Amphipods ind. 8
Decapoda natantiaPalaemon spp. 6.9 0.5Crangon crangon 7.1 10.3 5.1
NektonTeleost fishes 7.1 1.6
BenthosAnnelida polychaeta
Nereis succinea 1.2 0.4
Appendix 1 (continued)
Editorial responsibility: Mike Elliott, Hull, UK
Submitted: March 9, 2009; Accepted: October 25, 2009Proofs received from author(s): February 4, 2010