Embed Size (px)
Citation preview
Explanation for the comments raised by the learned referee: I thank the honourable referee for a patient examination of the thesis and I am fortunate to get valuable comments for the improvement of the quality of the thesis. With the comments raised by the reviewer, I had a chance to improve the interpretation of the data obtained and developed the skills in presenting the work. As I was going through the corrections I enjoyed the expertise, knowledge and dedicated zeal of the esteemed referee in helping me to improve myself in reviewing back the literature and giving me a new in-depth thought in the subject and thereby uplifting the quality of the thesis. It is a great pleasure to be proud to understand and interpret theoretical issues to the scientific and practical implications of exploration and drilling in offshore projects/ventures. As per honourable reviewer’s suggestions in the form of comments/ modifications/ suggestions/queries the following items/points were presented hereunder:
Suggestion A. A better series of base maps is needed to characterize the study area. See comments
34 and 37 below. Answer: Line drawing map of the basin in addition to the index map of India, Geological map of
the study area are redrawn, the geological features are illustrated on the figure of the basin. Index map of the India, the basin, geological map (Fig.1.7), study area and sampling grid (Fig. 2.1) -this sequence has been followed in the figure for a better illustration.
Suggestion / comment B.
No discussion of why you used the acid extraction method to look at hydrocarbon gases, rather than additional or alternative methods. If hydrocarbon gases are present as unbound gas, they are lost in this procedure and might be important in geochemical prospecting – in fact it is the unbound gases that are available to hydrocarbon– oxidizing microbes. I find it no surprise that there is no correlation between bound gasses and hydrocarbon-oxidizing microbes. Why weren’t gasses also captured through the soil probe and/or headspace method? Variations of these methods are routinely used aboard Ocean Drilling Program (ODP) and International (IODP) expeditions to capture unbound interstitial gases. The procedures and methods of measuring the hydrocarbon gas concentrations, which lie at the heart of this scientific study, must be verified and justified.
Answer: Horvitz, in 1939, proposed and developed a methodology for the measurement of hydrocarbons that are adsorbed onto the surface of soil particles itself rather than measuring the hydrocarbon content of soil gas which had the disadvantage of hampering the detection limit of the manometric measurements used at the time. The desorption of the adsorbed hydrocarbons which were generally in greater abundance than in the free soil gas allowed for an advance in the application.

Later, Sokolov in 1970 reported that in many areas adsorbed-gas analysis gave better results than pore-gas analysis. The acid extraction method, in the study, was thus used to look at hydrocarbon gases, rather than additional or alternative methods as it has several advantages such as, not affected by sudden barometric pressure changes, moisture variations, sampling inconsistencies, loss of sample due to breached containers, a repeat analysis is possible. Sampling of unbound gas is greatly affected by weather conditions, changes in barometric pressure, soil temperature, amount of water saturation in the soils, and the location of the water table (Tedesco, 1995).
Suggestion / comment C. No discussion of possible source rocks for petroleum in the basin. Desperately
needed for a complete picture of possible sources, especially since the author posts two different hydrocarbon gas sources based on carbon isotopic composition of HC gases.
Answer: The Bikaner-Nagaur Basin is mostly a Paleozoic basin with a considerable thickness of
Paleozoic sediments, overlain by a thin veneer of Tertiary/Mesozoic sediments. The Paleozoic sediments include evaporites and carbonates (Fig. 1.8). Potential source and reservoir rocks have been identified in the Paleozoic sediments. The Cenozoic sedimentation in the Bikaner-Nagaur basin began with the coal-bearing Palana Formation that was deposited during the Paleocene in subtropical swampy conditions on the continental part. Marine sedimentation indicates encroachment of the sea during the Upper Paleocene to Lower Eocene (Bhowmick and Misra, 2010). The Huqf Supergroup of Oman (Saudi Arabia) which is oil producing, can be lithostratigraphically compared with the supposed time equivalent succession of the Marwar Supergroup in Bikaner-Nagaur Basin. Moreover, the equivalent formations in Bikaner-Nagaur Basin, i.e. Jodhpur sandstone and Bilara limestone formations, have also given heavy oil in Bhagewala oil well and light oil from the HEG Formation (Infracambrian in age) in well Nanuwala, Shri Ganga Nagar district, Rajasthan (Singh and Tewari 2011). Lateral facies changes from the Bilara carbonate (basin margin) to the Hanseran Evaporite Group (HEG) (basin center) of the basin are similar to the Ara Group of the South Oman Salt Basin of Oman. A similar age of the pre-sedimentary basement with the Malani volcanic suite of India dated at 750 Ma being coeval with much of the crystalline and volcanic basement dated in Oman (920-720 Ma) were observed.
The thermogenic source for petroleum can be from the possible source rocks in the basin which are the: Karampur/Badhaura Shales, Upper Carbonate Dolomites, Bilara Shales and Dolomites. The Infracambrian anoxic conditions with super seal salt formations were ideal for preservation of rich source rocks. These thick salt formations are present from Oman (Huqf Formation) in the west, where they constitute a most prolific petroleum play, to India (Bilara-Jodhpur Formations) in the east. Upper Carbonate Dolomites, Nagaur Sandstones, Jodhpur Sandstone and Bilara Dolomites are reservoir rocks. Moderate to high basement-controlled anticlinal structures and fault closures act as traps. The petroleum play types of the Bikaner-Nagaur basin include early Cambrian transgressional fault-blocks and reactivation combined with salt swells, tertiary reactivated fault-blocks, transgression and extensional movement along the existing faults (DGH 2012).
Suggestion / comment D. The spacing of the sample points is about 1.3 Km so the mapping of parameters is
sometimes compromised by this coarse spacing. The hydrocarbon data do seem to show an area of concentration but the highest area of methane, ethane, and propane concentration is defined by a single sample locality. So the apparent pattern may not be significant.
In order to truly characterize and verify the existence of a migration pathway or field under the apparent gas anomaly, one would have to do a second sampling pass with finer resolution. Looking at Fig. 3.15, there seems to be a linear, SW-NW trending anomaly- migration pathway?
Reply:
As evident, the data shows high hydrocarbons in all the samples though shown in less evident colour (light pink), which covers the high background concentration and is significant (566 ppb in Fig. 3.15); due to which only one sample “might seem to be showing anomaly” and the majority of the samples are falling in the high background concentration. The trend of the migration pathway is considered to be clearly linear though a single sample is showing an anomaly because the remaining high concentration samples are in oblivion with the high background values; however, as stated by the reviewer, in order to identify a single locale for exploration, a finer sampling strategy needs to be followed.
Suggestion / comment E.
The isotopic and molecular “fingerprinting” efforts of Bernard, Schoell, Faber, and Whiticar are predominantly based on the molecular and isotopic characteristics of free or dissolved gasses, not adsorbed gases. Your data are from bound gases. These two distinctly different types of gas measured may introduce problems in the direct interpretation of your data superimposed on the various cross plots. Bound gases are typically more enriched in 13C, so are we seeing this artefact in your data that is mistakenly interpreted as thermogenic gas? Although I agree that the gases observed are most likely or could be thermogenic, I think you will have to explain the possible affects of assessing adsorbed rather than free gases in any subsequent publication.
Reply:
The molecular and isotopic characteristics of “adsorbed” soil gases can be determined using the plots proposed by Bernard, Schoell and Faber. One of the papers published in Chemical Geology employed the isotopic and molecular compositional ratios proposed by Bernard, Schoell, Faber were all based on the adsorbed hydrocarbon concentrations (Mani et al, 2011) and thus applied in the present study.
As proposed by Berner and Faber (1996), carbon isotopic variations of bound light hydrocarbons can be directly related to source rock maturity. Hence, it was employed to evaluate the terrestrial/marine nature of the emanating gases in the present work. Faber et al., 1990 also employed the compositional ratios and their isotopic values of the sorbed

gases to characterize the gas following the models of Bernard and Abrams. In unison with reviewer, bound gases might show enriched 13C values compared to free gases, however the prominent presence of C2+ hydrocarbons in the adsorbed soil gases migrating from subsurface to surface suggest a thermogenic origin.
Suggestion / comment F. I am extremely sceptical that the source of hydrocarbon gases – woody versus algal
substrates – can be identified in this study. First of all the carbon isotopic data are limited (17 Samples versus 100 samples of HC gas concentration) so that there are not a sufficient number of samples to draw sound interpretations. Also, the separation of 13C isotopic values between woody versus algal sources is only a few per mil. If the measured gases come from mixed sources or are altered by microbial consumption/production it won’t be possible to distinguish the sources. Lastly, because of the low number of samples and the large study area, the areal pattern of any variations of δ13CHC cannot be determined with any confidence (see argument for trace metal interpretations below as well).
Answer:
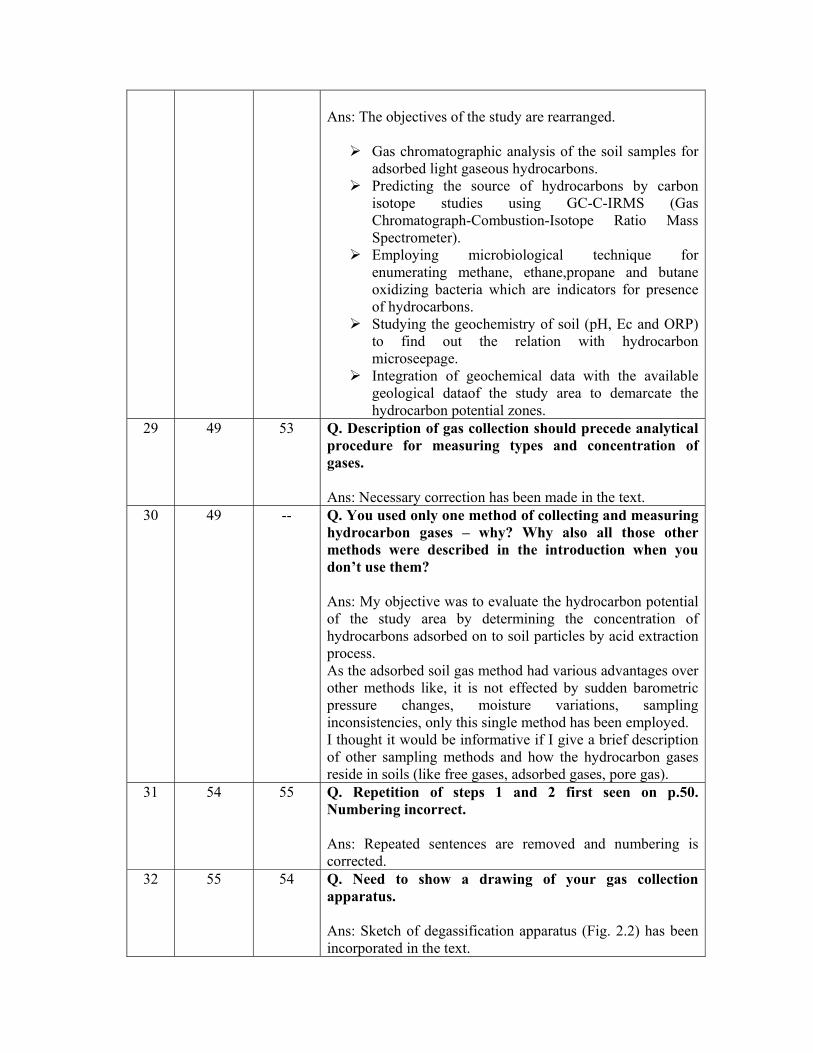
The samples are now classified into two zones i.e., A and B based on the locations west and east of stations respectively, formed by the line GNR-5 and GNR-50. I could not analyse all the samples for carbon isotopic ratios, but I have added the data for another 20 samples to the existing 17 samples out of a total number of 100 samples. Hence, 37 samples out of 100 could be considerable number for statistical evaluation of the data.
A very less separation of 13C isotopic values between woody versus algal sources could be attributed to the chemical structure of the organic matter, rendering a slight probability to differentiate the source of hydrocarbons, however, the samples plotted in the Fig. 4.6 are too far away from the mixed zone to be misinterpreted. Hence, the hydrocarbons gases could be considered as generated from terrestrial organic matter with partial contribution from marine source. Also, apart from the Schoell diagram (Fig. 4.6), another isotopic data evaluation plot was incorporated (Fig. 4.7), in order to arrive at a focussed/definitive conclusion.
Suggestion / comment G.
Nowhere in the dissertation are the methods for measuring pH, Ec, and ORP described. Are these values measured in situ at the core selection sites? Measured on site from the cores after collection? Measured later in the lab? Moreover, I think that these properties would vary considerably depending on whether the soil was wet or dry.
Reply:
The core soil samples collected from the study area are tested later in the lab for physico-chemical parameters such as: pH, Ec and ORP/Eh. An Orion 5 star Bench top meter (Thermo Electron Corporation., Germany) is used for this purpose. The sample preparation is achieved by weighing 50 g of soil sample and mixing with 50 ml of

distilled water. This mixture is stirred constantly for 1 hour. This soil sample solution is measured for pH, EC and ORP (Back and Barnes, 1964).
This matter is now incorporated in the thesis.
Comment H.
I disagree strongly with some interpretations of Chapter V, concerning pH, trace elements, etc.
• Ec values have no correlation with hydrocarbon occurrence and shown with C2 concentration. A scatter plot of Ec vs. [C2] (or any of the other hydrocarbon gases (C1, C2, C2+) shows no correlation. Note the “shotgun pattern” of the data and the low correlation coefficients (R2) below.
• I don’t see a correlation between ORP and [hydrocarbon] either, so the premise (as discussed on pg. 134) that leaking hydrocarbons cause reducing conditions is not shown by the data; it may certainly occur elsewhere documented by other workers but it cannot be demonstrated in this study area.
• The trace element data displayed in Table 5.3 and displayed in figs. 5.4 through 5.17 are insufficient to show any correlation with high hydrocarbon gas concentrations in maps 4. Only 15 data points are used for trace element data and they are sparsely and insufficiently distribution over the study area. For example, there seems to be correlation between the hydrocarbon occurrence north of Mirzawala and scandium and zinc, but any correlation may only be

happenstance as shown by the following scatter plots that show correlation. Note the “shotgun patter” of the data and the low correlation coefficients (R2) below.
The data are too sparse to contour meaningfully.
Submission:
Ec is a parameter that represents dissolution or precipitation of mineral species thereby indicates the presence of oxidizing or reducing environment. The hydrodynamic flow in the soil moves the solubilized elements around although they do not necessarily leave the reduced area. Concentration in to the anomalous areas occurs where reduced ground waters low in pH and Eh/ORP and intermingles with ground water of higher Eh/ORP and pH. Though there is no one to one correlation between Ec, pH, and ORP and hydrocarbon concentrations; Ec, pH, and ORP anomalies were observed near the hydrocarbon anomalies. Due to the above phenomenon occurring in the soils, even the trace metal concentrations did not show any one to one correlation with hydrocarbons but the trace metal anomalies are seen near hydrocarbon anomalies. As per the reviewer’s suggestion, 20 additional samples were analysed for trace metals and data is added to the existing 15 samples data. So, out of total number of 100 samples, 35 samples are analysed.
• See my other comments concerning this chapter in the next section, below.
Comment I.
I disagree with the conclusions concerning the relationship of hydrocarbon gas concentrations and counts of hydrocarbon – oxidizing microbes.
First of all there is no mention of any controls, i.e., media only without any inoculation of sample. The lack of controls calls the entire count procedure and results into question.
Submission: Negative control (petri dishes containing only media) was included in the course of
the experiment which contains only the Mineral Salt Media (MSM) without the test sample. These control petri dishes were incubated along with the test soil samples.
After incubation no growth was observed in the negative control petri dishes. The bacterial growth obtained in the test samples was due to the provided hydrocarbon atmosphere.
Earlier, this was not included in the thesis due to ignorance.
Second, the author has not verified that the colonies growing on the petri dished are actually MOB, EOB, POB, or BOB oxidizing microbes. These colonies could be any type of microbe because the possibility of contamination or cross contamination has not been eliminated by control procedures.
Submission:
The microbial prospecting study is based solely on the determination of bacterial cell concentration of hydrocarbon oxidizers in the soils. Verification of the nature of the bacterial colonies developed can be assessed based on the following facts:
The soil samples were incubated along with the positive controls of known hydrocarbon oxidizing bacterial strains namely, Rhodococcus rhodochrous MTCC 291, Mycobacterium species MTCC 19, Pseudomonas species MTCC 129 and Pseudomonas indica IMT 37 were obtained from Microbial Type Culture Collection Centre and Gene Bank (MTCC), Institute of Microbial Technology, Chandigarh, India, under the required hydrocarbon atmosphere. The growth was observed in positive controls and in test samples after incubation. This indicates, methane/ethane/propane/butane oxidizing bacterial colonies developed by utilizing the given hydrocarbon gases as sole carbon source (Rasheed et al., 2008). The microbial prospecting study is based on the determination of bacterial cell concentration of hydrocarbon oxidizers in the soils.
This is now incorporated in the text as per the reviewer’s suggestion. Earlier this was not incorporated in the text due to ignorance.
Third, there is no reason why hydrocarbon oxidizing microbes counts should show any correlation with bound hydrocarbon gases because these gases are unavailable to microbes. Microbes will be able to utilize unbound gasses existing as free gas or dissolved gas in soil interstial water. Am I missing something here? My view completely explains why there is little correlation between microbe counts and bound gas concentrations (see below).
Even if the above points are discounted, I disagree with the interpretations of the author, who suggests a reverse correlation of microbe counts versus gas concentrations when there is no positive or negative correlation apparent in the data. Note the “shotgun patter” of the data and the low correlation coefficients (R2) below.

Moreover the contour maps do not show any correlation between high hydrocarbon gas concentration and high microbial counts. Nor do they show a reverse correlation as the scatter plots above shown. The apparent correlation of low counts with high concentration occurs not only at locations with high HC gas concentration but also at locations with low HC gas concentration. The author’s interpretation is not correct. See point 3 above.
Reply:
Halo concept:
The basis for microbial detection of petroleum lies in the bacteria’s ability to directly utilise “some portion” of the hydrocarbons “migrating through and out of the soil substrate”. The bacteria are present sorbed in the sub-surface soil matrix and thus directly utilise loosely adsorbed hydrocarbon gases or a portion of the adsorbed soil gases, through the moisture present in the soil strata(Tedesco, 1995); making the adsorbed soil gases go low to unavailable in concentration. Therefore, the results also showed that wherever the microbial counts are high, the adsorbed soil gas concentration is low which is nothing but the ‘Halo’ concept (Klusman, 1993) (Fig. 6.5); explained below with respect to the results of the study area:
A comparison of adsorbed soil gas (C1, C2 and C3) and microbial population counts (MOB, EOB and POB) shows that when the microbial counts are high, the adsorbed soil gas concentrations are low. This is because of consumption of hydrocarbons by bacteria, thereby, reducing the hydrocarbon concentrations in the soil. The anomalies so distributed (by both Gas chromatograph and Microbiological studies) are adjacent and follow the natural model depicting 'halo' pattern. This implies significant microbial anomaly above the hydrocarbon reservoir with lower values for adsorbed soil gases. Relatively higher concentrations of adsorbed gases were observed surrounding the microbial anomaly demonstrating the 'halo' effect (Horvitz., 1981; Jillman., 1987; Rasheed et al., 2008).

The abo Referen
1. Horvin ExUniv
2. RashmicrCudd
3. Jillm
4. Backpoten
Fig. 6.5 Idea (Ada
ove discussio
nces:
vitz, L., 1981xploration foversity Press
heed, M.A., robial prospdapah Basin
man, N. (1987
k, W. and Bntials, U.S. G
alized modeapted from K
on is now in
1. Hydrocarbfor Petroleum, Dallas, TX
Veena Praspecting meth, India. Curr
7) Surface G
Barnes, I. L. Geologic Su
l of bacteriaKlusman, 199
ncorporated i
bon prospectm and NaturX, p. 83–95.
sanna, M., Sahod for hydrent Science
Geochemistry
(1964) Equurvey Profess
al effect on a93)
in the thesis.
ting after forral Gas II (ed
atish Kumardrocarbon e, 2008, V. 95
y Enigmas. O
uipment for fsional Paper
dsorbed soil
.
rty years. (Ind. Gottleib, B
r, T., Patil, Dexploration 5(3), p.361–
Oil and Gas
field measurr 424-C.
l gas hydroca
n: UnconvenB.M.), South
D.J. and Dayin Vengann366.
Journal, v.9
rements of e
arbons
ntional Methohern Method
yal, A.M., Gnapalli villa
, pp.87-89.
electrochemi
ods dist
Geo-age,
ical

5. Klusman, R. W. (1993) Soil gas and related methods for natural resource exploration: New York, John Wiley and Sons, p. 483.
6. Tedesco, S.A. (1995) Surface Geochemistry in Petroleum Exploration, Atoka Exploration,
Chapman and Hall, London, p. 1 -206.
I once again take the opportunity to acknowledge the learned referee’s keen interest which helped me to improve the quality of the thesis as well as presentation skills.

S.No.
1
2
3
4
5
6
P.No. in Reviewed
Thesis iv
3
12
12
12
13
P.No. in Revised Thesis
iv
3
12
12
13
13
Q. In Syno Ans: Ec anQ. When “active” apage 3, themicroseepthe amounsurface anpassive imwith is not Ans: The going to puQ. No citat Ans: ReferStegena (prospectingQ. No explit is gradmultiplicatequation. Ans: J = - D *J : DiffusioD: Diffusio
: GradienC: VolumeQ. Effusioversed in. Ans: The teQ. The iddeveloped causes advbe connecremain con Ans: The fotext. Compactioof the resefluids into to drive fluthat the su
Com
opsis. Ec and
nd ORP defingoing to pu
and “passive terms are age, respectnt and typ
nd can be demply referent the intent o
terms activeublication. tion for Fick
rence for Fic1961) On g: Geophysiclanation of dient-why tion symbo
*C on flux (masson co-efficient e concentration is not a Advection
erm effusiondea of “co
here. Cvection of fcted to hornfused on w
following cha
n is a downwervoir rocks lower press
uids upward urface geoch
mments & A
d ORP are n
ned in the syublication,
ve” regardinsynonymoutively. Thee of hydroefined readince to a mecof the term
e and passiv
k’s law
k’s law is inthe princip
cs, v. 26 (4),term “gradnot just w
ols, it is n
s/area/time)ent ( length2/
on (mass/voa term usedor expulsio
n is replaced ompaction” ompaction
fluids upwarizontal flowwhat you we
anges have b
ward pressuand drives
sure areas orfrom these t
hemical ano
Answers
not defined
ynopsis. I would avng seepage.us with mace latter trulycarbons obily. The terchanism of usage.
ve will be r
ncorporated. ples of ge, p. 447-451
d” in equatiwrite it ouot clear th
/time)
olume) d in the litn is used.
by expulsiois not weof sedime
rds. It reaw in the s
ere trying to
been incorpo
ure that causepetroleum
r traps. Prestraps. It has b
omalies are
.
void the ter. As used roseepage ay only refer
bserved at rms active aemplaceme
removed wh
eochemical . ion. Of couut? With
hat this is
terature I
on. ell defined ents and soally should nsubsurface. o show here.
orated in the
es compressand associassure continubeen suggesthe product
rms on
and r to the
and ent,
hen
oil
urse no an
am
or oils not I
.
sion ated ues
sted t of

vertical movement due to deep basinal compaction or meteoric recharge waters (Tissot, 1995).
7 17ff 23 Q. This section requires more documentation with reference citations. Ans: More documentation is included with reference citation.
8 17ff 23 Q. This section should not describe every method, only those used in this study for the sake of brevity. What are advantages, disadvantaged, and targeted gases of each of these methods? Ans: Advantages, disadvantages, and targeted gases of each of the methods have been described.
9 25ff 34 Q. Not effective in describing various indicators, techniques, and cross-plots chronologically, better to discuss conceptually or thematically and include an assessment of strengths and weakness. Ans: This section has been modified and given conceptually.
10 34 39 Q. For publication need a line drawing of the basin with its boundaries in addition to the index map of India and the geological map of the study area. Ans: The line drawing map of basin with its boundaries in addition to the index map of India and the geological map of the study area has been incorporated in the text. (Fig. 1.6)
11 34ff 40 Q. If naming all these geologic features, they should be illustrated on the figure of the basin. Ans: Most of the geological formations are shown in the redrawn geological map which is incorporated in the text (Fig. 1.7)
12 34ff 41 Q. The most germane information to your study are the possible sources for hydrocarbons. These should be emphasized. Possible source rocks are not even discussed-a major flaw. Ans: The information regarding source rocks is incorporated in the text. The Bikaner-Nagaur Basin is mostly a Paleozoic basin with a considerable thickness of Paleozoic sediments, overlain by a thin veneer of Tertiary/Mesozoic sediments. The Paleozoic sediments include evaporites and carbonates (Fig. 1.8). Potential source and reservoir rocks have been identified in the Paleozoic sediments. The Cenozoic sedimentation in the Bikaner-Nagaur basin began with the coal-bearing Palana Formation that was deposited during the Paleocene in subtropical swampy conditions on the continental part. Marine sedimentation indicates encroachment of the sea during the Upper Paleocene to Lower Eocene (Bhowmick

and Misra). The Huqf Super group of Oman (Saudi Arabia) which is oil producing, can be lithostratigraphically compared with the supposed time equivalent succession of the Marwar Supergroup in Bikaner-Nagaur Basin. Moreover, the equivalent formations in Bikaner-Nagaur Basin, i.e. Jodhpur sandstone and Bilara limestone formations, have also given heavy oil in Bhagewala oil well and light oil from the HEG Formation (Infracambrian in age) in well Nanuwala, Shri Gaga Nagar district, Rajasthan (Singh and Tewari 2011). Lateral facies changes from the Bilara carbonate (basin margin) to the Hanseran Evaporite Group (HEG) (basin center) of the basin are similar to the Ara Group of the South Oman Salt Basin of Oman. A similar age of the pre-sedimentary basement with the Malani volcanic suite of India dated at 750 Ma being coeval with much of the crystalline and volcanic basement dated in Oman (920-720 Ma) were observed. Possible source rocks in the basin are Karampur/Badhaura Shales, Upper Carbonate Dolomites, Bilara Shales and Dolomites. The Infracambrian anoxic conditions with super seal salt formations were ideal for preservation of rich source rocks. These thick salt formations are present from Oman (Huqf Formation) in the west, where they constitute a most prolific petroleum play, to India (Bilara-Jodhpur Formations) in the east.Upper Carbonate Dolomites, Nagaur Sandstones, Jodhpur Sandstone and Bilara Dolomites are reservoir rocks. Moderate to high basement-controlled anticlinal structures and fault closures act as traps. The petroleum play types of the Bikaner-Nagaur basin include early Cambrian transgressional fault-blocks and reactivation combined with salt swells, tertiary reactivated fault-blocks, transgression and extensional movement along the existing faults (DGH 2012).
13 36ff 46 Q. Which rocks are marine? Terrestrial or continental? Ans: Jodhpur sandstone, Bilara dolostone, Bap/Badhaura claystone are deposited by marine trasngression, whereas Palana limestone and Marh claystone are formed by marine regression (Terrestrial). This text has been now incorporated.
14 36 47 Q. Marwar Supergroup is not shown on table 1.1. Ans: Marwar Super group is inserted in Table 1.1
15 37 54 Q.We have no idea where in the basin your sampling grid is located. It should be shown as situated in the basin, and then enlarged to show the detail shown here. I would put the index map of India, the basin, and the geologic map on one page, with a box showing the location of Fig. 1.3. then having Fig. 1.3 as shown which nicely shows

your sampling grid and related geographic features. Ans: Changes have been incorporated accordingly.
16 37 54 Q. This map belongs in the Methods section where you discuss sampling, sampling frequency, etc. Ans: The map showing the sampling grid has been shifted to materials and methods chapter ( Fig. 2.1)
17 38 44 Q. Evaporite not evaporate. Ans: Necessary correction has been made.
18 39 39 Q. Would be useful to show location of Karmpur oil well on one of your maps. Ans: Location of Karmpur oil well is shown on the geological map (Fig. 1.6).
19 40 40 Q.The use of the geologic column and geologic map occurs earlier than here, thus they should be cited earlier in the text. Ans: Geologic column and geologic map have been cited earlier in the text.
20 40 42 Q. What is “foeited”? Never heard of it. Need a better term, description Ans: The term ‘foeited’ has been removed.
21 43 40 Q. Legend to geologic map should have formations as a stratigraphic column. Ans: The formations of stratigraphic column have been incorporated to the legend of geological map (Fig. 1.7).
22 43 39 Q. We have no idea where the basin margins are, nor the sampling grid in relation to this geologic map. Ans: Necessary corrections have been incorporated in Figs. 1.6, 1.7 and 2.1.
23 43 40 Q. Desperately need to show the location of Fig. 1.3 here on this map. Ans: Necessary corrections have been incorporated in Figs.1.6 and 1.7.
24 43 47 Q. What is “Baghewala II”? Not referred to or explained elsewhere. Ans: Baghewala II is oil well drilled in the basin. As per the reviewer’s correction, it is now referred in the text and the lithostratigraphy of the well is incorporated in the text. The lithostratigraphy of Bhagewala well (Fig. 1.9) indicates the presence of shales, sandstones and carbonate rocks which

would yield fair to good hydrocarbon concentrations. A 300m thick condensed Mesozoic section is encountered in the well. Therefore, it is conceived that the extensive Mesozoic sea, which was a part of Tethys covering the entire Arabian Peninsula, extended to the central part of the Bikaner–Nagaur Basin and most of the Jaisalmer basin in western Rajasthan. This succession is known to be a prolific oil producer in the Middle East. The Palaeogene sequence represents a successive transgressive unit lying over the Mesozoic with a short time of non-deposition (Danian) (Ram 2012). The crude oil of the lowermost Jodhpur Formation encountered has an API (American Petroleum Institute gravity) of 17.68. Rock-Eval data from the Hanseran Evaporite and Bilara & Jodhpur formations show Tmax values of ≤436 0C, indicating marginally mature sediments containing moderate to high TOC and with HI typical of oil-prone organic matter. The Baghewala oil is sourced from sulphur-rich organic matter in a marine carbonate source rock (Bilara limestone) where bacteria reworked the deposited algal organic matter (Peters et al. 1995).
25 45 11 Q. As defined, the terms “haloed” and “apical” are clear and objective. It is their interpretation that is question. Ans: Generally apical anomalies are considered for soil adsorbed gases. Halo anomalies are considered for microbial surveys and trace metal anomalies. Microbial anomaly is a result of growth of hydrocarbon oxidizing bacteria by the consumption of adsorbed soil gases in hydrocarbon seepage areas. Trace metal anomalies are seen by the mobility of trace metals under reducing conditions and concentration in to the anomalous areas occurs where reduced ground waters low in pH and Eh/ORP and intermingles with ground water of higher Eh/ORP and pH. The above discussion is incorporated in the text.
26 44ff 34 Q. Much of this section discusses the effectiveness of geochemical exploration techniques and its history of use-this need to be in the literature review. Ans: The discussion pertaining to effectiveness of geochemical exploration techniques has been modified and shifted to literature review.
27 46 12 Q. Unless I have missed it, primary, secondary, and tertiary migration has not be defined herein as yet. Ans: The discussion concerning primary, secondary and tertiary migration is already given in p.no.12.
28 47 51 Q. The objectives here are jumbled between describing the techniques used to assess the hydrocarbon generation potential and prediction of underlying petroleum accumulations.
Ans: The objectives of the study are rearranged.
Gas chromatographic analysis of the soil samples for adsorbed light gaseous hydrocarbons.
Predicting the source of hydrocarbons by carbon isotope studies using GC-C-IRMS (Gas Chromatograph-Combustion-Isotope Ratio Mass Spectrometer).
Employing microbiological technique for enumerating methane, ethane,propane and butane oxidizing bacteria which are indicators for presence of hydrocarbons.
Studying the geochemistry of soil (pH, Ec and ORP) to find out the relation with hydrocarbon microseepage.
Integration of geochemical data with the available geological dataof the study area to demarcate the hydrocarbon potential zones.
29 49 53 Q. Description of gas collection should precede analytical procedure for measuring types and concentration of gases. Ans: Necessary correction has been made in the text.
30 49 -- Q. You used only one method of collecting and measuring hydrocarbon gases – why? Why also all those other methods were described in the introduction when you don’t use them? Ans: My objective was to evaluate the hydrocarbon potential of the study area by determining the concentration of hydrocarbons adsorbed on to soil particles by acid extraction process. As the adsorbed soil gas method had various advantages over other methods like, it is not effected by sudden barometric pressure changes, moisture variations, sampling inconsistencies, only this single method has been employed. I thought it would be informative if I give a brief description of other sampling methods and how the hydrocarbon gases reside in soils (like free gases, adsorbed gases, pore gas).
31 54 55 Q. Repetition of steps 1 and 2 first seen on p.50. Numbering incorrect. Ans: Repeated sentences are removed and numbering is corrected.
32 55 54 Q. Need to show a drawing of your gas collection apparatus. Ans: Sketch of degassification apparatus (Fig. 2.2) has been incorporated in the text.

33 55 58 Q. Need a source citation for Fig. 2.5. Ans: Reference is incorporated in the text, as per the reviewer’s comment. Now the Figure number has been changed to Fig. 2.7. Reference: Braithwaite A., and Smith, F.J, 1985. Chromatographic methods. Fourth edition, Chapman and Hall Ltd, ISBN 0-412-26770-5, p.140.
34 61 63 Q. Need a source citation for Fig. 2.8. Ans: The reference has been incorporated. Now the Figure number has been changed to Fig. 2.10. Reference: Platzner, I. T. (1997) Modern Isotope Ratio Mass Spectrometry, John Wiley & Sons Publications, v. 145, p.20.
35 64 66 Q. I have seen δ 13C measurements of less than -100‰. Ans: The correction given below is incorporated in the text. The δ 13C1 for bacterial methane ranges from -50‰ to -120‰. Reference: Whiticar, M. J. (1996) Stable isotope geochemistry of coals, humic kerogens and related natural gases, International Journal of Coal Geology, v. 32 p. 191-215.
36 67 72 Q. What is the purpose of the mineral salts media? Please explain and reference. It is sterile? Is sterile required – why or why not? Ans: The mineral salts media (Sreenivas et al., 2005) helps or aid in the metabolic processes for the growth of bacteria. Media is sterilized, sterilization of the media ensures that no other bacteria except that in the sample are growing. In a gist, the bacteria growing during incubation, source themselves only from the sample and not from any of the ingredients used to prepare the media. Reference: Sreenivas Rao, R., Rasheed, M. A., Kalpana, G., Patil, D. J. and Kumar, B. (2005) Effect of hydrocarbons and other parameters on hydrocarbon utilizing Pichia angusta MTCC-225. Journal of Applied Biochemistry and Biotechnology, v. 126, p. 205–214.
37 67 73 Q. What is the purpose of trace element solution media? Please explain and reference. It is sterile? Is sterile required – why or why not? The elements present in trace element solution act as cofactors for enzymatic reactions and help in maintenance
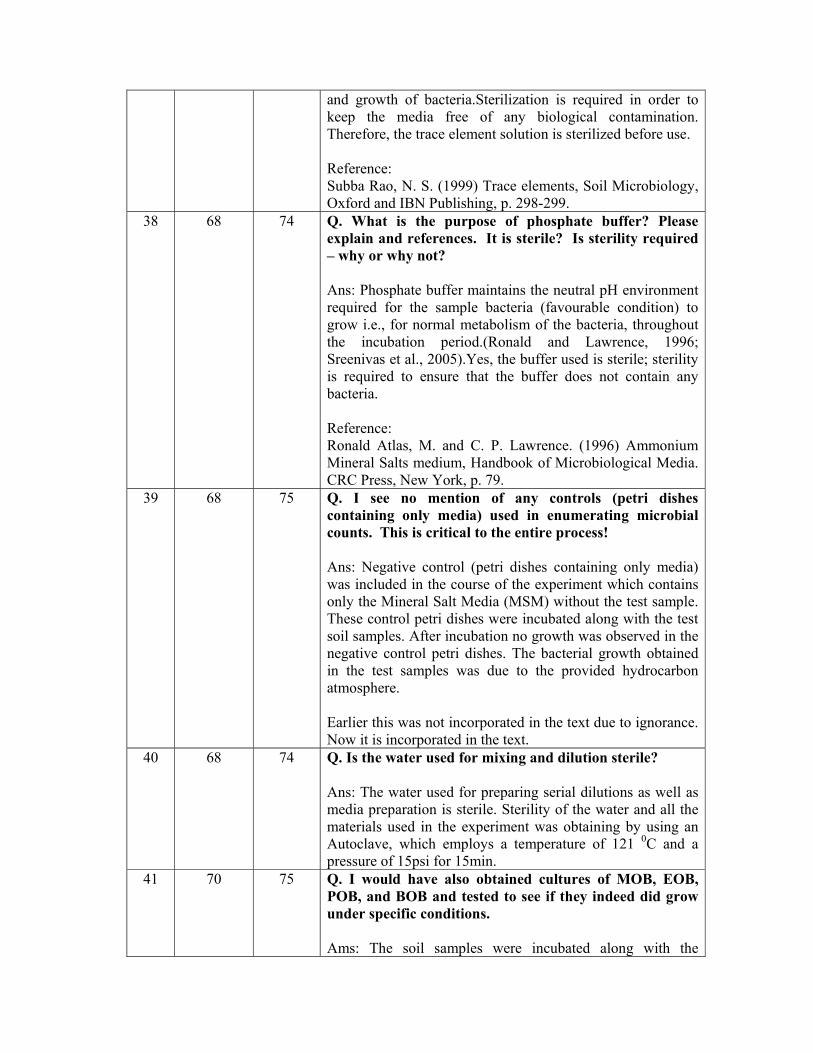
and growth of bacteria.Sterilization is required in order to keep the media free of any biological contamination. Therefore, the trace element solution is sterilized before use. Reference: Subba Rao, N. S. (1999) Trace elements, Soil Microbiology, Oxford and IBN Publishing, p. 298-299.
38 68 74 Q. What is the purpose of phosphate buffer? Please explain and references. It is sterile? Is sterility required – why or why not? Ans: Phosphate buffer maintains the neutral pH environment required for the sample bacteria (favourable condition) to grow i.e., for normal metabolism of the bacteria, throughout the incubation period.(Ronald and Lawrence, 1996; Sreenivas et al., 2005).Yes, the buffer used is sterile; sterility is required to ensure that the buffer does not contain any bacteria. Reference: Ronald Atlas, M. and C. P. Lawrence. (1996) Ammonium Mineral Salts medium, Handbook of Microbiological Media. CRC Press, New York, p. 79.
39 68 75 Q. I see no mention of any controls (petri dishes containing only media) used in enumerating microbial counts. This is critical to the entire process! Ans: Negative control (petri dishes containing only media) was included in the course of the experiment which contains only the Mineral Salt Media (MSM) without the test sample. These control petri dishes were incubated along with the test soil samples. After incubation no growth was observed in the negative control petri dishes. The bacterial growth obtained in the test samples was due to the provided hydrocarbon atmosphere. Earlier this was not incorporated in the text due to ignorance. Now it is incorporated in the text.
40 68 74 Q. Is the water used for mixing and dilution sterile? Ans: The water used for preparing serial dilutions as well as media preparation is sterile. Sterility of the water and all the materials used in the experiment was obtaining by using an Autoclave, which employs a temperature of 121 0C and a pressure of 15psi for 15min.
41 70 75 Q. I would have also obtained cultures of MOB, EOB, POB, and BOB and tested to see if they indeed did grow under specific conditions. Ams: The soil samples were incubated along with the

positive controls of known hydrocarbon oxidizing bacterial strains namely, Rhodococcus rhodochrous MTCC 291, Mycobacterium species MTCC 19, Pseudomonas species MTCC 129 and Pseudomonas indica IMT 37 were obtained from Microbial Type Culture Collection Centre and Gene Bank (MTCC), Institute of Microbial Technology, Chandigarh, India, under the required hydrocarbon atmosphere. The growth was observed in positive controls and in test samples after incubation. This indicates, methane/ethane/propane/butane oxidizing bacterial colonies developed by utilizing the given hydrocarbon gases as sole carbon source (Rasheed et al., 2008). The microbial prospecting study is based on the determination of bacterial cell concentration of hydrocarbon oxidizers in the soils. Reference: Rasheed, M. A., Prasanna, M. V., Kumar, T. S., Patil, D. J. and Dayal, A. M. (2008) Geo microbial prospecting method for hydrocarbon exploration in Vengannapalli village, Cuddapah Basin, India, Current Science, v. 95, p. 361-366. Earlier this was not incorporated in the text due to ignorance. Now it is incorporated in the text.
42 77 81 Q. Surface geochemical anomalies do not necessarily show oil and gas accumulation in the subsurface. A steady stream or rising hydrocarbons from a source rock would show surface geochemical anomalies as well. There does not have to be trap and reservoir below. Ans: In unison with the reviewer’s opinion, a steady stream or rising hydrocarbons from a source rock might show surface geochemical anomalies and there does not have to be trap and reservoir below. However, trap and reservoir are the essential components for a commercial deposit and these can be known from geological studies. As far as surface geochemical anomalies are considered, they are not employed independently for exploration needs as they suggest the presence or absence of hydrocarbons in an area. Nevertheless, they have to be integrated with geological and geophysical studies which give information about the structures and types of rocks present at depth which are suitable for hydrocarbon generation and entrapment.
43 80 183 Q. Table 3.1. Large data tables should be placed in an appendix section. There should be column headers on every page. Units should appear in column headers not only in table caption. Ans: Necessary corrections and changes have been made as per reviewer’s suggestion.
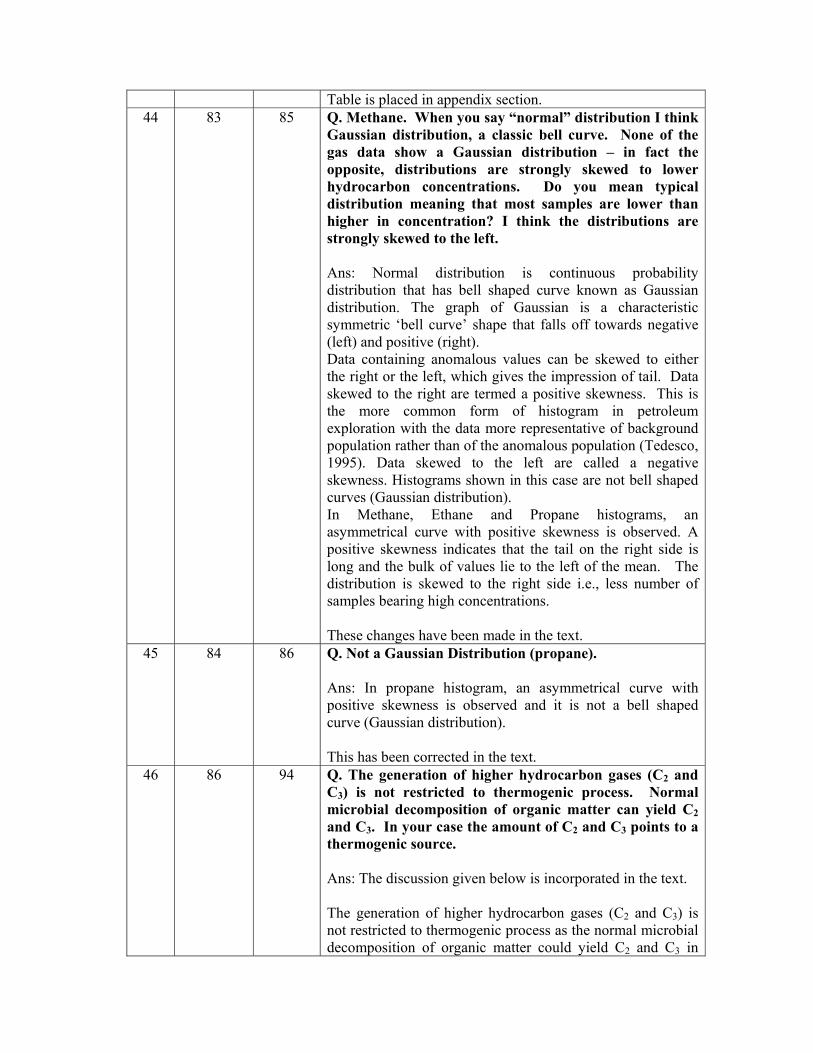
Table is placed in appendix section. 44 83 85 Q. Methane. When you say “normal” distribution I think
Gaussian distribution, a classic bell curve. None of the gas data show a Gaussian distribution – in fact the opposite, distributions are strongly skewed to lower hydrocarbon concentrations. Do you mean typical distribution meaning that most samples are lower than higher in concentration? I think the distributions are strongly skewed to the left. Ans: Normal distribution is continuous probability distribution that has bell shaped curve known as Gaussian distribution. The graph of Gaussian is a characteristic symmetric ‘bell curve’ shape that falls off towards negative (left) and positive (right). Data containing anomalous values can be skewed to either the right or the left, which gives the impression of tail. Data skewed to the right are termed a positive skewness. This is the more common form of histogram in petroleum exploration with the data more representative of background population rather than of the anomalous population (Tedesco, 1995). Data skewed to the left are called a negative skewness. Histograms shown in this case are not bell shaped curves (Gaussian distribution). In Methane, Ethane and Propane histograms, an asymmetrical curve with positive skewness is observed. A positive skewness indicates that the tail on the right side is long and the bulk of values lie to the left of the mean. The distribution is skewed to the right side i.e., less number of samples bearing high concentrations. These changes have been made in the text.
45 84 86 Q. Not a Gaussian Distribution (propane). Ans: In propane histogram, an asymmetrical curve with positive skewness is observed and it is not a bell shaped curve (Gaussian distribution). This has been corrected in the text.
46 86 94 Q. The generation of higher hydrocarbon gases (C2 and C3) is not restricted to thermogenic process. Normal microbial decomposition of organic matter can yield C2 and C3. In your case the amount of C2 and C3 points to a thermogenic source. Ans: The discussion given below is incorporated in the text. The generation of higher hydrocarbon gases (C2 and C3) is not restricted to thermogenic process as the normal microbial decomposition of organic matter could yield C2 and C3 in

small amounts. However, the carbon isotopic ratios of C2 and C3 are useful in predicting the origin of ethane and propane (Fuex, 1977) and the ratios obtained here also suggest a thermogenic source, and the higher ratios of C2 and C3 further suggests their petroliferous origin.
47 91 88 Q. The larger ratios of C2 and C3 do not necessarily indicate but rather merely suggest a thermogenic source. Preferential consumption of methane by microbes could yield anomalous ratios that are why you are using multiple indicators to assess the possibility of hydrocarbon migration. I do agree that the aggregate of your data thus far is pointing toward thermogenic processes, but it is that aggregate of indicators that enable you to make a confident interpretation. Ans: In harmony with the reviewer’s perception, the below changes are incorporated in text. The presence of a significant amount of ethane, propane, butane and pentanes “suggest” its thermogenic origin.
48 92 95 Q. I am not familiar with pixler plots so cannot assess them here. Ans: Ok.
49 93 96 Q. From the description here it is unclear how the gas anomaly values used in the anomaly map (figs. 3.15 to 3.18) were calculated. This must be made clear. Is the calculation [Gas] – [Mean gas] OR [Gas] – ([Mean gas] + [Standard deviation]) ?? Ans: The gas anomaly values used in anomaly distribution maps (Figs. 3.15 to 3.18) are calculated on the basis of [gas]-([Mean gas] + [Standard deviation]). This change is incorporated in the text.
50 95 96 Q. What is the difference between the concentration maps and anomaly distribution maps? The isopleth categories are different so that the shapes of the colour patterns of HC gases are not same. Is this due to the different contour values? Why are the contour value bins and colours different? Why didn’t you keep them identical? This must all be explained in the text – it is not. Ans: Concentration distribution maps are given in a way to show visually, the particular concentration range each of the samples in an area possesses. In these maps the classes/bin values are calculated based on mean of the obtained data and kept identical for all the classes. Contour colours are not identical in order to differentiate the concentration range of each class.

Whereas, the anomaly distribution maps show the anomalous concentrations of hydrocarbons in an area deducting the calculated background values. Here the background is calculated based on Mean plus Standard Deviation. The gas anomaly values used in anomaly maps (Figs. 3.15 to 3.18) are calculated on the basis of [gas]-([Mean gas] + [Standard deviation]). The above discussion is incorporated in the text.
51 95 97 Q. All the maps should have the sample localities shown – perhaps with an unobtrusive cross – to avoid possible misinterpretations like those discussed above (Letter D). Ans: All the sample localities have been marked in the maps.
52 103 105 Q. The linear cross plots do not indicate a cogenetic source but certainly strongly suggest one. Ans: Changes incorporated in the text.
53 103 105 Q. You missed the chance to make so bolder interpretations here because mapping the gas data show clear trends- that the combined map of the gases and ratios identify a strong hydrocarbon anomaly between Mirzawala and Hindumalkotroad with other indications of hydrocarbons near Mohanpura (C3 and C2+C3 data). Why didn’t you state this? Strong statement here would tie in to your discussion of trace element variation in the next chapter, and that of microbial abundances in the chapter after that. Ans: Changes given below are incorporated in the text. The anomaly distribution maps of light gaseous hydrocarbons and their compositional ratios identify a strong hydrocarbon anomaly between Mirzawala and Hindumalkotroad with another trend of hydrocarbon signature near Mohanpura, Chak12Q and the area south east to Kesrisinghpur.
54 105 107 Q. Line5. The compounds themselves are not specific, rather you are looking at the carbon isotopic composition of specific compounds. Ans: The changes given below are incorporated in the text. The carbon isotopic composition of methane, ethane and propane (δ13C1, δ13C2, and δ13C3) and particular molecular (C1, C2, C3 and C4) distribution patterns are employed in source identification of hydrocarbons.
55 109 111 Q. The topic of the hydrogen isotopic composition of methane and other hydrocarbons has not been outlined, yet you quote δD values in SMOW here. You do not

measure δD HC, so why you mention it here? Ans: δD values for SMOW have been removed from the text.
56 113 115 Q. Perhaps you were hampered by lack of funds, but I would have measured the carbon isotopic composition of all location east of stations formed by the line GNR-5 – GNR-50. There are clear thermogenic sources east of this area with more background area west. Do the samples east and west of this line plot differently on the cross plots? Ans: The samples were classified into two zones i.e., A and B based on the locations west and east of stations respectively, formed by the line GNR-5 and GNR-50. As per reviewer’s assumption, I could not analyse all the samples for carbon isotopic ratios, but I have added the data for another 20 samples to the existing 17 samples out of a total number of 100 samples. The changes are incorporated in the text.
57 115 188 Q. Table 4.2. No definition of ‘nd’ appearing in table. Use a footnote. Ans: nd: not detected Changes incorporated in the table.
58 123 124 Q. I am skeptical that one can identify a humic vs. saprolitic source. Look how little the δ13C HC differs. The range of variation must be wider than shown on the plots. Thus, when going to publication i would not emphasize this figure or the accompanying discussion. Ans: This figure will not be emphasized in future publication.
59 123 41 Q. Still no mention of the possible source rocks in the Stratigraphic column of this basin. Ans: The discussion about the source rocks of the study area is now incorporated in the thesis.
60 125 69 Q. Nowhere in the dissertation are the methods for measuring pH, EC and ORP described. Are these values measured in situ at the core selection sites? Measured on site from the cores after collection. Measured later in the lab? Ans: The core soil samples collected from the study area are tested later in the lab for physico-chemical parameters such as: pH, EC and ORP. An Orion 5 star Bench top meter (Thermo Electron Corporation, Germany) is used for this purpose. The sample preparation is achieved by weighing 50 g of soil sample and mixing with 50 ml of distilled water. This mixture is stirred constantly for 1 hour. This soil sample solution is measured for pH, EC and ORP (Back and Barnes,
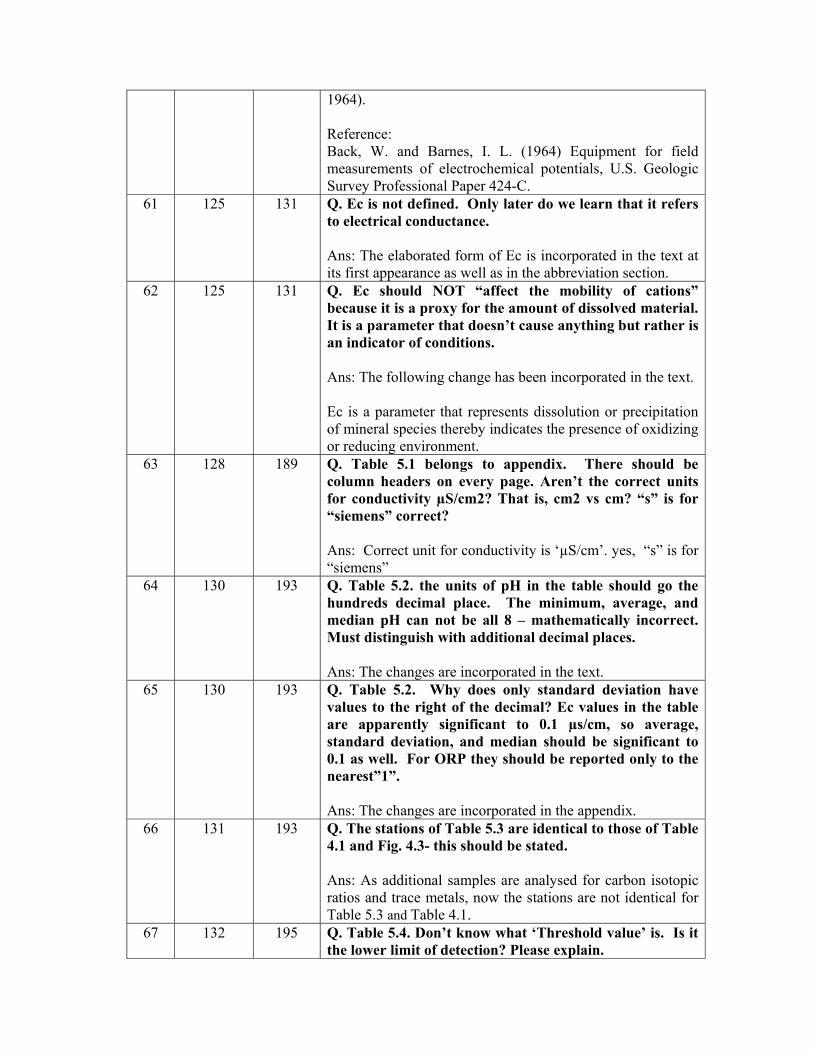
1964). Reference: Back, W. and Barnes, I. L. (1964) Equipment for field measurements of electrochemical potentials, U.S. Geologic Survey Professional Paper 424-C.
61 125 131 Q. Ec is not defined. Only later do we learn that it refers to electrical conductance. Ans: The elaborated form of Ec is incorporated in the text at its first appearance as well as in the abbreviation section.
62 125 131 Q. Ec should NOT “affect the mobility of cations” because it is a proxy for the amount of dissolved material. It is a parameter that doesn’t cause anything but rather is an indicator of conditions.
Ans: The following change has been incorporated in the text. Ec is a parameter that represents dissolution or precipitation of mineral species thereby indicates the presence of oxidizing or reducing environment.
63 128 189 Q. Table 5.1 belongs to appendix. There should be column headers on every page. Aren’t the correct units for conductivity µS/cm2? That is, cm2 vs cm? “s” is for “siemens” correct? Ans: Correct unit for conductivity is ‘µS/cm’. yes, “s” is for “siemens”
64 130 193 Q. Table 5.2. the units of pH in the table should go the hundreds decimal place. The minimum, average, and median pH can not be all 8 – mathematically incorrect. Must distinguish with additional decimal places. Ans: The changes are incorporated in the text.
65 130 193 Q. Table 5.2. Why does only standard deviation have values to the right of the decimal? Ec values in the table are apparently significant to 0.1 µs/cm, so average, standard deviation, and median should be significant to 0.1 as well. For ORP they should be reported only to the nearest”1”. Ans: The changes are incorporated in the appendix.
66 131 193 Q. The stations of Table 5.3 are identical to those of Table 4.1 and Fig. 4.3- this should be stated. Ans: As additional samples are analysed for carbon isotopic ratios and trace metals, now the stations are not identical for Table 5.3 and Table 4.1.
67 132 195 Q. Table 5.4. Don’t know what ‘Threshold value’ is. Is it the lower limit of detection? Please explain.
Ans: In this context, the term ‘threshold value’ is used to designate the average concentrations of trace metals generally found in soils. The term ‘threshold value’ is removed from the text and the term ‘average concentrations generally found in soils’ is used.
68 133 146 Q. I disagree. There is no correlation between low Ec values and high ethane concentration (or other HCs). See graph in “Notable” section, above. In fact there is little distinction or variation seen in Ec in the study area. Ans: Though there is no one to one correlation between Ec values and hydrocarbon concentrations (as mentioned in the notable flaws by the reviewer), the Ec anomalies are observed near to hydrocarbon anomalies (near Mirzawala and Mohanpura areas). Ec is a parameter that represents dissolution or precipitation of mineral species thereby indicates the presence of oxidizing or reducing environment.The hydrodynamic flow in the soil moves the solubilized elements around although they do not necessarily leave the reduced area. Cconcentration in to the anomalous areas occurs where reduced ground waters low in pH and Eh and intermingles with ground water of higher Eh and pH. The above discussion is incorporated in the text.
69 135 135 Q. Need an explicit statement or equation how anomaly values for trace metal concentrations were calculated (see comment 93) Ans: The anomaly values for trace metals are calculated on the basis of [trace metal concentration]-([Mean + Standard Deviation]). This matter is now included in the text.
70 147 96,135 Q. What is the difference between the concentration map and anomaly distribution map? It is not simply that one chart has the ethane data as well; the shapes of the colour patterns for Scandium are not the same. Is this due to the different contour values/ why are the contour value bins and colours different? Why didn’t you keep them identical? This must all be explained in the text – it is not. No need for anomaly maps-have underlying ethane isopleths. [Like those for pH, EC and ORP]. If use both map types, isopleth values for elements should be identical. Ans: Concentration distribution maps are given in a way to show visually, the particular concentration range each of the samples in an area possesses. In these maps the classes/bin values are calculated based on mean of the obtained data and

kept identical for all the classes. Contour colours are not identical in order to differentiate the concentration range of each class. Now the concentration distribution maps for trace metals have been removed from the text. Whereas, the anomaly distribution maps show the anomalous concentrations of hydrocarbons in an area deducting the calculated background values. Here the background is calculated based on Mean plus Standard Deviation. The anomaly values used in anomaly maps (Figs.5.4 to 5.10) are calculated on the basis of [Trace metal concentration]-([Mean] + [Standard deviation]). The isopleth values for C2+ hydrocarbons and trace metals are now kept identical.
71 140ff 132 Q. The map distribution of the stations with trace element data (Fig.4.3) are insufficient to draw meaningful contour maps that may have any correlation with the distribution of hydrocarbon gases. The data are insufficient to draw any conclusions. There are 100 data points for HC gases distributed rather evenly across the study area, whereas there are only 15 data points for trace elements data with poor distribution. Ans: 20 additional samples were analysed for trace metals and data is added to the existing 15 samples data. So, out of total number of 100 samples, 35 samples are analysed.
72 140ff 139 Q. The concentrations for trace elements are measured to the nearest 1 ppb, yet the isopleths are shown as fractions of a ppb. This is not valid. For example, one isopleth value is 11.1 -11.7 as should so no data because the Sc measurement is either 11 or 12 ppb. These scales are nonsense. Ans: The isopleth values are changed to the nearest 1 ppb and the maps are redrawn.
73 154 146 Q. I disagree, don’t think the distribution of trace elements is correlated with anything, yet alone HC gases. As per comment S.no. 70, the anomaly maps of the trace metals were redrawn. Ans: In the present study, there is no one to one correlationbetween C2+ hydrocarbons and trace metals, but trace metal anomalies are seen haloed to hydrocarbon anomalies indicating the effect of hydrocarbon microseepage in altering the trace element concentrations. From these anomaly maps (Figs. 5.4 to 5.10) it is observed that Sc, Cr, Ni, Zn, Cu and CO occur in high concentrations

near C2+ anomalies whereas for V there is no correlation observed with hydrocarbon concentrations. Detailed description is given in the text.
74 158 195 Q. Table 6.1. Belongs in the Appendix. There should be column headers on every page. Should report microbial counts as 103cfu/gm. Ans: Changes are incorporated and table is given in the appendix part.
75 164 154 Q. Need an explicit statement or equation how anomaly values for microbe counts were calculated (see comment 93). Ans: The anomaly values used in anomaly maps (Figs. 6.6 to 6.9) are calculated on the basis of [microbial counts]-[Mean].
76 185ff 201 Q. I did not read the reference citations. Ans: I have repeatedly gone through and also added new references according to the newly incorporated text in the thesis, as per the reviewer’s opinion.
![ARM9TDMI - atarm.com · This document is a reference manual for the ARM9TDMI microprocessor. ... • a concise explanation of your comments. ... opcode[27:25] = 0b011 and opcode](https://img.pdfslide.us/doc/110x75/5b35c6e27f8b9a6b548d913d/arm9tdmi-atarm-this-document-is-a-reference-manual-for-the-arm9tdmi-microprocessor.jpg)