Embed Size (px)
Citation preview
MATH ANXIETY, PERFORMANCE & EYE-TRACKING
Running head: MATH ANXIETY, PERFORMANCE & EYE-TRACKING
Exploring the relationship between mathematics anxiety and performance:
An eye-tracking approach
1
MATH ANXIETY, PERFORMANCE & EYE-TRACKING
Abstract
The mechanisms underpinning the relationship between math anxiety and arithmetic
performance are not fully understood. This study used an eye-tracking approach to measure a
range of eye movements of seventy-eight undergraduate students in response to performance
on an arithmetic verification task. Results demonstrated a significant positive relationship
between self-reported math anxiety and response time, indicating reduced processing
efficiency. Analysis of eye movement data reinforced the utility of an eye tracking approach
in studying arithmetic performance; specific digit fixations, dwell-time, saccades and
regressions all significantly predicted response time. Furthermore, findings highlighted
significant positive correlations between math anxiety and fixations, dwell-time and saccades.
Despite there being little evidence that eye movements mediate the math anxiety-to-
performance relationship, relationships observed between math anxiety and eye movements
provide a useful starting point for research using an eye-tracking methodology in studying
math anxiety and performance; the present findings suggest future work should focus on
calculation strategy.
Key words: math anxiety, maths anxiety, mathematics anxiety, arithmetic, eye-movement
2

MATH ANXIETY, PERFORMANCE & EYE-TRACKING
1. Introduction
Eye-movements are thought to link directly to mental operations being currently performed
(Suppes, 1990; Grant & Spivey, 2003). However, there is a paucity of research that has used
eye-tracking as a tool for investigating the cognitive processes involved in mental arithmetic.
The few studies that have been conducted have provided strong evidence to support its utility
(e.g., De Corte, Verschaffel, & Pauwels, 1990; Hegarty, Mayer, & Monk, 1995). In
particular, Green, Lemaire and Dufau (2007) provide convincing evidence to support the
correlation between eye movements and strategies used in solving complex addition
problems; for example, eye fixations were longer on arithmetic tasks that involved a carry
operation compared to those without a carry operation. Moreover, the timing of fixations on
specific digits was consistent with the calculation strategy adopted; for example, cumulative
fixation durations in the first second of each trial were longer on unit digits when participants
used a unit strategy, i.e. began the calculation process by adding the unit digits. Eye-tracking
studies have also demonstrated links between attentional bias and eye-movement in relation
to anxiety-provoking stimuli (e.g., Hermans, Vansteenwegen, & Eelen, 1999; Rinck &
Becker, 2006). In an investigation of anxiety effects on inhibition processes, Derakshan,
Ansari, Hansard, Shoker and Eysenck (2009) used an anti-saccade task and found that high
trait anxious individuals took significantly longer to make an eye movement in the correct
direction after a cue and prior to a target, i.e. a decrease in processing efficiency, but made no
more errors than low anxious individuals, i.e. no effect on performance effectiveness. In a
second experiment they found that processing efficiency was reduced, i.e. eye movements
were longer, when the cue was threatening rather than positive or neutral. Together, the
results lend support to the argument that anxious individuals take longer to make attentional
shifts, thus placing extra demands on the executive component of the working memory
system. The results also provide further evidence to suggest that anxiety has a detrimental
3
MATH ANXIETY, PERFORMANCE & EYE-TRACKING
impact upon processing efficiency over performance effectiveness, supporting the
assumptions of processing efficiency theory (Eysenck & Calvo, 1992) and attentional control
theory (Eysenck, Derakshan, Santos & Calvo, 2007).
Attentional control theory assumes that anxiety is more likely to detrimentally affect
performance when tasks involve the inhibition and shifting functions of the central executive.
This alters the balance so that the stimulus-driven system dominates the goal-directed system,
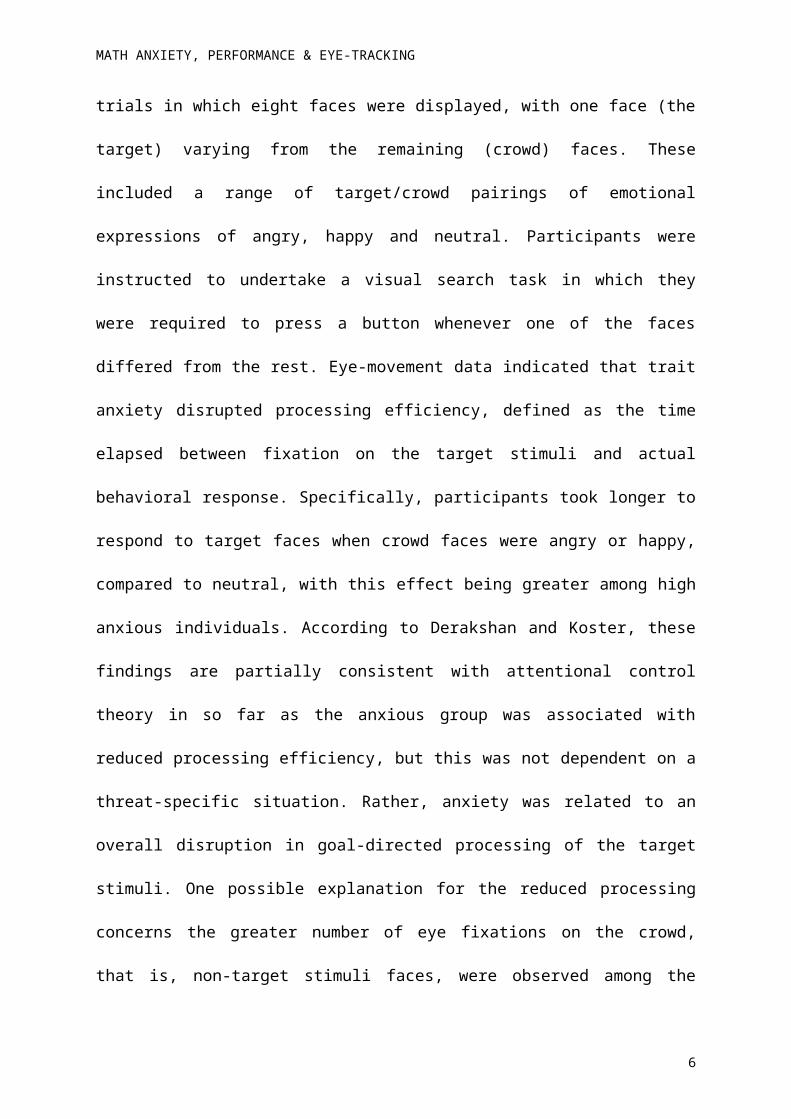
thus reducing attentional control. To test aspects of this theory, Derakshan and Koster (2010)
presented participants with a series of trials in which eight faces were displayed, with one
face (the target) varying from the remaining (crowd) faces. These included a range of
target/crowd pairings of emotional expressions of angry, happy and neutral. Participants were
instructed to undertake a visual search task in which they were required to press a button
whenever one of the faces differed from the rest. Eye-movement data indicated that trait
anxiety disrupted processing efficiency, defined as the time elapsed between fixation on the
target stimuli and actual behavioral response. Specifically, participants took longer to respond
to target faces when crowd faces were angry or happy, compared to neutral, with this effect
being greater among high anxious individuals. According to Derakshan and Koster, these
findings are partially consistent with attentional control theory in so far as the anxious group
was associated with reduced processing efficiency, but this was not dependent on a threat-
specific situation. Rather, anxiety was related to an overall disruption in goal-directed
processing of the target stimuli. One possible explanation for the reduced processing
concerns the greater number of eye fixations on the crowd, that is, non-target stimuli faces,
were observed among the high anxious group after the target stimuli had been detected.
Derakshan and Koster’s findings suggest that emotional information reduces processing
efficiency, and further highlights the usefulness of an eye-tracking methodology in the study
of anxiety and attentional control. In partial support of this, Calvo and Avero (2002) provided
4
MATH ANXIETY, PERFORMANCE & EYE-TRACKING
evidence that high trait anxious individuals made more regressive eye movements on trials
involving threatening (word) events in comparison to neutral events. Indeed, in proposing
attentional control theory, Eysenck et al. (2007) note how studies of anxiety and reading tasks
have shown that anxiety is related to an increase in regressive eye movements (looking back
over text) as a compensatory strategy for reduced processing efficiency, i.e. it is assumed that
such regressions assist in the integration of prior and current text information. However, it
remains to be seen whether such effects generalise to different forms of stimuli, such as
numerical stimuli, and other forms of anxiety, such as math anxiety.
Math anxiety has been described as “feelings of tension and anxiety that interfere with
the manipulation of numbers and the solving of mathematical problems in a wide variety of
ordinary life and academic situations” (Richardson & Suinn, 1972, p.551). Early research
suggests that math anxiety can exist even in those who are otherwise academically successful
(Dreger & Aitken, 1957; Gough, 1954), and meta-analyses have demonstrated a negative
relationship exists between math anxiety and math performance among undergraduates
(Hembree, 1990) and children (Ma, 1999). Further, research has demonstrated that math
anxiety is more negatively related to performance on complex, compared to simple,
arithmetic (e.g. Ashcraft & Faust, 1994), and particularly on those problems that place greater
demands on working memory by requiring a carry operation (Faust, Ashcraft & Fleck, 1996).
Indeed, math anxiety was more strongly related to performance when arithmetic was
performed in a dual task situation, in which working memory demands were increased
(Ashcraft & Kirk, 2001). As Ashcraft (2002) notes, activity in working memory is
compromised by math anxiety, and such an “affective drop” in performance may be due to
reduced processing efficiency; that is, high math anxious individuals may attend to intrusive
thoughts or worries rather than the task at hand.
5
MATH ANXIETY, PERFORMANCE & EYE-TRACKING
The current study aims to investigate the relationship between math anxiety and
performance by employing an eye-tracking methodology to provide insights into
underpinning cognitive processes. It is hypothesised that math anxiety will be more strongly
related to processing efficiency than performance effectiveness. This will be in the form of a
positive relationship between math anxiety and response time to arithmetic problems, with
the expectation that this relationship is greater in response to problems involving a carry
operation compared to those that do not. The following hypotheses are proposed. It is
predicted that math anxiety will be related to a greater time spent fixated on those
components of an arithmetic problem that are not indicative of a goal-directed approach to
arithmetic problem solving. Specifically, in a two-digit addend verification task, increased
dwell time on tens digits, as opposed to the unit digits, is likely to represent inefficient
processing. That is, an efficient strategy would be to compare the sum of the units to the
proposed solution and then to terminate the calculation process if the sum fails to match the
unit value in the proposed solution. Thus, based on a stimulus-driven response, math anxiety
will be related to greater dwell time and number of fixations on the tens digits of a proposed
problem as a result of reduced attentional control needed to proceed with an efficient
calculation process. As a further contribution to reduced processing efficiency, it is predicted
that math anxiety will be positively related to the number of saccades made across arithmetic
problems. Consistent with Eysenck et al.’s (2007) reports that high anxious individuals
expend greater effort on reading tasks, using the compensatory strategy of regression, it is
also predicted that math anxious individuals will display similar behavior, resulting in a
larger number of movements between the proposed solution and the digits that form the
proposed problem. Analyses will test whether the relationship between math anxiety and
performance is mediated by these eye-movement measures.
6
MATH ANXIETY, PERFORMANCE & EYE-TRACKING
2. Method
2.1 Participants
Participants were 78 (59 females, 19 males) undergraduate psychology students from two
universities in the Midlands, U.K. Ages ranged from 18 to 52 years (mean = 23.82; SD =
8.02). Participants took part in exchange for undergraduate research scheme vouchers and
were recruited via advertising at the universities.
2.2 Questionnaire measures
The 23-item Mathematics Anxiety Scale-U.K. (MAS-U.K., Hunt, Clark-Carter & Sheffield,
2011) was used to measure self-reported math anxiety. The MAS-U.K requires participants to
respond, on a five-point Likert-type scale, how anxious they would feel in a range of specific
situations involving math. The scale has been shown to have excellent internal reliability
(Cronbach’s alpha = .96) and test-retest reliability over a 4-10 week period (r = .89), and is
suitable for an adult population.
2.3 Experimental design and stimuli
Using Experiment Builder software (SR Research Ltd., Mississauga, Ont., Canada), 80 two-
digit addition problems, for example ‘23 + 29 = 52’, were presented as part of a verification
task. Fourty of these problems had a solution that was true, with the remaining 40 having a
solution that was false. Half of all problems involved a carry operation and half did not.
Addends were randomly taken from a range of 10-89 and problem-size was counterbalanced
across all trials so that performance could be attributed to factors other than the size of the
problems. Problems where both addends ended in zero decades, for example ‘20 + 30’, or
fives, for example ‘25 + 35’, were not included. False problems were divided approximately
equally with splits of +/- 1, +/- 3, and +/- 5, counterbalanced by number of positive and
7
MATH ANXIETY, PERFORMANCE & EYE-TRACKING
negative splits. A list of potential calculation strategies was provided to the side of the VDU,
for participants to verbally report after each trial an associated code pertaining to the strategy
they used; however, these data were recorded for exploratory purposes and findings are not
reported here.
2.4 Eye-tracking device
An Eyelink II eye-tracking device (SR Research Ltd., Mississauga, Ont., Canada) was used.
The sampling rate was 500-Hz, with spatial accuracy under 0.5° and a 0.01° resolution in the
pupil tracking mode. The Eyelink II device is a head-mounted eye-tracker and has +/- 30°
display allowable head movement.
2.5 Procedure
Prior to the arithmetic task, participants were required to complete the MAS-U.K. Calibration
and validation set-up of the eye-tracking device then took place using a series of on-screen
targets. The participant’s dominant eye was selected for recording.
Stimuli were presented in the centre of a VDU, in Courier New size 30 bold font at an
approximate viewing distance of 60cm. Following the on-screen instructions and two practice
trials, participants were asked to respond ‘true’ or ‘false’ to the proposed answers to the
remaining experimental trials. This was achieved by pressing the corresponding buttons on a
Microsoft SideWinder Game Pad. There was no time limit for participants to respond. After
responding, a pause screen, consisting of ‘+++++’, appeared, and this remained until
participants pressed one of the keys to proceed to the next trial. A central fixation point was
presented prior to the onset of each trial.
8
MATH ANXIETY, PERFORMANCE & EYE-TRACKING
2.6 Eye-movement data
Interest areas of 150 pixels/3.97cm high and 50 pixels/1.32cm wide were manually created
around each of the digits in each trial. Interest area reports were generated to obtain data on
dwell time, fixations, and regressions from the solution. A separate trial and saccade report
generated data pertaining to number of saccades produced on each trial, along with response
time and error rate. Manual group drift correction of fixations was conducted where obvious
drift remained unadjusted per trial.
3. Results
3.1 Data screening
Visual inspection of histograms of the data showed the data to be sufficiently univariately
normally distributed. For each regression, normality of standardised residuals was tested by
visual inspection of histograms; these were found to be normal. Standardised residuals and
standardised predicted values were also plotted against each and no obvious curvilinear
relationships were apparent, with the display also indicating the presence of
homoscedasticity. Checks for bivariate outliers were also made using scattergraphs and no
outliers were identified. In order to test for multivariate outliers Cook’s distance and leverage
values were plotted against each other and no cases appeared to obviously deviate from the
main cluster of cases. In addition, checks of tolerance values indicated that there were no
problems with multicollinearity among the data. All response time analyses are based on
correct responses only. Across all problem types, no significant effect of gender was
observed (all p > .1). Also, there was no significant difference between males and females on
self-reported maths anxiety, r(76) = .13, p = .26; the small effect size is consistent with
previous findings based on a larger U.K undergraduate population (Hunt et al., 2011).
9
MATH ANXIETY, PERFORMANCE & EYE-TRACKING
3.2 Problem type analysis
3.2.1 Response times
Means and standard deviations of response times are displayed in Table 1. Within-subjects t-
tests were used to compare response times to different types of problem. Participants took
significantly longer to respond to carry problems compared to no-carry problems, t(77) =
10.95, p < .001, two-tailed test, d = 0.70. However, there was no significant difference in the
response times to true problems compared to false problems, t(77) = 1.68, p = .097, two-
tailed test, d = 0.10. Participants took significantly longer to respond to true carry problems
compared to true no-carry problems, t(77) = 11.94, p < .001, two-tailed test, d = 0.94. Also,
response time to false carry problems was significantly greater than for false no-carry
problems, t(77) = 7.91, p < .001, two-tailed test, d = 0.45.
3.2.2 Percentage of errors
Within-subjects t-tests were used to compare percentage of errors between problem types (see
Table 1 for means and standard deviations). Percentage of errors was significantly greater for
carry problems compared to no-carry problems, t(77) =2.76, p = .007, two-tailed test, d =
0.37. Also, percentage of errors was significantly greater for true problems compared to false
problems, t(77) =2.77, p = .007, two-tailed test, d = 0.40. In addition, percentage of errors
was significantly greater in response to true carry problems compared to true no-carry
problems, t(77) =3.25, p = .002, two-tailed test, d = 0.42. However, there was no significant
difference in percentage of errors made in response to false carry problems compared to false
no-carry problems, t(77) = 0.66, p = .51, two-tailed test, d = 0.08.
[Insert Table 1 about here]
10

MATH ANXIETY, PERFORMANCE & EYE-TRACKING
3.3 Math anxiety and problem type analysis
The overall sample mean for math anxiety was 48.42, with a standard deviation of 13.97. As
shown in Table 2, no significant correlations were found between math anxiety and
percentage of errors on any of the problem types, with the maximum correlation (r) being -
0.12, which is a small effect according to Cohen’s (1988) guidelines. Conversely, math
anxiety was related to response time, with significant positive correlations across all problem
types. As Table 2 shows, effect sizes for the math anxiety and response time correlations
varied little across problem types, ranging from r = 0.35 to r = 0.45, which represent
medium-to-large effects, according to Cohen’s (1988) guidelines.
[Insert Table 2 about here]
3.4 Eye-movement and math anxiety
As shown in Table 3, math anxiety was significantly positively correlated with number of
fixations on first, second and third digits when problems involved a carry term, and on the
first and fourth digits when problems did not involve a carry term. Fixations on the first digit
produced the strongest correlation with math anxiety. A broadly similar pattern was observed
for dwell time, with math anxiety being significantly positively correlated with dwell time on
first, second and fourth digits when problems involved a carry term, and on the first, third and
fourth digits on no-carry problems. No significant correlations were observed between math
anxiety and number of regressions from the proposed solution, although significant positive
correlations were found between math anxiety and total number of saccades on carry and no-
carry problems.
[Insert Table 3 about here]
11

MATH ANXIETY, PERFORMANCE & EYE-TRACKING
3.5 Eye-movement, math anxiety and performance
Based on the finding that there was very little correlation between math anxiety and error
rates across all problem types, the subsequent analyses were based on response times only.
Also, t-tests demonstrated no significant difference between correlations across true and false
carry, t(75) = 1.31, p = .19, and no-carry, t(75) = 0.18, p = .86, problems. As false problems
were included to facilitate the utility of the verification task, the following analyses are based
on responses to true problems only. In order to test the extent to which eye-movements and
math anxiety predict response times, a series of hierarchical multiple linear regression
analyses were conducted in which arithmetic response times were regressed onto math
anxiety in the first step, specific eye-movement measures in the second step. This was done
separately for each digit presented.
As shown in Table 4, in step one, math anxiety accounted for 17% and 19% of the
variance in response time to carry and no-carry problems, respectively. In the second step,
fixations and dwell time, with the exception of the first digit, significantly and strongly
predicted response time to both carry and no-carry problems, with response time increasing
with number of fixations and dwell time. Further, total saccades were a strong and significant
predictor of response time. Eye regressions from the proposed solution were significantly
positively related only to response time on problems that involved a carry term. Fixations,
total dwell time and total saccades across all digits together accounted for a considerable
amount of additional variance in response times (range 50% to 67%). Number of regressions
from the proposed solution accounted for a significant unique proportion of variance (11%)
in response time to carry problems but not no-carry problems (2%). Math anxiety remained a
significant independent predictor of response time in all analyses.
[Insert Table 4 about here]
12

MATH ANXIETY, PERFORMANCE & EYE-TRACKING
4. Discussion
The main focus of the current study was to investigate the extent to which eye-movement
data might explain the relationship between math anxiety and performance. Performance data
indicated that math anxiety was not correlated with error rates on two-digit addition
problems, but it was significantly positively correlated with response time. This supports the
hypothesis that math anxiety is related to processing efficiency over performance
effectiveness and, therefore, supports the corresponding assumption proposed by attentional
control theory (Eysenck et al., 2007). According to the theory, anxiety may lead to stimulus-
driven task performance and lead to poor performance. In the context of a two-digit addend
verification task, an inefficient strategy would involve attending to those components of the
problem that are not required for an immediate termination of the calculation process. That is,
it is possible to focus attention on the unit digits in order to verify the accuracy of the unit
presented in the proposed solution, so attending to the tens digits would lead to greater
processing time and consequently greater response time, thus representing an inefficient
strategy. In contrast, a goal-directed approach is more likely to lead to more efficient task
processing and consequently better task performance. The current results found that the
relationships between math anxiety and fixations and dwell time on first digits were stronger
than relationships involving other digits consistent with a stimulus-driven approach to
processing. These findings provide some support that the assumptions of attentional control
theory can be extended to math anxiety. However, regression analyses demonstrated that
math anxiety remained a significant predictor of response time after controlling for eye-
movement measures, suggesting that eye movement and math anxiety are independent
predictors of arithmetic performance.
The number of regressive eye movements was positively related to response time on
problems involving a carry term, but was not related to math anxiety. According to
13
MATH ANXIETY, PERFORMANCE & EYE-TRACKING
attentional control theory (Eysenck et al., 2007) regression across stimuli represents a
compensatory strategy based on the greater expenditure in effort seen among those who are
highly anxious, and research has demonstrated an effect of anxiety on regressive eye
movements to threat-related stimuli (Calvo & Avero, 2002). Here it was hypothesised that the
relationship between math anxiety and response time may be explained by an increase in the
number of regressions made. However, our findings did not support this. Thus, the results
reported here provide little support for the idea that attentional control accounts for math
anxiety effects on arithmetic task performance. Specifically, eye movement does not appear
to mediate the relationship between math anxiety and response time. In contrast to the
prediction that the relationship between response time and math anxiety would be strongest in
relation to problems involving a carry operation, there was very little difference in this
relationship between carry and no-carry problems, particularly for true carry (r = .42) and
true no-carry (r = .43) problems. Accordingly, it is conceivable that math anxiety is related to
a more general processing inefficiency. Support for this notion is provided by the significant
positive correlation between math anxiety and total saccades; an r of .34 on both carry and
no-carry problems. Despite the absence of mediation, math anxiety was positively correlated
with a number of eye movement measures, providing grounds for further research that
examines math anxiety and approaches to arithmetic.
Typically, previous eye-tracking studies investigating anxiety and attentional control
processes have measured saccades via pro-saccade or anti-saccade tasks. For example, earlier
studies have presented stimuli that have immediate relevance to anxious individuals, such as
images of spiders (Hermans et al., 1999) or angry faces (Derakshan & Koster, 2010). A
mental arithmetic task, on the other hand, may not produce the same prepotent reflexive
saccades, as more than presentation of a threatening stimuli is involved; participants are
asked to problem solve and this may account for the absence of mediation observed in the
14
MATH ANXIETY, PERFORMANCE & EYE-TRACKING
current study. Therefore, alternative experimental paradigms may be needed to assess
inhibition and attention control processes in relation to math anxiety.
Despite the lack of evidence to explain the relationship between math anxiety and
response time to arithmetic problems, the current findings still provide strong support for the
utility of an eye-tracking methodology in the study of mental arithmetic. In particular, several
eye-movement measures, including saccades, fixations, dwell time, and regressions, were all
significantly positively correlated with response time. This suggests that such measures may,
at least in part, provide explanations for reduced efficiency in processing. Also, the present
study observed a moderately strong correlation between math anxiety and total saccades in
arithmetic problem solving, thus indicating a general disruption of processing efficiency. This
could be investigated further to explore the mechanisms underlying the relationship between
math anxiety and performance.
15

MATH ANXIETY, PERFORMANCE & EYE-TRACKING
5. References
Ashcraft, M. H. (2002). Math Anxiety: Personal, Educational, and Cognitive Consequences.
Current Directions in Psychological Science, 11, 181–185.
Ashcraft, M. H., & Faust, M. W. (1994). Mathematics anxiety and mental arithmetic
performance: An exploratory investigation. Cognition and Emotion, 8, 97–125.
Ashcraft, M. H., & Kirk, E. P. (2001). The relationships among working memory, math
anxiety, and performance. Journal of Experimental Psychology – General, 130, 224–
237.
Calvo, M. G., & Avero, P. (2002). Eye movement assessment of emotional processing in
anxiety. Emotion, 2, 105-117.
Cohen, J. (1988). Statistical power analysis for the behavioral sciences (2nd Edn.). Hillsdale,
New Jersey: Lawrence Erlbaum Associates.
De Corte, E., Verschaffel, L., & Pauwels, A. (1990). Influence of the semantic structure of
word problems on second graders’ eye movements. Journal of Educational
Psychology, 82, 359-365.
Derakshan, N., & Koster, E. H. W. (2010). Processing efficiency in anxiety: Evidence from
eye-movements during visual search. Behaviour Research and Therapy, 48, 1180-
1185.
Derakshan, N., Ansari, T. L., Hansard, M., Shoker, L., & Eysenck, M. W. (2009). Anxiety,
inhibition, efficiency, and effectiveness: An investigation using the antisaccade task.
Experimental Psychology, 56, 48-55.
16

MATH ANXIETY, PERFORMANCE & EYE-TRACKING
Dreger, R. M., & Aiken, L. R. (1957). The identification of number anxiety in a college
population. Journal of Educational Psychology, 48, 344-351.
Eysenck, M. E., Derakshan, N., Santos, R., & Calvo, M. G. (2007). Anxiety and cognitive
performance: Attentional control theory. Emotion, 7, 336-353
Eysenck, M. W., & Calvo, M. G. (1992). Anxiety and performance: The processing
efficiency theory. Cognition and Emotion, 6, 409–434.
Faust, M. W., Ashcraft, M. H., & Fleck, D. E. (1996). Mathematics anxiety effects in simple
and complex addition. Mathematical Cognition, 2, 25–62.
Gough, M. F. (1954). Mathemaphobia: Causes and treatments. Clearing House, 28, 290-294.
Grant, E. R., & Spivey, M. J. (2003). Eye movements and problem solving: Guiding attention
guides thought. Psychological Science, 14, 462-466.
Green, H. J., Lemaire, P., & Dufau, S. (2007). Eye movement correlates of younger and older
adults’ strategies for complex addition. Acta Psychologica, 125, 257-278.
Hegarty, M., Mayer, R. E., & Monk, C. A. (1995). Comprehension of arithmetic word
problems: A comparison of successful and unsuccessful problem solvers. Journal of
Educational Psychology, 87, 18-32.
Hembree, R. (1990). The nature, effects, and relief of mathematics anxiety. Journal of
Research for Mathematics Education, 21, 33-46.
Hermans, D., Vansteenwegen, D., & Eelen, P. (1999). Eye movement registration as a
continuous index of attention deployment: Data from a group of spider anxious
students. Cognition and Emotion, 13, 419-434.
17

MATH ANXIETY, PERFORMANCE & EYE-TRACKING
Hunt, T. E., Clark-Carter, D., & Sheffield, D. (2011). The development and part-validation of
a U.K. scale for mathematics anxiety. Journal of Psychoeducational Assessment, 29,
455-466.
Ma, X. (1999). A meta-analysis of the relationship between anxiety toward mathematics and
achievement in mathematics. Journal for Research in Mathematics Education, 30,
520-540
Rinck, M., & Becker, E. S. (2006). Spider fearful individuals attend to threat, then quickly
avoid it: Evidence from eye movements. Journal of Abnormal Psychology, 115, 231-
238.
Suppes, P. (1990). Eye-movement models for arithmetic and reading performance. Reviews
of Oculomotor Research, 4, 455-457.
18

MATH ANXIETY, PERFORMANCE & EYE-TRACKING
Carry No-Carry Total
Problem
type
True Errors 7.11 (8.08)
5493.02 (2034.64)
4.30 (5.08)
3921.56 (1196.20)
5.71 (4.55)
4689.91 (1552.59)Time
False Errors 3.91 (5.26)
4959.03 (2235.42)
3.46 (5.66)
4083.82 (1632.58)
3.69 (5.55)
4519.30 (1890.71)Time
Total Errors 5.51 (5.41)
5217.07 (2067.39)
3.88 (3.90)
3999.56 (1359.55)Time
Table 1. Mean (standard deviation) of errors (%) and response time (ms) between problem types
19
MATH ANXIETY, PERFORMANCE & EYE-TRACKING
Performance measure
% errors RT (ms)
Problem
type
Carry -0.05 .38***
No-Carry -0.02 .45***
True -0.05 .43***
False -0.01 .40***
True Carry 0.01 .42***
True No-Carry -0.12 .43***
False Carry -0.10 .35**
False No-Carry 0.08 .44***
** p ≤ .01 *** p ≤ .001
Table 2. Pearson’s r correlations (df = 76) between maths anxiety and percentage of errors and response time (ms) across problem types.
20

MATH ANXIETY, PERFORMANCE & EYE-TRACKING
Eye-movement measure
Digit Problem type
Carry No-carry
Fixations First .41*** .37***
Second .22* .20
Third .23* .19
Fourth .15 .23*
Dwell time First .34** .32**
Second .24* .21
Third .21 .25*
Fourth .25* .32**
Regressions Solution -.05 -.10
Saccades N/A .34** .34**
* p ≤ .05 ** p ≤ .01 *** p ≤ .001
Table 3. Pearson’s r correlations (df = 76) between maths anxiety and eye-movement on carry (and no-carry) true problems
21
MATH ANXIETY, PERFORMANCE & EYE-TRACKING
TaskCarry problems No-carry problems
Eye-movement measure included in step 2
Step Variables Entered
Beta R2
changeModel R2
Beta R2
changeModel R2
Fixations 1 Maths anxiety .42*** .17*** .43*** .19***
2 Maths anxiety .23*** .59*** .75*** .20** .50*** .68***First digit -.003 .15Second digit .30*** .23*Third digit .39*** .36***Fourth digit .25*** .26** .19***
Dwell time 1 Maths anxiety .42*** .17*** .43*** .19***
2 Maths anxiety .15** .65*** .83*** .12* .62*** .81***First digit .11 .22***Second digit .34*** .33***Third digit .36*** .33***Fourth digit .31*** .27***
Saccades 1 Maths anxiety .42*** .17*** .43*** .19***
2 Maths anxiety .12* .67*** .84*** .15** .61*** .79***Saccades .87*** .83***
Regressions 1 Maths anxiety .42*** .17*** .43*** .19***
2 Maths anxiety .43*** .11*** .28*** .45*** .02 .21***Regressions .32*** .14
* p ≤ .05 ** p ≤ .01 *** p ≤ .001
Table 4. Regression of response time to true carry and no-carry problems on maths anxiety, fixations, dwell-time, total saccades and no. of regressions from proposed solution.
22