Embed Size (px)
Citation preview
DI
SC
US
SI
ON
P
AP
ER
S
ER
IE
S
Forschungsinstitut zur Zukunft der ArbeitInstitute for the Study of Labor
Explaining the Birth Order Effect: The Role of Prenatal and Early Childhood Investments
IZA DP No. 6755
July 2012
Jee-Yeon K. LehmannAna Nuevo-ChiqueroMarian Vidal-Fernández
Explaining the Birth Order Effect:
The Role of Prenatal and Early Childhood Investments
Jee-Yeon K. Lehmann University of Houston
Ana Nuevo-Chiquero
IEB, Universitat de Barcelona
Marian Vidal-Fernández University of New South Wales
and IZA
Discussion Paper No. 6755 July 2012
IZA
P.O. Box 7240 53072 Bonn
Germany
Phone: +49-228-3894-0 Fax: +49-228-3894-180
E-mail: [email protected]
Any opinions expressed here are those of the author(s) and not those of IZA. Research published in this series may include views on policy, but the institute itself takes no institutional policy positions. The Institute for the Study of Labor (IZA) in Bonn is a local and virtual international research center and a place of communication between science, politics and business. IZA is an independent nonprofit organization supported by Deutsche Post Foundation. The center is associated with the University of Bonn and offers a stimulating research environment through its international network, workshops and conferences, data service, project support, research visits and doctoral program. IZA engages in (i) original and internationally competitive research in all fields of labor economics, (ii) development of policy concepts, and (iii) dissemination of research results and concepts to the interested public. IZA Discussion Papers often represent preliminary work and are circulated to encourage discussion. Citation of such a paper should account for its provisional character. A revised version may be available directly from the author.

IZA Discussion Paper No. 6755 July 2012
ABSTRACT
Explaining the Birth Order Effect: The Role of Prenatal and Early Childhood Investments *
The critical role of prenatal and early childhood conditions on adult outcomes has been the focus of a rich body of research. In this paper, we examine various pre- and postnatal investments as possible sources behind the “birth order effect” – significant differences in the educational and labor market outcomes across children of varying birth orders. Taking advantage of a rich set of information on in utero and early childhood conditions in the Children of the NLSY79, we find that, within the same household, siblings of higher birth order experience a lower reduction in cigarette usage during pregnancy, are breastfed less often, and experience less cognitive stimulation and emotional support at ages 0 to 1. Next, we test for the presence of birth order effects in early cognitive and non-cognitive test scores and examine whether these differences can be explained by variations in prenatal and early childhood investments. Although there exists a significant negative relationship between birth order and early cognitive/non-cognitive test scores, the size and the significance of the negative birth order effects in test scores and educational attainment are robust to controlling for variations in early childhood factors. JEL Classification: J10, J13, I24 Keywords: birth order, early test scores, parental investment, prenatal investment,
postnatal investment, early childhood investment, fetal origins hypothesis, cognitive outcomes, non-cognitive outcomes
Corresponding author: Marian Vidal-Fernández School of Economics Australian School of Business University of New South Wales Kensington, 2052, NSW Australia E-mail: [email protected]
* We are grateful to Andy Zuppann and Chinhui Juhn for their helpful comments and suggestions. Any remaining errors are our own.
Birth Order & Early Investments Lehmann, Nuevo-Chiquero, and Vidal-Fernandez
1 Introduction
The critical role of prenatal and early childhood conditions on child and adult outcomes has
been the focus of a rich body of recent research. The literature provides increasing empirical
support for the idea that in utero and early childhood investments can greatly shape a
person’s future educational and labor market outcomes. First, the “fetal origins” or the “fetal
programming” hypothesis as proposed by Barker (1990) suggests that inadequate nutrition or
exposure to harmful chemicals or conditions in utero “programs” the fetus to have persistent
and latent metabolic or biological characteristics that can lead to future health problems and,
in turn, worse educational and labor market outcomes. Reviews of the fetal origins literature
by Gluckman and Hanson (2005), Heckman (2007), and Almond and Currie (2010) cite a
number of key studies in medicine and economics that find fetal and maternal nutrition,
birthweight, fetal exposure to toxins, alcohol, and smoking, and infant development in the
first year are all significant predictors of adult health, educational, labor market outcomes.
Second, a growing strand of economic research demonstrates that the child’s first few years of
development are especially critical determinants of adolescent and adult cognitive and non-
cognitive outcomes, which are predictive of educational attainment and earnings (Knudsen,
Heckman, Cameron and Shonkoff 2006, Cunha and Heckman 2007, Heckman, Stixrud and
Urzua 2006, Heckman and Masterov 2007).
Motivated by the strong evidence on the importance of in utero and early childhood con-
ditions on later outcomes, we examine prenatal and early childhood environment as a possible
explanation for the so-called “birth order effect” – significant differences in educational and
labor market outcomes across children of varying birth order in observably similar house-
holds or among siblings within the same household. Although several studies have found a
significantly negative relationship between birth order and educational attainment (Behrman
and Taubman 1986, Booth and Kee 2009, Kantarevic and Mechoulan 2006), IQ (Black, De-
vereux and Salvanes 2007a), and adult earnings (Behrman and Taubman 1986, Kantarevic
2
Birth Order & Early Investments Lehmann, Nuevo-Chiquero, and Vidal-Fernandez
and Mechoulan 2006)1, studies examining the possible causes of birth order effects have been
quite limited. Price (2008) and Monfardini and See (2011) investigate the role of parental
time investment and find that although parents do spend less quality time with children
of higher birth order, the effect remains negative and significant even when controlling for
parental time investment. Similarly, the negative relationship between IQ and birth order
found in Black et al. (2007a) is robust to controlling for several birth endowments such as
birthweight, gestation period, and head size.
In this paper, we take advantage of the rich data on prenatal and early childhood invest-
ments and conditions found in the Children of the National Longitudinal Survey of the Youth
1979 (CNLSY79) to first examine whether there are significant differences in important in
utero, birth, and early childhood conditions across siblings, controlling for family fixed ef-
fects. We find that, within the same household, siblings of higher birth order experience a
lower reduction in mother’s cigarette usage during pregnancy and are breastfed less often.
Furthermore, examining the child’s home environment at ages 0 to 1, we find a large and
significant negative relationship between birth order and measures of emotional and verbal
responsiveness of the mother, maternal acceptance and involvement with the child, and the
presence of material for learning and stimulation in the home. Having established that there
are significant differences in cigarette usage, prenatal care, breastfeeding, and early home
environment across children of different birth order in the same family, we next test for the
presence of birth order effects in early cognitive and non-cognitive test scores to assess the
evolution of birth order differences in educational outcomes and ask whether these differences
can be explained by variations in prenatal and early childhood conditions. We find a strong
negative relationship between increasing birth order and cognitive and non-cognitive test
scores, with the achievement gap between the first-born and higher-order siblings increasing
as the children reach adolescence. Birth order effects are most significant in the children’s
reading scores and measures of self-worth at the beginning of their teen years. However,1The results on earnings, however, are not robust to controlling for observable childhood family back-
ground characteristics in (Behrman and Taubman 1986).
3
Birth Order & Early Investments Lehmann, Nuevo-Chiquero, and Vidal-Fernandez
despite our finding that there are significant differences in prenatal and early childhood con-
ditions across children of different birth order, we find that the size and the significance of
the negative birth order effects on cognitive/non-cognitive tests, as well as in educational
attainment, are robust to controlling for these early childhood factors. These results suggest
several possible interpretations. One, birth order effects on educational outcomes are not
determined by biological differences or variations in early childhood environments; two, its
effects are latent until later in adulthood; or three, common measures of prenatal and early
childhood conditions fail to adequately capture critical differences in early health and home
conditions within a family.
Our paper makes a number of key contributions to the birth order literature. First, to
our knowledge, this paper is a first attempt to test whether there exists birth order effects
across many types of early cognitive and non-cognitive test scores.2 Previous studies have
largely focused on the relationship between birth order and adult educational attainment or
earnings, yet we believe that assessing whether these differences in achievement are present
even at early ages is important for unearthing the possible causes and dynamics of the
birth order effect. Second, despite growing evidence of the importance of prenatal and
early childhood investments in health and education as well as early home environments
on children’s adolescent and adult outcomes, no study has assessed whether these early
childhood conditions other than parental time can help explain the relationship between birth
order and children’s later achievement.3 In this paper, we utilize the rich data on specific
prenatal and early childhood health, educational, and emotional investments and conditions
present in the Children of the NLSY79 data to study the impact of these potentially critical
factors on explaining birth order effects. Finally, because of the richness and the longitudinal2Heiland (2009) is the only study of which that we are aware that examines the relationship between
birth order and an early cognitive test. However, he focuses on only the Peabody Picture Vocabulary Test(PPVT) scores and does not include other cognitive tests. We do not know of any study that investigatesthe presence of birth order effects on early non-cognitive outcomes.
3Booth and Kee (2009) may be considered an exception. However, their conclusion that latter-bornchildren have lower shares of educational resources is not directly identified, and they are unable to pinpointwhat types of resources higher birth-order children lack. Moreover, due to data limitations, they are unableto estimate a family fixed effects model.
4

Birth Order & Early Investments Lehmann, Nuevo-Chiquero, and Vidal-Fernandez
nature of our data, we are able to meet many of the strong requirements on data analysis
that will lead to unbiased estimates of the birth order effect.4 We employ family fixed effects
throughout our empirical estimations to avoid any potential biases that may arise from
unobservables in cross-sectional analysis. Further, we include children’s cohort indicators in
our controls to account for any cohort specific effects on our variables of interest.
2 Related Literature on Birth Order Effects
There are a number of theories outlining the potential channels through which birth order
effects might occur. First, parents may face different time and financial constraints over
their lifetime that may prevent them from equalizing their resources and investments across
children. On one hand, if there are time and resources constraints, first-born and last-born
children may benefit from their greater share of resources compared to middle-born children
(Birdsall 1991). However, if parents’ earnings tend to increase over their life cycle, later-born
children may face more advantages than their earlier-born siblings (Parish and Willis 1993).
Second, changing composition or parental characteristics may contribute to differing home
environments across children of different birth order. For example, later-born children may be
more intellectually stimulated by growing up with older children and better educated parents
(Zajonc 1976). Yet, if the level of intellectual stimulation at home is closely tied to parental
time constraints, later-born children may be disadvantaged by being part of a larger family.
Third, biological or physiological differences may also induce varying outcomes. Later-born
children have older mothers, and older mothers are more likely to give birth to children of
lower weight5 and experience greater number of complications during pregnancy and at birth.
On the other hand, mothers may become better child caretakers as they gain experience with
each child, and later-born children may benefit from better child rearing practices. Recently,
more sophisticated optimal stopping models or endogenous fertility models have shown that4See Blake (1989), Rodgers, Cleveland, van den Oord and Rowe (2000), Black, Devereux and Salvanes
(2005), and Black et al. (2007a) for details on these requirements.5However, first-born children may also be more likely to have lower birth weight.
5
Birth Order & Early Investments Lehmann, Nuevo-Chiquero, and Vidal-Fernandez
less than expected draw in the quality of the latest child may either demotivate parents
from having additional children or to continue having children until they reach an optimal
stopping quality (Ejrnæs and Pörtner 2004). The former effect would imply that earlier-born
children will tend to have better outcomes while the latter implies that later-born children
would be advantaged.
Despite the theoretical ambiguity in the sign of the relation between birth order and
children’s educational and labor market outcomes, most of the latest empirical studies on
birth order effects have found a strong, monotonically decreasing relationship. Improv-
ing upon earlier studies suffering from estimation limitations due to small sample sizes
and/or inability to control for family fixed effects and/or cohort effects (Behrman and
Taubman 1986, Kessler 1991, Hanushek 1992, Iacovou 2001), Black et al. (2005) use detailed
national administrative data from Norway and find a strong, negative relationship between
the birth order and the child’s education attainment and adult earnings within a family, and
these birth order effects appear to be of similar magnitude across families of varying sizes.
The significance of birth effect on education and earnings has been corroborated using the
U.S. Panel Study of Income Dynamics (PSID) in Kantarevic and Mechoulan (2006) who
estimate a family fixed effects model and find that first borns have higher education achieve-
ment, high school completion rates, and earnings. Similarly, Conley and Glauber (2006)
employ the sibling-sex composition instrument used in Angrist and Evans (1998) in analyz-
ing educational data from the 1990 5%-sample of the Public Use Micro Sample (PUMS) and
find that while the latter-born children in larger families are more likely to be held back
in school, family size does not seem to affect the first-born. Heiland (2009) examines birth
order effects on early verbal ability test scores using the Children of the NLSY79 and finds
that compared to their middle-born siblings, first-born children have higher Peabody Picture
Vocabulary Test (PPVT) scores.
In view of these strong findings on birth order effects in educational attainment and
earnings, much of the latest research on birth effects have focused on empirically exploring
6
Birth Order & Early Investments Lehmann, Nuevo-Chiquero, and Vidal-Fernandez
the possible causes of the relationship. However, most of these studies have found that
the birth order effect is robust to controlling for possible differences in birth endowments,
parental time, and maternal quality time. Using the same Norway administrative dataset as
in Black et al. (2005), Black, Devereux and Salvanes (2007b) find a significant effect of birth
order on IQ with the earlier born children having higher IQs by about one-fifth of a standard
deviation or approximately three IQ points.6 Yet when controlling for birth endowments such
as birthweight, gestational period, and head size, the estimated birth order effects remain
significant, actually rising in their magnitudes.
Several studies have assessed the role of parental time variations across children of dif-
ferent birth order. Price (2008) uses data from the American Time Use Survey (ATUS) and
finds that parents tend to spend equal time with each of their children at any given point
in time, and the total parental time with children decreases with age, especially with the
age of the oldest child. These patterns, in turn, translate into the first-born child receiv-
ing roughly 20 to 30 more minutes of quality time each day with a parent compared to a
second-born child. Despite his strong findings on parental time differences across siblings in
his data, Price (2008) is unable to assess whether differences in parental time is significantly
correlated with children’s education outcomes and whether birth order effects are robust to
controlling for parental quality time. Monfardini and See (2011) directly address these two
remaining questions in their examination of maternal quality time and birth order in the
Child Development Supplement (CDS) of the PSID. In a household fixed effects model, they
find a significant negative relationship between maternal quality time and birth order, yet
the birth order effects on education remain negative and significant even controlling for these
differences in maternal quality time. Moreover, estimates show that differences in maternal
quality time are insignificant correlates of variations in children’s education outcomes.
Finally, Booth and Kee (2009) ask whether variations in family resources other than
parental time across children can explain the birth order effect. Using the British Household6Black et al. (2007b) note that this IQ gap is of similar magnitude as the black-white gap in the U.S.
7
Birth Order & Early Investments Lehmann, Nuevo-Chiquero, and Vidal-Fernandez
Panel Survey, Booth and Kee show that the shares of the family educational resources are
decreasing with birth order. Controlling for parental family income, parental age at both
and family level attributes, they find that children from larger families and with higher
birth order have lower educational attainment. In contrast to Black et al. (2005), the family
size effect does not disappear when controlling for birth order. Nevertheless, due to data
limitations, they cannot estimate a family fixed effects model, and therefore cannot control
for non-time varying unobservable family characteristics that are correlated with household
resources or fertility decisions.
Motivated by the existing evidence on the significance of in utero and early childhood
environments on children’s later outcomes,7 we explore prenatal and early childhood invest-
ments in health, education, and maternal emotion/verbal responsiveness during the child’s
first year as possible causes of birth order effects. We first investigate whether there are
indeed significant differences in key prenatal and early childhood investments and home
conditions across siblings of different birth order. Next, we examine birth order effects not
merely in education attainment or adult earnings but in cognitive and non-cognitive test
scores from early childhood and adolescence in an effort to disentangle the evolution of birth
order effects from childhood to adulthood. Finally, we assess whether variations in prenatal
and early childhood environments are able to explain differences in test scores and adult
outcomes across children of different birth order.
The rest of the paper is organized as follows. Section 3 briefly describes the Children
of the NLSY79 and summarizes our cognitive and non-cognitive assessments of interest.
We also include detailed description of our measures of prenatal and postnatal inputs and
early home environment. Section 4 outlines our empirical strategy and presents the results.
Finally, Section 5 concludes and suggests avenues for future research.7An extensive review of literature is outside the scope of this paper. See Gluckman and Hanson (2005),
Heckman (2007), Almond and Currie (2010) for a detailed review of the fetal origins literature and Knudsenet al. (2006), Cunha and Heckman (2007), Heckman et al. (2006), and Heckman and Masterov (2007) fornotable studies on the importance of the child’s first few years of development.
8
Birth Order & Early Investments Lehmann, Nuevo-Chiquero, and Vidal-Fernandez
3 Data
We rely on data from the 1979 cohort of the National Longitudinal Survey of Youth (NLSY79).
The NLSY79 is a nationally representative sample of 12,686 men and women between 14
and 21 years old who were first interviewed in 1979. Periodic surveys of these individuals
have been conducted since then, collecting rich information on employment, income, welfare
program participation, education, and other background variables.
Starting in 1986, 11,420 children of the 6,283 female NLSY79 respondents have been inter-
viewed bi-annually forming the Children of the NLSY79 (CNLSY79) sample. The child sur-
vey includes information on prenatal investments, birth outcomes, early childhood parental
investments and health, scores from cognitive and non-cognitive assessments, quality of the
home environment, as well as additional demographic and development information collected
from either the mother or the child. Some children born before or in 1972 never belonged to
the CNLSY79, because once they turn 15 they leave the sample and start the NSLY79 Young
Adults survey, which resembles the NLSY79 questionnaire. The CNLSY79 provides unique
and detailed longitudinal information on a large nationally representative sample of moth-
ers and their children. The availability of a thorough record of the mothers’ employment
records and their background characteristics along with extensive data on children’s prena-
tal and early childhood health and cognitive/non-cognitive development indicators make the
NLSY79 Children and Young Adults an ideal dataset to explore the relationship between
birth order and child’s cognitive and educational outcomes and its possible causes found in
in utero and early childhood environments.
3.1 Pre/Postnatal Inputs and Birth Outcomes
As potential explanations for the birth order effects on child cognitive/non-cognitive test
scores and adult education/earnings outcomes, we examine various measures of prenatal and
postnatal maternal behavior and investments as well as several key child outcomes at birth
9
Birth Order & Early Investments Lehmann, Nuevo-Chiquero, and Vidal-Fernandez
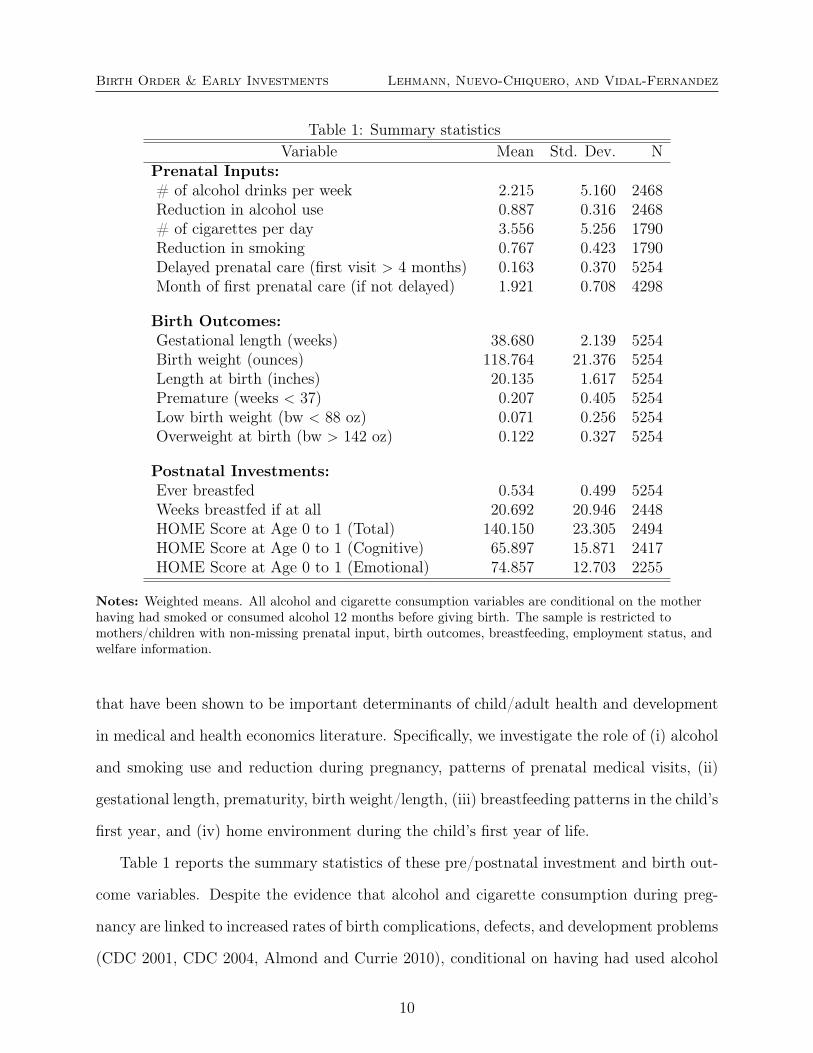
Table 1: Summary statisticsVariable Mean Std. Dev. N
Prenatal Inputs:# of alcohol drinks per week 2.215 5.160 2468Reduction in alcohol use 0.887 0.316 2468# of cigarettes per day 3.556 5.256 1790Reduction in smoking 0.767 0.423 1790Delayed prenatal care (first visit > 4 months) 0.163 0.370 5254Month of first prenatal care (if not delayed) 1.921 0.708 4298
Birth Outcomes:Gestational length (weeks) 38.680 2.139 5254Birth weight (ounces) 118.764 21.376 5254Length at birth (inches) 20.135 1.617 5254Premature (weeks < 37) 0.207 0.405 5254Low birth weight (bw < 88 oz) 0.071 0.256 5254Overweight at birth (bw > 142 oz) 0.122 0.327 5254
Postnatal Investments:Ever breastfed 0.534 0.499 5254Weeks breastfed if at all 20.692 20.946 2448HOME Score at Age 0 to 1 (Total) 140.150 23.305 2494HOME Score at Age 0 to 1 (Cognitive) 65.897 15.871 2417HOME Score at Age 0 to 1 (Emotional) 74.857 12.703 2255
Notes: Weighted means. All alcohol and cigarette consumption variables are conditional on the motherhaving had smoked or consumed alcohol 12 months before giving birth. The sample is restricted tomothers/children with non-missing prenatal input, birth outcomes, breastfeeding, employment status, andwelfare information.
that have been shown to be important determinants of child/adult health and development
in medical and health economics literature. Specifically, we investigate the role of (i) alcohol
and smoking use and reduction during pregnancy, patterns of prenatal medical visits, (ii)
gestational length, prematurity, birth weight/length, (iii) breastfeeding patterns in the child’s
first year, and (iv) home environment during the child’s first year of life.
Table 1 reports the summary statistics of these pre/postnatal investment and birth out-
come variables. Despite the evidence that alcohol and cigarette consumption during preg-
nancy are linked to increased rates of birth complications, defects, and development problems
(CDC 2001, CDC 2004, Almond and Currie 2010), conditional on having had used alcohol
10
Birth Order & Early Investments Lehmann, Nuevo-Chiquero, and Vidal-Fernandez
or cigarettes before pregnancy,8 the mothers in the CNLSY79 still consume on average 2.2
drinks per week and 3.6 cigarettes per day while pregnant. However, the vast majority of
the women do report that they did reduce alcohol and cigarette use during pregnancy. Only
about 16% of the women significantly delayed receiving prenatal care, having her first doc-
tor’s visit on the 4th month of pregnancy or later. For those who did not delay receiving
prenatal care, the first visit typically occurs during the second month of pregnancy.
The middle panel of Table 1 presents the means of birth outcomes. A typical child in our
sample is born around the 38th week of gestation, weighs approximately 120 ounces (or 7.5
pounds), and measures 20 inches at birth. Although the proportion of children born with a
low birth weight is only around 7%, it is notable that the proportion of those born overweight
is almost twice as large. About 20% of the children in our sample are born prematurely,
being born before the 37th week of gestation.
Despite American Academy of Pediatrics’ (AAP) recommendation that infants should be
exclusively breastfed during his/her first six months in light of the potential health benefits
associated with breastfeeding (Belfield and Kelly 2010), the bottom panel of Table 1 shows
that only half of the children in our sample are ever breastfed. For those children the mothers
choose to breastfeed, the average duration is around 20 weeks, about one month less than
the AAP’s recommendation.
Finally, taking advantage of information on the children’s home environment in the
CNLSY79, we explore the role of early home environment and parental interaction as a po-
tential explanation for birth order effects. We rely on the Home Observation Measurement
of the Environment (HOME) measure in the CNLSY79 that has been used by researchers to
understand the quality of the child’s home environment and maternal traits and behavior.9
8More specifically, this condition refers to women who smoked or drank alcohol around 12 months beforegiving birth. However, the share of women who report not having had consumed alcohol or cigarettes in theNLSY97 is similar to the share in the entire U.S. population of non-pregnant women (CDC 2004).
9Starting in survey year 2006, only children 4 years and older were given the interviewer-administeredassessments. Therefore, interview observations for children under the age of 4 are not available for many ofthe youngest children in the CNLSY79 sample. This is the main reason for the decrease in our sample sizein our regression analysis.
11

Birth Order & Early Investments Lehmann, Nuevo-Chiquero, and Vidal-Fernandez
We focus on the total HOME score as well as on the two sub-scores focusing on cognitive
stimulation and emotional support. The HOME questionnaire for children aged 0 to 1 in-
cludes questions that ask about the number of books the child has at home, whether the
mother reads to the child, availability of toys, interaction with parents, parental attentive-
ness, discipline patterns, and frequency of outings. These responses to these questions are
either answered by the mother or recorded from observations of an official home visitor, and
the HOME scores are reported as simple summations of the scores from individual items in
the questionnaire, with higher scores signifying a better home environment. We choose to
focus on HOME scores at ages 0 to 110 to minimize the concern that parents may systemat-
ically adjust their interactions with and investments in the child based on their assessment
of the child’s abilities as revealed through test scores or personal interactions.
3.2 Cognitive and Non-Cognitive Assessments
3.2.1 Cognitive Assessments
In our aim to better understand the sources and the nature of birth order effects, we expand
the set of outcome variables beyond adult education attainment and earnings that have
typically been the focus of existing literature and examine a wide range of early cognitive
and non-cognitive test scores. Specifically, children’s cognitive outcomes are proxied by
scores on the Peabody Individual Achievement Test - Mathematics (PIAT-M) and - Reading
(PIAT-R) tests and the Peabody Picture Vocabulary Test (PPVT). All three assessments
have been used extensively in a myriad of studies assessing the cognitive development of
young children.11
The PPVT is a vocabulary test administered to children between the ages of 3 through10The CNLSY79 is administered every two years. Therefore, we calculate HOME scores as equal to the
scores at age 0. If scores are missing at age 0, we use scores at age 1. In our estimation sample, only 51observations have scores from both ages 0 and 1. Treating scores from age 1 as the primary measure doesnot alter our conclusions.
11Descriptions of the cognitive and non-cognitive assessments, prenatal and postnatal inputs, and earlyhome environment are drawn from the NLSY79 online guides to Child and Young Adult Data available at:http://www.nlsinfo.org/childya/nlsdocs/guide/topicalTOC.html. Accessed on April 28, 2012.
12
Birth Order & Early Investments Lehmann, Nuevo-Chiquero, and Vidal-Fernandez
18 and is widely recognized to be a good measure of cognitive ability, especially of verbal
intelligence. It has been found to be highly correlated with scores on other intelligence tests
and is viewed to be an important indicator of early and middle school outcomes (Baker,
Keck, Mott and Quinlan 1993). We focus on PPVT scores from ages 4 and 5 and from ages
10 and 11 in an effort to examine how the scores change from the earliest ages for which we
have test score information to the beginning of adolescence.
The PIAT-R is a test designed to assess word recognition and pronunciation ability and
is divided into two parts. The PIAT-R: Reading Recognition assesses skills such as matching
letters, naming names, and reading single words aloud. The second part, PIAT-R: Reading
Comprehension measures the child’s ability to derive meaning from sentences that are read
silently. PIAT-M assesses knowledge and application of mathematical concepts and facts.
Both the PIAT-R and the PIAT-M tests are administered to children between 5 to 18 years
old. In our analysis, we examine test scores at ages 5 and 6 and at ages 12 and 13, the earliest
and the latest ages for which we have score information for the majority of our children in
our sample.
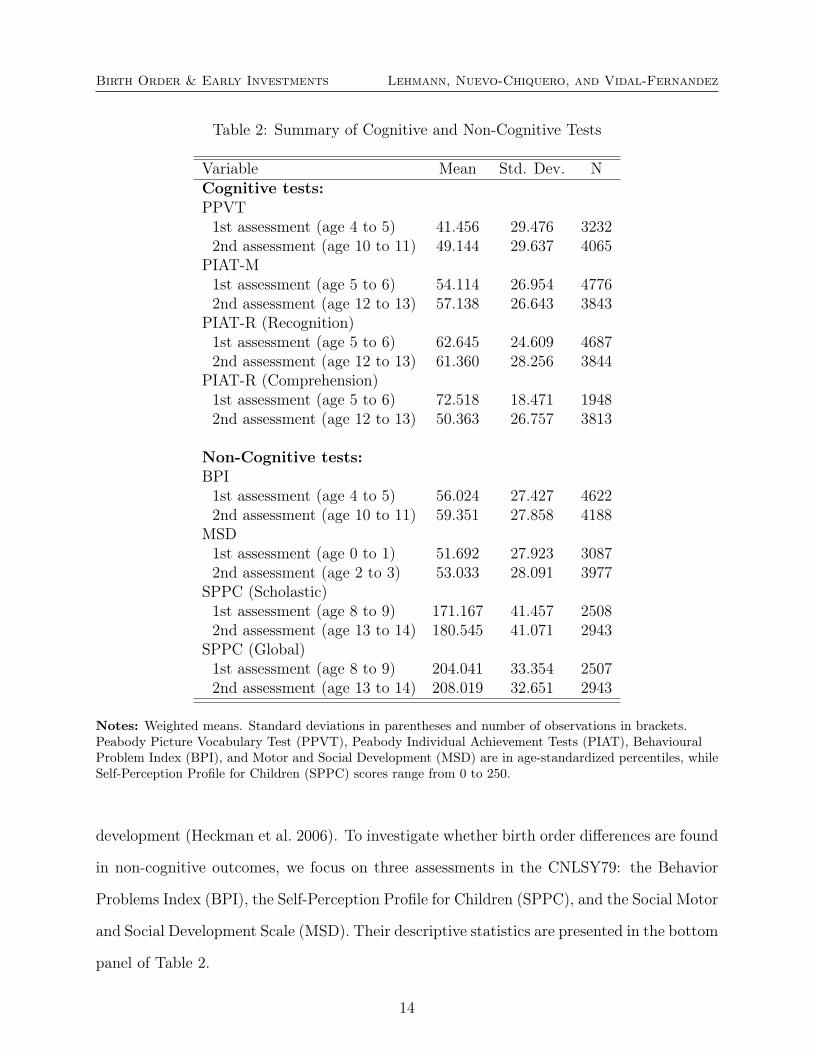
The top panel of Table 2 presents the descriptive statistics for these cognitive tests, where
we restrict the sample to those children for whom we have information about their prenatal
investments and birth outcomes.12 Since the test scores are age-standardized, differences
in the means should not reflect the effect of age at test-taking. Nevertheless, except in
the case of reading comprehension, children tend to perform slightly better in their second
assessment.
3.2.2 Non-Cognitive Assessments
While cognitive assessments are important measures of children’s early achievement, they,
by themselves, may fail to capture critical differences in the children’s mental and social12Although this restriction does not ensure that the sample for which the means are reported is the same
across PIAT and PPVT, our main empirical results hold when restricting the sample to those with both testscores.
13
Birth Order & Early Investments Lehmann, Nuevo-Chiquero, and Vidal-Fernandez
Table 2: Summary of Cognitive and Non-Cognitive Tests
Variable Mean Std. Dev. NCognitive tests:PPVT1st assessment (age 4 to 5) 41.456 29.476 32322nd assessment (age 10 to 11) 49.144 29.637 4065
PIAT-M1st assessment (age 5 to 6) 54.114 26.954 47762nd assessment (age 12 to 13) 57.138 26.643 3843
PIAT-R (Recognition)1st assessment (age 5 to 6) 62.645 24.609 46872nd assessment (age 12 to 13) 61.360 28.256 3844
PIAT-R (Comprehension)1st assessment (age 5 to 6) 72.518 18.471 19482nd assessment (age 12 to 13) 50.363 26.757 3813
Non-Cognitive tests:BPI1st assessment (age 4 to 5) 56.024 27.427 46222nd assessment (age 10 to 11) 59.351 27.858 4188
MSD1st assessment (age 0 to 1) 51.692 27.923 30872nd assessment (age 2 to 3) 53.033 28.091 3977
SPPC (Scholastic)1st assessment (age 8 to 9) 171.167 41.457 25082nd assessment (age 13 to 14) 180.545 41.071 2943
SPPC (Global)1st assessment (age 8 to 9) 204.041 33.354 25072nd assessment (age 13 to 14) 208.019 32.651 2943
Notes: Weighted means. Standard deviations in parentheses and number of observations in brackets.Peabody Picture Vocabulary Test (PPVT), Peabody Individual Achievement Tests (PIAT), BehaviouralProblem Index (BPI), and Motor and Social Development (MSD) are in age-standardized percentiles, whileSelf-Perception Profile for Children (SPPC) scores range from 0 to 250.
development (Heckman et al. 2006). To investigate whether birth order differences are found
in non-cognitive outcomes, we focus on three assessments in the CNLSY79: the Behavior
Problems Index (BPI), the Self-Perception Profile for Children (SPPC), and the Social Motor
and Social Development Scale (MSD). Their descriptive statistics are presented in the bottom
panel of Table 2.
14
Birth Order & Early Investments Lehmann, Nuevo-Chiquero, and Vidal-Fernandez
The BPI measures the incidence and the severity of behavior problems for children of
four years and older (Peterson and Zill 1986). The specific set of questions varies according
to the age of the child. In our analysis, we examine the BPI Total Score which is based on
responses from mothers to 28 questions regarding specific behaviors that her children may
have exhibited in the previous three months. The higher the score, the greater the level of
behavioral problems. We focus on BPI scores at ages 4 and 5 and at ages 10 and 11, the
earliest ages for which we have scores to the beginning of adolescence.
The SPPC is a measure of a child’s sense of general self-worth and self-competence in
their academic skills based on the child’s self-reported answers to the interviewer’s verbal
questions. The score is divided into two sub-scores: a scholastic competence score and a
global self-worth score. In the SPPC survey, each child is given a choice to select the the
former or the latter part of a two-part statement that describes him or her the best and
indicate the extent to which the description is true for them.13 The SPPC is completed by
children eight years and older in the survey years 1986 to 1994, and beginning in 1996, the
assessment was limited to children who were 12 years and older. We examine the SPPC
scores at ages 8 and 9 and at ages 13 and 14.
Finally, developed by the National Center for Health Statistics to measure motor, social,
and cognitive development of young children from birth to three years, the MSD is based
on the mother’s answer to fifteen or sixteen age-appropriate questions about their child’s
development. We examine the MSD scores at ages 0 and 1 and at ages 2 and 3.
3.3 Birth Order and Additional Controls
In our analysis of whether there exists significant differences in early cognitive and non-
cognitive outcomes across siblings of different birth order, our empirical specifications also
control for other child characteristics that can potentially affect the mother’s prenatal and
postnatal investment choices. More specifically, in addition to birth order, we control for13For example, a statement on the SPPC part of the survey declares, “Some kids feel like they are just as
smart as other kids their ages, but other kids aren’t so sure and wonder if they are as smart.”
15
Birth Order & Early Investments Lehmann, Nuevo-Chiquero, and Vidal-Fernandez
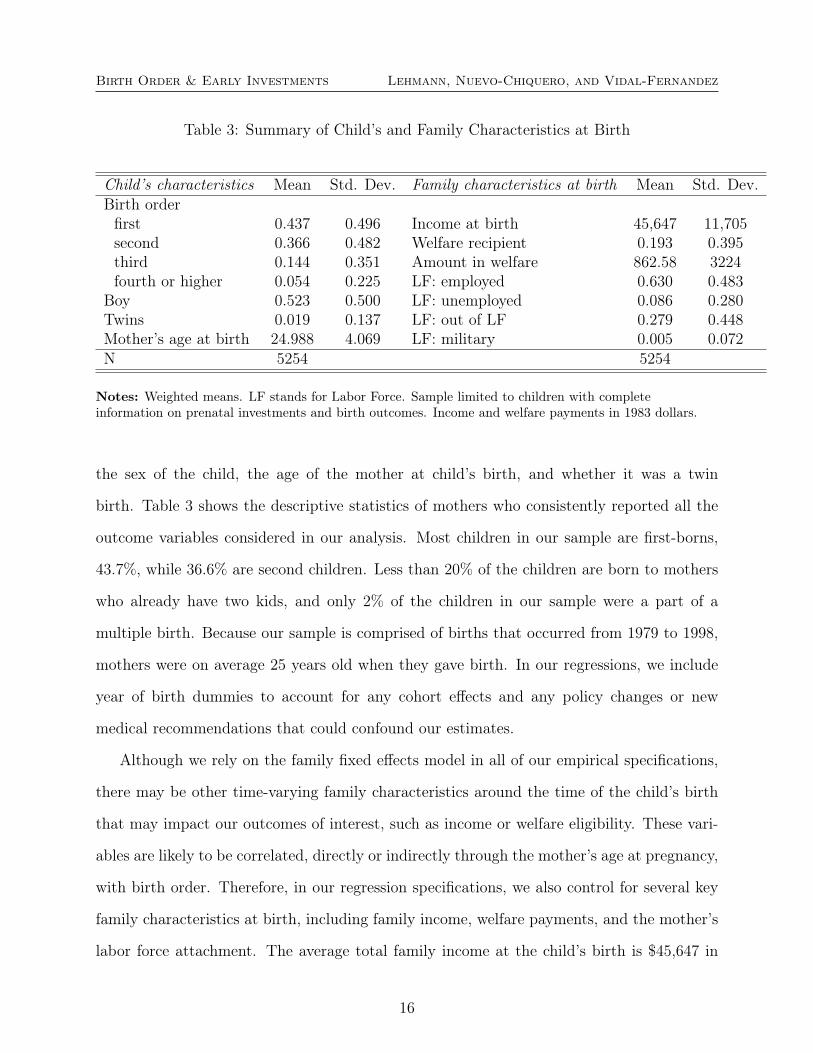
Table 3: Summary of Child’s and Family Characteristics at Birth
Child’s characteristics Mean Std. Dev. Family characteristics at birth Mean Std. Dev.Birth orderfirst 0.437 0.496 Income at birth 45,647 11,705second 0.366 0.482 Welfare recipient 0.193 0.395third 0.144 0.351 Amount in welfare 862.58 3224fourth or higher 0.054 0.225 LF: employed 0.630 0.483
Boy 0.523 0.500 LF: unemployed 0.086 0.280Twins 0.019 0.137 LF: out of LF 0.279 0.448Mother’s age at birth 24.988 4.069 LF: military 0.005 0.072N 5254 5254
Notes: Weighted means. LF stands for Labor Force. Sample limited to children with completeinformation on prenatal investments and birth outcomes. Income and welfare payments in 1983 dollars.
the sex of the child, the age of the mother at child’s birth, and whether it was a twin
birth. Table 3 shows the descriptive statistics of mothers who consistently reported all the
outcome variables considered in our analysis. Most children in our sample are first-borns,
43.7%, while 36.6% are second children. Less than 20% of the children are born to mothers
who already have two kids, and only 2% of the children in our sample were a part of a
multiple birth. Because our sample is comprised of births that occurred from 1979 to 1998,
mothers were on average 25 years old when they gave birth. In our regressions, we include
year of birth dummies to account for any cohort effects and any policy changes or new
medical recommendations that could confound our estimates.
Although we rely on the family fixed effects model in all of our empirical specifications,
there may be other time-varying family characteristics around the time of the child’s birth
that may impact our outcomes of interest, such as income or welfare eligibility. These vari-
ables are likely to be correlated, directly or indirectly through the mother’s age at pregnancy,
with birth order. Therefore, in our regression specifications, we also control for several key
family characteristics at birth, including family income, welfare payments, and the mother’s
labor force attachment. The average total family income at the child’s birth is $45,647 in
16

Birth Order & Early Investments Lehmann, Nuevo-Chiquero, and Vidal-Fernandez
1983 dollars, and around 20% of the children in our sample were born to mothers who were
welfare recipients at the child’s birth. We also control for the mother’s labor force status
during the year prior to the birth.14 Regrettably, the NLSY79 does not include consistent in-
formation on Medicaid eligibility and coverage, which may account for some of the differences
on prenatal care utilization and birth outcomes.
4 Results
To measure the effect of birth order on a range of outcomes, we estimate the following
equation:
Yift = α+ βD(birth order)if + γXi + δXft + υf + εift (1)
where i denotes child, f family, and Yift the outcome of interest at age t. D(birth order)if
are four dummies for the second, third, and higher order of birth, leaving the first borns as
the omitted category. Xi are child-specific characteristics (gender, twin, age of the mother
at birth, and cohort and region indicators), and Xft are time-varying family characteristics
(income, welfare recipient, labor force participation).15 υf are family-fixed effects. Models
with cognitive and non-cognitive tests as the outcome of interest also control for age in
months at the time of the assessment, because the CNLSY79 is administered every two years
and can introduces a significant age variation at the time of testing of up to 24 months. For
the sake of simplicity, we assume linearity and continuity for all models with dummy or
count variables as the dependent variable. All models are weighted and standard errors are
corrected for heteroskedasticity.14We choose to control for the mother’s employment status a year before birth rather than at birth to
minimize the possibility that the mother’s labor force decisions are correlated with the status of her pregnancyand child’s birth outcomes. However, using the mother’s labor force status at birth does not change ourmain results.
15Family characteristics at the time of outcome are only included for prenatal and early postnatal in-vestments. Including contemporaneous controls at the family level for later outcomes does not affect theresults.
17
Birth
Order
&Early
Investm
ents
Leh
mann,N
uevo
-Chiq
uero
,and
Vid
al-F
ernandez
Table 4: Prenatal Investments and Birth OutcomesPrenatal Investments: # of drinks Reduced # cigarettes Reduced Delayed Month of 1st
per week alcohol per day smoking prenatal care prenatal visit(1) (2) (3) (4) (5) (6)
2nd born -0.772 -0.037 0.536 -0.090* -0.038 0.098*(0.588) (0.044) (0.538) (0.048) (0.027) (0.057)
3rd born -1.384 -0.035 -0.599 -0.175** -0.036 0.221**(0.988) (0.076) (0.771) (0.078) (0.049) (0.093)
4th or higher born -2.752 -0.114 -1.164 -0.301** -0.018 0.357**(1.783) (0.113) (1.081) (0.125) (0.071) (0.144)
F-stat 1.550 1.251 1.243 2.706 1.043 2.974R2 0.086 0.075 0.070 0.162 0.019 0.055N 2468 2468 1790 1790 5254 4298
Birth Outcomes: Gestational Premature Birth weight Low birth Overweight Babylength (weeks<37) weight at birth length
2nd born -0.221 -0.074* 2.965*** -0.020 0.027 0.027(0.151) (0.038) (1.126) (0.015) (0.023) (0.098)
3rd born -0.321 -0.095 4.227* -0.034 0.076* -0.045(0.281) (0.066) (2.206) (0.028) (0.040) (0.196)
4th or higher born -0.352 -0.049 2.167 -0.038 0.110* -0.290(0.493) (0.102) (3.609) (0.042) (0.061) (0.328)
F-stat 1.379 2.189 4.992 1.800 1.921 2.511R2 0.063 0.038 0.111 0.080 0.043 0.057N 5254 5254 5254 5254 5254 5254
Notes: All regressions are weighted and include family fixed effects. Robust standard errors in parentheses. *= different from zero at the 10%level. **= different from zero at the 5% level. ***= different from zero at the 1% level. All specifications control for regional dummies, maternalage, gender of the child, income of the family, lagged labor force status of the mother and welfare status and amount received in welfare, if any. Aseries of dummies on year of birth are also included. Alcohol consumption and smoking are defined for woman who reported drinking or smokingprior to the pregnancy. Prenatal care is classified as delayed if the first visit occurred at the 4th gestational month of pregnancy or later. Month of1st prenatal visit is defined only for women who seek prenatal care early in their pregnancies (up to the 3rd gestational month)
18
Birth Order & Early Investments Lehmann, Nuevo-Chiquero, and Vidal-Fernandez
4.1 Differences in Early Investments and Birth Outcomes by Birth
Order
In this section, we examine whether there exist significant variations in pre- and postnatal
investments, key birth outcomes, and child’s early home environment across children of
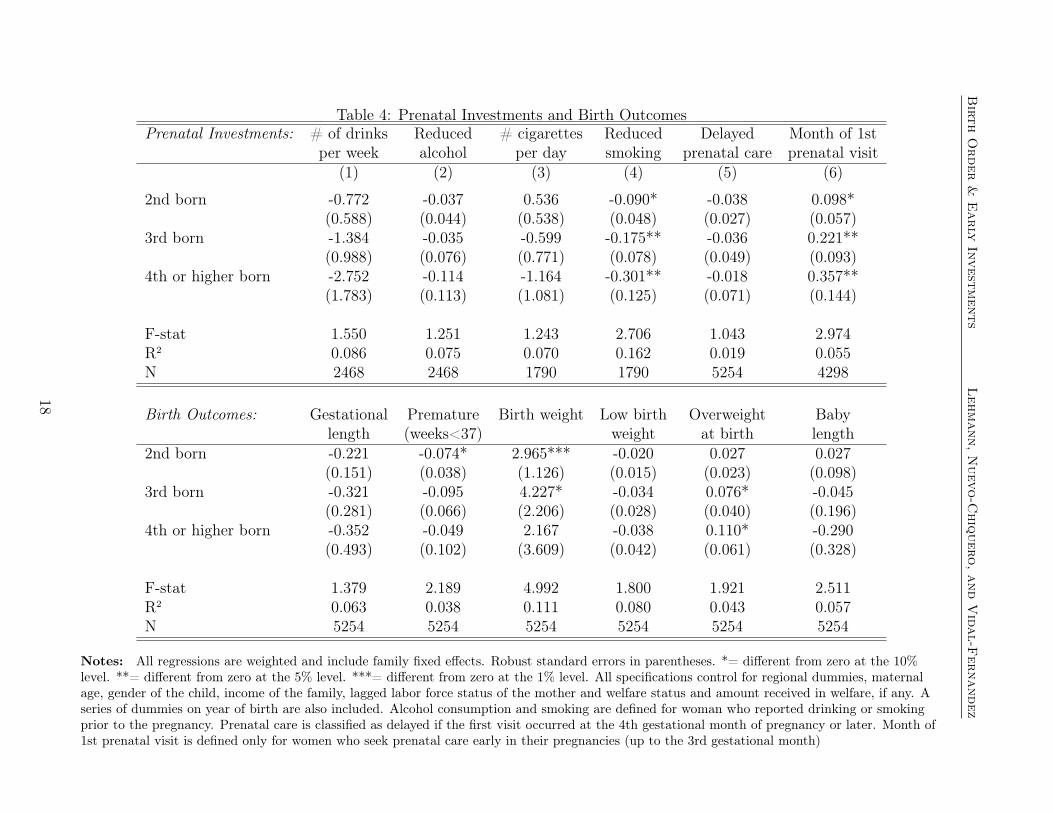
different birth order. Table 4 presents the results for prenatal and birth outcomes, and
Table 5 presents the results for postnatal investments.
The top panel of Table 4 shows that, within the same family, there are significant dif-
ferences in some measures of prenatal investments across siblings of different birth order.
However, these patterns are not robust across all investment measures. First, we fail to find
statistically significant differences in the probability of alcohol reduction during pregnancy
across birth order, although the point estimates are sizable. However, while still not statis-
tically significant, the average number of drinks per week tend to decrease with birth order
as well. This pattern may be driven by women reducing their overall alcohol consumption
as they age and family size increases.16
In contrast to alcohol consumption patterns, we find that the probability of reducing
cigarette smoking is significantly lower for higher order children. Compared to her first
child, a woman who was a prior smoker is 9 percentage points less likely to reduce cigarette
consumption during the pregnancy of her second child, 17.5 percentage points less likely
while carrying her third child, and 30 percentage points less likely for her 4th or higher
ordered children.17 Similar to alcohol consumption, the number of cigarettes smoked per
day also tend to decrease, although still not significantly.18
Finally, while we find no evidence that women are more likely to delay their first prenatal
care visit for her latter children, column 6 of Table 4 shows that among those women who16Note that births occurred between 1980 and 1994, when the negative effects of smoking or drinking
during pregnancy were already well established.17Unfortunately, we do not have information on the timing of the reduction in smoking. Stopping tobacco
consumption early in the pregnancy has been reported to be correlated with better birth outcomes thanstopping at a later point (MacArthur and Knox 1988).
18Fingerhut, Kleinman and Kendrick (1990) report a relapse ratio of 70 percent within a year of birth inthe mid 1980s.
19

Birth Order & Early Investments Lehmann, Nuevo-Chiquero, and Vidal-Fernandez
sought timely prenatal care, mothers are significantly more likely to postpone their first visit
for higher order children.19 The effect of early prenatal care on children in literature is still
not well established. While some studies only find a weak impact of prenatal care on birth
outcomes (Currie and Grogger 2002), others, such as Smith-Conway and Deb (2005), report
that for normal pregnancies, a delay of one week in first prenatal visit is associated with a
decrease of 1 to 1.2 ounces in birth weight.20
Despite our finding that mothers are less likely to reduce cigarette consumption and to
seek timely prenatal care with her latter pregnancies, the birth outcomes of higher-order
children do not seem to be adversely affected. The bottom panel of Table 4 presents the
regression results for birth outcomes. Siblings born later are slightly less likely to be prema-
ture, and consequently, are more likely to be heavier (but not taller) than their older siblings.
The effect of birth order on weight is ambiguous. Columns 3 and 4 show that while higher
order children are less likely to suffer from low birth weight, they are also significantly more
likely to be born overweight. Being overweight at birth has been shown to be associated
with higher BMI later in life21 and increased risk for obesity and diseases such as cancer,
asthma, and atopy in adults.22 Therefore, this positive relationship between birth order and
increased probability of being overweight at birth may serve as a potential explanation for19The absence of statistically significant differences in our dataset may be due to the relatively small size of
our sample. Using a larger sample of birth certificates, Lewis, Mathews and Heuser (1996) report a positivecorrelation between delayed prenatal care and pregnancies after the second live birth.
20Drinking alcohol, smoking, delayed access to prenatal care are also associated with a higher incidenceof miscarriage and activities such as drug consumption that can cause fetal losses (e.g. Dominguez-Rojas,de Juanes-Pardo, Astasio-Arbiza, Ortega-Molina and Gordillo-Florencio 1994). Unfortunately, the CNLSY79does not include information on pregnancies that ended in spontaneous or induced abortion. Risky activitieswould be higher for pregnancies that end in fetal loss and the children would have performed significantlyworse, would they not have miscarried. If the incidence of these “non-random” fetal losses varies by previousbirth histories of the women, its omission from the sample might affect our estimation. However, theproportion of heavy drinkers or heavy smoker in our sample is limited and does not appear to vary by birthorder.
21For example, see Gillman, Rifas-Shiman, Berkey, Field and Colditz (2003), Leong, Mignone, Newcomb,Titus-Ernstoff, Baron, Trentham-Dietz, Stampfer, Willett and Egan (2003), Parsons, Power, Logan, Sum-merbell et al. (1999), Pietiläinen, Kaprio, Räsänen, Winter, Rissanen and Rose (2001), and Wei, Li, Sung,Lin, Chiang, Li and Chuang (2007).
22See Eriksson, Wedel, Wallander, Krakau, Hugosson, Carlsson and Svärdsudd (2007), Harder, Plagemannand Harder (2008), Hjalgrim, Westergaard, Rostgaard, Schmiegelow, Melbye, Hjalgrim and Engels (2003),and Remes, Patel, Hartikainen, Jarvelin and Pekkanen (2008).
20
Birth Order & Early Investments Lehmann, Nuevo-Chiquero, and Vidal-Fernandez
Table 5: Postnatal InvestmentBreastfeed Weeks HOME HOME HOME
Breastfed (Total) (Cognitive) (Emotion)(1) (2) (3) (4) (5)
2nd born -0.098*** 1.217 -5.591*** -2.734** -2.354**(0.021) (1.631) (1.788) (1.069) (1.075)
3rd born -0.122*** 4.333 -7.564** -5.184*** -1.933(0.038) (2.987) (3.365) (1.992) (2.018)
4th or higher born -0.136** 7.679 -8.111 -5.486* -1.895(0.058) (5.395) (5.396) (3.209) (3.142)
F-stat 2.395 1.591 6.679 12.394 2.301R2 0.058 0.097 0.189 0.344 0.081N 5254 2448 3151 3079 3007
Notes: All regressions are weighted and include family fixed effects. Robust standard errors inparentheses. *= different from zero at the 10% level. **= different from zero at the 5% level. ***=different from zero at the 1% level. All specifications control for regional dummies, maternal age, gender ofthe child, income of the family, lagged labor force status of the mother and welfare status and amountreceived in welfare, if any. A series of dummies on year of birth are also included.
worse adult outcomes through its impact on health.
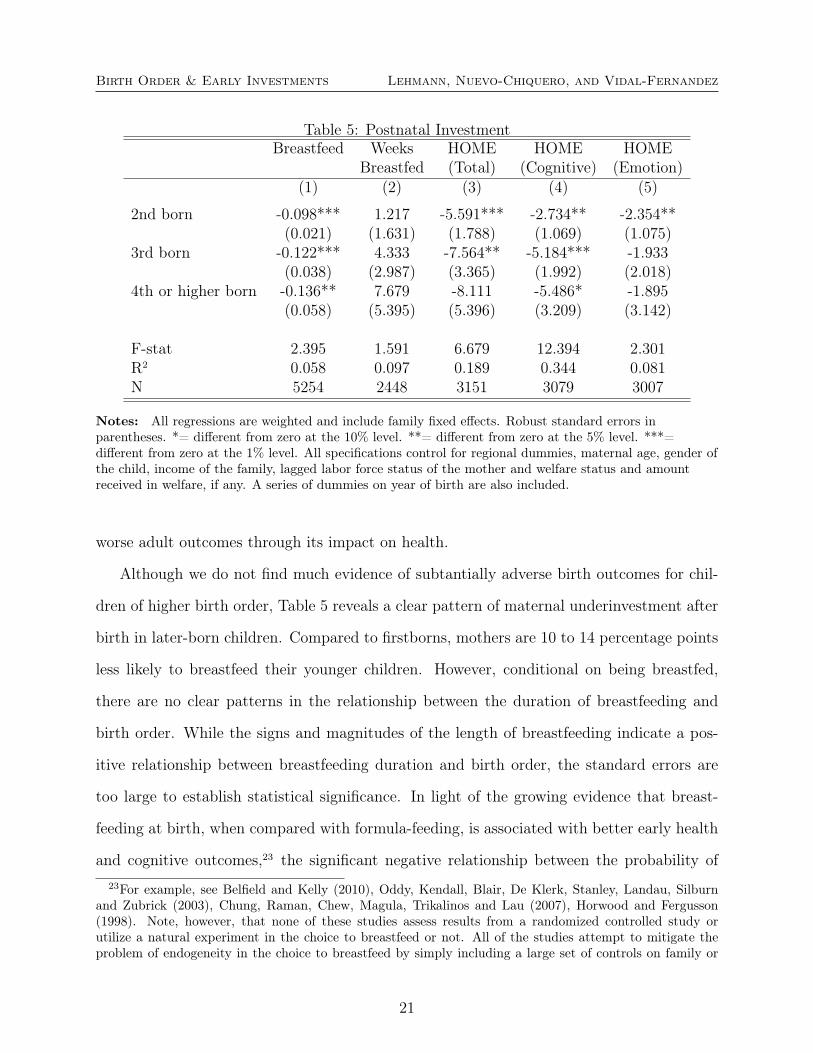
Although we do not find much evidence of subtantially adverse birth outcomes for chil-
dren of higher birth order, Table 5 reveals a clear pattern of maternal underinvestment after
birth in later-born children. Compared to firstborns, mothers are 10 to 14 percentage points
less likely to breastfeed their younger children. However, conditional on being breastfed,
there are no clear patterns in the relationship between the duration of breastfeeding and
birth order. While the signs and magnitudes of the length of breastfeeding indicate a pos-
itive relationship between breastfeeding duration and birth order, the standard errors are
too large to establish statistical significance. In light of the growing evidence that breast-
feeding at birth, when compared with formula-feeding, is associated with better early health
and cognitive outcomes,23 the significant negative relationship between the probability of23For example, see Belfield and Kelly (2010), Oddy, Kendall, Blair, De Klerk, Stanley, Landau, Silburn
and Zubrick (2003), Chung, Raman, Chew, Magula, Trikalinos and Lau (2007), Horwood and Fergusson(1998). Note, however, that none of these studies assess results from a randomized controlled study orutilize a natural experiment in the choice to breastfeed or not. All of the studies attempt to mitigate theproblem of endogeneity in the choice to breastfeed by simply including a large set of controls on family or
21
Birth Order & Early Investments Lehmann, Nuevo-Chiquero, and Vidal-Fernandez
breastfeeding and birth order may potentially be a part of the explanation for worse adult
outcomes in latter-born children.
Finally, the level of home investment as proxied by the HOME scores has been shown to
be significant correlates of later cognitive achievement and health (Todd and Wolpin 2007,
Strauss and Knight 1999, Carlson and Corcoran 2001)24, and we find large and significant
birth order differences in the HOME scores across all dimensions as reported in the last three
columns of Table 5. Compared to the first child, latter-born children are associated with
worse home environments – both in cognitive stimulation and emotional support – by nearly
3 to 9 points or approximately 0.2 to 0.35 standard deviations on the HOME score scale.
This negative relationship is especially pronounced for the cognitive home environment score,
where there exists a monotonically decreasing relationship between the quality of the home
environment and birth order.
4.2 Birth Order and Test Scores
Having established that there are significant differences in cigarette usage, prenatal care,
breastfeeding, and early home environment across siblings of different birth order, we now
turn to the main research questions that we seek to address in this paper. First, are there
birth order effects in early cognitive and non-cognitive outcomes that mirror the patterns
found in adult outcomes? Second, if yes, can variations in pre and postnatal investments,
birth outcomes, and early home environments within a family explain these birth order
effects in cognitive and non-cognitive assessments?
Tables 6 and 7 and Tables 8 and 9 present our results for a wide range of cognitive and
non-cognitive test scores, respectively. For both types of assessments, all of the analyses
below use age-standardized percentile scores that are transformations of the raw scores that
were originally designed to have a normal distribution with a mean of 100 and a standard
child characteristics or performing propensity score matching using these sets of controls.24Todd and Wolpin (2007) find that equalizing home inputs at the average levels of white children would
close the black-white and the Hispanic-white test score gaps in math and reading about 10 to 20%.
22
Birth Order & Early Investments Lehmann, Nuevo-Chiquero, and Vidal-Fernandez
deviation of 15. For ease of interpretation, all scores have been normalized to have a standard
deviation of 1 throughout the paper. Therefore, the regression coefficients show the change
in standard deviations of the test score by a one unit increase in the explanatory variable.
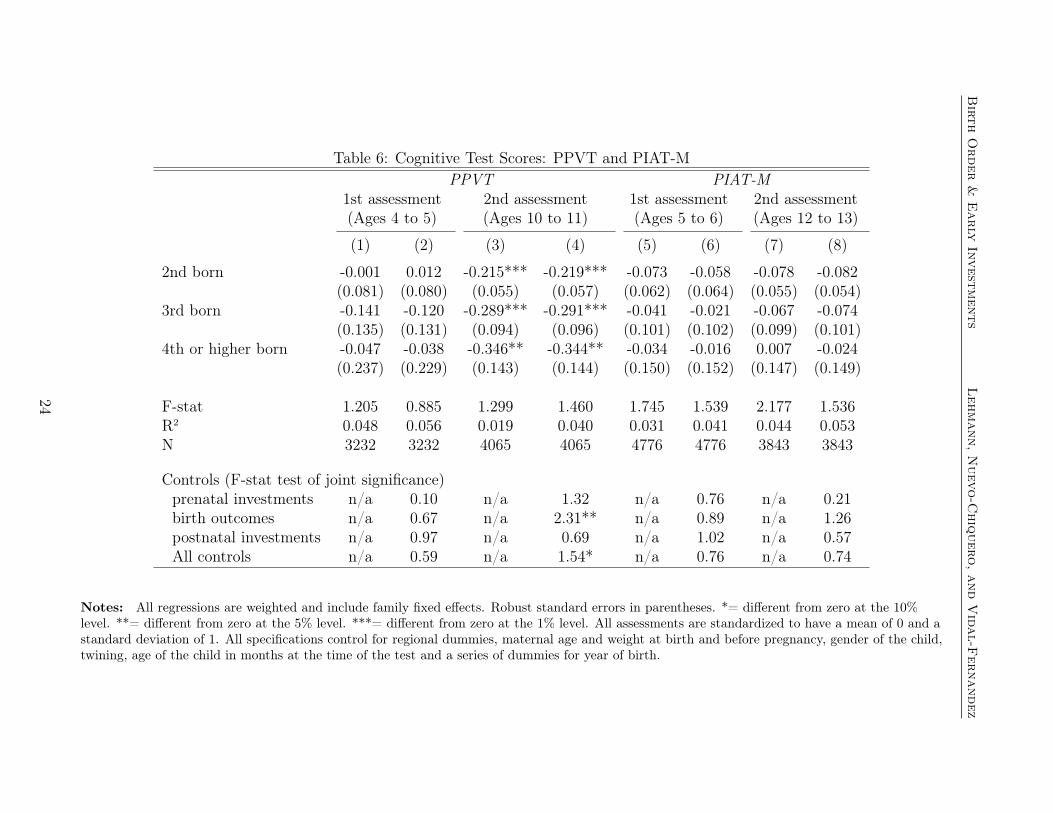
4.2.1 Cognitive Test Scores
Tables 6 and 7 examine birth order effects for early and later cognitive assessments for
PPVT, PIAT-M, and PIAT-R tests. The odd columns of Tables 6 and 7 report regression
results without early childhood controls while the even columns report results controlling for
prenatal investment, birth outcomes, and postnatal investments, including HOME scores.25
We first focus on discussing the results in odd columns of Tables 6 and 7 without early
childhood controls. Consistent with the existing literature on adult education and earnings,
children of higher birth order tend to score significantly lower across several cognitive as-
sessments. However, this negative relationship between test scores and birth order is not
statistically robust across all assessments. For the PPVT, the birth order effect is only evident
and significant in the second assessment (column 3). Compared to first-borns, second-born
children score about 0.2 standard deviations lower at age 10 to 11 while the third and the
higher ordered children score about 0.3 standard deviations lower. This increase in magni-
tude and significance of the birth order effect by time of second assessment may be due to
differences in unobserved parental investments between the ages of 4-5 and 10-11 by birth
order or the effect being latent until age 10-11. To place the magnitudes of these birth order
effects in perspective, note that Lang and Sepulveda (2007) find a black-white gap in the
PPVT at ages 3 to 4 of about 0.5 standard deviations after controlling for a myriad of mother
and family controls, including mother’s AFQT, parental interactions and the HOME score,
pregnancy and early life history, and family structure. Thus, a gap of 0.2 to 0.3 standard
deviations among siblings in the same family is quite substantial. While the coefficients on
higher birth order dummies are remain predominantly negative for the mathematics portion25To minimize the dramatic sample reduction due to missing HOME scores, we replace missing HOME
scores with zero and include an indicator for missing.
23
Birth
Order
&Early
Investm
ents
Leh
mann,N
uevo
-Chiq
uero
,and
Vid
al-F
ernandez
Table 6: Cognitive Test Scores: PPVT and PIAT-MPPVT PIAT-M
1st assessment 2nd assessment 1st assessment 2nd assessment(Ages 4 to 5) (Ages 10 to 11) (Ages 5 to 6) (Ages 12 to 13)
(1) (2) (3) (4) (5) (6) (7) (8)
2nd born -0.001 0.012 -0.215*** -0.219*** -0.073 -0.058 -0.078 -0.082(0.081) (0.080) (0.055) (0.057) (0.062) (0.064) (0.055) (0.054)
3rd born -0.141 -0.120 -0.289*** -0.291*** -0.041 -0.021 -0.067 -0.074(0.135) (0.131) (0.094) (0.096) (0.101) (0.102) (0.099) (0.101)
4th or higher born -0.047 -0.038 -0.346** -0.344** -0.034 -0.016 0.007 -0.024(0.237) (0.229) (0.143) (0.144) (0.150) (0.152) (0.147) (0.149)
F-stat 1.205 0.885 1.299 1.460 1.745 1.539 2.177 1.536R2 0.048 0.056 0.019 0.040 0.031 0.041 0.044 0.053N 3232 3232 4065 4065 4776 4776 3843 3843
Controls (F-stat test of joint significance)prenatal investments n/a 0.10 n/a 1.32 n/a 0.76 n/a 0.21birth outcomes n/a 0.67 n/a 2.31** n/a 0.89 n/a 1.26postnatal investments n/a 0.97 n/a 0.69 n/a 1.02 n/a 0.57All controls n/a 0.59 n/a 1.54* n/a 0.76 n/a 0.74
Notes: All regressions are weighted and include family fixed effects. Robust standard errors in parentheses. *= different from zero at the 10%level. **= different from zero at the 5% level. ***= different from zero at the 1% level. All assessments are standardized to have a mean of 0 and astandard deviation of 1. All specifications control for regional dummies, maternal age and weight at birth and before pregnancy, gender of the child,twining, age of the child in months at the time of the test and a series of dummies for year of birth.
24
Birth
Order
&Early
Investm
ents
Leh
mann,N
uevo
-Chiq
uero
,and
Vid
al-F
ernandez
Table 7: Cognitive Test Scores: PIAT-R (Recognition) and PIAT-R (Comprehension)PIAT-R (Recognition) PIAT-R (Comprehension)
1st assessment 2nd assessment 1st assessment 2nd assessment(Ages 5 to 6) (Ages 12 to 13) (Ages 5 to 6) (Ages 12 to 13)
(1) (2) (3) (4) (5) (6) (7) (8)
2nd born -0.217*** -0.245*** -0.163*** -0.170*** -0.035 -0.059 -0.244*** -0.246***(0.057) (0.058) (0.057) (0.058) (0.110) (0.111) (0.067) (0.067)
3rd born -0.199** -0.236** -0.204* -0.210* -0.084 -0.185 -0.291** -0.298**(0.096) (0.098) (0.109) (0.109) (0.202) (0.206) (0.117) (0.117)
4th or higher born -0.371** -0.422*** -0.267* -0.283* 0.145 0.109 -0.386** -0.390**(0.145) (0.147) (0.155) (0.153) (0.282) (0.282) (0.172) (0.172)
F-stat 4.789 3.624 1.142 1.146 12.215 9.535 2.812 2.313R2 0.084 0.099 0.016 0.029 0.368 0.422 0.052 0.068N 4687 4687 3844 3844 1948 1948 3813 3813
Controls (F-stat test of joint significance)prenatal investments n/a 0.48 n/a 0.59 n/a 1.92* n/a 0.56birth outcomes n/a 2.66** n/a 1.87* n/a 2.19** n/a 1.38postnatal investments n/a 1.09 n/a 0.65 n/a 1.23 n/a 1.06All controls n/a 1.45* n/a 1.07 n/a 2.47*** n/a 1.20
Notes: All regressions are weighted and include family fixed effects. Robust standard errors in parentheses. *= different from zero at the 10%level. **= different from zero at the 5% level. ***= different from zero at the 1% level. All assessments are standardized to have a mean of 0 and astandard deviation of 1. All specifications control for regional dummies, maternal age and weight at birth and before pregnancy, gender of the child,twining, age of the child in months at the time of the test and a series of dummies for year of birth.
25

Birth Order & Early Investments Lehmann, Nuevo-Chiquero, and Vidal-Fernandez
of the PIAT, we do not find statistically significant differences across siblings of different
birth order.
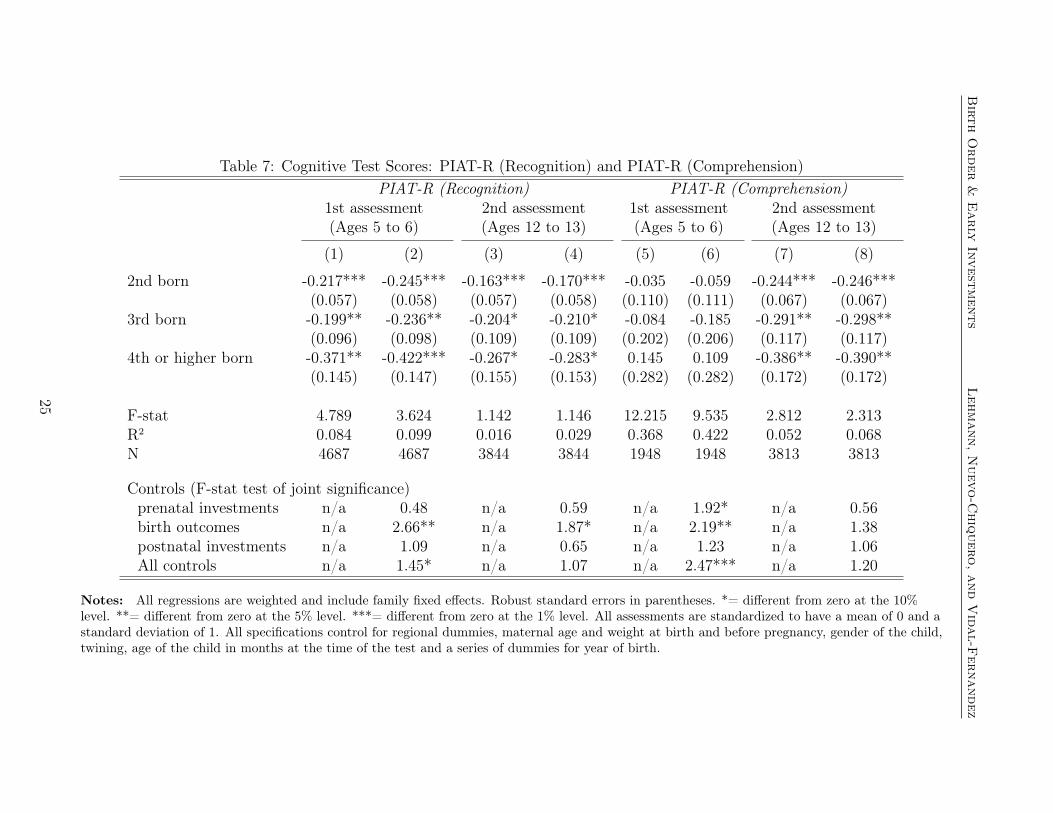
Turning to the PIAT-Reading tests in Table 7, we find evidence that children of higher
birth order perform significantly worse on the PIAT-R Recognition test at both early and
later assessments. At ages 5 to 6, a second-born and a third-born will score 0.2 standard
deviations lower on the PIAT-R Recognition test, while fourth and higher birth order children
will score 0.37 standard deviations lower (column 1). These negative birth order effects
are sustained in both their magnitude and statistical significance at the beginning of their
adolescence (column 3). While there is no evidence of birth order effects in the comprehension
portion of PIAT-R at ages 5 to 6, we find large and statistically significant differences in
the second assessment, with younger children scoring 0.25 to 0.4 standard deviations lower
compared to the first-born in the same family. These results are robust to changing the age
of 2nd assessment, and to restricting the sample to children who took both tests. The sizes
of these birth order effects are notable considering that they are similar to the black-white
gap in the PIAT-R scores of 0.3 to 0.4 standard deviations found in Fryer and Levitt (2004)
at grade 5 and significantly larger than the black-white gap of 0.17 standard deviations
reported in Lang and Sepulveda (2007) for the same age group after controlling for the
mother’s AFQT.
In summary, with the exception of PIAT-Mathematics for which we do not find evidence
of birth order effects at either the first or the second assessment, we find strong evidence of
a large negative relationship between birth order and test scores, especially at ages 10 to 13.
The magnitudes of these birth effects are fairly consistent across all tests, with the second-
born scoring about 0.2 standard deviations lower than the first-born and the higher-order
children scoring lower by 0.3 to 0.4 standard deviations.
To investigate whether these birth order effects found in PPVT and PIAT-R Recognition
tests are robust to accounting for differences in pre/postnatal investments, birth outcomes,
and home environments, we add these controls in the even columns. Despite our finding that
26
Birth Order & Early Investments Lehmann, Nuevo-Chiquero, and Vidal-Fernandez
there some significant differences in early childhood conditions across children of different
birth order, the observed differences in cognitive scores by birth order are robust to con-
trolling for these factors. Neither the magnitude nor the statistical significance of the birth
order effects is changed by the addition of these controls. Nonetheless, as we can see at the
bottom of table 7, birth outcomes are jointly significantly correlated with test scores.26
4.2.2 Non-Cognitive Tests
We now test for the presence of birth order effects in non-cognitive assessments and inves-
tigate whether early childhood conditions can explain any differences in these alternative
measures of children’s mental and social development across children of different birth order
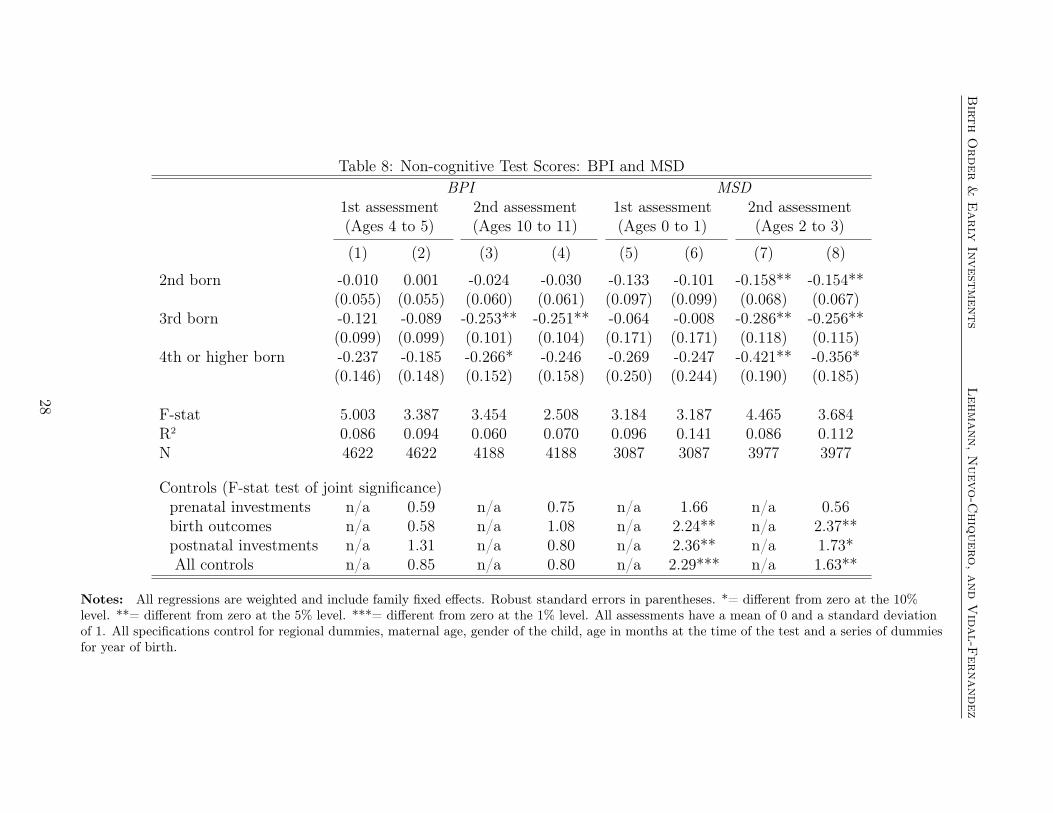
in the same family. Tables 8 and 9 report these results.
Examining the Behavioral Problem Index (BPI) in columns (1) and (3) in Table 8, we
find that younger siblings are reported to have less behavior problems than older children. At
ages 10 to 11, a child with two older siblings scores about 0.25 standard deviations lower than
a first- or a second-born child. While not statistically significant in the first assessment, the
point estimates are of still substantial magnitude. Although these results may be surprising
given the strongly negative birth order effects in cognitive outcomes, we note that there exists
some ambiguity in whether a lower BPI score truly captures what is a “better” behavior. For
example, the BPI section of the CNLSY79 questionnaire includes subsections on measures
of headstrongness and hyperactivity. While exhibiting greater stubbornness or hyperactivity
may lead to higher BPI scores, one may be able to argue that these characteristics can
be reflective of qualities that may have a positive influence on learning, risk-taking, and
persistence.
Despite having lower BPI scores than their older siblings, younger children perform worse
on the rest of non-cognitive assessments. We observe strong negative birth order effects in26The significant effect of birth outcomes on cognitive test scores is mainly driven by the positive impact of
birth weight on test scores. For PIAT-R Comprehension, we find a significantly negative effect of being bornprematurely. We do not find evidence of the importance of HOME scores ages 0 to 1. Detailed regressionresults for all tables are available upon request.
27
Birth
Order
&Early
Investm
ents
Leh
mann,N
uevo
-Chiq
uero
,and
Vid
al-F
ernandez
Table 8: Non-cognitive Test Scores: BPI and MSDBPI MSD
1st assessment 2nd assessment 1st assessment 2nd assessment(Ages 4 to 5) (Ages 10 to 11) (Ages 0 to 1) (Ages 2 to 3)
(1) (2) (3) (4) (5) (6) (7) (8)
2nd born -0.010 0.001 -0.024 -0.030 -0.133 -0.101 -0.158** -0.154**(0.055) (0.055) (0.060) (0.061) (0.097) (0.099) (0.068) (0.067)
3rd born -0.121 -0.089 -0.253** -0.251** -0.064 -0.008 -0.286** -0.256**(0.099) (0.099) (0.101) (0.104) (0.171) (0.171) (0.118) (0.115)
4th or higher born -0.237 -0.185 -0.266* -0.246 -0.269 -0.247 -0.421** -0.356*(0.146) (0.148) (0.152) (0.158) (0.250) (0.244) (0.190) (0.185)
F-stat 5.003 3.387 3.454 2.508 3.184 3.187 4.465 3.684R2 0.086 0.094 0.060 0.070 0.096 0.141 0.086 0.112N 4622 4622 4188 4188 3087 3087 3977 3977
Controls (F-stat test of joint significance)prenatal investments n/a 0.59 n/a 0.75 n/a 1.66 n/a 0.56birth outcomes n/a 0.58 n/a 1.08 n/a 2.24** n/a 2.37**postnatal investments n/a 1.31 n/a 0.80 n/a 2.36** n/a 1.73*All controls n/a 0.85 n/a 0.80 n/a 2.29*** n/a 1.63**
Notes: All regressions are weighted and include family fixed effects. Robust standard errors in parentheses. *= different from zero at the 10%level. **= different from zero at the 5% level. ***= different from zero at the 1% level. All assessments have a mean of 0 and a standard deviationof 1. All specifications control for regional dummies, maternal age, gender of the child, age in months at the time of the test and a series of dummiesfor year of birth.
28
Birth
Order
&Early
Investm
ents
Leh
mann,N
uevo
-Chiq
uero
,and
Vid
al-F
ernandez
Table 9: Non-cognitive Test Scores: SPPC Scholastic and SPPC GlobalSPPC Scholastic SPPC Global
1st assessment 2nd assessment 1st assessment 2nd assessment(Ages 8 to 9) (Ages 13 to 14) (Ages 8 to 9) (Ages 13 to 14)
(1) (2) (3) (4) (5) (6) (7) (8)
2nd born -0.169 -0.228* -0.270*** -0.310*** -0.333*** -0.326** -0.183** -0.209**(0.136) (0.136) (0.096) (0.094) (0.129) (0.136) (0.087) (0.087)
3rd born -0.227 -0.305 -0.477*** -0.517*** -0.497** -0.501** -0.260* -0.306*(0.255) (0.249) (0.169) (0.165) (0.228) (0.237) (0.155) (0.157)
4th or higher born -0.077 -0.202 -0.391 -0.460* -0.593* -0.592* -0.414* -0.511**(0.389) (0.392) (0.260) (0.249) (0.326) (0.341) (0.250) (0.251)
F-stat 1.834 1.752 1.557 1.833 1.651 1.514 1.114 1.388R2 0.039 0.063 0.045 0.073 0.048 0.084 0.023 0.052N 2508 2508 2943 2943 2507 2507 2943 2943
Controls (F-stat test of joint significance)prenatal investments n/a 0.91 n/a 0.57 n/a 0.96 n/a 1.69birth outcomes n/a 0.55 n/a 1.66 n/a 1.55 n/a 2.10**postnatal investments n/a 0.96 n/a 1.77* n/a 1.65 n/a 0.80All controls n/a 0.99 n/a 1.68** n/a 1.29 n/a 1.46*
Notes: All regressions are weighted and include family fixed effects. Robust standard errors in parentheses. *= different from zero at the 10%level. **= different from zero at the 5% level. ***= different from zero at the 1% level. All assessments have a mean of 0 and a standard deviationof 1. All specifications control for regional dummies, maternal age, gender of the child, age in months at the time of the test and a series of dummiesfor year of birth.
29

Birth Order & Early Investments Lehmann, Nuevo-Chiquero, and Vidal-Fernandez
the motor and social development (MSD) assessment at very early ages (Table 8, columns
5 and 7). In the second assessment, for which the results are more precise, a second-born
child scores approximately 0.15 standard deviations lower on the MSD than the first-born,
with the third and the fourth (and higher) children scoring 0.3 to 0.4 standard deviations
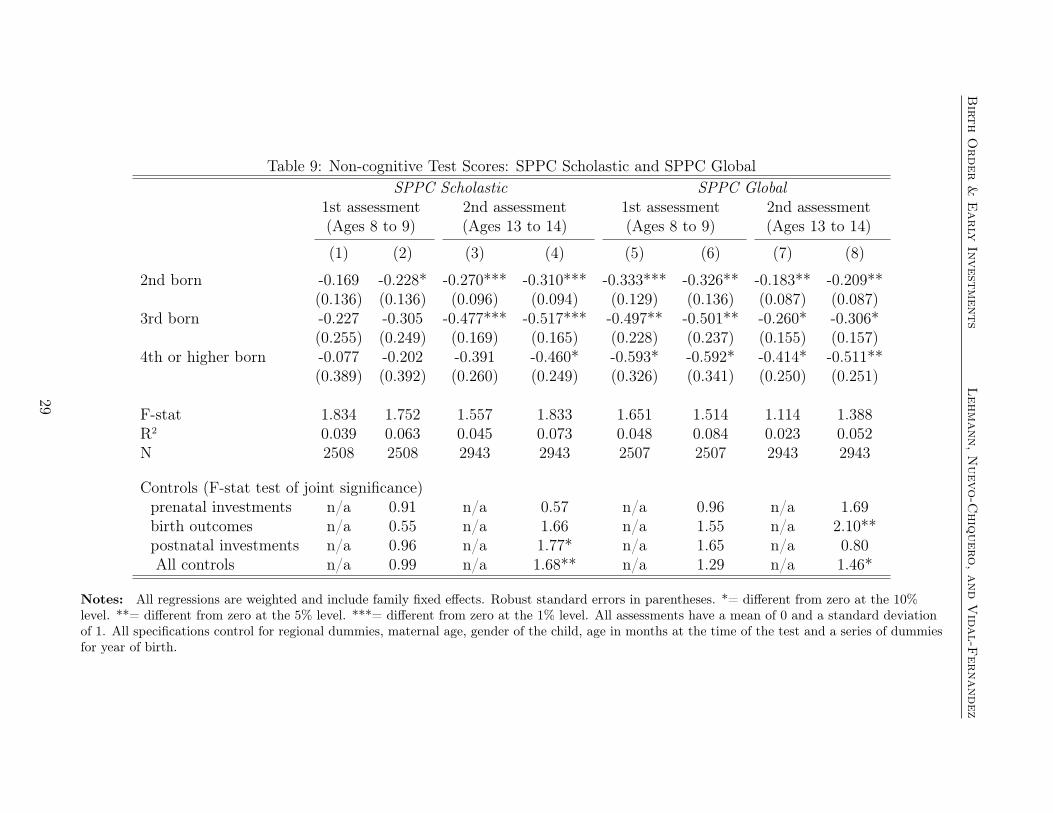
lower. In Table 9, we also find that there is a strong negative birth order effect on both
scholastic and global measures of self-worth (SPPC), yet slightly different trends for the two
measures. The negative effects of higher birth order appear to be reinforced with age for
the scholastic SPPC, although the estimates in the first assessment lack precision, ranging
from a difference of 0.17 to 0.27 standard deviations between the second- and the first-
born. However, the global measures of self-worth reveal, if anything, evidence of an opposite
trend: a first-born scores 0.33 standard deviations better than the second-born at ages 8
to 9 but only 0.18 standard deviations better at ages 13 to 14. The trends are similar for
higher-birth order children. However, for both scales of SPPC, there exists a significant and
large negative relationship between birth order and the children’s self-reported sense of self-
worth. Psychological literature has found that there is a statistically significant correlation
between measures of self-worth as a teenager and educational attainment (Bachman and
O’Malley 1977). Thus, differences in the children’s view of self and confidence may be a
channel through which early childhood environment can contribute to birth order differences
in adult outcomes.
To investigate whether these significant birth order effects found in the BPI, MSD, and
SPPC assessments are robust to accounting for differences in early childhood conditions, we
add these controls in the even columns of Tables 8 and 9 and report the F-statistics for the
test of joint significance of each subset of added controls. Again, as in the case of cognitive
tests, differences in early investments and conditions, including HOME scores, fail to account
for the large observed birth order effect on non-cognitive tests. In fact, the inclusion of early
childhood conditions appear to increase the size of birth order effects on SPPC scores.27
27Again, detailed regression results from Tables 8 and 9 are available upon request. The significant effectof birth outcomes on cognitive test scores is again mainly driven by negative impact of being overweight or
30

Birth Order & Early Investments Lehmann, Nuevo-Chiquero, and Vidal-Fernandez
In summary, although we find significant differences in pre/postnatal investments, birth
outcomes, and home environment across children of different birth order, these early child-
hood conditions fail to explain the negative relationship between birth order and measures
of cognitive and non-cognitive outcomes in our data. These results are robust to including
controls for family income and welfare payments and mother’s employment status as well
as the presence of the birth father in the household at the time of the assessment. Further,
restricting the sample to children with scores from both the first and the second assessments
do not alter our main results.28
4.3 Differences in Educational Attainment by Birth Order: The
Role of Early Investments and Early Test Scores
To place our results in the context of existing literature, we now turn to investigating the
presence of and the potential sources of birth order effects in educational attainment, an
outcome that has been the focus of most previous studies on birth order. Table 10 presents
the results for years of education completed and high school graduation. College attendance
provides similar results as high school graduation, but the estimates are too imprecise to
warrant further investigation. We measure educational attainment in the latest survey year
2010 to include as many observations as possible of individuals with completed education.
All specifications include cohort controls to account for the obvious impact of age on years
of completed education.
First, we find evidence of birth order effects in educational attainment, similar to the
findings in the previous literature. Second-born children, on average, have about 0.5 less years
of education than first-borns, and this difference increases to 0.8 years for third children and
to more than a year for fourth and higher-ordered children (Table 10, column 1).29 The size of
underweight at birth on test scores. We find some evidence of a positive impact of cognitive and emotionalhome environment on MSD scores at 2nd assessment.
28The sample restriction yields similar point estimates, however, due to the decreased sample size, theestimates are not as precise and we lose some statistical significance.
29The results below are robust to a more restrictive specification in which we restrict the sample to those
31

Birth Order & Early Investments Lehmann, Nuevo-Chiquero, and Vidal-Fernandez
Table 10: Birth order and Educational AttainmentYears of Education
(1) (2) (3) (4) (5)2nd born -0.460*** -0.411*** -0.267* -0.264 -0.231
(0.120) (0.116) (0.137) (0.229) (0.224)3rd born -0.789*** -0.728*** -0.502** -0.140 -0.509
(0.222) (0.217) (0.252) (0.431) (0.409)4th or higher born -1.057*** -1.003*** -0.637* -0.758 -1.230**
(0.388) (0.372) (0.345) (0.622) (0.589)
F-stat 28.872 17.415 21.116 14.368 12.388R2 0.327 0.339 0.362 0.536 0.621N 4496 4496 3075 1612 1458
Controls (F-test for joint significance)Early investments n/a 1.71** n/a n/a 3.43***Cognitive scores n/a n/a 11.11*** n/a 2.01*Non-cognitive scores n/a n/a n/a 5.95*** 4.88***
High school graduate
(1) (2) (3) (4) (5)2nd born -0.030** -0.028* -0.025* -0.005 0.006
(0.015) (0.016) (0.015) (0.015) (0.017)3rd born -0.064** -0.059** -0.053* 0.013 0.039
(0.030) (0.030) (0.031) (0.025) (0.039)4th or higher born -0.062 -0.057 -0.066 0.014 0.055
(0.045) (0.047) (0.044) (0.034) (0.047)
R2 0.020 0.023 0.029 0.050 0.261N 4218 4218 2841 1391 1252
Controls (F-test for joint significance)Early investments n/a 0.58 n/a n/a 0.60Cognitive scores n/a n/a 2.97** n/a 0.71Non-cognitive scores n/a n/a n/a 0.58 0.34
Notes: All regressions are weighted and include family fixed effects. Robust standard errors inparentheses. *= different from zero at the 10% level. **= different from zero at the 5% level. ***=different from zero at the 1% level. All specifications control for regional dummies, maternal age, gender,multiple birth and a series of dummies for year of birth. Education attainment is measured in 2010, andhigh school graduation is defined for children over 20. Cognitive and non-cognitive scores correspond to thesecond assessment.
who are at least 20 years old.
32

Birth Order & Early Investments Lehmann, Nuevo-Chiquero, and Vidal-Fernandez
these birth effects on educational attainment is comparable to the finding in Kantarevic and
Mechoulan (2006) in which the first-born tend to receive 0.4 to 0.9 years of more education
compared to higher-ordered children.
The bottom panel of Table 10 presents the results for high school completion for children
who were at least 20 years old by 2010. We find that higher order children are between 3
and 6 percentage points less likely to graduate from high school than the first-born.
4.3.1 The Role of Early Investments
Column 2 of Table 10 shows the robustness of the birth order effect in educational attainment
when controlling for pre/postnatal investment and birth outcomes. Similar to cognitive and
non-cognitive tests, differences in early investments do not appear to drive the birth order
effect in educational attainment. Although better early investments (particularly in the case
of postnatal investments, such as breastfeeding or HOME scores) are associated with higher
educational attainment even within the same family, our results show that these dispari-
ties are not the main driving forces behind the observed birth order effect on educational
attainment.
4.3.2 Early Test Scores and Years of Education Completed
In Tables 6 through 9, we observed strong birth order effects in both cognitive and non-
cognitive outcomes in the children’s early years. Columns 3 and 4 of Table 10 test whether
these observed differences in cognitive and non-cognitive outcomes early in life can explain
differences in educational attainment in adulthood.30 We choose to focus on test scores from
the second assessment, because differences in scores by birth order appear most strongly in
early adolescence in our data. Furthermore, controlling for the first assessments decreases
our sample size by a significantly larger number than with the second assessments, and we30The results are robust to restricting the sample to children reporting early investment and both cognitive
and non-cognitive scores at age of second assessment.
33

Birth Order & Early Investments Lehmann, Nuevo-Chiquero, and Vidal-Fernandez
are able to retain a much larger statistical power by focusing on the second.31
As shown in column (3), cognitive test scores have, as expected, some predictive power
in explaining differences in years of education completed, especially PIAT-M and PIAT-R
Recognition scores. Additionally, cognitive scores at adolescence appear to partially explain
the birth order effect, reducing the magnitude by about 35 percent.32 We obtain similar
results when we control for non-cognitive test scores (column 4), mainly driven by measures
of self-worth and behavior problems. Test for the joint significance of the non-cognitive
scores reveal that early non-cognitive outcomes are significant predictors of years of education
completed. Non-cognitive scores are also able to partially explain the birth order effects in
educational attainment, reducing the size of the birth order effects by similar magnitudes as
the addition of cognitive test controls, at least for the second-born. However, the addition
of all non-cognitive as controls substantially reduces our sample size, and the birth order
effects lose their statistical significance.
In order to shed a greater light on the underlying channels behind the birth order effects
in educational attainment, we run a “horse race” in column (5) between the three potential
explanations explored in Table 10. While the estimates lose their significance due to the large
drop in sample size, the point estimates remain very similar to columns (3) and (4), with
the birth order effects being reduced by at least 0.2 years of education for the second- and
third-born children, while higher-ordered children still showing significantly lower educational
attainment when compared to the first-born.
The reduction of the birth order effects in educational attainment when controlling for
cognitive test scores is not reflected in the share of children that completed high school
(bottom panel of Table 10, columns 3 to 5). While cognitive test scores, in particular PIAT-31Using the cognitive scores from the first assessments reduces our sample size from 4496 in column (2)
to 912 in column (3), 489 in column (4), and a mere 112 in column (5). Controlling for test scores from thefirst assessments despite this dramatic reduction in sample size reveals that the size of the birth order effectson years of education completed is robust to the addition of these controls. Early cognitive assessments donot have much explanatory power for years of education while non-cognitive scores, especially SPPC, havesome predictive power.
32However, we cannot reject the null that the size of the birth order effects are equal between columns (2)and (3) or between columns (2) and (4).
34
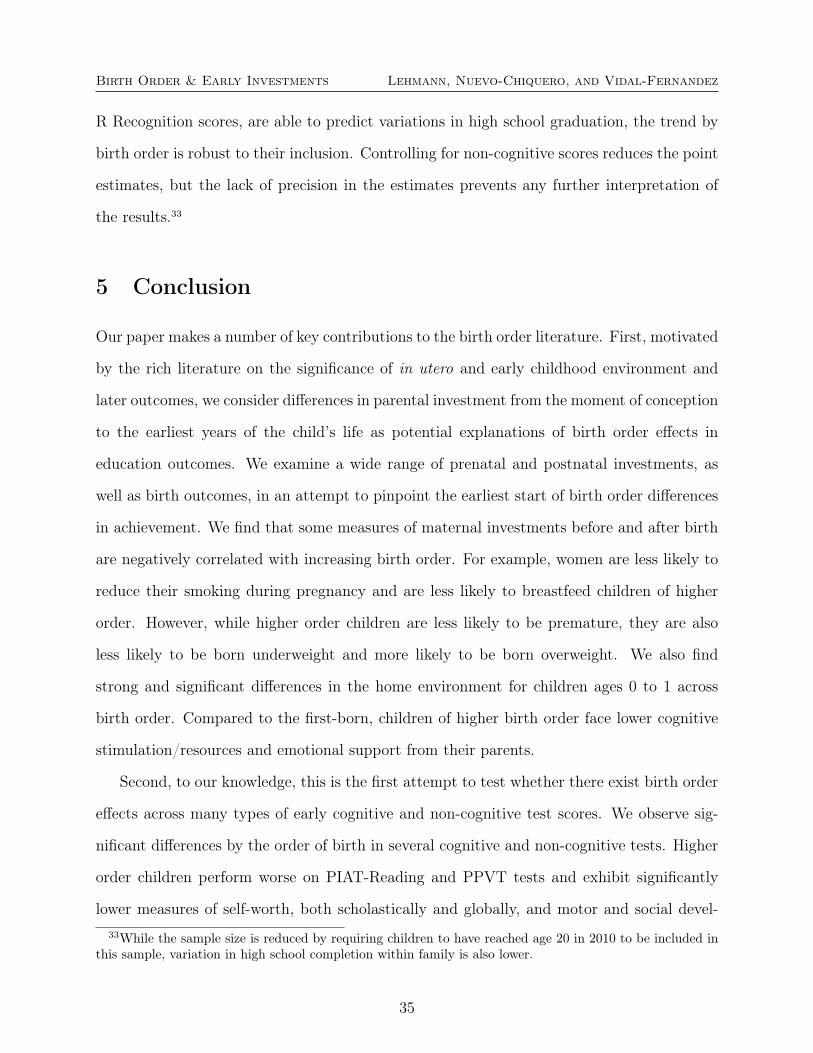
Birth Order & Early Investments Lehmann, Nuevo-Chiquero, and Vidal-Fernandez
R Recognition scores, are able to predict variations in high school graduation, the trend by
birth order is robust to their inclusion. Controlling for non-cognitive scores reduces the point
estimates, but the lack of precision in the estimates prevents any further interpretation of
the results.33
5 Conclusion
Our paper makes a number of key contributions to the birth order literature. First, motivated
by the rich literature on the significance of in utero and early childhood environment and
later outcomes, we consider differences in parental investment from the moment of conception
to the earliest years of the child’s life as potential explanations of birth order effects in
education outcomes. We examine a wide range of prenatal and postnatal investments, as
well as birth outcomes, in an attempt to pinpoint the earliest start of birth order differences
in achievement. We find that some measures of maternal investments before and after birth
are negatively correlated with increasing birth order. For example, women are less likely to
reduce their smoking during pregnancy and are less likely to breastfeed children of higher
order. However, while higher order children are less likely to be premature, they are also
less likely to be born underweight and more likely to be born overweight. We also find
strong and significant differences in the home environment for children ages 0 to 1 across
birth order. Compared to the first-born, children of higher birth order face lower cognitive
stimulation/resources and emotional support from their parents.
Second, to our knowledge, this is the first attempt to test whether there exist birth order
effects across many types of early cognitive and non-cognitive test scores. We observe sig-
nificant differences by the order of birth in several cognitive and non-cognitive tests. Higher
order children perform worse on PIAT-Reading and PPVT tests and exhibit significantly
lower measures of self-worth, both scholastically and globally, and motor and social devel-33While the sample size is reduced by requiring children to have reached age 20 in 2010 to be included in
this sample, variation in high school completion within family is also lower.
35
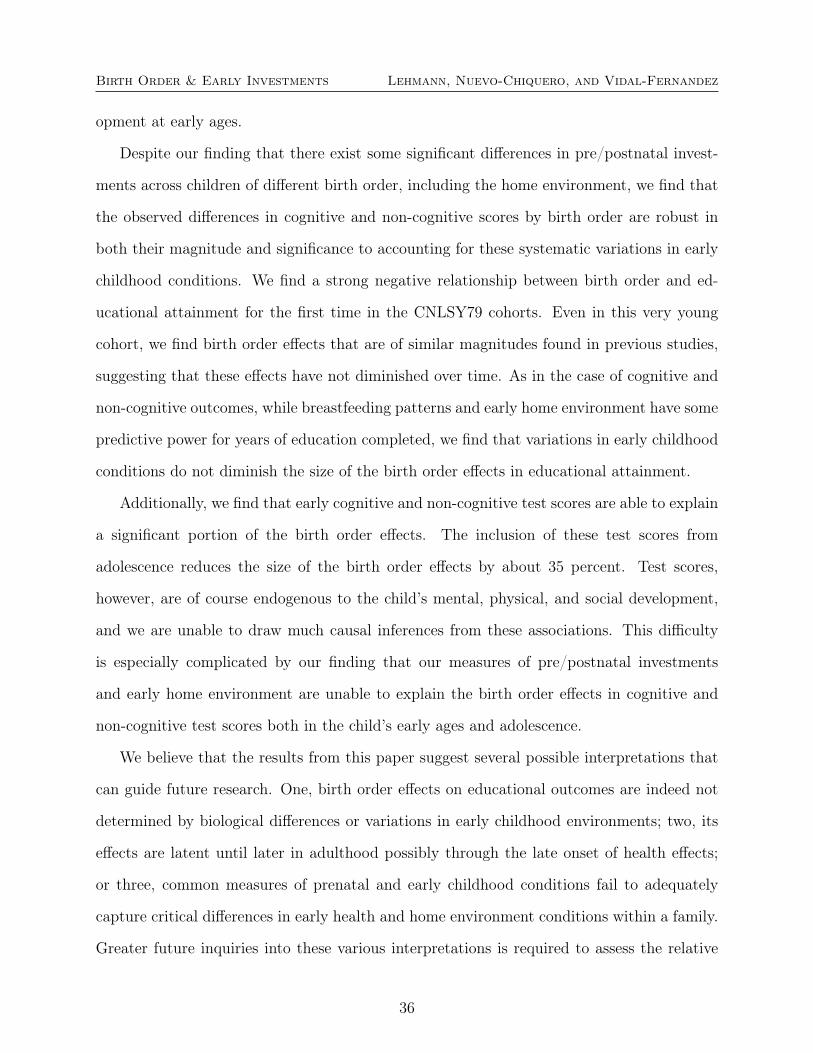
Birth Order & Early Investments Lehmann, Nuevo-Chiquero, and Vidal-Fernandez
opment at early ages.
Despite our finding that there exist some significant differences in pre/postnatal invest-
ments across children of different birth order, including the home environment, we find that
the observed differences in cognitive and non-cognitive scores by birth order are robust in
both their magnitude and significance to accounting for these systematic variations in early
childhood conditions. We find a strong negative relationship between birth order and ed-
ucational attainment for the first time in the CNLSY79 cohorts. Even in this very young
cohort, we find birth order effects that are of similar magnitudes found in previous studies,
suggesting that these effects have not diminished over time. As in the case of cognitive and
non-cognitive outcomes, while breastfeeding patterns and early home environment have some
predictive power for years of education completed, we find that variations in early childhood
conditions do not diminish the size of the birth order effects in educational attainment.
Additionally, we find that early cognitive and non-cognitive test scores are able to explain
a significant portion of the birth order effects. The inclusion of these test scores from
adolescence reduces the size of the birth order effects by about 35 percent. Test scores,
however, are of course endogenous to the child’s mental, physical, and social development,
and we are unable to draw much causal inferences from these associations. This difficulty
is especially complicated by our finding that our measures of pre/postnatal investments
and early home environment are unable to explain the birth order effects in cognitive and
non-cognitive test scores both in the child’s early ages and adolescence.
We believe that the results from this paper suggest several possible interpretations that
can guide future research. One, birth order effects on educational outcomes are indeed not
determined by biological differences or variations in early childhood environments; two, its
effects are latent until later in adulthood possibly through the late onset of health effects;
or three, common measures of prenatal and early childhood conditions fail to adequately
capture critical differences in early health and home environment conditions within a family.
Greater future inquiries into these various interpretations is required to assess the relative
36
Birth Order & Early Investments Lehmann, Nuevo-Chiquero, and Vidal-Fernandez
strengths of these hypotheses.
Finally, in light of the strong relationship between measures of self-worth at adolescence
and educational attainment as well as the significant relationship between early home en-
vironment and the SPPC scores, we surmise that a magnification of difference in children’s
early family investments and environments through the early years on the children’s view of
self-worth, motivation, and parent-imposed expectations may be a potential channel through
birth order effects in adult outcomes may arise. In that vein, a recent study examining the
relationship between adolescent depression and labor market outcomes using a school-based,
longitudinal study on health-related behaviors in the U.S. find that individuals with depres-
sive symptoms as an adolescent experienced 5 percentage point reductions in labor force
attachment and approximately 20% reduction in adult earnings (Fletcher 2012). Further
exploring the origins of birth order differences in the children’s view of self and parental
expectations using rigorous statistical techniques may shed some light on the unexplained
relationship between higher birth order and lower achievement in adolescence and adulthood.
37
Birth Order & Early Investments Lehmann, Nuevo-Chiquero, and Vidal-Fernandez
References
Almond, Douglas and Janet Currie (2010) “Human capital development before age five,”
NBER Working Papers 15827, National Bureau of Economic Research, Inc.
Angrist, Joshua D. and William N. Evans (1998) “Children and Their Parents’ Labor Supply:
Evidence from Exogenous Variation in Family Size,” The American Economic Review,
Vol. 88, No. 3, pp. 450–477.
Bachman, Jerald G. and Patrick M. O’Malley (1977) “Self-esteem in young men: A longitu-
dinal analysis of the impact of educational and occupational attainment.,” Journal of
Personality and Social Psychology, Vol. 35, No. 6, pp. 365–380.
Baker, Paula C., Canada K. Keck, Frank L. Mott, and Stephen V. Quinlan (1993) The
NLSY Child Handbook 1993: A Guide and Resource Document for the NLSY of Youth
- Child Data: Columbus, OH: Center for Human Resource Research, The Ohio State
University.
Barker, David J. (1990) “The fetal and infant origins of adult disease.,” British Medical
Journal, Vol. 301, No. 6761, p. 1111.
Behrman, Jere R. and Paul Taubman (1986) “Birth order, schooling, and earnings,” Journal
of Labor Economics, Vol. 4, No. 3, pp. 121–145.
Belfield, C.R. and I.R. Kelly (2010) “The Benefits of Breastfeeding Across the Early Years of
Childhood,” NBER Working Papers 16496, National Bureau of Economic Research.
Birdsall, N. (1991) “Birth order effects and time allocation.,” Research in population eco-
nomics, Vol. 7, p. 191.
Black, Sandra E., Paul J. Devereux, and Kjell G. Salvanes (2005) “The More the Merrier?
The Effect of Family Size and Birth Order on Children’s Education,” Quarterly Journal
of Economics, Vol. 120, No. 2, pp. 669–700.
38
Birth Order & Early Investments Lehmann, Nuevo-Chiquero, and Vidal-Fernandez
(2007a) “From the Cradle to the Labor Market? The Effect of Birth Weight on Adult
Outcomes*,” The Quarterly Journal of Economics, Vol. 122, No. 1, pp. 409–439.
(2007b) “Older and wiser? Birth order and IQ of young men,” NBER Working Paper
#13237.
Blake, J. (1989) Family size and achievement, Vol. 3: University of California Press.
Booth, Alison L. and Hiau Joo Kee (2009) “Birth order matters: the effect of family size
and birth order on educational attainment,” Journal of Population Economics, Vol.
22, No. 2, pp. 367–397.
Carlson, M.J. and M.E. Corcoran (2001) “Family structure and children’s behavioral and
cognitive outcomes,” Journal of Marriage and Family, Vol. 63, No. 3, pp. 779–792.
CDC (2001) “Women and smoking: a report of the Surgeon General,”Technical report, US
Department of Health and Human Services, Atlanta, GA.
(2004) “The health consequences of smoking: a report of the Surgeon Gen-
eral,”Technical report, US Department of Health and Human Services, Atlanta, GA.
Chung, M., G. Raman, P. Chew, N. Magula, T. Trikalinos, and J. Lau (2007) “Breastfeeding
and maternal and infant health outcomes in developed countries,” Evid Technol Asses
(Full Rep), Vol. 153, pp. 1–186.
Cunha, Glavio and James J. Heckman (2007) “The economics of human development: The
technology of skill formation,” The American economic review, Vol. 97, No. 2, pp.
31–47.
Currie, Janet and Jeffrey Grogger (2002) “Medicaid expansions and welfare contractions:
offsetting effects on prenatal care and infant health?” Journal of Health Economics,
Vol. 21, No. 2, pp. 313–335.
39
Birth Order & Early Investments Lehmann, Nuevo-Chiquero, and Vidal-Fernandez
Dominguez-Rojas, V., J. R. de Juanes-Pardo, P. Astasio-Arbiza, P. Ortega-Molina, and
E. Gordillo-Florencio (1994) “Spontaneous abortion in a hospital population: Are to-
bacco and coffee intake risk factors?” European Journal of Epidemiology, Vol. 10, pp.
665–668. 10.1007/BF01719278.
Ejrnæs, M. and C.C. Pörtner (2004) “Birth order and the intrahousehold allocation of time
and education,” Review of Economics and Statistics, Vol. 86, No. 4, pp. 1008–1019.
Eriksson, M., H. Wedel, M.A. Wallander, I. Krakau, J. Hugosson, S. Carlsson, and K. Svärd-
sudd (2007) “The impact of birth weight on prostate cancer incidence and mortality
in a population-based study of men born in 1913 and followed up from 50 to 85 years
of age,” The Prostate, Vol. 67, No. 11, pp. 1247–1254.
Fingerhut, L A, J C Kleinman, and J S Kendrick (1990) “Smoking before, during, and after
pregnancy.,” Am J Public Health, Vol. 80, No. 5, pp. 541–544.
Fletcher, Jason M. (2012) “Adolescent Depression and Adult Labor Market Outcomes,”
Working Paper 18216, National Bureau of Economic Research.
Fryer, R.G. and S.D. Levitt (2004) “Understanding the black-white test score gap in the first
two years of school,” Review of Economics and Statistics, Vol. 86, No. 2, pp. 447–464.
Gillman, M.W., S. Rifas-Shiman, C.S. Berkey, A.E. Field, and G.A. Colditz (2003) “Maternal
gestational diabetes, birth weight, and adolescent obesity,” Pediatrics, Vol. 111, No. 3,
pp. e221–e226.
Gluckman, Peter D. and Mark Hanson (2005) The fetal matrix: evolution, development, and
disease: Cambridge University Press.
Hanushek, E.A. (1992) “The Trade-off between Child Quantity and Quality,” The Journal
of Political Economy, Vol. 100, No. 1, pp. 84–117.
40
Birth Order & Early Investments Lehmann, Nuevo-Chiquero, and Vidal-Fernandez
Harder, T., A. Plagemann, and A. Harder (2008) “Birth weight and subsequent risk of
childhood primary brain tumors: a meta-analysis,” American journal of epidemiology,
Vol. 168, No. 4, pp. 366–373.
Heckman, J.J., J. Stixrud, and S. Urzua (2006) “The effects of cognitive and noncognitive
abilities on labor market outcomes and social behavior,”Technical report, National
Bureau of Economic Research #12006.
Heckman, James J. (2007) “The economics, technology, and neuroscience of human capability
formation,” Proceedings of the National Academy of Sciences, Vol. 104, No. 33, p.
13250.
Heckman, James J. and Dimitriy V. Masterov (2007) “The productivity argument for invest-
ing in young children,” Applied Economic Perspectives and Policy, Vol. 29, No. 3, p.
446.
Heiland, Frank (2009) “Does the birth order affect the cognitive development of a child?”
Applied Economics, Vol. 41, No. 14, pp. 1799–1818.
Hjalgrim, L.L., T. Westergaard, K. Rostgaard, K. Schmiegelow, M. Melbye, H. Hjalgrim,
and E.A. Engels (2003) “Birth weight as a risk factor for childhood leukemia: a meta-
analysis of 18 epidemiologic studies,” American journal of epidemiology, Vol. 158, No.
8, pp. 724–735.
Horwood, L.John and David M. Fergusson (1998) “Breastfeeding and later cognitive and
academic outcomes,” Pediatrics, Vol. 101, No. 1, p. e9.
Iacovou, Maria (2001) “Family composition and children’s educational outcomes,” ISER
Working Paper Series.
Kantarevic, Jasmin and Stéphane Mechoulan (2006) “Birth Order, Educational Attainment,
and Earnings,” Journal of Human Resources, Vol. 41, No. 4, pp. 755–777.
41
Birth Order & Early Investments Lehmann, Nuevo-Chiquero, and Vidal-Fernandez
Kessler, Daniel (1991) “Birth order, family size, and achievement: Family structure and wage
determination,” Journal of Labor Economics, pp. 413–426.
Knudsen, Eric I., James J. Heckman, Judy L. Cameron, and Jack P. Shonkoff (2006) “Eco-
nomic, neurobiological, and behavioral perspectives on building America’s future work-
force,” Proceedings of the National Academy of Sciences, Vol. 103, No. 27, p. 10155.
Lang, Kevin and Carlos E. Sepulveda (2007) “The Black-White Test Score Differential,”
Boston University Working Paper.
Leong, N.M., L.I. Mignone, P.A. Newcomb, L. Titus-Ernstoff, J.A. Baron, A. Trentham-
Dietz, M.J. Stampfer, W.C. Willett, and K.M. Egan (2003) “Early life risk factors in
cancer: the relation of birth weight to adult obesity,” International journal of cancer,
Vol. 103, No. 6, pp. 789–791.
Lewis, CT, TJ Mathews, and RL Heuser (1996) “Prenatal care in the United States, 1980-
94.,” Vital and health statistics. Series 21, Data on natality, marriage, and divorce,
No. 54, p. 1.
MacArthur, C and EG Knox (1988) “Smoking in pregnancy: effects of stopping at different
stages.,” Br J Obstet Gynaecol, Vol. 95, No. 6, pp. 551–555.
Monfardini, Chiara and Sarah Grace See (2011) “Birth Order and Child Outcomes: Does
Maternal Quality Time Matter?” Unpublished Manuscript.
Oddy, W.H., G.E. Kendall, E. Blair, N.H. De Klerk, F.J. Stanley, L.I. Landau, S. Silburn,
and S. Zubrick (2003) “Breast feeding and cognitive development in childhood: a
prospective birth cohort study,” Paediatric and perinatal epidemiology, Vol. 17, No. 1,
pp. 81–90.
Parish, W.L. and R.J. Willis (1993) “Daughters, education, and family budgets Taiwan
experiences,” Journal of Human Resources, pp. 863–898.
42
Birth Order & Early Investments Lehmann, Nuevo-Chiquero, and Vidal-Fernandez
Parsons, TJ, C. Power, S. Logan, CD Summerbell et al. (1999) “Childhood predictors of adult
obesity: a systematic review.,” International journal of obesity and related metabolic
disorders: journal of the International Association for the Study of Obesity, Vol. 23,
p. S1.
Peterson, James L. and Nicholas Zill (1986) “Marital disruption, parent-child relationships,
and behavior problems in children,” Journal of Marriage and the Family, pp. 295–307.
Pietiläinen, K.H., J. Kaprio, M. Räsänen, T. Winter, A. Rissanen, and R.J. Rose (2001)
“Tracking of body size from birth to late adolescence: contributions of birth length,
birth weight, duration of gestation, parents’ body size, and twinship,” American Jour-
nal of Epidemiology, Vol. 154, No. 1, pp. 21–29.
Price, Joseph (2008) “Parent-Child Quality Time,” Journal of Human Resources, Vol. 43,
No. 1, pp. 240–265.
Remes, ST, SP Patel, A.L. Hartikainen, M.R. Jarvelin, and J. Pekkanen (2008) “High birth
weight, asthma and atopy at the age of 16 yr,” Pediatric Allergy and Immunology, Vol.
19, No. 6, pp. 541–543.
Rodgers, Joseph Lee, H. Harrington Cleveland, Edwin van den Oord, and David C. Rowe
(2000) “Resolving the debate over birth order, family size, and intelligence.,” American
Psychologist, Vol. 55, No. 6, p. 599.
Smith-Conway, Karen and Partha Deb (2005) Journal of Health Economics, Vol. 24, No. 3,
pp. 489–513.
Strauss, R.S. and J. Knight (1999) “Influence of the home environment on the development
of obesity in children,” Pediatrics, Vol. 103, No. 6, pp. e85–e85.
43
Birth Order & Early Investments Lehmann, Nuevo-Chiquero, and Vidal-Fernandez
Todd, P.E. and K.I. Wolpin (2007) “The production of cognitive achievement in children:
Home, school, and racial test score gaps,” Journal of Human capital, Vol. 1, No. 1, pp.
91–136.
Wei, J.N., H.Y. Li, F.C. Sung, C.C. Lin, C.C. Chiang, C.Y. Li, and L.M. Chuang (2007)
“Birth Weight Correlates Differently with Cardiovascular Risk Factors in Youth&ast,”
Obesity, Vol. 15, No. 6, pp. 1609–1616.
Zajonc, R.B. (1976) “Family configuration and intelligence: Variations in scholastic aptitude
scores parallel trends in family size and the spacing of children.,” Science.
44