Embed Size (px)
Citation preview
1
Explaining Mass Support for Agricultural Protectionism
Evidence from a Survey Experiment During the Global Recession
Version 5.0: January 2010
Megumi Naoi Ikuo Kume
Assistant Professor Professor
Department of Political Science Faculty of Political Science & Economics
University of California, San Diego Waseda University, Tokyo
[email protected] [email protected]
Abstract: Why do citizens in advanced industrialized countries bear the high price of
agricultural products? Conventional wisdom suggests that agricultural interests secure
government protection because producers are concentrated and better politically organized
than diffused consumers. Due to its focus on producer capacity for collective action,
however, the literature fails to account for the high levels of mass support for agricultural
protectionism in advanced industrialized nations. This paper presents new evidence from a
survey experiment in Japan conducted during the current global recession (December 2008)
that accounts for this puzzle. Using randomly assigned visual stimuli, the experiment
activates respondents’ identification with either producer or consumer interests and
proceeds to ask attitudinal questions regarding food imports. The results suggest that
consumer-priming has no reductive or additive effects on the respondents’ support for
liberalizing food imports. Surprisingly, the producer-priming increases respondents’
opposition to food import, particularly among those who fear future job insecurity. We
further disentangle the puzzling finding that consumers think like producers for the issue of
food import along two mechanisms: “sympathy” for farmers and “projection” of their own
job insecurities. The results lend strong support to the projection hypothesis.
*We thank JSPA Grants-in-Aid for Scientific Research (A: Globalization and Domestic Politics, 2008-2012)
for financial support and Kiichiro Arai, Rieko Kage, Arata Kuno, Yoshitaka Nishizawa, Masahiko
Tatebayashi, Masaru Kohno, Kazunobu Hayakawa, Kengo Soga, Hiroki Mori, Yoshiko Kojo for their
comments and suggestions through the formulation and execution of this project and Kazumi Shimizu, Skip
Lupia, and Motoki Watanabe for being generous with their expertise on survey experiments. Participants at
GLOPE symposium at Waseda University, Kobe University, European University Institute, and IPSA
meeting in Santiago, Chile, UCLA conference on Post-bubble Japanese political economy, and IPES at Texas
A&M provided excellent comments. Naoi thanks the SSRC/Abe fellowship for financial support and Waseda
University for hosting her sabbatical when this research was conducted. Kenji Hall and Kim Chang-Ran
provided several photographs that were used as visual stimuli. Celeste Raymond Beesley provided
incomparable research assistance.
2
Introduction
Why do citizens in advanced industrialized nations bear the high price of
agricultural products? Despite a massive decline in the number of agricultural workers
and active farmland over time, agricultural protectionism is well and alive among
developed economies.1
OECD estimates that, on average, consumers in advanced
industrialized countries spend 10% of their annual consumption on agricultural products to
support farmers. The level of protection in Japan, however, stands out from the crowd. In
2008, Japanese consumers spent 41% of their annual expenditures on agricultural products
to support farmers (OECD 2009).2 [Figure 1 around here]
Not only are the actual levels of agricultural protection in Japan substantially
higher than other OECD countries, but a series of public opinion surveys, which directly
gets at individual preferences for regulating food imports, suggests that more than half of
Japanese citizens seem to be willing to bear this cost. A nationally-representative public
opinion survey we conducted in February 2009, in the midst of world-wide recession, asked
respondents to take a position on a trade-off between agricultural protectionism and
manufacturing export: “On import liberalization of agricultural products, there are
following two opinions, A and B. Which is closer to yours?”
1 Davis 2003, 2004; Gawande and Hoekman 2006; Park and Jensen 2007; Thies and Porche 2008.
2 OECD also calculates Producer Support Estimates (PSE), which are equal to the annual monetary
value of gross transfers from consumers and taxpayers to support agricultural producers in each
country. In 2006-2008, PSEs per gross farm receipts for the U.S., E.U., and Japan are 10%, 27%
and 49% respectively.
3
A: We should not accept import liberalization of agricultural products in order to
protect Japanese agriculture.
B: We should accept import liberalization of agricultural products in order to
maintain Japanese manufacturing export.3
Over the half of the respondents (55.6%) chose A, while 37.8% chose B, despite
the fact that farmers constitute only 3.9% of our sample and 6% of the total labor force4
in
Japan.5
Moreover, four waves of public opinion surveys on food import show that
Japanese citizens have become more protectionist over time. The Cabinet Office has
repeatedly asked a nationally-representative sample of respondents whether they would
support more food import “if foreign products are cheaper” or whether they support more
domestic production “even if it means higher prices.” In 1987, 19.9% supported more
food import if foreign products are cheaper and 71.2% support more domestic production
“even if it means higher prices.” The ratio of support for cheaper import dropped steadily
since then and in 2008, only 3.1% support cheaper import and 51.5% support domestic
production “even if it means higher prices.” [Figure 2 around here] This fact is harder to
3 Although this question poses a potential double-barreled problem, it has advantage as it presents a
trade-off between manufacturing export and agricultural protectionism. 4 The 6% figure includes part-time farmers (kengyo nouka) who are defined as agricultural workers
whose primary source of income is not farming, but spend at least 60-days per year on farming. 5 This survey was conducted by Waseda University Global COE Program. Farmers constitute 3.9%
of the total respondents and among farmers, 90% support A. The same question was asked in 1993
just before the general election by the Japan Election Study II. In this survey, 39.2% support A,
while 50.2% support B. The distribution is reversed, but still it is notable that substantial number
of Japanese citizens supported the agricultural protection.
4
grasp in light of urbanization and industrialization,6 the recession of 1990s, liberalization
through Uruguay Round of 1994,7 and the world-wide financial crisis today. Consumers,
especially lower-income consumers, should demand cheaper agricultural imports.
High public support for agricultural protectionism during the global recession,
moreover, is not confined to the Japanese case. A public opinion survey conducted in the
U.S. during March 2009, in the midst of the recession, suggests that 48% of respondents
think “it is a bad thing that Obama administration will cut down agricultural subsidies,”
while 40% of them think “it is a good thing”.8 The Eurobarometer conducted in the fall of
2007 shows that 50% of European respondents support the status-quo level of tariffs and
quota protection for agricultural commodities, while 37% oppose it.9
Two common explanations for agricultural protectionism are unhelpful to make
sense of this puzzle. The first focuses on the collective action capacity of interest groups:
producers (i.e., farmers) are concentrated and better politically organized than diffused and
unorganized consumers. The second focuses on political mobilization by elites: the
Liberal Democratic Party of Japan has been exchanging trade protection and subsidies for
rural and agricultural votes.10
Due to its focus on collective action capacity and organized
votes, however, the literature simply makes assumptions about consumers’ preferences for
7 Davis 2004.
8 Pew Research Center 2009.
9 Eurobarometer 2008.
10 Tachibana 1984; Kabashima 1984; Mulgan 2000; Davis 2004; Scheiner 2006.
5
free trade: consumers want free trade, but cannot act on it due to the collective action
problem. The two conventional accounts do not help us understand why the public seems to
be willing to bear high priced agricultural products to support farmers.
This paper presents new evidence from a survey experiment in Japan conducted
in December 2008 that challenges the assumption of free-trading consumers. The
experiment randomly assigns visual stimuli to activate respondents’ identification with
either producer or consumer interests and proceeds to ask attitudinal questions regarding
trade and food imports. The results suggest that activation of a consumer perspective is
associated with higher support for free trade on the issue of general trade, but that
consumer-priming has no systematic effect on the issue of food import. Surprisingly, the
producer-priming increases respondents’ opposition to food import particularly among
those who fear their own future job insecurity. We further propose two mechanisms to
explain why thinking about jobs and production activities makes respondents more
supportive of agricultural protectionism: “sympathy” for farmers and “projection” of their
own job insecurities onto farmers. The results lend strong support to the projection
hypothesis: those who fear future job insecurity and loss of income are the ones who
become more supportive of agricultural protectionism with the activation of a producer
perspective. This is paradoxical as workers with high job insecurity should be the prime
beneficiaries of cheaper food import.

6
Our results suggest that the mass public supports agricultural protectionism not
because they are concerned about quality and safety issues in food import from a consumer
perspective. Rather, one critical source of this support comes from the public’s projection
of their own job insecurity onto a symbolic declining sector, agriculture. The results help us
solve the paradox of persisting mass support for agricultural protectionism in the midst of
the world-wide recession. They also force scholars to move beyond the dichotomous
conceptualization of producer and consumer interests in the political economy literature
and pay due attention to why consumers often align with producers to support
protectionism even if it burdens them financially. Our finding that there exists an emerging
alliance of producers and protectionist consumers pushes forward the long-standing
research on coalition politics in the global economy which are mostly about class or
sectoral alliance.11
Beyond the literature on trade policy preferences and coalitions, the results have
broader implications for the study of inequality and redistribution in the global economy,
preference formation of mass publics on economic policy, and understanding how people
form “self-interest” and inferences about others’ needs in a social context.
The Puzzle: High Support for Agricultural Protectionism among the Public
Despite the fact that Japanese trade policy is often depicted as protectionist,
Japan’s average applied tariff rates have been one of the lowest among developed
11
Rogowski 1989; Hiscox 2002.
7
economies since the GATT Kennedy Round.12
Agriculture, however, is a very different
story: it still remains highly protected as shown in the ranking of Consumer Support
Estimates among OECD countries (see, Graph 1).
Not just the levels of protectionism, but the forms of compensating farmers in
Japan differ from the United States and E.U. Instead of compensating income loss to
farmers from liberalization with lump-sum tax transfers, the Japanese government
extensively uses price support and tariff and non-tariff barriers. For instance, rice, sugar,
and butter have the extremely high tariff rates of 778%, 270% and 330% respectively
(WTO 2008). These forms of protection directly tax consumers who have the opportunity
to feel this financial burden on a daily-basis. Yet, consumers seem to be willing to support
agricultural protectionism. This is particularly puzzling because when it comes to general
trade issues, Japanese citizens show the highest level of support (77%) for free trade among
twelve developed and developing economies.13
A nationally-representative public opinion survey we conducted in February 2009
indeed shows continuing mass support for agricultural protectionism. The survey asked:
“Food import from abroad has been increasing in the past. What is your opinion on this?”
40.4% of respondents consider it to be “bad” or “very bad”, while only 13.7% consider it to
be “good” or “very good.” 45.9% of respondents chose “can’t say one or the other.”
12
In 2003, average applied tariff rates for Japan, the U.S. and E.U. are 2.9%, 3.6%, 4.1%
respectively. 13 World Values Survey 1995.

8
Collective Action and Political Mobilization
The majority of literature on OECD countries attributes the high levels of
agricultural protectionism to the collective action capacity of producers over diffused and
unorganized consumers.14
Thus this literature has tested how the economic characteristics
of agricultural industries, such as the degree of geographic concentration, size of the
workforce, and import substitutability, affect their collective action capacity and thus the
level of protection they receive. The collective action argument, however, is unable to
speak to the fact that over half of the non-farmers, which constitutes 94% of the total labor
force in Japan and 96.1% of our nationally-representative survey respondents, support
protectionism.
Another strand of literature suggests that political mobilization by elites interact
with economic characteristics of industries to affect the levels of protection.15
Rogowski
and Kayser demonstrate that among OECD countries, countries with majoritarian systems
have lower prices for consumer goods than those with proportional representation systems.
This is due to low vote-seat elasticity which encourages organized interests like producers
to lobby harder under PR systems than under majoritarian systems. Park and Jensen have
also demonstrated that electoral systems that encourage legislators to target narrow
constituencies have higher levels of agricultural protectionism.
14
Gawande and Hoekman 2006; Mulgan 2000; Olson 1965, 1985; Park and Jensen 2007;
Rogowski and Kayser 2002. 15
Kabashima 1984; Magee, Block and Young 1989; Thies 1998; Grossman and Helpman 1994;
Sheingate 2001; McGillivary 2004; Park and Jensen 2007.
9
Similarly, the literature on Japan has blamed the multi-member district system
with single-non-transferrable-vote (SNTV) before 1996 as a source of high agricultural
protectionism.16
According to this view, the LDP politicians exchanged votes for
agricultural subsidies and protection especially in rural areas.17
Scholars have also argued
that the electoral reform of 1994 in Japan, which combines a single-member majoritarian
system with proportional representation might empower diffused interests like consumers
and decreases the power of organized interests.18
Using three waves of interest group
surveys since 1979, for instance, Kume demonstrates that special interest groups have lost
power over legislators after the reform.19
Indeed, if we look at legislators’ policy-positioning on agricultural policy, the
LDP politicians have become less responsive to farm interests over time. The all
Lower-House legislator survey we conducted during June-July of 2009, a month before the
general election, asked whether food import should be regulated (kisei suru). 55% of LDP
legislators oppose the additional limits on food import. The LDP decreased its support
for farmers around mid-1990s advocating for “agricultural policy in the offensive (seme no
nousei)” and identifying themselves as the “pro-globalization faction of agricultural tribe
politicians (kokusai-nousei-ha).”20
Indeed, the actual level of agricultural protectionism
16
Horiuchi and Saito 2009. 17
Scheiner 2006. 18
For an objection, see Bawn and Thies 2003. 19 Kume 2007.
20 Sasada 2009; Krauss and Naoi 2009. The LDP politicians who specialized their career
development in the agricultural sector became more responsive to food processing and fast food
10
measured by Consumer Support Estimates has gone down moderately from 51% in 1997
(post-electoral reform) to 41% in 2008.21
Despite this shift in elite attitudes as well as the level of protection, the public’s
support for agricultural protectionism has thus far survived the global recession. In sum, the
two arguments, collective action capacity and political mobilization, which focus on
producer interests and power, do not account for why consumers support agricultural
protectionism. To make sense of this puzzle, we need to question a widely-held
assumption that consumers are free traders.
Consumer Preferences in the Global Economy
The puzzle posed in the previous section calls us to move beyond the standard
theories of trade policy preferences, such as Stolper-Samuelson and Ricardo-Viner models.
These trade theories only focus on producer (or occupation-related) attributes of individuals.
Compared to the accumulation of occupational theories of trade policy preferences,
however, we still know little about consumer preferences on trade policy. This is because
the majority of literature has assumed consumer preference for free trade.22
The emerging literature, however, suggests various parameters beyond price
sensitivity that make some consumers more protectionist than others: the type of
chain industries. This might be due to their large financial contributions as food industries are one
of the fastest growing industries in terms of revenue and the number of employees. 21
OECD 2009. 22
Grossman and Helpman 1994.
11
consumption basket,23
safety and quality concerns,24
ethical concerns,25
the
love-of-variety,26
and community and family concerns.27
Ehrlich, for instance, finds that
the U.S. citizen’s support for fair trade products are not “protectionism in disguise” but
rather sincere concerns for labor and environmental standards. Hiscox and Smyth indeed
confirm in their field experiment at ABC Carpet that American consumers are willing to
pay extra dollars to purchase goods that are labeled to have met the labor standards.
In the Japanese context, Maclachlan has shown that although Japanese consumers
have demanded lower prices, as seen in the color-TV boycott incident in 1970, the major
policy goals of consumer organizations have been to secure consumer protection and the
right to choose (antimonopoly law). Vogel posits that Japanese consumer preferences might
not appear to be economically rational, as they did not demand neither trade liberalization
nor lower price. However, Japanese consumers demanded better quality and safety
regulations and were successful in obtaining them.28
Garon and Maclachlan demonstrate
that Japanese consumerism has had elements of “morality, thrift, community and national
identity” partly due to elites molding the public minds though government policies.29
23
Baker 2004; 2006. 24
Vogel 1999; Kono 2006. 25
Ehrlich 2009; Hiscox and Smyth 2009. 26
Krugman 1991; Broda and Weinstein 2007. 27
Goldstein, Margalit, and Rivers 2009. 28
Vogel argues: “to establish a causal link from group interests to policy outcomes we need to
determine that groups actually bore the assumed preferences, that they acted upon these preferences,
and that their actions influenced outcomes. Establishing a causal link requires empirical
verification.” 29 Vogel 1999; Garon and Maclachlan 2006; Maclachlan
12
Indeed, the most recent public opinion survey conducted by a Japanese
Think-tank suggests that Japanese citizens found the Chinese poisoned dumpling incident30
“more worrisome” than the world financial crisis and the political instability of North
Korea.31
If these food safety incidents shape Japanese citizens’ attitudes toward food
import, we expect that safety and quality concerns increase the public’s opposition to food
imports. In sum, the emerging literature on consumers has shown that their preference for
free trade is indeterminate at best: there are other parameters beyond price sensitivity that
might make consumers protectionist.
Why Experiment? Priming without Framing
The complexity of consumer preferences poses several major issues that have stalled
inquiry into how producer and consumer interests shape trade policy.32
The first is the
dual – and often conflicting – perspectives citizens have toward globalization as producers
versus consumers. Because the majority of citizens engage in both production (i.e.,
income-earning) and consumption activities, a key question is not whether consumers’
interests matter more than producers’; rather, we need to ask whether citizens’ support for
30
Japanese citizens have experienced a series of food-safety crises such as mad-cow disease in the
1990s and the Chinese poisoned dumpling incident in 2008. Japan Finance Corporation conducted a
series of surveys before and after the story about poisonous Chinese dumpling import dominated the
media. The surveys show a very sharp rise in safety consciousness and domestic food orientation
after the incident. Japan Finance Corporation, Shouhishadoukouchousa, 8/21/2009. Available at
http://www.afc.jfc.go.jp/topics/pdf/topics_090812a.pdf (last accessed, July 2009). 31
Mitsubishi Souken 2008. 32
Goldstein, Margalit and Rivers 2009; Author(s) 2009.

13
agricultural protectionism differs when they assess their positions in the global economy as
producers or consumers.33
[Chart 1 around here] This question calls for an experimental
research design that randomly primes citizens to think about globalization as a producer or
as a consumer.
Second, in light of studies that suggest consumers’ preferences are indeterminate and
complex, we should not frame respondents to think about the positive or negative
consequences of food import when we ask their attitudes toward it. For instance, Hiscox’s
framing experiments gave a different introductory statement to randomly assigned
treatment groups: “Many people believe that increasing trade with other nations creates
jobs and allows Americans to buy more types of goods at lower prices” or “Many people
believe that increasing trade with other nations leads to job losses and exposes American
producers to unfair competition.”34
After these introductory statements, the survey
proceeded to ask their support for free trade. In light of the complexity of consumer
preferences, however, this framing potentially poses a double-barreled problem as it
simultaneously primes respondents to think about trade from consumer vs. producer
perspective and frames them to think of trade’s positive or negative distributional
consequences. Instead, we need to design an experiment that primes respondents to think
33
There has been a long tradition of conceptualizing producer vs. consumer interests as a
dichotomy and trade-off in the political economy literature. See Smith 1776. 34
Hiscox 2006.
14
about food import from a consumer vs. producer perspective without framing its positive or
negative distributional consequences.
Research Design and Method
We conducted an on-line survey experiment in Japan with a sample of 1200
respondents between the ages of 20 and 65 during the first week of December, 2008 when
media coverage of the world financial crisis and the rise of unemployment among the
temporary workers was extensive.35
To understand the sources of support for agricultural
protectionism, we randomly assigned visual stimulus to three experimental groups. The
experiment consists of two groups that receive the treatment (“stimulus”) and another
control group without any stimulus (400 respondents each).
The producer-priming group is shown three photographs—a typical white-collar
office, a car factory, and rice field. The images were chosen so that they represent three
major sectors of the economy (service, manufacturing and agriculture) to activate
respondents’ consciousness as producers (or, their occupational interests) [Group 1 Photos
around here]. We chose images of typical workplaces with both male and female workers
present, except for the car factory image where all the workers appear to be male.
35
To ensure the representativeness of our sample, we also asked exact same questions on attitudes
toward food import in a nationally-representative public opinion survey in Waseda University’s
GLOPE with 1078 respondents (47.4% response rate) conducted during February of 2009. See the
discussion of results on pages 33-34 of this paper. The distribution of attitudes in our control group
are similar to the nationally-representative sample as shown in the Appendix. The designs and
results of two pilot studies we conducted before this survey experiment are available upon the
editor’s and reviewers’ requests.
15
The consumer-priming group is shown three photographs—a supermarket with
food, a consumer electronics retail store, and a large-scale casual clothing store. These
images encompass three areas of basic consumer goods that citizens purchase regularly
regardless of their income, gender, family status, and age.36
These visual stimuli are
intended to activate respondents’ consciousness as consumers [Group 2 Photos around
here]. The control group receives no stimulus. The treated and control groups are
balanced in their key demographic characteristics such as age, gender, income and skill
specificity as shown in the Appendix Table A-1.
In order to ensure that respondents indeed received the treatment,37
we asked a
follow-up question immediately after showing each image. For example, after showing
the picture of car factory, we asked: “What type of car do you think they are producing?”
Respondents choose from five options such as a racing car, a hybrid car, or a regular car.
After showing the photograph of supermarket, we asked, “What type of grocery shop do
you think this is?” in which respondents choose from five options ranging from a large
supermarket, to organic and natural food store, to small mom-and-pop shops. The idea is
not to test the facts about these images, but rather to ensure that respondents see these
photos and think of them either from job-related or consumption-related perspectives.
More than 70% (for the white-collar office photo) to 96% (for the rice field image) of
36
For instance, the image #2 is taken at the casual chain clothing shop called “Uniqlo” which is
culturally equivalent to the GAP in the U.S. At the end of the survey, we asked respondents whether
they own anything made by Uniqlo and more than 82.5% of respondents in both genders and
different age groups say Yes. 37
Horiuchi et al. 2006.
16
respondents chose correct answers to these questions confirming their reception of the
stimuli.
Using images to prime respondents has two advantages over framing experiments
which supply respondents with opinions about how trade affects consumers and
producers.38
First, priming differs from framing in that the former makes some issues
more salient than others and thus influences “the standards by which governments,
presidents, policies, and candidates for public office are judged,”39
while framing
characterizes issues negatively or positively.40
This characteristic of priming allows us to
manipulate respondents’ “standards” by which food import is judged (i.e., producer vs.
consumer) without imposing on them the judgment itself (i.e., food import is good or bad
for producers/consumers). This is critical for the purpose of our study as we do not yet
know whether activation of a consumer perspective uniformly leads to lower or higher
support for agricultural protectionism. Instead, the visual stimuli simply prime
respondents to think of themselves as consumers vs. producers.
Second, our visual stimuli do not explicitly convey information either about trade or
globalization. This is appropriate for the purpose of our study, as not all production and
consumption activities are linked, in reality and in citizens’ minds, to trade or globalization.
38
Hiscox 2006. 39
Iyengar and Kinder, 1987: 63. 40
Scheufele 2000.
17
After the treatment, we proceeded to ask attitudinal questions about food import and
general trade issues.41
The survey instruments are described in the results section below.
The Results: Aggregate Effects of Priming
General Trade Issues vs. Food Import
Table 1 summarizes the distribution of responses for a generic trade question,
“Import from foreign countries has been increasing in the past. What is your opinion on
this?” Respondents choose answers from a five-point scale (very good, good, neutral, bad,
and very bad). Consumer-priming substantially lowers the opposition to free trade: the
proportion of protectionist responses within the consumer-priming group is 13 percentage
points lower than that of the control group and 18 percentage points lower than the
producer-priming group. These differences are statistically significant at 5% level.
Producer-priming, on the other hand, turns out to have no systematic effects – while it
slightly increases the proportion of protectionist responses (by 4 percentage points over the
control group) the difference is statistically insignificant. Overall, the results suggest that
Japanese citizens are much more supportive of free trade when they assess their positions
on trade from a consumer perspective.
Table 2 summarizes the distribution of responses for the question, “Food import from
foreign countries has been increasing in the past. What is your opinion on this?” in which
41
The original Japanese language version is available at the editor’s and reviewers’ request.
18
respondents choose answers from the same five-point scale.42
Table 2 first suggests that
respondents’ opposition to food import is much stronger than that of general import of
goods. Among all three experimental groups, the proportion of protectionist responses is
at least 20 percentage points higher for food import compared to general imports (Graph 1).
Contrary to our expectation, however, consumer-priming does not provoke higher
opposition to food import. Rather, producer-priming increases the proportion of
protectionist responses by ten percentage points compared to the control group. The
difference is statistically significant at the 5% level. [Figure 3 around here] This is
puzzling as an increase in food import should not directly affect the job security and wages
of the respondents except for a small fraction of farmers (0.7% in our sample; 3.9% in
GLOPE survey; 6% of total workforce in Japan including part-time and weekend
farmers).43
This finding poses two puzzles. First, why does the activation of a producer
perspective lead to higher support for agricultural protectionism? Second, this finding
forces us to reconsider the “protectionist consumers” argument made by Vogel and others.
If Japanese citizens support agricultural protectionism due to concerns over the safety and
42
Note that this question asks respondents’ opinion about “increasing food import” not about
protecting agriculture or farmers. We chose this form of question as it does not directly remind
respondents about “jobs” (theirs or farmers’) or “consumption”. Given this neutrality, it is even
more puzzling that the producer-priming increases the opposition to “food import”. 43
On the other hand, those who are employed in food-processing and restaurant/fast-food chain
industries will benefit from increasing food import. Indeed, the Japanese fast-food chain
association has extensively lobbied the LDP legislators for opening of the agricultural market and
accepting more foreign workers.
19
quality of imported goods (or, food nationalism), consumer-priming would have made them
more protectionist. But for the general trade issue, consumer-priming is associated with
much higher support for free trade and it had no systematic effects on citizens’ attitudes
toward food import. If quality and safety concerns do not dictate the public’s support for
agricultural protectionism, what does?
Disentangling the Puzzling “Consumers think like Producers”
We disentangle this puzzle along two possibilities suggested by experimental
studies on mass support for income redistribution: sympathy of the public for “poor” and
“hardworking” people (in our case, farmers), and the public’s projection of their own job
insecurity onto a symbolic declining industry (i.e., agriculture).44
Both mechanisms force
us to move beyond occupational theories of trade policy preferences, based on
Stolper-Samuelson and Ricardo-Viner models, which derive individual policy preferences
from their relative positions in the international economy. Instead, we should consider
how individuals perceive other occupations or sectors (i.e., agriculture) when forming their
44
Another, often-cited reason for the public support for agricultural protectionism is a form of
nationalism (food nationalism). We tested the effect of nationalism in two ways and found no
effects. First, we asked respondents what their main identity is and included in the models a
dummy variable indicating one for those who chose “nationality” or “ethnicity” as one of the top
two identities they have, and zero otherwise. Not only was the proportion of “nationalist”
respondents quite small at 3.9%, the nationalism dummy turns out to have no effect. Second,
when we asked respondents’ levels of exposure to protectionist elite discourse (discussed in details
on page 26), we included four terms that are directly related to food nationalism to the protectionist
information index: food self-sufficiency ratio, food education, locally-grown locally-consume, and
Chinese poisoned dumpling incident. This variable, Protectionist_Info, turns out to have no
systematic effects.
20
own attitudes toward trade.45
To do so, we analyze which subgroups of respondents are
sensitive to producer and consumer-priming and identify the direction of their attitudinal
differences among the three experimental groups.46
Sympathy
One possible explanation for the puzzle is that producer-priming provokes
agricultural protectionism due to the sympathy that consumers have about farmers: their
occupational images are hardworking, but declining with low pay. Indeed, despite the fact
that the household income of farmers exceeded that of the average employee since 1975,47
sociologists have found that farmers’ “occupational prestige scores” in which citizens rank
the socio-economic prestige of more than 80 occupations since 1955 has been extremely
stable and low throughout 1990s.48
Citizens might perceive agricultural protectionism as
a redistributive policy in the context of post-War Japanese political development.49
45
Mansfield and Mutz 2009 demonstrate that the U.S. citizens form their attitudes toward trade
socio-tropically rather than individually due to the exposure to media and elite discourse on trade’s
effect on the national economy, as opposed to on their individual occupation. Our approach
echoes their view in that it deals with social determinants of individual attitudes, yet differs from
them by theorizing how citizens’ perceived similarities and differences with other sectors can
determine their attitudes toward protecting a given sector. 46
One cannot infer the effect of stimuli on respondents by simply looking at aggregate distribution
of responses (“average treatment effects”) when the heterogeneity of treatment effects exists across
sub-groups (“local treatment effects” e.g., consumer-priming increases support for food import for
men and reduces it for women). Angrist 2004; Imai and Strauss 2009; Bitler, Gelbach and Hoynes
2007. 47
Moriguchi 2008. 48
Naoi 1979; Hara 1999. The occupational prestige score for farmers (jisakunou) is 51, 43, 45, 46
for years 1955, 1965, 1975, and 1995 respectively. These scores are comparable to taxi drivers,
workers at train stations (ekiin), and hair stylists (riyoushi) but much lower than white-collar
employees. 49
Kabashima 1984; Calder 1988. Since the mid-1950s when the Japan’s high economic growth
21
Experimental studies on people’s attitudes toward redistribution also lend support
to this intuition. While the rationalist model expects that support for income redistribution
decreases as personal income increases, the emerging survey evidence finds that a large
number of low-income respondents oppose redistribution and a large number of
high-income respondents support it. The level of respondents’ income, thus, is only a
partial predictor of attitudes toward redistribution. Survey research conducted by Fong
shows that people express stronger support for redistribution to the poor when they think
that poverty is caused by bad luck rather than laziness.50
Survey experiments on public
support for government assistance to natural disaster victims confirm this finding that
people support redistribution when they sympathize with the recipients and feel that they
“deserve” it.51
Fong elaborates this finding with an experiment. She designed a charity game,
in which a player is randomly matched with a real-life welfare recipient who exhibits strong
or weak work ethics. The player is then asked how much s/he is willing to contribute to the
recipient from the fixed amount of money the player is given. The study found that the
player gives more money to the welfare recipient with a strong work ethic. These studies
find that strong reciprocity better explains the motivations behind the welfare state:
started, both the Japanese and the U.S. governments’ concern was how to reduce the urban-rural
income gap as this gap was considered to be a root cause of Japan’s militarism during the WWII. 50
Fong 2001:285. 51
Harris-Lacewell et al. 2009.
22
generosity toward the poor is conditional on the belief that the poor work hard.52
Lu,
Scheve and Slaughter also formally demonstrate that altruism can be the reason why
low-skill and labor-intensive industries, such as agriculture, receive high levels of
protection across countries with different factor endowments such as the United States and
China.53
In order to identify whether sympathy is a source of support for protectionism,
we asked the respondents to choose three words each that characterize their images and
feelings toward producers and consumers.54
This was done before respondents received
the visual stimuli. Among twenty word choices,55
the top-four producer images chosen
were “responsibility” (“sekinin”, 48.3%), “sweat” (“ase”, 48.1%), “country/rural”
(“inaka”, 43%), and “factories” (“koujou”, 36.7%). On the other hand, the top-four
consumer images are “money” (“okane”) (57.9%), “citizens” (“shimin”) (46.0%),
“information” (“jouhou”) (28.6%) and “urban/metropolitan” (“tokai”) (27.7%).
Two points are worth highlighting. First, a higher proportion of respondents
chose “country/rural” (i.e., agriculture) over “factories” (i.e., manufacturing industries) as
52
Fong 2004:278-282; Williamson 1974; Heclo 1986. 53
Lu, Scheve and Slaughter 2009. 54
The question wording is: “We call those who produce manufactured and agricultural products as
well as those who provide service to customers ‘producers’ (seisansha), and call those who
purchase these goods and consume ‘consumers’ (shohisha)”. Among the 20 words below, please
each choose three images or feelings you have about producers and consumers.” 55
These are trust (sekinin), suspicion (utagai), urban (tokai), rural (inaka), money (okane), leisure
(goraku), responsibility (sekinin), information (jouhou), weekdays (heijitsu), off days (kyujitsu),
sweat (ase), factories (koujou), government (seifu), citizens (shimin), progressive (kakushin),
conservative (hoshu), men (dansei), women (josei).
23
their image of producers. Second, “money” is much more closely associated with
consumers (57.9%) than producers (6.8%). This means that the majority of respondents
have images of producers being hardworking (“sweat”) in rural areas or hardworking
blue-collar workers in factories without much monetary reward. Thus, we include a
variable Sweat which takes a value of one if a respondent chooses “sweat” as one of the
three producer images and zero otherwise.56
The second variable is the respondents’ attitudes toward redistribution
(Redistribution). We recode respondents’ five-scale responses to a question, “What is
your opinion about a policy to redistribute wealth from the rich to the poor using taxation
and the social insurance system?” so that the higher the number, the higher the support for
redistribution (e.g., 4: very high support, 0: very high opposition).
Farm-to-Table is equal to one when respondents have used a “farm-to-table”
service (“sanchoku”) to buy food directly from farmers in the past year, and zero otherwise.
Our expectation is that those who have used “farm-to-table” services might sympathize
with farmers more as they communicate with farmers regarding the products via mailing
lists or direct conversation. Finally, Social Network takes a value of one if a respondent
has a family member or relatives who engage in farming, including part-time farming.
Indeed, while only 0.7% of our respondents are farmers, 37.7% of respondents have a
family member or relatives engaging in farming. This variable is included to test a
56
Alternatively, we also include an interaction term between “sweat” and “rural”. The results do
not change.
24
popularly believed social network argument that consumers support agricultural
protectionism because their family members are engaged in farming.
Projection
The second hypothesis we test is that citizens might support agricultural
protectionism because they project their own job insecurities onto a symbolic declining
industry, agriculture. Projection is a concept developed in social psychology to
understand how people make inferences about ‘others’ using their own mental states as a
benchmark.57
Ames develops “projection” and “stereotypes” as two inferential strategies
people use to understand what others want. With lab experiments, he demonstrates that
when the perceived similarity between self (i.e, a perceiver) and others (i.e., a target) is
high, respondents are more likely to use projection as a tool to infer others’ preferences.
On the other hand, when the perceived similarity between self and others is low,
respondents are more likely to use stereotypes as a mechanism of inference.
In the context of our research, this means that when the level of respondents’
perceived similarity with farmers is high, respondents are more likely to project their own
mental states onto what farmers want regarding food import (i.e., protectionism). We derive
three potential similarities that respondents might perceive with agricultural workers:
declining industry, high job insecurity (i.e., difficulty finding a comparable job), and older
57 Freud 1936; Ames 2004 a, b.
25
age. In projection research, these perceived similarities are usually recorded before asking
respondents to infer the targets’ positions. We did not want to ask about respondents’
perceived similarities with farmers before our question about food import, however, due to
our concern that the similarity questions could risk priming respondents to think about
farmers. Thus, these potential similarities are derived from conventional occupational
images of farmers found in existing public opinion and social surveys.58
We aim to test
whether the subgroup of respondents who are likely to perceive potential similarity with
agricultural workers shows higher opposition to food import interacting with the producer
and consumer stimuli.
Thus, if the projection hypothesis holds, we expect to see respondents with high
job insecurity or perceived risk of income loss in the future show higher support for
agricultural protectionism. To test this, we include Skill Specificity which is a five-point
scale response to the following question: “If you were to quit your current job, do you
believe it would be difficult to find a similar job that pays a comparable salary?” We
recode this variable so that the higher the number, the harder it is for a respondent to find
their next job.
Likewise, older respondents face a higher risk of income loss due to
forthcoming retirement or increasing difficulty in finding their next job. Also, the average
age of agricultural workers in Japan is 57.6 for all the farmers and 64.6 for farmers whose
58
Hara 1999.
26
main source of income is farming.59
Age is a respondent’s biological age coded into one
of five categories (20-29, 30-39, 40-49, 50-59, 60-65). We trichotomize job status as
three dummy variables to FullyEmployed for full-time employees, Temp for part-time and
temporary employees, and No Jobs for the unemployed and those not in the labor force.
Fully Employed is excluded from the model as a base category.
Alternative Hypotheses and Controls
Building on the existing work on individual attitudes toward globalization in
general and food import in particular, we include a battery of covariates which capture
respondents’ job and consumer-related attributes.
For respondents’ job-related attributes, the following covariates are included.
Low Income indicates an individual in the a bottom 30% of the income distribution, High
Income indicates top 30% and Mid Income is the base category. College is a dummy
variable; it is equal to one for respondents who graduated from college and zero otherwise.
Female is a dummy variable; one for women and zero otherwise.
We also control for social and political attributes that might influence
respondents’ attitudes. Married is a dummy variable equal to one for married respondents
and zero otherwise. Have Kids is a dummy variable “1” for respondents with children and
zero otherwise. Housewives is a dummy variable “1” for housewives and zero otherwise.
59
Data for 2008. Japanese Statistics Office,
available at http://www.e-stat.go.jp/SG1/estat/List.do?bid=000001014189&cycode=0
27
LDP and Non-PartyID indicate respondents’ party identification with then-incumbent
Liberal Democratic Party and non-partisan, respectively.60
We also include an index
measure of political participation, Politically Active, which is the sum of the answers (0: not
at all, 1: once or twice, 2: several times) to three questions about the frequency of political
participation in the past: whether a respondent has been a member of a local candidate
support group (koenkai), whether a respondent has helped a candidate run for an election,
and whether a respondent has listened to politicians’ speeches on the street. Politically
Active ranges from zero to six.
We also include three novel covariates to remedy some issues found in the
existing literature. One variable is Protectionist_info, which measures respondents’ levels
of exposure to elites’ (politicians, bureaucrats, and the media) protectionist discourse on
trade policy. Generally, the level of respondents’ exposure to elite discourse is proxied
either by education or respondent’s answer to a quiz on technical aspects of trade policy.61
We attempt to directly measure the level of exposure by asking a series of questions about
whether they have heard and/or spoken with their colleagues or family about the following
terms: “Free Trade Agreement (FTA or EPA)”, “World Trade Organization (WTO)”,
60
We also tested alternative models of party IDs where LDP, DPJ, and non-partisan support are
included in the model and the remaining parties (mostly leftists, such as Social Democratic Party
and Japan Communist Party and center-left Clean Government Party) are the base category. The
results do not change. 61
Baker 2009. For instance, Baker quizzes respondents to list signatory countries for CAFTA for
his survey in Latin America. While Baker’s quiz gets at respondents’ sophistication regarding
trade issues and their levels of technical knowledge, our index attempts to measure the respondents’
levels of exposure to elite discourse.
28
“Safeguard provision”, “poisoned Chinese dumpling incident (chugoku doku gyoza jiken),”
“food education (shokuiku)”, “food sufficiency ratio (syokuryo jikyuritsu),” and
“locally-grown, locally consume (chisan chisho)”.62
The former three terms concern issues
related to high trade politics (e.g., bilateral or multilateral diplomacy) and the latter four
terms are extensively used by politicians and the media to either raise the barrier to trade or
promote domestic production and consumption of food and agricultural products.
The data suggests that one quarter of the respondents is highly exposed to
protectionist elite discourse but not to the high trade politics discourse: 24.75% of the
respondents have heard and spoken about all of the four protectionist terms. The variable
Protectionist_info is thus constructed as a dummy variable “1” if a respondent heard and
spoke about all of the four protectionist terms and zero otherwise in order to test how the
level of exposure to protectionist elite discourse mediates or exacerbates the effect of
priming.63
The second novel variable is No Foreign Transaction which takes a value of one
when the company with which the respondent is employed or the business run by the
62
We chose these terms by (i) examining the websites of members of parliament mentioning
“agriculture (nougyo)” or “farmers (nouka)” and identifying common reasons they mention to make
the case for protection; (ii) using questionnaires in the Ministry of Foreign Affairs’ public opinion
surveys on Economic Diplomacy (Keizai Gaikou no Ishiki Chosa) conducted in 2004; and (iii)
reflecting key legislation or policy (FTAs, Food Education Law in 2005) and events (poisoned
dumpling in 2008) during the past five years. We have requested the survey data from the
Ministry on numerous occasions since summer of 2007, yet have had no luck obtaining it thus far. 63
Alternatively, we included a variable High Trade Info which is an index of the number of terms
in high trade politics (“FTA”, “WTO”, and “safeguard provision”) a respondent has heard or spoken
with family or colleagues about. This variable, however, turns out to have no systematic effects.
29
respondent does not import, export or outsource its production activities abroad and zero
otherwise. This variable is included to remedy the criticism that the conventionally-used
ILO occupational classification is not an accurate approximation of skill-level or
export-orientation vs. import-competing sectors. The self-reported position of a
respondent’s company or sector might provide more accurate data on how respondents
perceive their job’s relative position in the global economy.64
Finally, we include several questions to capture consumer attributes of the
respondents which are generally missing in standard public opinion surveys. First, we list
the names of widely recognized luxury shops and discount stores in Japan and ask
respondents whether they own any product from each store. These stores are: Louis
Vuitton, Gucci, Armani, Prada, Channel, Brooks Brothers, Ralph Lauren, Rolex, Tumi,
Uniqlo, Muji, Gap, Ikea, Body Shop, and Aoki. A variable named Cheap_shopper is an
index of the number of items a respondent owns from the following discount stores (Uniqlo,
Muji, Gap, Ikea, and Aoki) and ranges from zero to five.65
64
Interestingly, 16.25% of the respondents (195 out of 1200) report they do not know whether their
company or sector imports, exports, or outsources production activities abroad. This finding
cautions that the link between respondents’ occupations and their attitudes toward globalization is
not as obvious as conventionally thought. 65
Alternatively, we ran the same model with a variable named “Brand Shopper” which is an index
of the number of stores a respondent owns a product from the following stores: Gucci, Armani,
Prada, Channel, Brooks Brothers, Ralph Lauren, Rolex, and Tumi. This variable turns out to have
no significant effects on the effect of priming. It is also worth reporting that these shopping habits
cannot be proxied by income. We ran a linear model with this Brand Shopper as the dependent
variable, and income, education, gender, age, and whether respondents’ jobs do not import, export,
or outsource (No Foreign Transaction) as covariates. High income and female respondents own the
highest numbers of items from these shops, yet the substantive impact of income is very small: a
shift from the mid income category (33%<n<67%) to the high income category (n>67%) only
30
The Models and Estimations
We pool all the data across the treatment and control groups and estimate the
treatment effects by interacting the treatment group dummy for each experiment group
(0-1) with each of the respondents’ attributes.66
The control group is the base category
which is compared to the producer- and consumer-priming groups. The model, estimated
by ordered logit, has the following structure where T1 is a dummy variable (“1”) for
producer-priming and zero otherwise and T2 is a dummy variable (“1”) for
consumer-priming:
Support for Food Import i= !0i + T1*!1 Sympathy/Projection i + T2*!1 Sympathy/Projectioni + T1*!2 Job-related attributes i + T2*!2 Consumer attributes i + T1*!3 Protectionist Info i + T2*!3 Protectionist Info i + T1*!4 Political Mobilization i + T2*!4 Political Mobilization i
Results (2): Sympathy and Projection
Table 3 summarizes the results of an ordered logit analysis of which respondents
are sensitive to priming. A positive coefficient on a variable indicates that with producer
or consumer priming, a given subgroup’s support for food import increases. Negative
coefficients indicate that, again, interacting with the producer or consumer priming, a given
increases the number of items owned among these shops at 0.6 within a range of zero to eight.
66
All the covariates, except for “Protectionist_info” are individual attributes that cannot be
changed due to the priming. One could argue that the priming might affect responses through
changing the intermediate variable (“mediation effects”, see Imai, Keele and Yamamoto 2009) such
as “Protectionist_info.” The distribution of responses to “Protectionist_info” does not differ,
however, across the treatment and control groups. The presence of mediation effects are therefore
not warranted here.
31
subgroup’s support for food import decreases. Models 1 and 2 use a five-point scale (very
good, good, neutral, etc) as the dependent variable and estimates it with an ordered logit,
while Model 3 dichotomizes the five-point scale to zero (opposition to food import; “bad”
and “very bad”) and one (support for food import including the neutral responses) and
estimates it with a binomial logit.67
Overall, the results of our experiment lend strong support to the projection
hypothesis and very weak support for the sympathy hypothesis. With producer-priming,
respondents with high job insecurity (Skill Specificity) and higher biological ages (Age) are
the ones who become more protectionist (i.e., higher opposition to food import). With
consumer-priming, those who are not employed (No Jobs) increase their support for food
import which is consistent with our expectation that unemployed respondents prefer lower
prices. This result is robust across the three models.
Figure 4 shows the substantive impact of respondents’ self-assessed job
insecurity on their decision to support agricultural protectionism. As skill specificity
increases from “easy” to “very difficult,” the proportion of protectionist responses increases
from 37.0% to 68.8% in the producer-priming group. Moreover, Skill Specificity has no
systematic effects on the proportion of protectionist responses in the consumer-priming and
67
For the sake of comparison, we also present Table A-2 and A-3 in the appendix which shows the
results of the same ordered logit and binomial logit models only with a control group in our
experiment and with a nationally-representative public opinion survey conducted by GLOPE in
February 2009. This gives us benchmark variations of individual support for food import among the
subgroups without treatment (“priming”) which will be discussed in detail later.
32
control groups which provides more evidence for the projection hypothesis.
On the other hand, the sympathy hypothesis finds only very weak support. Only
in Model 3 with dichotomized support for food import (0-1), with producer-priming, do
respondents with a family member or relatives engaging in farming (Social Network) show
higher opposition to more food import than a control group. Other variables for the
sympathy hypothesis, such as Sweat and Farm-to-Table have no systematic effects.
Respondents’ attitudes toward redistribution (Redistribution) have the opposite of the
expected effect: higher support for government redistribution is associated with higher
support for food import, especially with producer-priming.
A possible interpretation of this puzzle is that the Japanese public may be aware
that two forms of income inequality exist, class and urban-rural. Agricultural protectionism
is all about the redistribution of income from urban to rural at the expense of redistribution
from high to low income. Kume’s survey on interest group leaders lends additional support
to this perceived trade-off: labor union leaders are much less concerned about regional
inequality than other interest groups, despite the fact that leaders consider income
inequality to be a serious concern.68
Alternative hypotheses and control variables find partial support. With
producer-priming, respondents with the top 30% of income (High Income) are more
supportive of food import than a control group. Other job-related covariates, such as
68
Kume 2006.
33
college degrees and whether a company or sector of employment exports, imports, or
outsources production abroad, turn out to have no systematic effects. On the other hand,
consumer-priming makes respondents with children more supportive of food import. This
is probably driven by the price sensitivity. The consumer-priming, however, makes
married respondents more protectionist, controlling for income and whether they have
children or not. The finding is consistent with Goldstein, Margalit and Rivers who argue
that married respondents are more protectionist, yet provides an alternative explanation that
this might have to do with their attitudes toward consumption, rather than occupational
interests.69
Co-op members become more protectionist with consumer-priming which is
expected.
LDP supporters become more supportive of food import with producer-priming.
This is contrary to the conventional wisdom that the LDP is “pro-farmer”, but the finding is
in fact consistent with the preliminary finding of our Lower-House legislator survey that
LDP politicians are more pro-globalization and pro-food import than the then-opposition
Democratic Party of Japan’s politicians. Contrary to the expectation of the political
mobilization hypothesis, respondents’ level of exposure to elites’ protectionist discourse
(Protectionst_Info) and their political activeness (Politically Active) turn out to have no
systematic effects.
Table A2 and A3 in the appendix show the results of the same analysis only with
69
Goldstein, Margalit, and Rivers 2009. They show that married respondents are less risk averse
and that their attitudes toward risk accounts for the higher level of support for protectionism.
34
a control group in our experiment and with a nationally-representative GLOPE survey.
The benchmark results suggest that without producer-priming, neither a sympathy or
projection mechanism holds, except for a weak support for the projection hypothesis found
in Model 4 of Table A3.70
This lends additional support to our experimental finding that the
producer-priming is what encourages respondents to link their own job insecurity with that
of farmers. Without such stimuli, respondents generally do not project their job insecurity
onto a symbolic declining sector, agriculture.
Indeed, within a nationally-representative survey sample, temporary workers
(Temp) are more likely to support food import than fully-employed respondents which is
consistent with their expected economic needs for cheaper food. Given the higher baseline
support for food import among temp in the nationally-representative survey, our
experimental finding that temp became more opposed to food import than fully-employed
respondents with producer-priming is paradoxical. Although our findings are confined to
unraveling the mechanism for mass support for agricultural protectionism (i.e., internal
validity), this finding helps us solve the puzzle of why mass support for agricultural
protectionism has increased over time during the Japan’s decade long recession followed by
the world-wide financial crisis.
Conclusion
This paper has aimed to make three contributions. First, our study brought
consumers and the mass public to the center of the analysis of agricultural protectionism.
70
Skill specificity is associated with lower support for food import although at 90% level
significance.
35
The collective action literature argues that organized powerful producers (farmers)
successfully pursue protection at the expense of diffused consumers. This assumption has
become a pillar of the majority of studies on agricultural protectionism. We challenge this
very assumption by first systematically presenting the puzzle that over half of the public in
Japan and elsewhere in fact support agricultural protectionism even during the global
recession. We then disentangled various sources of this high support with a randomized
survey experiment and demonstrated that the high level of mass support is partly due to
respondents’ projection of their own job insecurity onto a symbolic declining industry,
namely agriculture.
The finding is paradoxical as people with high job insecurity should be the prime
beneficiaries of agricultural liberalization as consumers. This paradoxical finding forces
us to reconsider standard theories of trade policy preferences which are based on the
premise that individuals choose the policy positions that best fit their occupational interests
in the international economy. Beyond the issues of trade and globalization, this finding
suggests that we should reconsider how individuals perceive “self interest” and infer
“interests of others” to better understand mass support for protectionism and redistribution.
Second, the projection finding also may serve as an important step toward
understanding how a coalition of diverse interests emerges in the politics of globalization
and redistribution - a missing link between individual preferences and coalitional politics in
the current research on public opinion in IPE. Because employees in declining sectors
36
perceive similarities with agricultural workers, non-farmers support agricultural
protectionism which in turn harms their interests as consumers.71
Rather than attributing
this paradox with ideological or cultural pre-disposition of consumers, we have
demonstrated the mechanism of projection which gives rise to new coalition between
producers and consumers. Our finding that there is an emerging alliance of producers and
protectionist consumers will push forward the long-standing research on coalition politics
in the global economy which mostly predict class or sectoral alliances. For instance, this
coalition of economic losers (i.e., workers in declining sectors) and farmers differs from
“the marriage of iron and rye” during Bismarck Germany (1871-1914) where the
government protected both landowners and capitalists at the expense of workers
(consumers) by politically sustaining the high price of grains.72
Third, using the “priming without framing” survey experiment, we have
demonstrated that citizens’ attitudes toward globalization and trade can differ dramatically
depending on which aspect of their lives (work vs. home and social lives) is activated from
their multifaceted and often conflicting attributes. A promising line of future research,
thus, is to investigate how elites – legislators, bureaucrats, and media –seek to activate the
job vs. consumption-related interests of voters and which groups of voters are susceptible
to such elite priming and framing. The general election of 2009 in Japan might provide an
71
Peter Linderdt 2004 has coined the term “social affinity” to explain the mass support for
redistribution in OECD countries. Our projection hypothesis is similar to his but goes beyond it
by deriving perceived similarities between the subject (respondents) and the object (farmers). 72
Rogowski 1989.
37
opportunity to explore this question as the major opposition party, the Democratic Party of
Japan, has extensively campaigned to appeal to consumers and improving their quality of
lives (“seikatsu” and “kurashi”), while the LDP has focused its campaigns on “creating
jobs.”
Another promising line of research is to explore the external validity of our
projection finding by bringing this experiment to racially and ethnically diverse societies
such as the U.S. or India.73
Along the line of observational studies on racial diversity and
income redistribution in U.S. cities by Alesina and Baqir, we expect that the projection
mechanism is prevalent in more homogenous societies (e.g. Japan) than heterogeneous
societies (the U.S. and India).74
74 Alesina and Baqir 1999.
38
Bibliography
Ames, Daniel R. 2004a. Strategies for social inference: A similarity contingency model of
projection and stereotyping in attribute prevalence estimates. Journal of Personality and
Social Psychology, 87, 573-585.
Ames, Daniel R. 2004b. Inside the mind-reader’s toolkit: Projection and stereotyping in
mental state inference. Journal of Personality and Social Psychology, 87, 340-353.
Baker, Andy. 2005. Who Wants to Globalize? Consumer Tastes and Labor Markets in a
Theory of Trade Policy Beliefs. American Journal of Political Science, Vol. 49, No. 4
Baker, Andy. 2009. The Market and the Masses in Latin America: Policy Reform and
Consumption in Liberalizing Economies. New York: Cambridge University Press.
Bauer, Raymond A, Ithiel de Sola Pool, and Lewis Anthony Dexter. 1972. American
Business and Public Policy: The Politics of Foreign Trade, 2nd ed, Chicago:
Aldine-Atherton.
Bawn, Kathleen and Mark Thies. 2003. A Comparative Theory of Electoral Incentives
Representing the Unorganized Under PR, Plurality and Mixed-Member Electoral Systems.
Journal of Theoretical Politics, Vol. 15, No. 1
Beaulieu, Eugene. 2002. Factor or Industry Cleavages in Trade Policy? An Empirical
Analysis of the Stolper-Samuelson Theorem. Economics and Politics 14(2):99–131.
Burgoon, Brian, and Michael J Hiscox. 2003. The Mysterious Case of Female
Protectionism: Gender Bias in Attitudes Toward International Trade, Paper presented at the
Annual Meeting of the American Political Science Association, August, Philadelphia
Broda, Christian and David E. Weinstein. 2004. Variety Growth and World Welfare. The
American Economic Review, Vol. 94, No. 2
Davis, Christina. 2003. Food Fights over Free Trade: How International Institutions
Promote Agricultural Trade Liberalization, Princeton: Princeton University Press.
Davis, Christina. 2004. International Institutions and Issue Linkage: Building Support for
Agricultural Trade Liberalization. American Political Science Review, 98-1.
Ehlrlich, Sean. 2009. The Fair Trade Challenge to Embedded Liberalism, Manuscript,
Florida State University.
39
Fong, Christina M. “Social Preferences, Self-Interest, and the Demand for Redistribution,”
Journal of Public Economics 82, 2. 2001: 225-246.
Fong, Christina M. 2007. “Evidence from an Experiment on Charity to Welfare Recipients:
Reciprocity, Altruism and the Empathic Responsiveness Hypothesis.” Economic Journal,
117.522, 2007 July.
Garon, Sheldon and Patricia L. Maclachlan (Ed). 2006. The Ambivalent Consumer:
Questioning Consumption in East Asia and the West. Cornell University Press.
Gawande, Kishore and Bernard Hoekman. 2006. “Lobbying and Agricultural Trade Policy
in the United States”, International Organization, 60:3:527-561.
Gintis, Herbert, Ammuel Bowels, Robert Boyd and Ernst Fehr, eds. 2005. Moral
Sentiments and Material Interests: The Foundations of Cooperation in Economic Life, The
MIT Press, 2005.
Goldstein, Judith, Yotam Margalit and Douglas Rivers. 2008. “Producer, Consumer,
Family Member: The Relationship between Trade Attitudes and Family Status” Paper
Prepared for the Princeton Conference on Domestic Preferences and Foreign Economic
Policy, Princeton University, April 19-20, 2008.
Grossman Gene M. and Elhanan Helpman. 1994. “Protection for Sale” American Economic
Review Vol. 84, No. 4, pp. 833-850
Hainmueller, Jens and Michael J. Hiscox. 2006. Learning to Love Globalization: The
Effects of Education on Individual Attitudes towards International Trade, International
Organization, Vol. 60, No. 2 (Spring, 2006): 469-498.
Hara, Junnosuke. Ed. 1999. Shakai Kaiso: Yutakasa no naka no fubyodo [Social
Stratification: Inequality in Wealthy Society]. Tokyo: University of Tokyo Press.
Harris-Lacewell, Melissa, Kosuke Imai, and Teppei Yamamoto. 2009. “Racial Gaps in the
Responses to Hurricane Katrina: An Experimental Study,” Working Paper.
Heclo, Hugh. 1986. “The Political Foundations of Antipoverty Policy.” In Sheldon H.
Danziger and Daniel H. Weinberg (eds.), Fighting Poverty: What Works and What Doesn’t,
Harvard University Press, 1986, 312-341.
Hiscox, Michael J. 2002. International Trade and Political Conflict. Princeton: New
Jersey: Princeton University Press.
40
Hiscox, Michael J. 2006. Through a Glass and Darkly: Framing Effects and Individuals’
Attitudes towards International Trade, International Organization, Vol. 60, No. 3 (Summer,
2006): 755-780.
Hiscox, Michael J. and Nick Smyth. 2009. Is There Consumer Demand for Improved Labor
Standards? Evidence from Field Experiments in Social Labeling. Manuscript, Harvard
University.
Horiuchi, Yusaku and Jun Saito. 2009. Cultivating Rice and Votes: Demand-Side Origins
of Agricultural Protectionism in Japan. Working Paper.
Imai, Kosuke, Luke Keele, and Teppei Yamamoto. 2009. “Identification, Inference, and
Sensitivity Analysis for Causal Mediation Effects”. Working Paper.
Iyengar, Shanto. 1991. Is Anyone Responsible? How Television Frames Political Issues.
Chicago: University of Chicago Press.
Jacoby, William G. 2000. Issue Framing and Public Opinion on Government Spending+
American Journal of Political Science 44 (4):750 – 67.
Kabashima, Ikuo. 1984 “Supportive Participation with Economic Growth: The Case of
Japan” World Politics, Vol. 36, No. 3 (Apr., 1984), pp. 309-338.
Kahneman, Daniel, and Amos Tversky. 1979. Prospect Theory: An Analysis of Decision
Under Risk. Econometrica 47(2):263–91.
Kono Daniel Y. 2006. Optimal Obfuscation: Democracy and Trade Policy Transparency.
American Political Science Review, 100-3.
Kume, Ikuo. 2006. Roudou Seiji [Labor Politics]. Tokyo: Chuou Kouron Shuppansha.
Kume, Ikuo. 2007. "How Special Interest Group Politics Falls: The Case of Japan" Paper
presented at the Conference, "Modeling Power Relationship in Japanese Democracy"
University of British Columbia August 28-29, 2007
Krugman, Paul R.(1979), Increasing returns, monopolistic competition and international
trade. Journal of International Economics vol. 9.
Linderdt, Peter. 2004. Growing Public: social spending and economic growth since the
eighteenth century. Cambridge University Press.
Lu, Xiaobo, Kenneth F. Scheve, and Mathew Slaughter. 2009. Protecting the Poor: Skill
Bias in the International Distribution of Trade Protection. Working Paper.
41
Lupia, Skip and Mathew D McCubbins. 1998. The Democratic Dilemma: Can Citizens
Learn What They Need to Know? New York: Cambridge University Press.
Maclachlan, Patricia L. 2001. Consumer Politics in Postwar Japan: The Institutional
Boundaries of Citizen Activism. Columbia University Press.
Magee, Stephen P. and William M. Brock and Leslie Young. 1989. Black Hole Tariffs and
Endogenous Policy Theory. MA. Cambridge University Press.
Mansfield, Edward and Diana Mutz. 2009. Support for Free Trade: Self-Interest,
Sociotropic Politics, and Out-group Anxiety. International Organization. Vol.63, Issue 3.
McGillivray, F. 2004. Privileging Industry: The Comparative Politics of Trade and
Industrial Policy. Princeton University Press.
Mulgan, Aurelia George. 2000. The Politics of Agriculture in Japan. London: Routledge.
Naoi, Atsushi. 1979. “Shokugyoteki Chiishakudo no Kosei (The Construction of the
Occupational Status Scale)” in Ken'ichi Tominaga (ed.), Nihon no Kaiso Kozo, Tokyo:
Tokyodaigakushuppankai.
Naoi, Megumi and Ellis Krauss. 2009. Who Lobbies Whom? Special Interest Politics under
Alternative Electoral Systems. American Journal of Political Science, Volume 53 Issue 4.
Nelson, Thomas E, and Donald R Kinder. 1996. Issue Frames and Group-Centrism in
American Public Opinion. Journal of Politics 58 (4):1055–78
Nelson, Thomas E, Zoe M Oxley, and Rosalee A Clawson. 1997. Toward a Psychology of
Framing Effects Political Behavior 19:221– 46
OECD. 2009. Agricultural Policies in OECD Countries: Monitoring and Evaluation. Geneva:
OECD.
Olson, Mancur. 1965. The logic of collective action : public goods and the theory of groups.
Cambridge, Mass.: Harvard University Press.
O’Rourke, Kevin, and Richard Sinnott. 2002. The Determinants of Individual Trade Policy
Preferences In Brookings Trade Forum, edited by Susan M Collins and Dani Rodrik,
157–206 Washington, DC: Brookings Institution
Page, Benjamin I, and Robert Y Shapiro. 1992. The Rational Public: Fifty Years of Trends
in Americans’ Policy Preferences Chicago: University of Chicago Press
42
Park, Jong Hee and Nate Jensen. 2007. Electoral Competition and Agricultural Support for
OECD Countries. American Journal of Political Science. Vol.51, Issue 2.
Rogowski, Ronald. 1989. Commerce and Coalitions Princeton, NJ: Princeton University
Press.
Rogowski, Ronald and Mark Andreas Kayser. 2002. Majoritarian Electoral Systems and
Consumer Power: Price-Level Evidence from the OECD Countries. American Journal of
Political Science, Vol. 46, No. 3 (Jul., 2002), pp. 526-539.
Sasada, Hironori. 2009. Japan’s New Agricultural Trade Policy and Electoral Reform:
‘Agricultural Policy in an Offensive Posture [seme no nousei]. Japanese Journal of
Political Science 9-2.
Schattschneider, E. E. 1935. Politics, Pressures, and the Tariff Englewood Cliffs, NJ:
Prentice-Hall
Scheve, Kenneth F, and Matthew J Slaughter. 2001. Globalization and the Perceptions of
American Workers Washington, DC: Institute for International Economics
Scheufele, Dietram. 2000. Agenda-Setting, Priming, and Framing Revisited: Another
Look at Cognitive Effects of Political Communication, Mass Communication & Society,
2000, 3(2&3): 297–316
Sheingate, D. Adam. 2001. The Rise of the Agricultural Welfare State: Institutions and
Interest Group Power in the United States, France, and Japan. Princeton University Press.
Sniderman, Paul M. 2000. Taking Sides: A Fixed Choice Theory of Political Reasoning In
Elements of Reason: Cognition, Choice, and the Bounds of Rationality, edited by Arthur
Stolper, W. and P. Samuelson. 1941. Protection and Real Wages Review of Economic
Studies 9 (1):58–73
Thies, Cameron G. and Schuyler Porche. 2008. Political Economy of Agricultural
Protection. Journal of Politics. Vol.69, Issue 1.
Thies, Michael. 1998. When will pork leave the farm? Institutional bias in Japan and the
United States. Legislative Studies Quarterly. Vol.23, Issue 4.
Vogel, Steven. 1999. “When Interests Are Not Preferences: The Cautionary Tale of
Japanese Consumers,” Comparative Politics, Vol. 31, No. 2, pp. 187-207
Williamson, John B. 1974 Beliefs about the Motivation of the Poor and Attitudes toward
Poverty Policy. Social Problems 21- 5: 734-747.
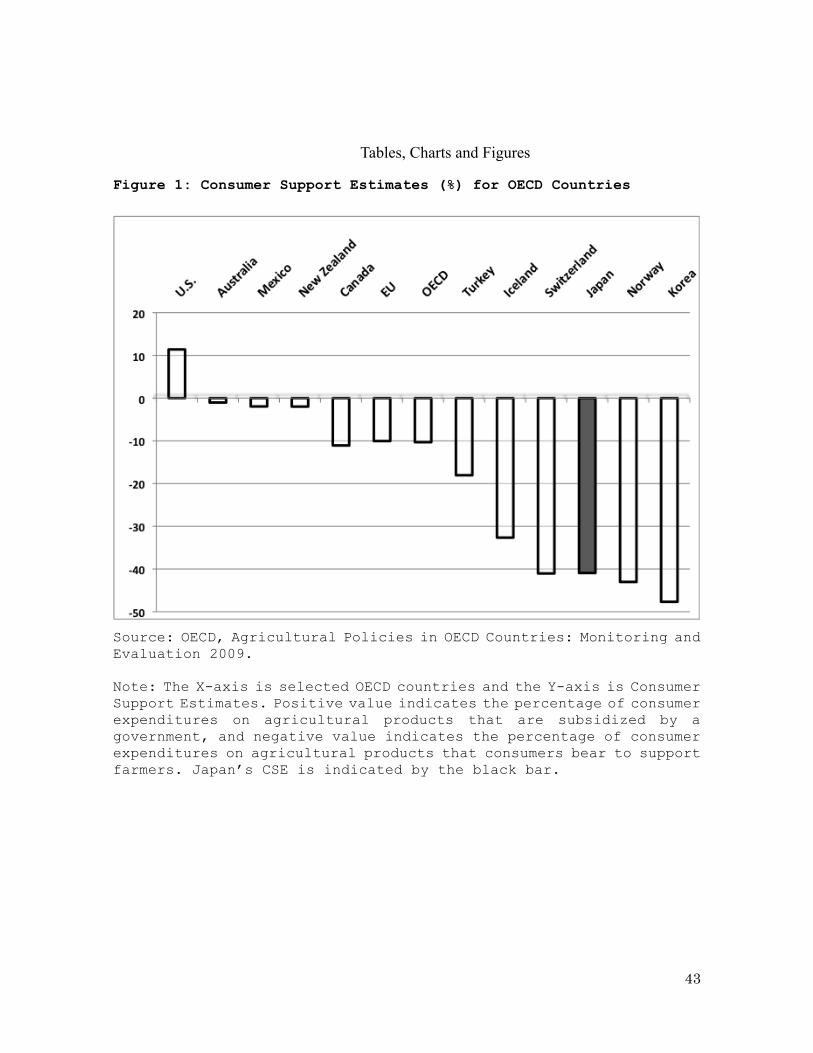
43
! ! ! ! ! ! ! ! ! ! ! Tables, Charts and Figures
Figure 1: Consumer Support Estimates (%) for OECD Countries
Source: OECD, Agricultural Policies in OECD Countries: Monitoring and Evaluation 2009. Note: The X-axis is selected OECD countries and the Y-axis is Consumer Support Estimates. Positive value indicates the percentage of consumer expenditures on agricultural products that are subsidized by a government, and negative value indicates the percentage of consumer expenditures on agricultural products that consumers bear to support farmers. Japan’s CSE is indicated by the black bar.
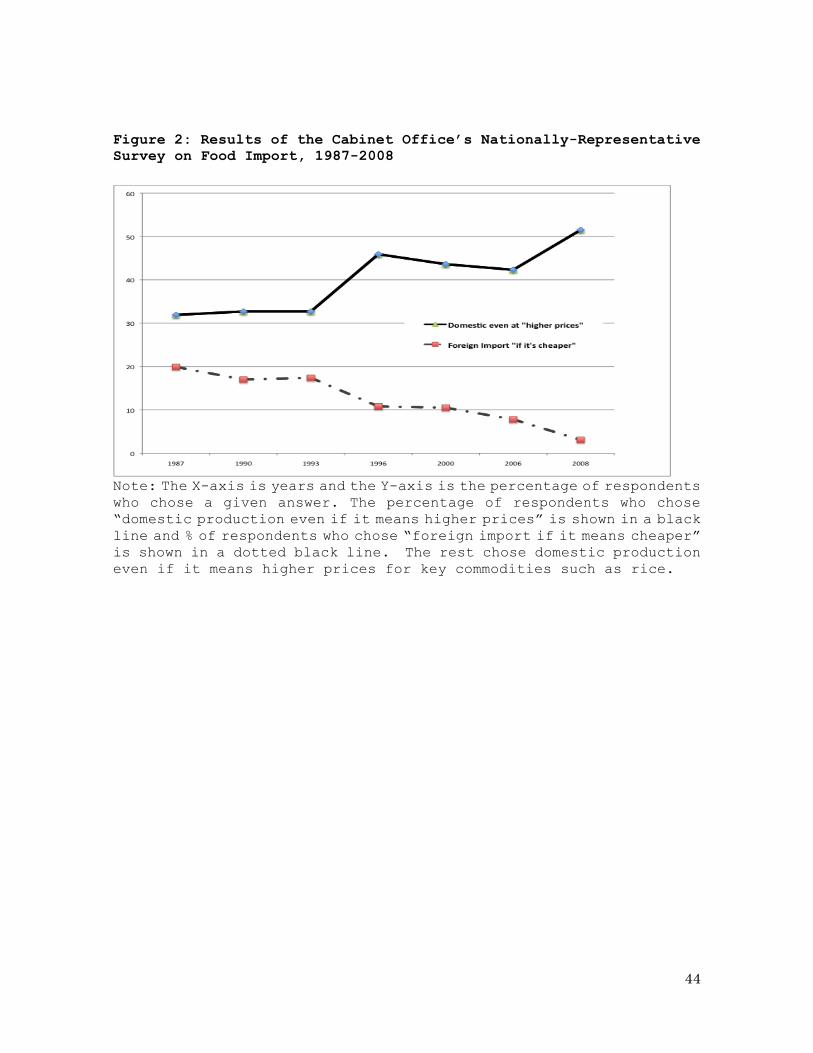
44
Figure 2: Results of the Cabinet Office’s Nationally-Representative
Survey on Food Import, 1987-2008
Note: The X-axis is years and the Y-axis is the percentage of respondents who chose a given answer. The percentage of respondents who chose “domestic production even if it means higher prices” is shown in a black line and % of respondents who chose “foreign import if it means cheaper” is shown in a dotted black line. The rest chose domestic production even if it means higher prices for key commodities such as rice.
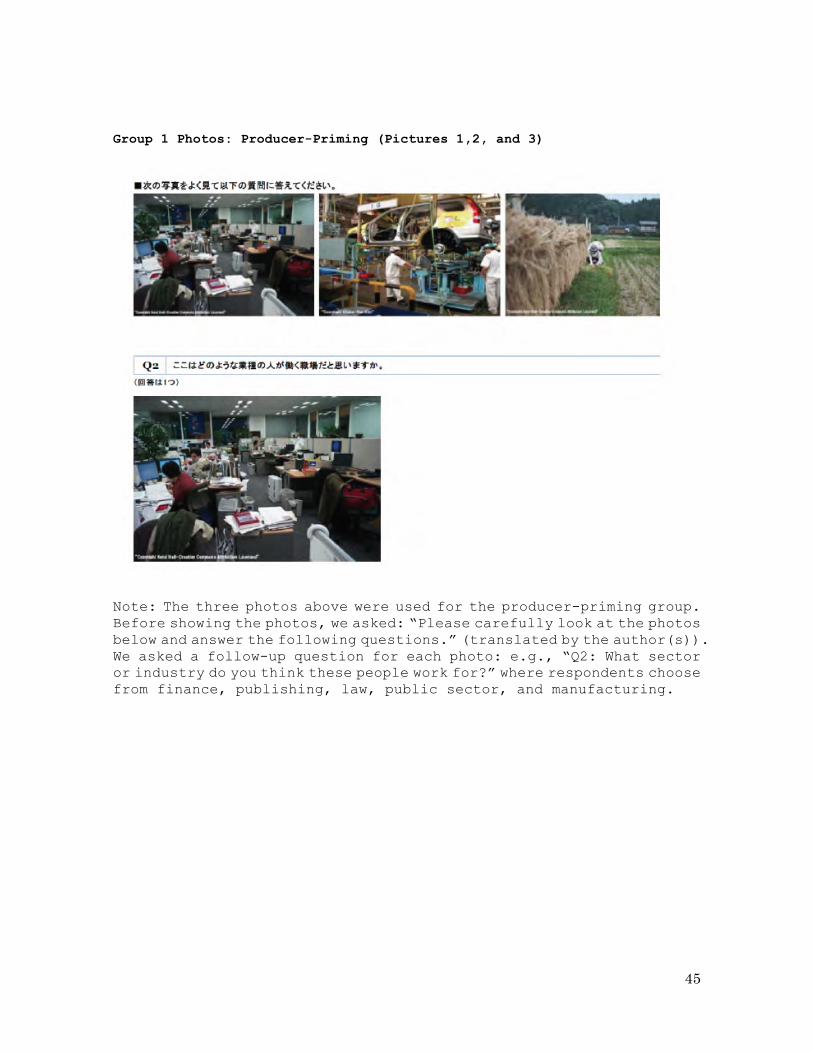
45
Group 1 Photos: Producer-Priming (Pictures 1,2, and 3)
Note: The three photos above were used for the producer-priming group. Before showing the photos, we asked: “Please carefully look at the photos below and answer the following questions.” (translated by the author(s)). We asked a follow-up question for each photo: e.g., “Q2: What sector or industry do you think these people work for?” where respondents choose from finance, publishing, law, public sector, and manufacturing.
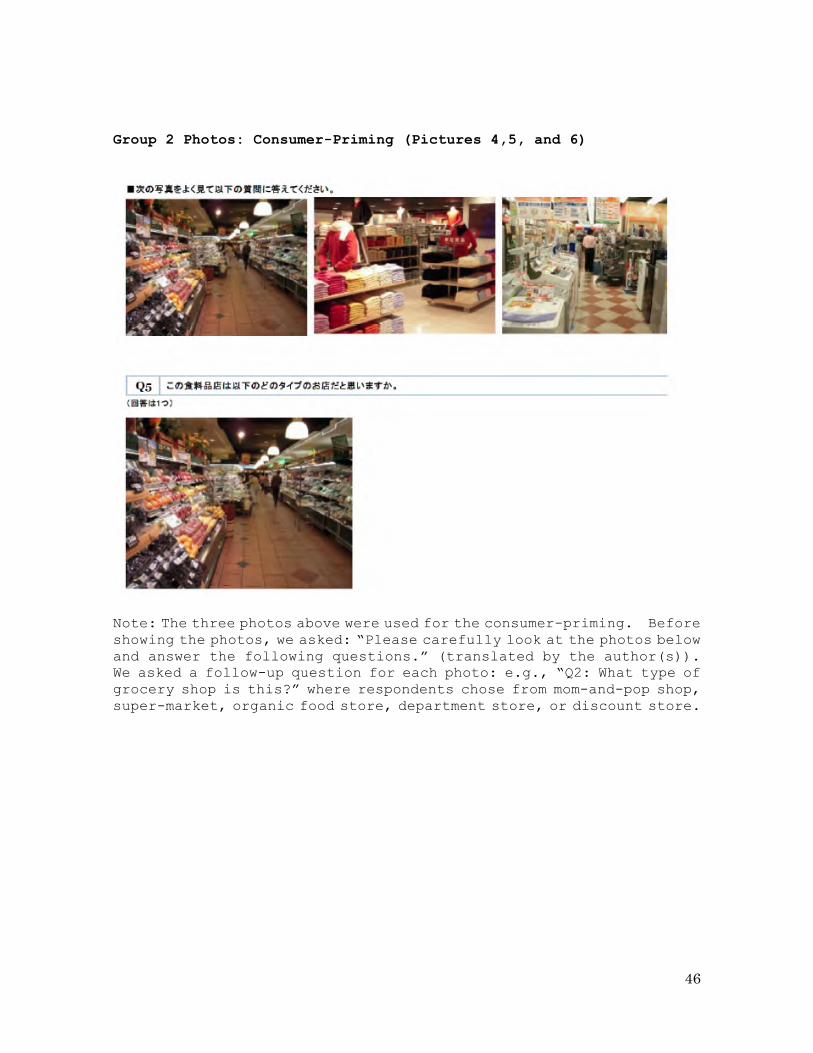
46
Group 2 Photos: Consumer-Priming (Pictures 4,5, and 6)
Note: The three photos above were used for the consumer-priming. Before showing the photos, we asked: “Please carefully look at the photos below and answer the following questions.” (translated by the author(s)). We asked a follow-up question for each photo: e.g., “Q2: What type of grocery shop is this?” where respondents chose from mom-and-pop shop, super-market, organic food store, department store, or discount store.
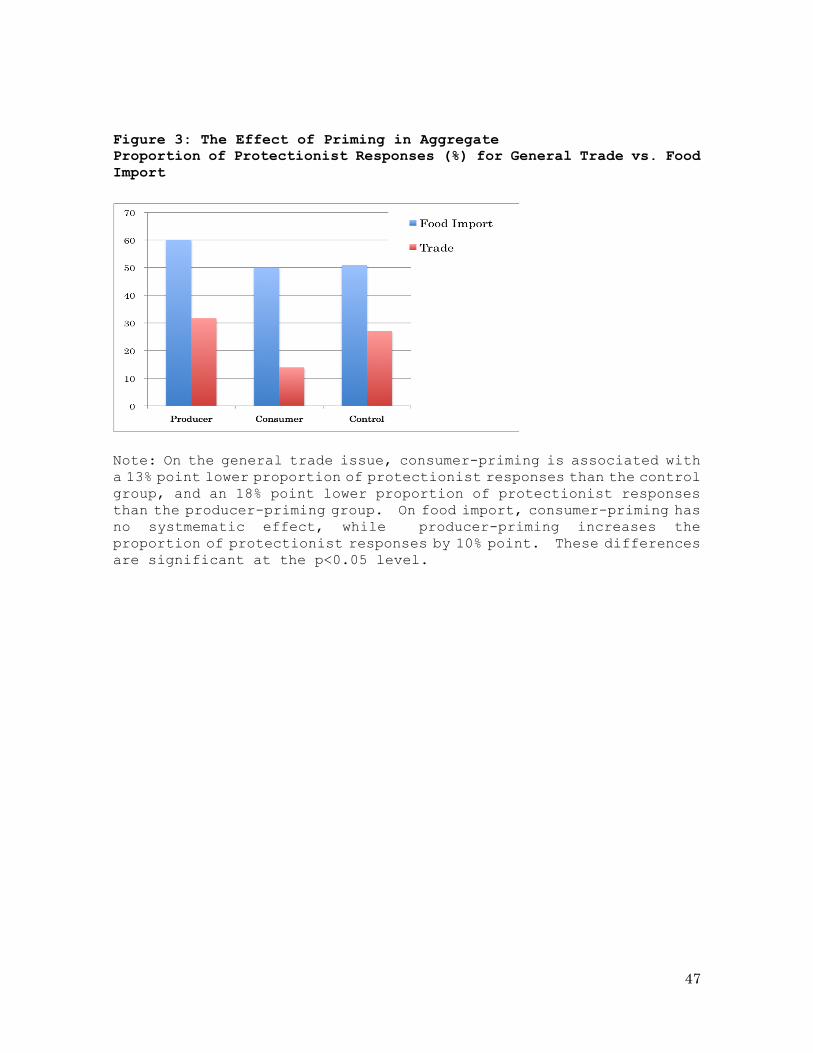
47
Figure 3: The Effect of Priming in Aggregate
Proportion of Protectionist Responses (%) for General Trade vs. Food
Import
Note: On the general trade issue, consumer-priming is associated with a 13% point lower proportion of protectionist responses than the control group, and an 18% point lower proportion of protectionist responses than the producer-priming group. On food import, consumer-priming has no systmematic effect, while producer-priming increases the proportion of protectionist responses by 10% point. These differences are significant at the p<0.05 level.
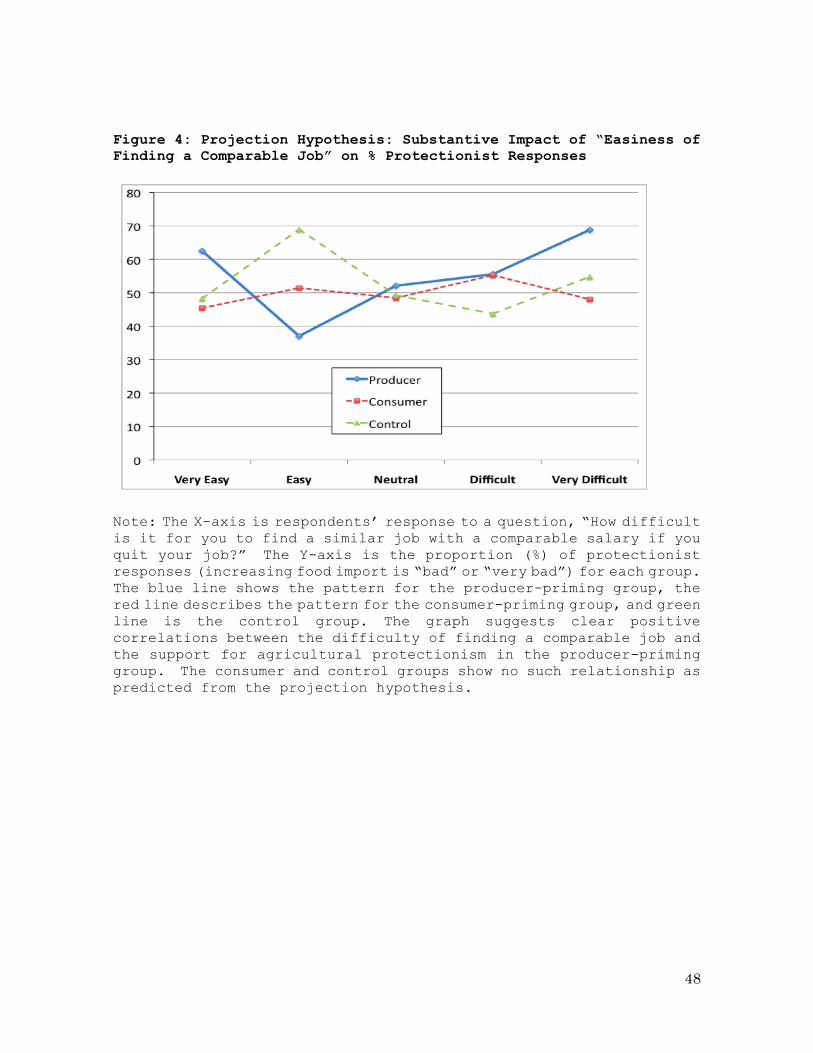
48
Figure 4: Projection Hypothesis: Substantive Impact of “Easiness of
Finding a Comparable Job” on % Protectionist Responses
Note: The X-axis is respondents’ response to a question, “How difficult is it for you to find a similar job with a comparable salary if you quit your job?” The Y-axis is the proportion (%) of protectionist responses (increasing food import is “bad” or “very bad”) for each group. The blue line shows the pattern for the producer-priming group, the red line describes the pattern for the consumer-priming group, and green line is the control group. The graph suggests clear positive correlations between the difficulty of finding a comparable job and the support for agricultural protectionism in the producer-priming group. The consumer and control groups show no such relationship as predicted from the projection hypothesis.
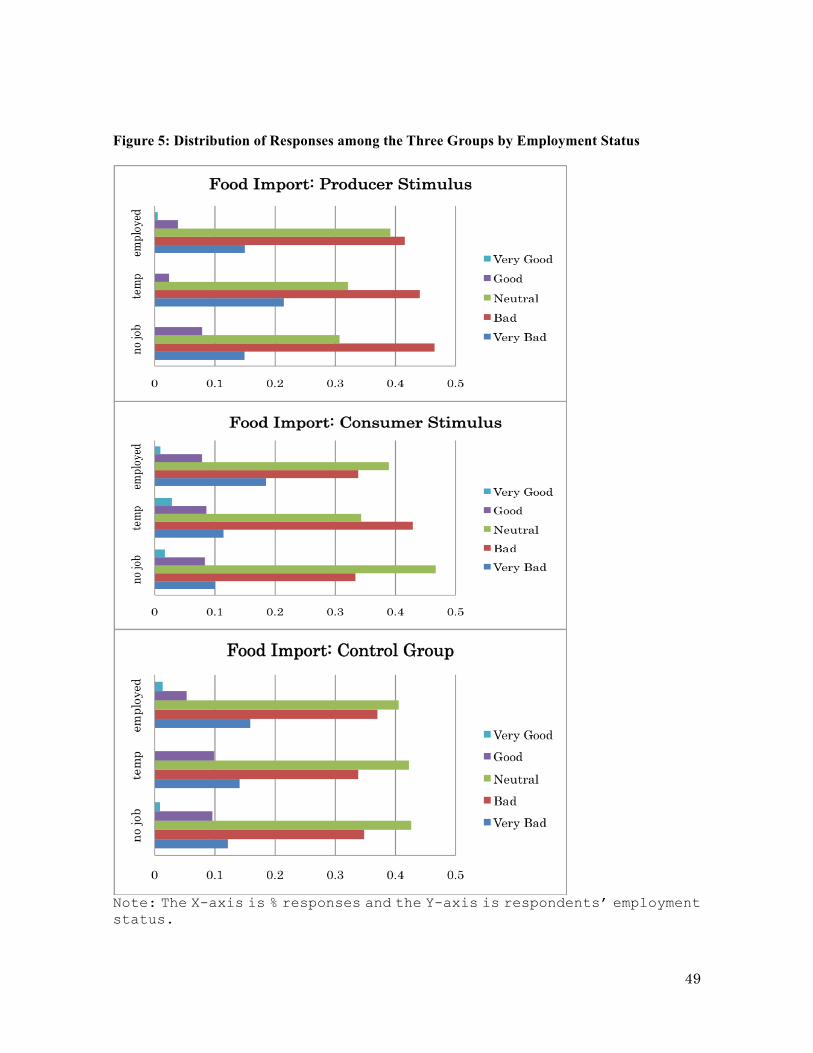
49
Figure 5: Distribution of Responses among the Three Groups by Employment Status
Note: The X-axis is % responses and the Y-axis is respondents’ employment status.

50
Chart 1: Producer and Consumer Interests in the Global Economy
Note: The left chart describes how producer and consumer interests are modeled as a dichotomy and trade-off in the standard trade literature. The right chart describes two sources of complexity in identifying preferences and power of producers and consumers over the issue of food import: (i) overlapping and multifaceted identities as producers & consumers, (ii) consumer interests can lead to either free trade or protectionist preferences.

51
! "#$%&!'(!)**+*,-&!"./#0-!122&3*4!.2!50&&!"0#-&! !
! 6&7#*+8&! 6&,*0#%! 9.4+*+8&!
! :&0;!<#-! <#-! ! =..-! :&0;!=..-!
)%%!>&4?.@-&@*4! AB! 'CB! ADB! 'EB! FB!
G6H''CIJ! ! ! ! ! !
90.-,3&0!K*+L,%+! CB! FDB! AFB! AB! 'B!
G6HMN'J! ! ! ! ! !
O.@4,L&0!K*+L,%+! MB! ''B! AAB! 'AB! DB!
G6HMNIJ! ! ! ! ! !
O.@*0.%!=0.,?! PB! FEB! AMB! NB! 'B!
G6HMNNJ! ! ! ! ! !
! "#$%&!F(!)**+*,-&!"./#0-!122&3*4!.2!5..-!QL?.0*!
! 6&7#*+8&! 6&,*0#%! 9.4+*+8&!
! :&0;!<#-! <#-! ! =..-! :&0;!=..-!
)%%!>&4?.@-&@*4! 'IB! MCB! MNB! PB! 'B!
G6H''N'J! ! ! ! ! !
90.-,3&0!K*+L,%+! 'AB! DDB! MIB! IB! ERF!B!
G6HMNIJ! ! ! ! ! !
O.@4,L&0!K*+L,%+! 'IB! MIB! DEB! CB! FB!
G6HMNAJ! ! ! ! ! !
O.@*0.%!=0.,?! 'IB! MAB! D'B! PB! '!B!
G6HDEEJ! ! ! ! ! !
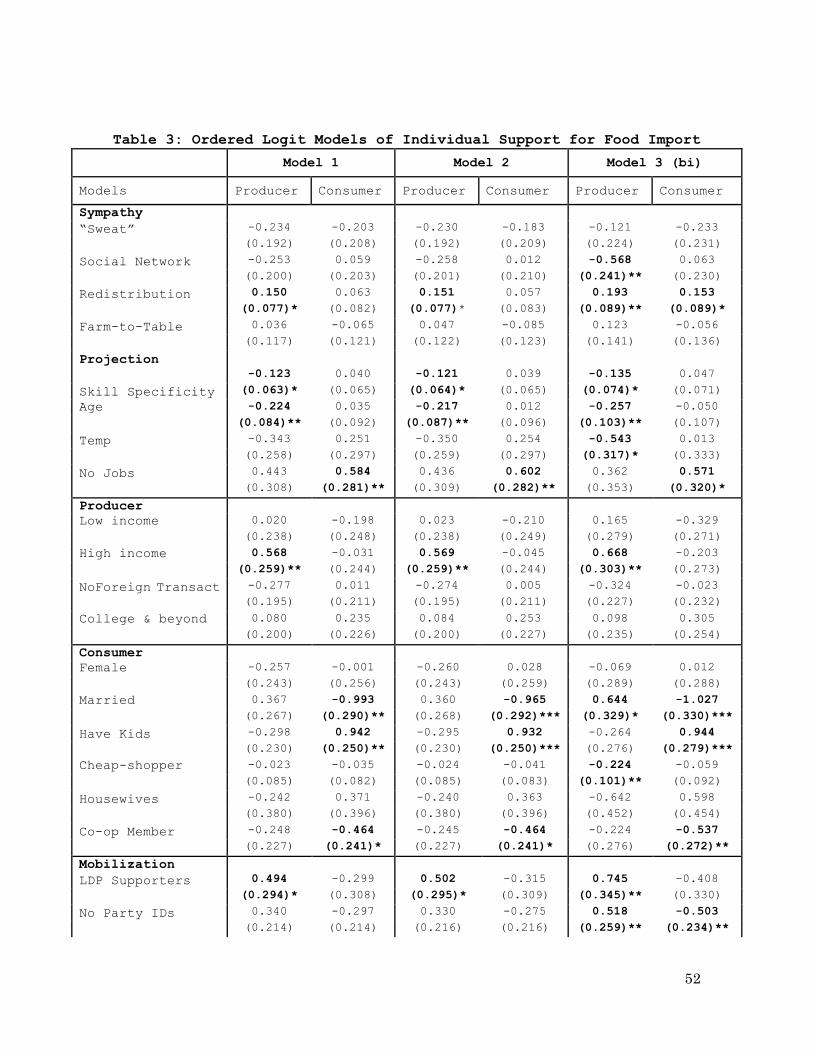
52
Table 3: Ordered Logit Models of Individual Support for Food Import
Model 1 Model 2 Model 3 (bi)
Models Producer Consumer Producer Consumer Producer Consumer
Sympathy
“Sweat” -0.234 -0.203 -0.230 -0.183 -0.121 -0.233
(0.192) (0.208) (0.192) (0.209) (0.224) (0.231)
Social Network -0.253 0.059 -0.258 0.012 -0.568 0.063
(0.200) (0.203) (0.201) (0.210) (0.241)** (0.230)
Redistribution 0.150 0.063 0.151 0.057 0.193 0.153
(0.077)* (0.082) (0.077)* (0.083) (0.089)** (0.089)*
Farm-to-Table 0.036 -0.065 0.047 -0.085 0.123 -0.056
(0.117) (0.121) (0.122) (0.123) (0.141) (0.136)
Projection
-0.123 0.040 -0.121 0.039 -0.135 0.047
Skill Specificity (0.063)* (0.065) (0.064)* (0.065) (0.074)* (0.071)
Age -0.224 0.035 -0.217 0.012 -0.257 -0.050
(0.084)**
* (0.092) (0.087)** (0.096) (0.103)** (0.107)
Temp -0.343 0.251 -0.350 0.254 -0.543 0.013
(0.258) (0.297) (0.259) (0.297) (0.317)* (0.333)
No Jobs 0.443 0.584 0.436 0.602 0.362 0.571
(0.308) (0.281)** (0.309) (0.282)** (0.353) (0.320)*
Producer
Attributes
Low income 0.020 -0.198 0.023 -0.210 0.165 -0.329
(0.238) (0.248) (0.238) (0.249) (0.279) (0.271)
High income 0.568 -0.031 0.569 -0.045 0.668 -0.203
(0.259)** (0.244) (0.259)** (0.244) (0.303)** (0.273)
NoForeign Transact -0.277 0.011 -0.274 0.005 -0.324 -0.023
(0.195) (0.211) (0.195) (0.211) (0.227) (0.232)
College & beyond 0.080 0.235 0.084 0.253 0.098 0.305
(0.200) (0.226) (0.200) (0.227) (0.235) (0.254)
Consumer
Attributes
Female -0.257 -0.001 -0.260 0.028 -0.069 0.012
(0.243) (0.256) (0.243) (0.259) (0.289) (0.288)
Married 0.367 -0.993 0.360 -0.965 0.644 -1.027
(0.267) (0.290)**
* (0.268) (0.292)*** (0.329)* (0.330)***
Have Kids -0.298 0.942 -0.295 0.932 -0.264 0.944
(0.230) (0.250)**
* (0.230) (0.250)*** (0.276) (0.279)***
Cheap-shopper -0.023 -0.035 -0.024 -0.041 -0.224 -0.059
(0.085) (0.082) (0.085) (0.083) (0.101)** (0.092)
Housewives -0.242 0.371 -0.240 0.363 -0.642 0.598
(0.380) (0.396) (0.380) (0.396) (0.452) (0.454)
Co-op Member -0.248 -0.464 -0.245 -0.464 -0.224 -0.537
(0.227) (0.241)* (0.227) (0.241)* (0.276) (0.272)**
Mobilization
LDP Supporters 0.494 -0.299 0.502 -0.315 0.745 -0.408
(0.294)* (0.308) (0.295)* (0.309) (0.345)** (0.330)
No Party IDs 0.340 -0.297 0.330 -0.275 0.518 -0.503
(0.214) (0.214) (0.216) (0.216) (0.259)** (0.234)**
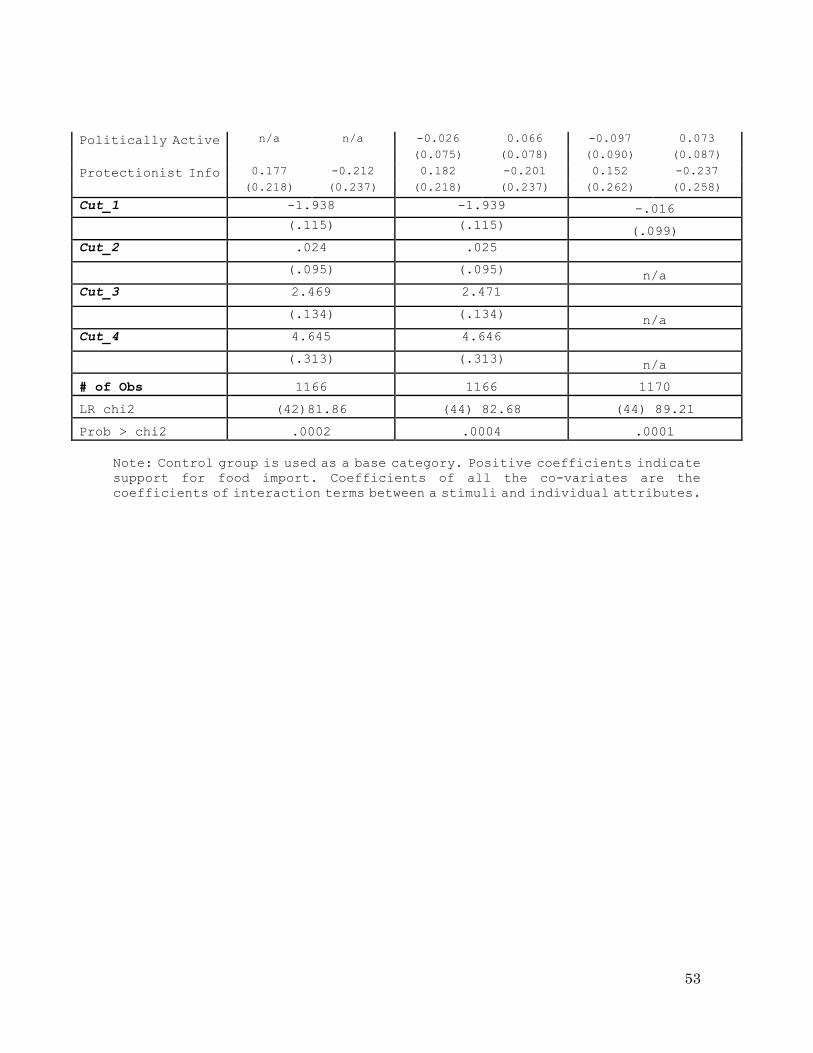
53
Politically Active n/a n/a -0.026 0.066 -0.097 0.073
(0.075) (0.078) (0.090) (0.087)
Protectionist Info 0.177 -0.212 0.182 -0.201 0.152 -0.237
(0.218) (0.237) (0.218) (0.237) (0.262) (0.258)
Cut_1 -1.938 -1.939 -.016
(.115) (.115) (.099)
Cut_2 .024 .025
(.095) (.095) n/a
Cut_3 2.469 2.471
(.134) (.134) n/a
Cut_4 4.645 4.646
(.313) (.313) n/a
# of Obs 1166 1166 1170
LR chi2 (42)81.86 (44) 82.68 (44) 89.21
Prob > chi2 .0002 .0004 .0001
Note: Control group is used as a base category. Positive coefficients indicate support for food import. Coefficients of all the co-variates are the coefficients of interaction terms between a stimuli and individual attributes.
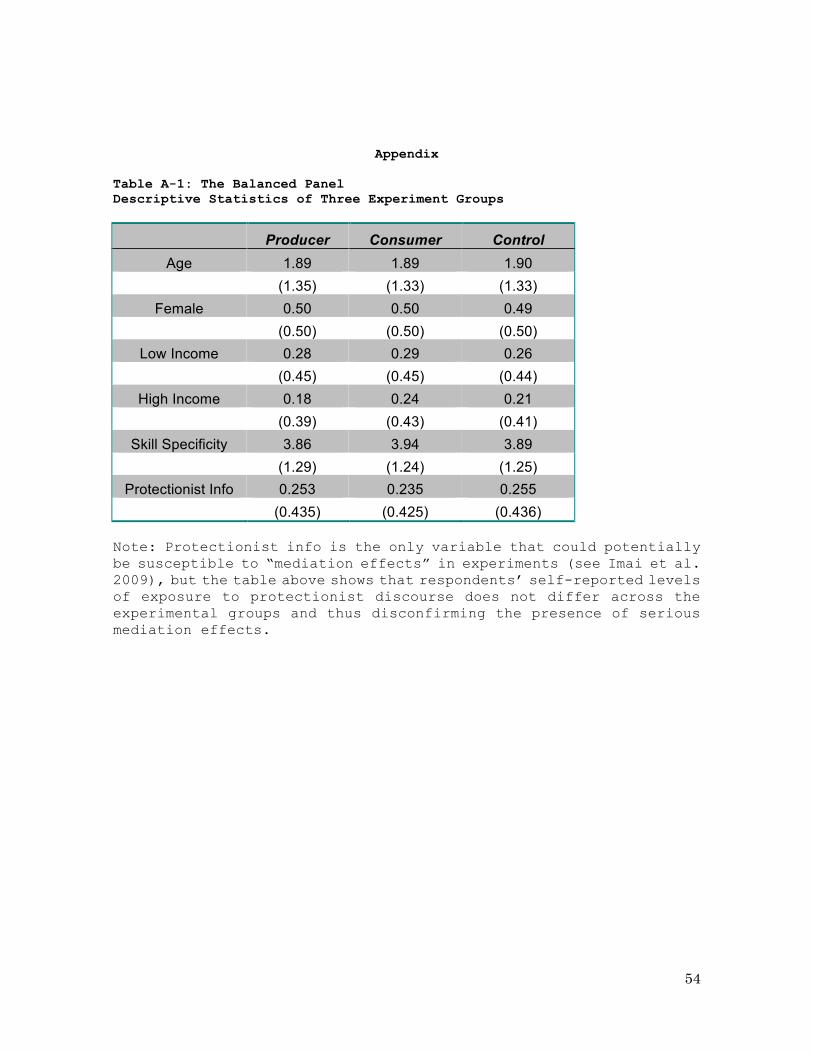
54
Appendix
Table A-1: The Balanced Panel
Descriptive Statistics of Three Experiment Groups
! Producer Consumer Control
Age 1.89 1.89 1.90
(1.35) (1.33) (1.33)
Female 0.50 0.50 0.49
(0.50) (0.50) (0.50)
Low Income 0.28 0.29 0.26
(0.45) (0.45) (0.44)
High Income 0.18 0.24 0.21
(0.39) (0.43) (0.41)
Skill Specificity 3.86 3.94 3.89
(1.29) (1.24) (1.25)
Protectionist Info 0.253 0.235 0.255
! (0.435) (0.425) (0.436)
Note: Protectionist info is the only variable that could potentially be susceptible to “mediation effects” in experiments (see Imai et al. 2009), but the table above shows that respondents’ self-reported levels of exposure to protectionist discourse does not differ across the experimental groups and thus disconfirming the presence of serious mediation effects.
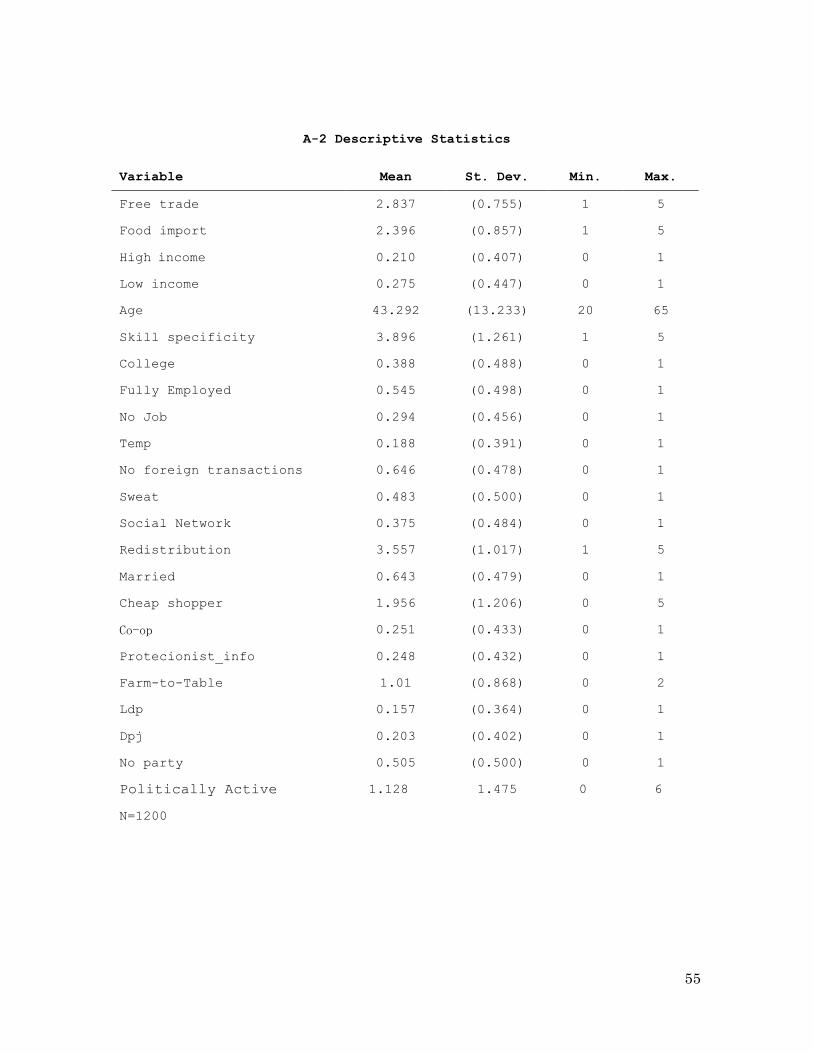
55
A-2 Descriptive Statistics
Variable Mean St. Dev. Min. Max.
Free trade 2.837 (0.755) 1 5
Food import 2.396 (0.857) 1 5
High!income 0.210 (0.407) 0 1
Low income 0.275 (0.447) 0 1
Age 43.292 (13.233) 20 65
Skill specificity 3.896 (1.261) 1 5
College 0.388 (0.488) 0 1
Fully Employed 0.545 (0.498) 0 1
No Job 0.294 (0.456) 0 1
Temp 0.188 (0.391) 0 1
No foreign transactions 0.646 (0.478) 0 1
Sweat 0.483 (0.500) 0 1
Social Network 0.375 (0.484) 0 1
Redistribution 3.557 (1.017) 1 5
Married 0.643 (0.479) 0 1
Cheap shopper 1.956 (1.206) 0 5
!"#"$! 0.251 (0.433) 0 1
Protecionist_info 0.248 (0.432) 0 1
Farm-to-Table 1.01 (0.868) 0 2
Ldp 0.157 (0.364) 0 1
Dpj 0.203 (0.402) 0 1
No party 0.505 (0.500) 0 1
Politically Active 1.128 1.475 0 6
N=1200 ! ! ! !
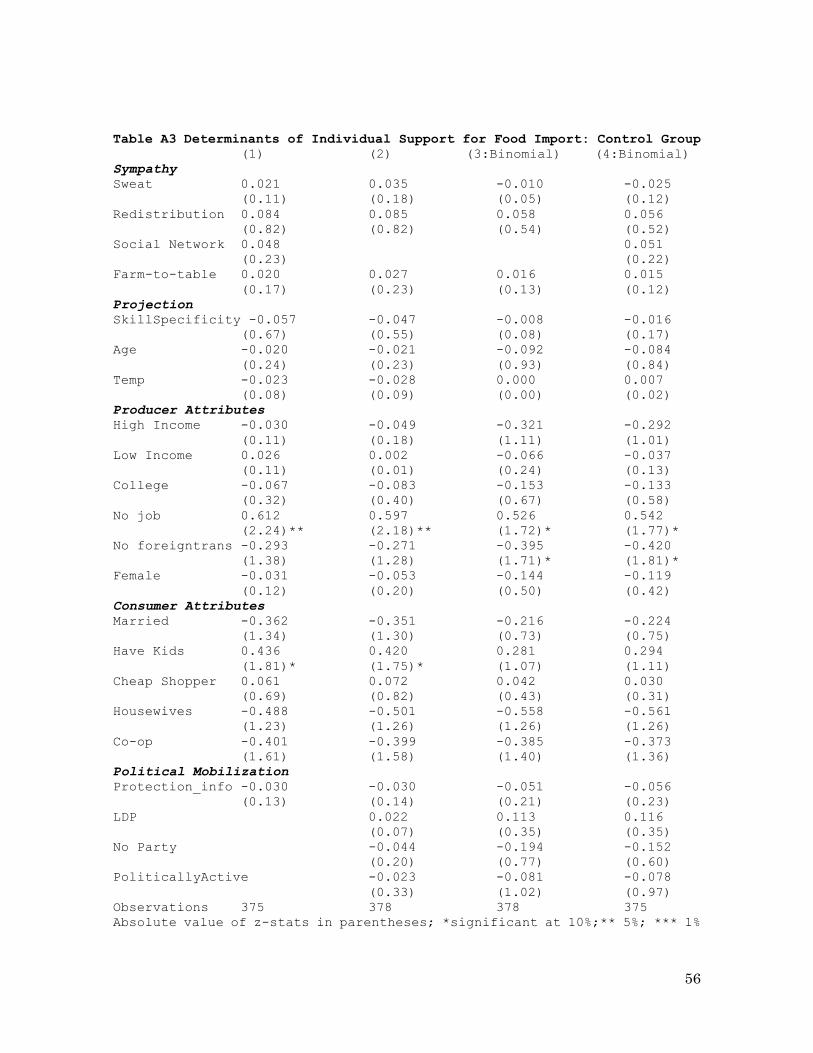
56
Table A3 Determinants of Individual Support for Food Import: Control Group (1) (2) (3:Binomial) (4:Binomial) Sympathy Sweat 0.021 0.035 -0.010 -0.025 (0.11) (0.18) (0.05) (0.12) Redistribution 0.084 0.085 0.058 0.056 (0.82) (0.82) (0.54) (0.52) Social Network 0.048 0.051 (0.23) (0.22) Farm-to-table 0.020 0.027 0.016 0.015 (0.17) (0.23) (0.13) (0.12) Projection SkillSpecificity -0.057 -0.047 -0.008 -0.016 (0.67) (0.55) (0.08) (0.17) Age -0.020 -0.021 -0.092 -0.084 (0.24) (0.23) (0.93) (0.84) Temp -0.023 -0.028 0.000 0.007 (0.08) (0.09) (0.00) (0.02) Producer Attributes High Income -0.030 -0.049 -0.321 -0.292 (0.11) (0.18) (1.11) (1.01) Low Income 0.026 0.002 -0.066 -0.037 (0.11) (0.01) (0.24) (0.13) College -0.067 -0.083 -0.153 -0.133 (0.32) (0.40) (0.67) (0.58) No job 0.612 0.597 0.526 0.542 (2.24)** (2.18)** (1.72)* (1.77)* No foreigntrans -0.293 -0.271 -0.395 -0.420 (1.38) (1.28) (1.71)* (1.81)* Female -0.031 -0.053 -0.144 -0.119 (0.12) (0.20) (0.50) (0.42) Consumer Attributes Married -0.362 -0.351 -0.216 -0.224 (1.34) (1.30) (0.73) (0.75) Have Kids 0.436 0.420 0.281 0.294 (1.81)* (1.75)* (1.07) (1.11) Cheap Shopper 0.061 0.072 0.042 0.030 (0.69) (0.82) (0.43) (0.31) Housewives -0.488 -0.501 -0.558 -0.561 (1.23) (1.26) (1.26) (1.26) Co-op -0.401 -0.399 -0.385 -0.373 (1.61) (1.58) (1.40) (1.36) Political Mobilization Protection_info -0.030 -0.030 -0.051 -0.056 (0.13) (0.14) (0.21) (0.23) LDP 0.022 0.113 0.116 (0.07) (0.35) (0.35) No Party -0.044 -0.194 -0.152 (0.20) (0.77) (0.60) PoliticallyActive -0.023 -0.081 -0.078 (0.33) (1.02) (0.97) Observations 375 378 378 375 Absolute value of z-stats in parentheses; *significant at 10%;** 5%; *** 1%
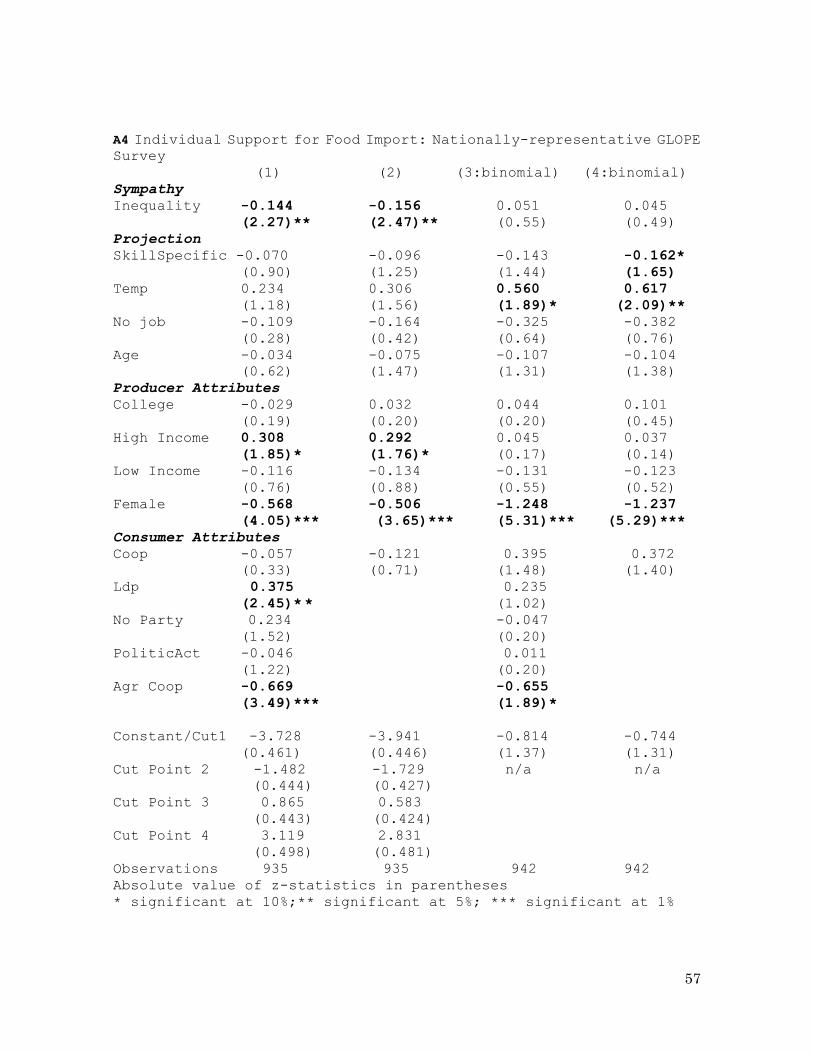
57
A4 Individual Support for Food Import: Nationally-representative GLOPE Survey (1) (2) (3:binomial) (4:binomial) Sympathy Inequality -0.144 -0.156 0.051 0.045 (2.27)** (2.47)** (0.55) (0.49) Projection SkillSpecific -0.070 -0.096 -0.143 -0.162*
(0.90) (1.25) (1.44) (1.65) Temp 0.234 0.306 0.560 0.617 (1.18) (1.56) (1.89)* (2.09)**
No job -0.109 -0.164 -0.325 -0.382 (0.28) (0.42) (0.64) (0.76) Age -0.034 -0.075 -0.107 -0.104 (0.62) (1.47) (1.31) (1.38) Producer Attributes College -0.029 0.032 0.044 0.101 (0.19) (0.20) (0.20) (0.45) High Income 0.308 0.292 0.045 0.037 (1.85)* (1.76)* (0.17) (0.14) Low Income -0.116 -0.134 -0.131 -0.123 (0.76) (0.88) (0.55) (0.52) Female -0.568 -0.506 -1.248 -1.237
(4.05)*** (3.65)*** (5.31)*** (5.29)***
Consumer Attributes Coop -0.057 -0.121 0.395 0.372 (0.33) (0.71) (1.48) (1.40) Ldp 0.375 0.235 (2.45)* * (1.02) No Party 0.234 -0.047 (1.52) (0.20) PoliticAct -0.046 0.011 (1.22) (0.20) Agr Coop -0.669 -0.655 (3.49)*** (1.89)*
Constant/Cut1 -3.728 -3.941 -0.814 -0.744
(0.461) (0.446) (1.37) (1.31) Cut Point 2 -1.482 -1.729 n/a n/a (0.444) (0.427) Cut Point 3 0.865 0.583 (0.443) (0.424) Cut Point 4 3.119 2.831 (0.498) (0.481) Observations 935 935 942 942 Absolute value of z-statistics in parentheses * significant at 10%;** significant at 5%; *** significant at 1%
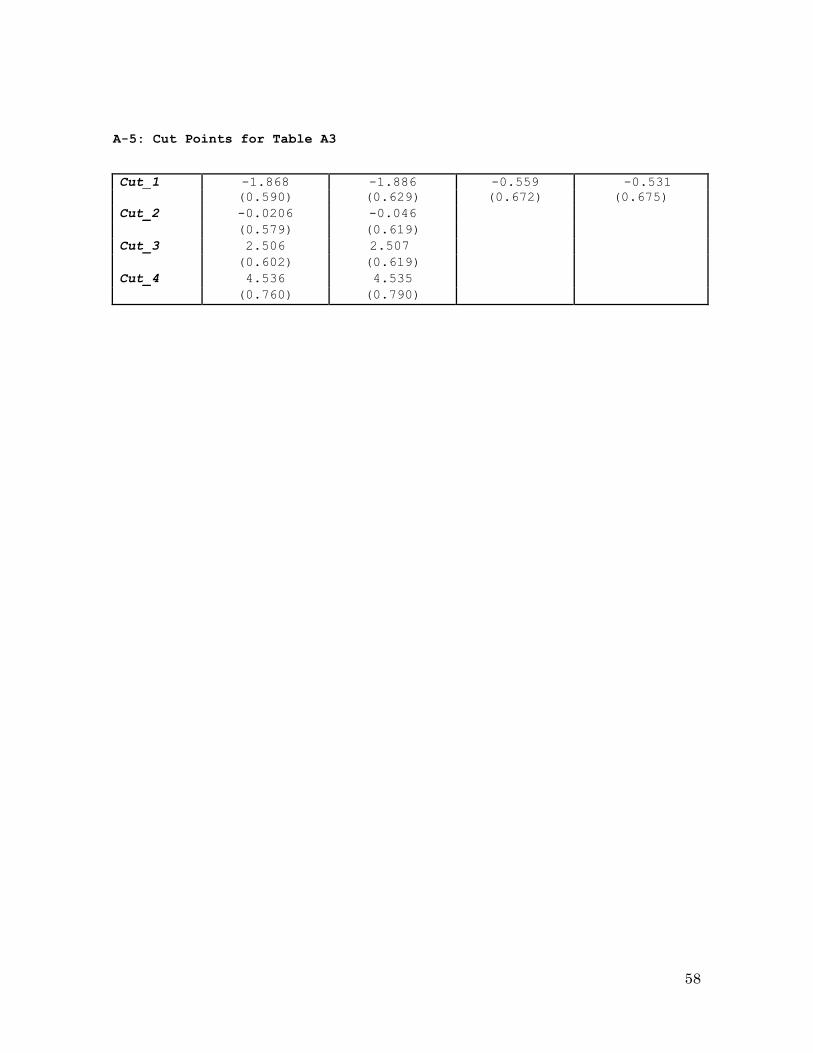
58
A-5: Cut Points for Table A3
Cut_1 -1.868 -1.886 -0.559 -0.531 (0.590) (0.629) (0.672) (0.675)
Cut_2 -0.0206 -0.046
(0.579) (0.619)
Cut_3 2.506 2.507
(0.602) (0.619)
Cut_4 4.536 4.535
(0.760) (0.790)