Embed Size (px)
Citation preview
Explaining different types of computer use among primary school teachers (Paper 551 European Journal of Psychology of Education) Author information Johan P. van Braak, PhD. Department of Education Ghent University Henri Dunantlaan 2 9000 Ghent Belgium Tel +32 9 264 86 67 Fax +32 9 264 86 88 E-mail <[email protected]> Co-authors Jo Tondeur Department of Education Ghent University Martin Valcke Department of Education Ghent University Keywords: class use of computers, supportive computer use, computer attitudes, technological innovativeness, primary education, path modelling
1
Explaining different types of computer use among primary school teachers
ABSTRACT In order to identify differences in determinants of supportive and class use of computers, path modelling was applied in a sample of 468 primary school teachers. Independent variables were categorised in three levels: demographics (age and gender), computer experience (computer training, computer experience expressed over time, intensity of computer use), and attitude measures (general computer attitudes, attitudes toward computers in education, and technological innovativeness). Computer support and class are not related to the same set of variables. Computer support was mainly predicted by computer experience variables and general computer attitudes. Strongest predictors of class use were technological innovativeness and gender. Yet, the degree of explained variance for class use of computer was considerably lower compared to supportive computer use. These results indicate the limitations of explaining complex forms of professional computer use on the basis of both individual determinants and quantitative models. The article concludes with some practical implications and recommendations for further research.

2
STATEMENT OF THE PROBLEM Since about a quarter of a century, the educational potential of computers is being explored by educationalists. Many authors point to the ability of computers to support and even enhance teaching and learning processes in primary education (Cox et al, 2004; Loveless & Dore, 2002). Other voices are more critical and raise questions concerning the effectiveness of computers (Cuban, Kirkpatrick & Peck, 2001; Robertson, 2002). Although the number of computer users is constantly increasing, few individuals still refuse to accept the value of computer technology for professional purposes. Given the ever-increasing growth of computer use in education, it is essential for researchers to investigate the factors affecting different types of computer use. However, there are many different ways in which the concept of computer use can be defined. From a technical point of view, teachers differ in their abilities to manipulate computers. Many instruments were developed to measure individuals’ degree of technical computer competence (Furst-Bowe et al, 1995; van Braak 2004; Winter, Chudoba & Gutek, 1998). Next to a technical approach, a task-related approach can be adopted. Hogarty, Lang & Kromrey (2003) for example developed a survey to measure teachers’ reported use of technology in their classroom, clustered in different categories: integration, support, confidence and comfort, and attitudes. In this contribution, two general categories of professional computer use will be distinguished for primary education teachers. The first one, supportive computer use, refers to the use of computers for pro-active and administrative tasks. Examples are the use of computers for student administration and evaluation, preparing worksheets and keeping track of pupils’ learning progress. Second, we focus on class use of computers. This refers to the use of computers to support and/or enhance the teaching or learning process, such as the use of computers for demonstration, drill and practice, instruction, and differentiation. The use of computers for both types of professional activities will be assessed. The vast majority of teachers use computers for support in the educational practice; fewer teachers actually integrate computers as a teaching tool or learning device. This leads to the question whether supportive computer use is influenced by other factors than class use. Based on the available literature, possible determinants of teachers’ computer use will be identified. This will be followed by an assessment of the impact of background variables, computer experience and attitude measures on supportive and classroom use of computers.
LITERATURE REVIEW What is affecting the degree of computer use by teachers? In many studies, researchers have focused on measures of computer attitudes and experience. A general finding is that computer experience is positively related to computer attitudes. The more experience individuals have with computers, the more likely their attitudes toward computers will be favourable (Al Khaldi & Al Jabri, 1998; Levine & Donitsa-Schmidt, 1998; Potosky & Bobko, 2001; Rozell & Gardner, 1999; Shashaani, 1997, Williams et al, 2000). Shashaani (1997) demonstrated that computer training has a positive impact on computer attitudes. Using path modelling, Rozell & Gardner (1999) found computer experience to be predictive of computer attitudes. Potosky & Bobko (2001) also
3
demonstrated a strong and positive relationship between computer attitudes and computer experience. In their survey computer attitudes were found to contribute significantly to the prediction of computer experience. Other components related to computer use include access to computers, computer ownership, and age at first computer use (Bradley & Russell, 1997). To examine the correlation between computer attitudes and measures of computer use and experience, researchers developed and validated a considerable number of attitude scales, such as the Computer Attitude Scale (Loyd & Gressard, 1984), the Bath County Computer Attitude Scale (Francis & Evans, 1995), the Computer Attitude Measure (Kay, 1989), the Computer Apathy and Anxiety Scale (Charlton & Birkett, 1995), the General Computer Attitudes Scale (van Braak & Goeman, 2003), and the Technology Profile Inventory (DeYoung & Spence, 2004). As the importance of computers in education is shifting from information towards communication tasks, researchers are beginning to develop instruments to measure the communicative effectiveness of computers in education (Mitra, 2001). Findings of Marcinkiewicz (1993) stress the role of innovativeness as an important determinant of different levels of computer use. Innovativeness is a well studied concept in communication and business research in understanding why individuals adopt a certain innovation or not (for an overview, see Roehrich, 2004). Innovativeness can be defined as a personal attitude towards the adoption of an innovation. Innovativeness refers to the willingness to change, or to the relative speed at which an individual adapts to an innovation as compared to others in the same social system (Rogers & Shoemaker, 1971). In addition to a favourable disposition towards the adoption of a new idea, method or technology, the concept of innovativeness includes an intentional dimension. The members of a given social system can be divided into different categories based on their degree of innovativeness (Rogers, 1995). In this study, the concept of technological innovativeness will be introduced and operationalised as an attitudinal component. Many authors have stressed the existence of a gender gap in computer use and attitudes (DeYoung & Spence, 2004; Jenson, De Castell & Bryson, 2003; Kadijevich, 2000; Khine, 2001; Looker & Thiessen, 2003; Mathews & Guarino, 2000; Shashaani, 1997; Volman & Van Eck, 2001). Therefore it seems imperative to include this variable in the research.
PURPOSE OF THE STUDY The main objective of this study was to examine the effect of demographics (age and gender), computer related experience (duration of computer use, intensity of computer use, and followed computer training), and three attitudinal constructs (general computer attitudes, attitudes toward computers in education and technological innovativeness) on two different types of computer use: supportive computer use and class use. The research question centres on the differential effects of individual teacher characteristics on the two different types of professional computer use. In order to investigate the effect of the independent variables on the two dependent computer use variables, path modelling was applied (Marcoulides & Schumacker, 2001).
METHOD
4
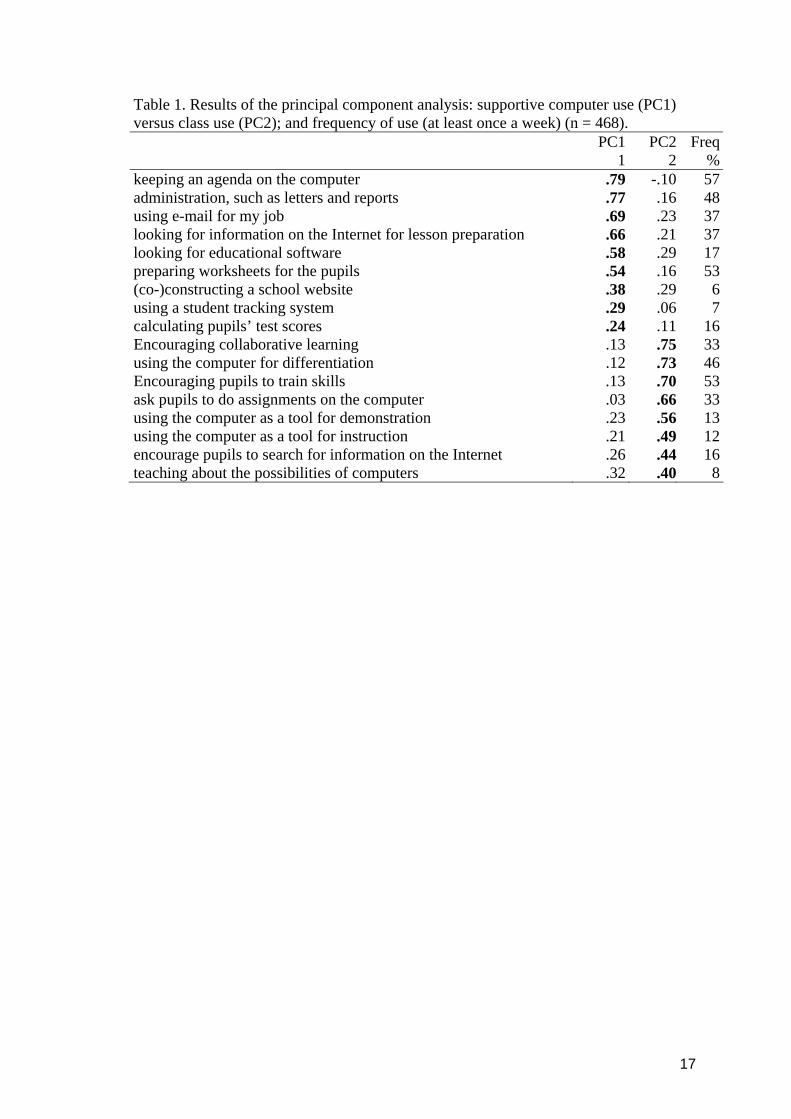
Sample The subjects were 468 teachers working in primary education in East-Flanders, one of the five provinces in Flanders, the Dutch speaking region of Belgium. All primary schools were included in the population, except for the schools for special education, given the specific nature of ICT implementation in these schools. The sample was stratified according to governance (private/official) and degree of urbanization. 60 school principals were contacted to cooperate to this research. At least one teacher per school year would fill in a printed questionnaire. Fifty three principals agreed, representing an 88.3 % response at school level. The questionnaires were distributed and recollected by means of the school principals. The data was collected in April 2004. As a token of appreciation, a small financial reward was offered to all participating schools for each filled out questionnaire. This incentive served as a stimulating factor in raising the response rate. Based on gender, age and governance, the respondents served as a representative sample of the population. Demographics, computer use and experience The sample included 349 females and 119 males; the age range varied from 22 to 61 years, with an average age of 38 years. All teachers in the sample reported to be somehow familiar with computing. The average computer experience was 9.04 years (SD = 4.14). Only 2.6 % of the sample is currently not using a computer, neither for supportive tasks, class use or leisure purposes. On average, teachers use the computer 9.05 hours (SD = 7.27) a week, mostly for professional support (M = 4.35 hours; SD = 3.86) and to a lesser extent for class use (M = 2.28 hours, SD = 2.81) and leisure (M = 2.42 hours; SD = 3.88). Only 12.3 % reported never to use computers in class. Most of the teachers use the computer between one and two hours a week (62.3%) and 25.4% integrate the computer three hours or more in their classrooms. This implies that computers have found their way into classrooms, but the degree of class use expressed over time stays rather limited. More than half of the teachers (56.2%) have followed at least one computer training course during the five previous years. The average computer training courses followed over the last five years was 1.05 (SD = 1.49). Instruments Two types of computer use Based on the literature on computing in education (f.e. Becta, n.d.; Kennewell, Parkinson & Tanner, 1999; Maier et al, 1999), two scales were composed to measure how often teachers use computers for support and in class. The respondents were asked to indicate, on a five point scale, the extent to which they use the computer for various tasks (0 never, 1 every term, 2 monthly, 3 weekly, 4 on a daily basis). A principal component analysis (with orthogonal -varimax- rotation) was used to investigate whether computer support and class use were two substantially distinct constructs. Results are reported in Table 1. One support and two class use items were removed from the item set due to low variability among the respondents (‘using education related discussion list or newsgroups’, ‘keeping contact with pupils after
5
school hours’, ‘giving homework to be submitted on the computer’) . The two-component structure accounted for 43.4 % of the shared variance among the items. The eigenvalues were respectively 7.9 and 3.6 for supportive computer use and class use items. -- Insert Table 1 about here -- The last column in Table 1 reports the proportion of teachers that use the different tasks at least once a week. For support, teachers report to use the computer mostly for keeping an agenda (57%) and preparing worksheets (53%). In class, the computer is mainly used for training skills (drill and practice) (53%) and differentiation activities (46%). Based on the results of the principal component analysis, two summated rating scales were constructed to obtain overall measures of how frequently computers are implemented for supportive and class use. For the nine support tasks, the item-scale correlation varied between r = .24 and r = .73, with an internal consistency, Cronbach’s α = .78. The overall scale mean ranged theoretically between 0 (none of the support tasks are used) and 100 (all the tasks are performed on a daily basis). Scale mean for the total sample was M = 40.6 (SD = 19.4). The eight class use items showed high intercorrelations of r = .39 and r = .62, with an internal consistency (α) of .79. Scale mean for the total sample was M = 34.2 (SD = 18.6), which is significantly lower than the mean score for the support scale (t = -33.0, df = 467, p < .001). Computer attitudes and innovativeness The instruments employed in this study were developed by adapting a wide range of items assessing attitudes toward computers and technological innovation attributes. Three existing instruments were used which were designed and described by van Braak (2001) and van Braak & Goeman (2003). All items followed a 5-point Likert response format (strongly disagree, disagree, neither agree/disagree, agree, strongly agree). The first instrument is the General Attitudes toward Computers Scale (GACS) (van Braak & Goeman, 2003), which is a 7-item scale, containing adapted items from Loyd and Gressard’s Computer Attitude Scale (Loyd & Gressard, 1984; Loyd & Loyd, 1985). It comprises items relating to computer liking, computer anxiety, and computer confidence. The original scale was validated on a sample of 381 subjects (van Braak & Goeman, 2003) and showed a high internal consistency, with Cronbach’s α = .85. In the current survey, internal consistency was α = .84. Scale mean was M = 73.8 (SD = 16.9). The second instrument assesses attitudes toward the use of computers in the classroom. The Attitudes toward Computers in Education Scale (ACES) was developed by van Braak (2001) and measures teachers’ attitudes toward the effects of computer adoption in the classroom. Compared to general computer attitudes, attitudes toward computers in education are a distinct construct (van Braak, 2001). The original instrument contains 12 Likert-items and showed an internal consistency of α = .89 (van Braak, 2001). Since the original instrument was developed for a sample of secondary school teachers, four items specific for secondary education were removed from the instrument. The 8-item Attitudes toward Computers in Education Scale in this survey showed a high internal consistency (α = .83). Scale mean was M = 64.4 (SD = 13.2).

6
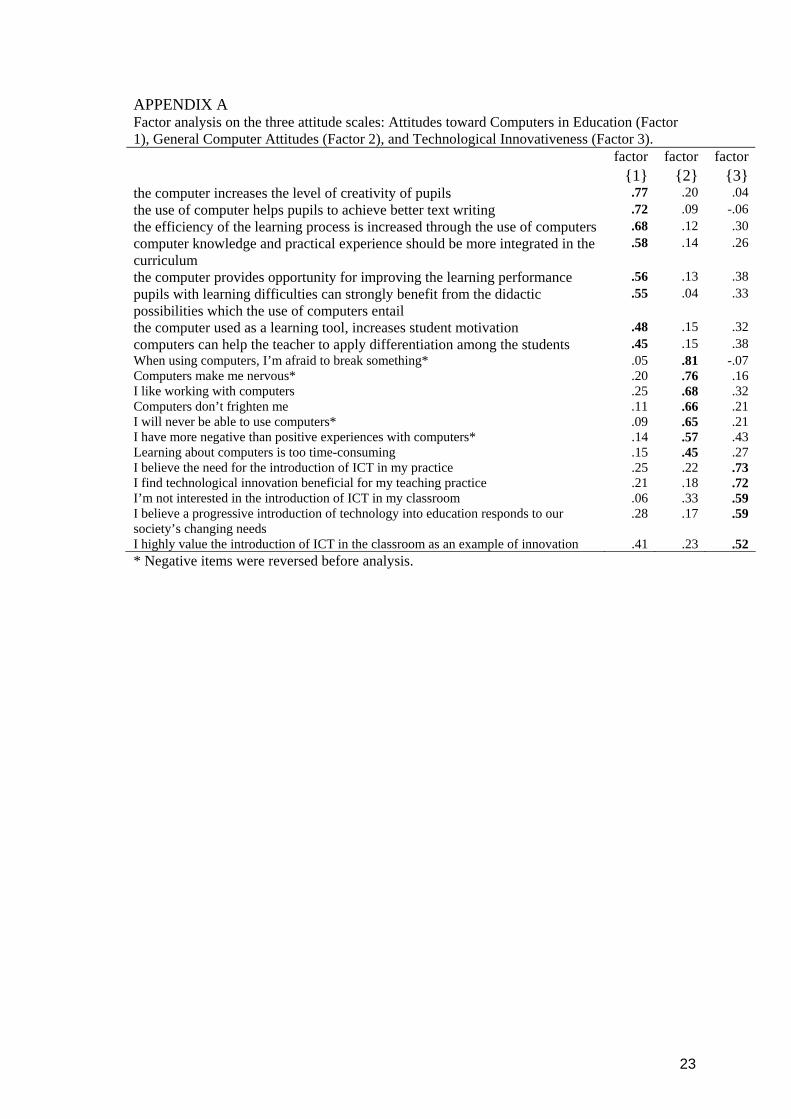
Technological innovativeness is a measure used to assess a person’s attitudes towards the need to introduce technology (ICT) in education, coupled with a personal willingness to introduce computer technology in the classroom. Van Braak (2001) developed an 11-item technological innovativeness scale. In this survey, an adaptation of the original scale was used. Five items measuring innovativeness were included. The internal consistency of the five-item scale was α = .79; scale mean was M = 75.8 (SD = 14.8). The conceptual difference of the three attitude measures was assessed by a factor analysis. A three-component model with orthogonal rotation was run for the 468 subjects. A three-component structure was confirmed. The eigenvalues obtained were 7.0 for the attitudes toward computers in education scale, 2.0 for the general computer attitude scale and 1.2 for the technological innovativeness scale. This solution accounted for 51.4% of the shared variance among the items. Items and factor loadings are presented in Appendix A.

7
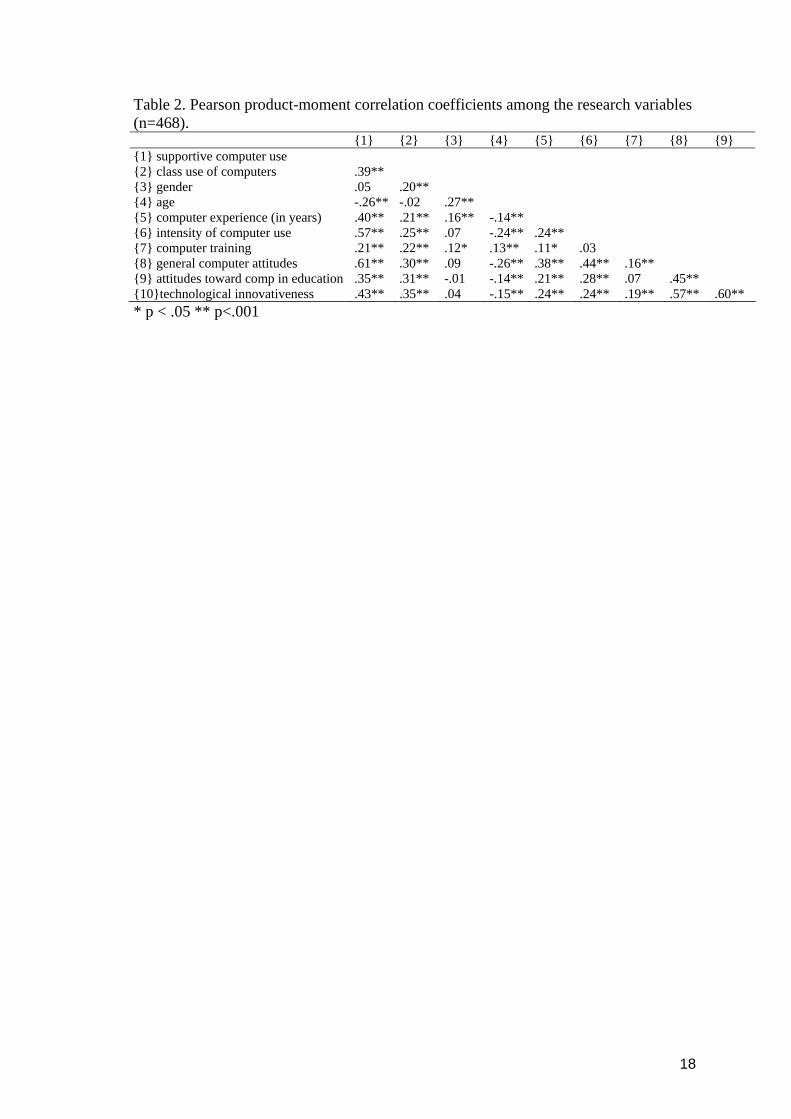
RESULTS Correlations Table 2 provides the bivariate correlates among the research variables. -- Insert Table 2 about here -- Although factor analysis confirmed that the attitude scales could be broken down into three distinct constructs, the three attitude scales intercorrelate strongly. The product moment correlations between the three attitude measures vary between r = .45 and r = .60. Further, the results suggest high interrelationships among the two dependent computer use variables (supportive computer use and class use of computers) and the other research variables. Both supportive computer use and class use are significantly related to the demographic variables, the computer experience variables and the three attitude measures. The only exceptions are the absence of connections between supportive use of computers and gender, and between class use of computers and age. The results give a first impression of the relationship among the research variables. Yet, these bivariate correlations measures do not provide sufficient information on possible causal relationships when controlling for the effect of other influencing variables. In a next step, the effects of the attitude measures on the dependent computer use variables will be assessed, together with the influence of demographic and computer experience variables. Path modelling Path analysis was used to model the complex relationships between demographic factors, computer experience variables and the attitudinal variables upon the two computer use variables. A first goal was to estimate the predictive power of a set of independent variables on the two different types of computer use (expressed as the adjusted R² coefficient). Secondly, the strength of the direct and indirect effects of the predictor variables on the dependent variables was assessed. At the same time the models allowed to look for possible differential effects of the predictors on the two types of computer use. Interrelations among variables were calculated as correlation coefficients (r) and direct effects on endogenous variables as standardized beta-weight (path coefficients or β’s). The path models were estimated using AMOS 5.0 (Arbuckle & Wothke, 1999; Arbuckle, 2003). For each dependent variable, three path models were estimated. In a first model (Model A), the effect of the demographic variables on the dependent computer use variable was tested. In a second model (Model B), the effect of the computer experience variables was added to the demographic variables. In a third model finally, the three attitude measures were added. In each step, the increase in the explained variance in the dependent computer use variable can be assessed (R² change). The three steps are presented in Table 3 for the supportive computer use variable and in Table 4 for the class use of computers variable. For all models, fit measures are reported (Goodness of Fit, Adjusted Goodness of Fit, X² and corresponding p-value). Finally, the differential effect of the research variables on both dependent computer use variables was analysed.
8
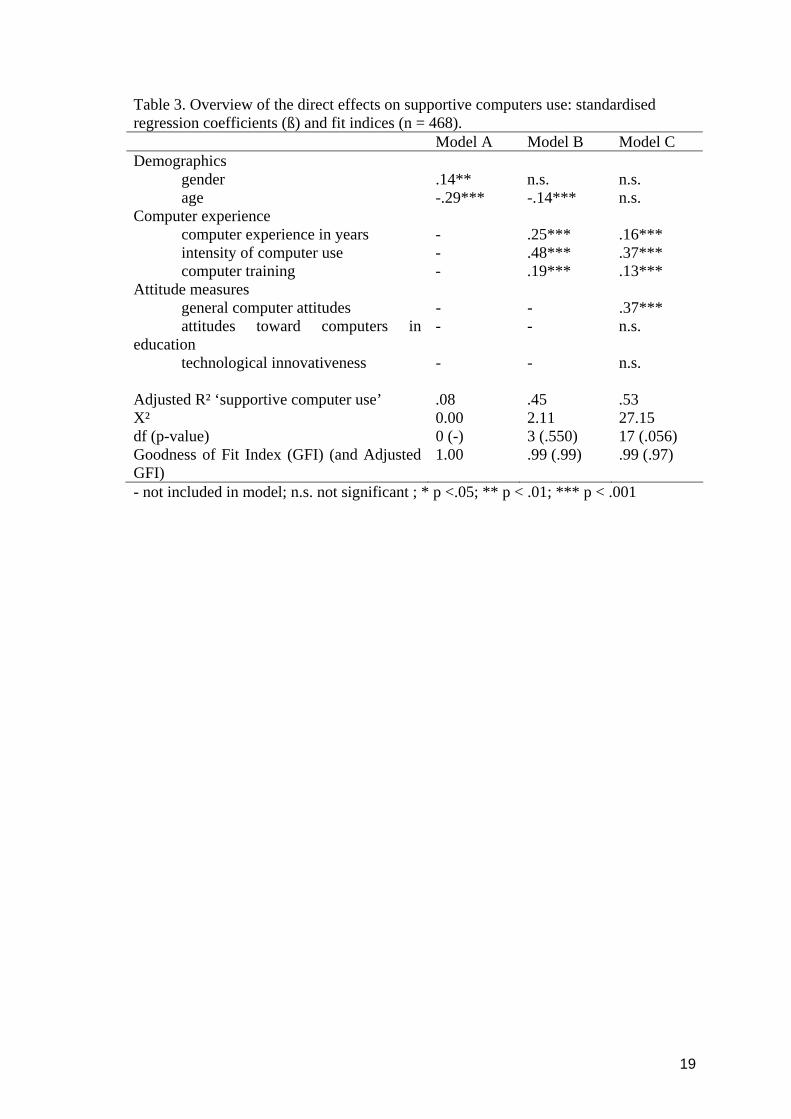
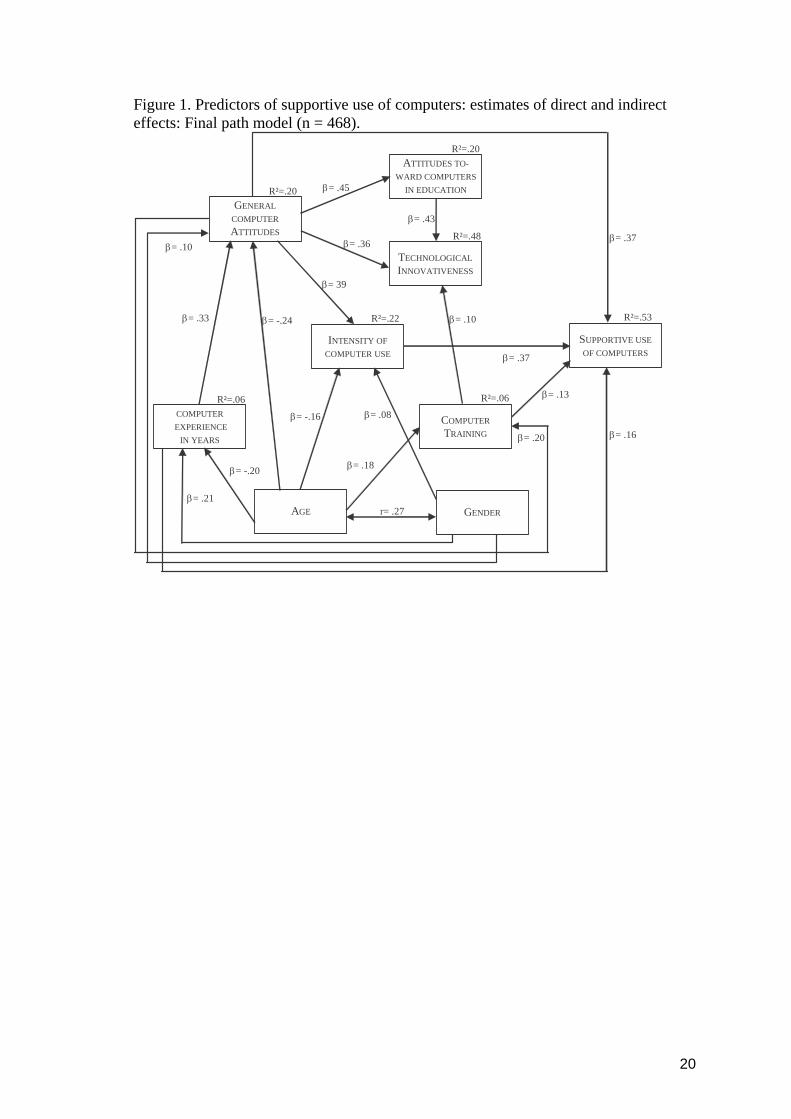
Supportive computer use -- Insert Table 3 about here -- 8% of the variance in supportive computer use can be attributed to age and gender. Especially age is negatively associated with this variable (ß = -.29). When computer experience variables (Model B) are added, the direct influence of age and gender decrease significantly and disappear when attitudes are added (Model C). In Model B the addition of computer experience variables leads to a high increase in explained variance, from 8 % to 45 %. Intensity of computer use is the strongest predictor (ß = .48). Teachers’ home use of computers is mainly oriented towards school related tasks. This explains the high impact of intensity of computer use. Computer experience (ß = .25) and the degree computer training (ß = .19) also affect the supportive computer use variable. The longer teachers are familiar with computers and the higher the number of earlier computer training, the higher the reported level of supportive computer use. In the final model (Model C) supportive computer use can be explained for 53 %, which is enormous. The addition of general computer attitudes leads to a supplementary proportion of explained variance of 8 % over demographics and computer experience variables. Attitudes toward computers in education and technological innovativeness do not seem to have any direct significant impact on supportive computer use when controlling for the effects of the other variables. The full path model (Model C) is depicted in Figure 1. The figure includes a visual representation of the direct effects on supportive computer use reported in Table 3, but provides also additional information on the indirect effects and the interactions among the independent variables. For instance, the figure contains information on age and gender on the computer experience variables and attitude measures. Age is negatively related to computer experience (ß = -.29), intensity of computer use (ß = -.16), general computer attitudes (ß = -.24). When controlled for these variables, age has no significant effect on supportive computer use. Gender is also strongly related to different computer experience variables: males have on average a longer experience with computers (ß = .21), report a more intensive use (ß = .08), possess more favourable general computer attitudes (ß = .10). As for age, the effect of gender on supportive computer use disappears when controlled for these variables. -- Insert Figure 1 about here -- The relationship between age and gender (r = .27) might be surprising. This finding indicates no sample bias, but demonstrates the gradual decrease of the number of male teachers over the last decennia. Class use of computers In Table 4 the determinants of class use of computers are demonstrated. -- Insert Table 4 about here -- The results of the path analyses indicate that class use of computers is not age-related. Gender however seems to have a significant effect on class use of computers. Male teachers, as opposed to their female colleagues, report to integrate computers more
9
often. This gender effect does not seem to disappear when controlling for other variables. In the first model (Model A), gender alone contributes for 4 % to the explanation of class use of computers. Another 10 % is added to the model when computer experience variables are included (Model B). Computer experience in years (ß = .12), intensity of computer use (ß = .21) and followed computer training (ß = .18) all seem to affect class use (Model 2). When attitudes measures are added (Model C), the effect of computer experience in years disappears. The final model reveals that both technological innovativeness (ß = .18) and attitudes toward computers in education (ß = .15) contribute significantly to the explanation of class use of computers. Technological innovativeness is even the strongest predictor and seems to mediate the effect of the computer experience variables. The total explanation of class use of computers (R² = .21) however is considerably lower compared to supportive computer use (R² = .53). -- Insert Figure 2 about here -- Figure 2 depicts all interrelationships among the research variables. This clearly demonstrates that the effect of general computer attitudes on class use of computers is entirely mediated through attitudes toward computers in education, technological innovativeness and intensity of computer use.
DISCUSSION Favourable attitudes seem to be the strongest predictors of supportive computer use. However, the effect of past experience and behaviour is even stronger. Computers are intensively used for professional support by those who have more years of computers experience, those who are frequent computer users and those who have high experience with computer training. In the case of class use of computers, past computer experience and behaviour have the same importance. Intensity of computer use and followed computer training have about the same impact on class use compared to attitudes toward computers in education and technological innovativeness. The findings of our study are in accordance with the literature in which the straightforward relationship between attitudes and behaviour is discussed (Eiser & van der Pligt, 1988). One of the central problems in gaining clear understanding in the relationship between attitudes and behaviour is the development of a great number of instruments. It is recommendable to provide a clear definition of the attitude constructs being used (Kay, 1992). One of the main findings in our research is the importance of using domain-specific attitudes. A general measure of computer attitudes is a good measure to explain why teachers use computer for professional support, but is not powerful enough to explain a specific type of professional computer use, i.e. classroom integration. In our example, class use of computers is strongly affected by attitudes toward computers in education and technological innovativeness. The direct effect of general computer attitudes disappears when specific attitude measures are used. The relationship between attitudes and behaviour becomes more important when attitude measures are closely tied to the task (Eiser & van der Pligt, 1988, Shapka & Ferrari, 2003). An important finding was that more than half of the variance in supportive computer use could be explained while the explanation for class use of computers was significantly lower (21 %). A valuable implication of this finding is the complexity of accounting for class use of computers relying only on variables measured at an
10
individual level. Although we employed a rich set of determinants and found significant predictors on an individual level, most of the variance in class use could not be explained. Contextual and school-specific factors should be incorporated in the theoretical model in order to gain more insight into the levels of class use of computers. Tuijnman & Ten Brummelhuis (1993), for example, highlighted the importance of the perceptions of school leadership with regard to the relevance of computer use. In a study by Chiero (1997), it was confirmed that many variables are involved in explaining the adoption of computers in various aspects of teachers’ work routines. In addition to personal factors, organisational factors should be identified, such as time constraints, available resources, support, teamwork, and training. The importance of appropriate planning and school level decision making should be stressed to enhance the successful integration of computers in the teacher’s classroom routine (Baylor & Ritchie, 2002; Tearle, 2003). The current findings on the relationship between gender and computing are in line with previous research. Mathews & Guarino (2000) for example found that female teachers reported significantly lower levels of computer ability than their male counterparts. This may account for the lower level of ICT-implementation of females in their classroom. Jenson & Rose (2003) argue that computers and gender are delimited by the social and cultural context in which they are produced and utilised. Not all studies however show consistent results. Shapka & Ferrari (2003) found no gender difference for computer attitudes and computer outcomes and argue that gender differences are gradually dissipating. In our study, the effect of gender on class use of computers stayed significant when controlled for attitudes and measures of computer experience. Shapka & Ferrari (2003) stipulate that gender differences might still exist in the use of computer applications that are less familiar. Teachers in primary education show higher familiarity with supportive computer use than class use. This might partially explain why gender differences only exist in class use. Differences between sexes might gradually disappear when teachers become more and more acquainted with the educational potential of computers. In our analyses, the measure of technological innovativeness as a substitute for a specific behavioural intention to use computers did not appear to be an adequate determinant of supportive computer use. It did however affect the degree of class use of computers. Moreover, when all individual factors were taken into account, technological innovativeness was the strongest predictor of class use of computers. This finding is in line with other studies that stress the importance of the concept of innovativeness for understanding teachers’ computer use (Marcinkiewicz, 1993; van Braak, 2001). Technological innovativeness is strongly entangled with general and education specific attitudes. Teachers who report favourable attitudes towards computers in general and computers for teaching and learning in particular, are more likely to show high degrees of technological innovativeness, which positively and directly affects the degree of computer use in class. Also the relationship between computer training and technological innovativeness is noteworthy. This brings us to another important finding in our study: teachers who followed more computer training show higher levels of technological innovativeness. We found a positive effect of computer training in predicting computer use both for both support and integration. The findings suggest that higher computer training leads to higher levels of supportive and class use of computers. The positive effect of computer training has been well documented in previous studies (Galanouli, Murphy & Gardner, 2004; Shashaani,
11
1997; Tan, Wong & Wettasinghe, 2003). The descriptive results of our data show that the attendance to in-service teacher education for computers is rather limited, despite the large scale governmental initiatives for computer training for teachers.. An average of about one computer course followed by each teacher over the last five years is fairly low. Professional development should stay at the focal centre of innovating educational policies (Galanouli, Murphy & Gardner, 2004; Williams et al., 2000).
12
CONCLUSION In this study, we explored the different factors that contribute to the explanation of two types of computer use among primary school teachers. The study is not without limitations. First, the results in this study cannot simply be generalised to other educational levels. Our support and integration variables were specifically measured in the context of primary education. In secondary education, computers as a supportive or class tool might be implemented in different ways. Second, the effect of contextual factors, such as computer infrastructure or school policy can differ in other educational levels. This indicates that the results have a limited generalisability. A third limitation of the study is concerned the quantitative nature of our survey. In future studies, researchers might wish to collect in depth information through interviews and/or observations to explore why teachers integrate (or refuse to integrate) computers in their classrooms. Interpretative research is required to investigate the reasons why teachers (refuse to) use computers for professional support. A problem with interpretative research however is that teachers are inclined to report external hindering factors such as a lack of adequate infrastructure (cf. Williams, et al 2001) that could mask individual factors, such as experience and attitude measures. A third limitation of this study is the assumed independence of individuals as units of analysis. In their computer behaviours, teachers are probably not only influence by individual factors, but also by factors that are related to the school they work in (policy planning, infrastructure, leadership). Multilevel analysis is a powerful technique to analyse data both on individual and school level (Kreft & De Leeuw, 1998). Future research might analyse both the impact of individual determinants and school-level factors upon teachers’ professional uses of the computer. Despite the limitations, the current study contributes to the literature on computers and education in different ways. First, using data reduction techniques, two different types of computer use could be distinguished: supportive computer use and class use. Second, differential effects of individual determinants on both types of computer use could be identified. Computer experience variables affected both dependent factors, but different attitude measures impacted computer support and integration: supportive computer use is affected by general computer attitudes and class use of computer by technological innovativeness and attitudes toward computers in education. However, the question whether high levels of professional computer use have positive effects on teaching and learning efficiency remains unanswered in this study.

13
REFERENCES Al Khaldi, M.A., & Al Jabri, I.M. (1998). The relationship of attitudes to computer utilization: New evidence from a developing nation. Computers in Human Behavior, 14(1), 23-42. Arbuckle, J. L. (2003). Amos 5.0 Update to the Amos User’s Guide. Chicago, IL: Smallwaters Corporation. Arbuckle, J.L., & Wothke, W. (1999). Amos 4.0 User’s Guide. Chicago, IL: Smallwaters Corporation. Baylor, A.L., & Ritchie, D. (2002). What factors facilitate teacher skill, teacher morale, and perceived student learning in technology-using classrooms? Computers & Education, 39(4), 395-414. Becta (n.d.). ICT advice for teachers. Retrieved January 8, 2004, from http://www.ictadvice.org.uk/. Bradley, G., & Russell, G. (1997). Computer experience, school support, and computer anxiety. Educational Psychology: An International Journal of Experimental Educational Psychology, 17(3), 267-284. Charlton J.P., & Birkett, P.E. (1995). The development and validation of the Computer Apathy and Anxiety Scale. Journal of Educational Computing Research, 13(1), 41-59. Chiero, R.T. (1997). Teachers’ perspectives on factors that affect computer use. Journal of Research on Computing in Education, 30(2), 133-145. Cook, D., & Finlayson, H. (1999). Interactive Children, Communicative Teaching: ICT and Classroom Teaching (Enriching the Primary Curriculum. Child, Teacher, Context. Buckingham: Open University Press. Cox, M., Abbott, C., Webb, M., Blakeley, B., Beauchamp, T. & Rhodes, V. (2004). ICT and Pedagogy – A review of the literature, ICT in Schools Research and Evaluation Series, 18. London: DfES/BECTA. Cuban, L., Kirkpatrick, H., & Peck, C. (2001). High access and low use of technologies in high school classrooms: Explaining an apparent paradox. American Educational Research Journal, 38 (4), 813-834. DeYoung, C.G., & Spence, I. (2004). Profiling information technology users: En route to dynamic personalization. Computers in Human Behavior, 20(1), 55-65. Eiser, J.R., & van der Pligt, J. (1988). Attitudes and Decisions. London: Routledge. Francis, L.J., & Evans, T.E. (1995) The reliability and validity of the Bath County Computer Attitude Scale. Journal of Educational Computing Research, 12(2), 135-146. Furst-Bowe, J., Boger, C., Franklin, T., McIntyre, B., Polansky, J., & Schlough, S. (1995). An analysis of required computer competencies for university students. Journal of Research on Computing in Education, 28(2), 175-189. Galanouli, D., Murphy, C., & Gardner, J. (2004 ). Teachers’ perceptions of the effectiveness of ICT-competence training. Computers & Education, 43(1-2), 63-79. Hogarty, K.Y., Lang, T.R., & Kromrey, J.D. (2003). Another look at technology use in classrooms: The development and validation of an instrument to measure teachers’ perceptions. Educational and Psychological Measurement, 63(1), 139-162. Jenson, J., & Rose, C.B. (2003). Women@work: listening to gendered relations of power in teacher’ talk about new technologies. Gender & Education. 15(2), 169-181. Jenson, J., De Castell, S., & Bryson, M. (2003). “Girl talk”: gender, equity, and identity discourses in a school-based computer culture. Women’s Studies International Forum, 26(6), 561-574. Kadijevich, D. (2000). Gender differences in computer attitude among ninth –grade students. Journal of Educational Computing Research, 22(2) 145-154.
14
Kay, R. (1989). A practical and theoretical approach to assessing computer attitudes: the Computer attitude Measure (CAM). Journal of Research on Computing in Education, 21(4), 456-463. Kay, R. (1992). Understanding gender differences in computer attitudes: aptitude, and use: an invitation to build theory. Journal of Research on Computing in Education, 25(2), 159-171. Kennewell, S., Parkinson, J., & Tanner, H. (2000). Developing the ICT Capable School. London: RouteledgeFalmer. Khine, S.M. (2001). Attitudes toward computers among teacher education students in Brunei Darussalam. International Journal of Instructional Media, 28(2), 147-152. Kreft, I., & De Leeuw, J. (1998). Introducing multilevel modeling. London. Sage Levine, T., & Donitsa-Schmidt, S. (1998). Computer use, confidence, attitudes, and knowledge: a causal analysis. Computers in Human Behavior, 14(1), 125-146. Looker, E.D., & Thiessen, V. (2003). Beyond the digital divide in Canadian schools. From access to competency in the use of information technology. Social Science Computer Review, 21(4), 475-490. Loveless, A., & Dore, B. (eds.) (2002). ICT in the primary school. Learning and Teaching with ICT. Buckingham: Open University Press. Loyd, B.H., & Loyd, D.E. (1985). The reliability and validity of an instrument for the assessment of computer attitudes. Educational and Psychological Measurement, 45(4), 903-908. Loyd, B.H., & Gressard, C. (1984). Reliability and factorial validity of computer attitude scales. Educational and Psychological Measurement, 44(2), 501-505. Maier, P., Barnett, L., Warren, A., & Brunner, D. (1999). Using Technology in Teaching and Education. London: Kogan Page. Marcinkiewicz, H.R. (1993). Computers and teachers: factors influencing computer use in the classroom. Journal of Research on Computing in Education, 26(2), 220-237. Marcoulides, G.A., & Schumacker, R.E. (2001). New Developments and Techniques in Structural Equation Modeling. Mahwah (N.J.): Erlbaum. Mathews, J.G., & Guarino, A.J. (2000). Predicting teacher computer use: a path analyses. International Journal of Instructional Media, 27(4), 385-392. Mitra, A. (2001). Developing a questionnaire to measure the effectiveness of computers in teaching. Proceedings of the Annual ED-MEDIA - World Conference on Educational Multimedia, Hypermedia and Telecommunications. AACE. Tampere, Finland, pp. 1327-1328. Potosky, D., & Bobko, Ph. (2001). A model for predicting computer experience from attitudes toward computers. Journal of Business and Psychology, 15(3), 391-404. Robertson, J. (2002). The ambiguous embrace: twenty years of IT (ICT) in UK primary schools. British Journal of Educational Technology, 33(4), 403-409. Roehrich, G. (2004). Consumer innovativeness. Concepts and measurements. Journal of Business Research, 57(6), 671-677. Rogers, E.M. & Shoemaker, F.F. (1971). Communication of Innovations: a Cross-Cultural approach. New York: Free Press. Rogers, E.M. (1995). Diffusion of Innovations, Fourth Edition. New York: Free Press. Rozell, E.J., & Gardner, W.L. (1999). Computer-related success and failure: a longitudinal field study of the factors influencing computer-related performance. Computers in Human Behavior, 15(1), 1-10. Shapka, J. D. & Ferrari, M. (2003). Computer-related attitudes and actions of teacher candidates. Computers in Human Behavior. 19(3), 319-334.

15
Shashaani, L. (1997). Gender differences in computer attitudes and use among college students. Journal of Educational Computing Research, 16 (1), 37-51. Tan, S.C, Hu, C., Wong, S.K. & Wettasinghe, C.M (2003). Teacher training on technology-enhanced instruction – a holistic approach. Educational Technology & Society 6(1), 96-104. Tearle, P. (2003). ICT implementation: what makes the difference? British Journal of Educational Technology, 34 (5), 403-417. Tuijnman, A.C., & Ten Brummelhuis, A.C.A. (1992). Determinants of computer use in lower secondary schools in Japan and the United States. Computers & Education, 19 (3), 291-300. van Braak, J. & Goeman, K. (2003). Differences between general computer attitudes and perceived computer attributes: development and validation of a scale. Psychological Reports, 92, 655-660. van Braak, J. (2001). Individual characteristics influencing teachers’ class use of computers. Journal of Educational Computing Research, 25 (2), 141-157. van Braak, J. (2004). Domains and determinants of university students’ self-perceived computer competence. Computers and Education, 43 (3), 299-312. Volman M, & van Eck, E. (2001). Gender equity and information technology in education: The second decade. Review of Educational Research, 71 (4), 613-634. Williams, D., Coles, L., Wilson, K., Richardson, A. & Tuson, J. (2000). Teachers and ICT: current use and future needs. British Journal of Educational Technology, 31(4), 307-320. Winter, S.J., Chudoba, K.M., & Gutek, B.A. (1998). Attitudes toward computers - when do they predict computer use? Information and Management, 34 (5), 275-284.
16
Table and Models Captions Table 1. Results of the principal component analysis: supportive computer use (PC1) versus class use (PC2); and frequency of use (at least once a week) (n = 468). Table 2. Pearson product-moment correlation coefficients among the research variables (n=468). Table 3. Overview of the direct effects on supportive computers use: standardised regression coefficients (ß) and fit indices (n = 468). Table 4. Overview of the direct effects on class use of computers: standardised regression coefficients (ß) and fit indices (n = 468). Figure 1. Predictors of supportive use of computers: estimates of direct and indirect effects: Final path model (n = 468). Figure 2. Predictors of class use of computers: estimates of direct and indirect effects: Final path model (n = 468).
17
Table 1. Results of the principal component analysis: supportive computer use (PC1) versus class use (PC2); and frequency of use (at least once a week) (n = 468).
PC1 PC2 Freq 1 2 %
keeping an agenda on the computer .79 -.10 57administration, such as letters and reports .77 .16 48using e-mail for my job .69 .23 37looking for information on the Internet for lesson preparation .66 .21 37looking for educational software .58 .29 17preparing worksheets for the pupils .54 .16 53(co-)constructing a school website .38 .29 6using a student tracking system .29 .06 7calculating pupils’ test scores .24 .11 16Encouraging collaborative learning .13 .75 33using the computer for differentiation .12 .73 46Encouraging pupils to train skills .13 .70 53ask pupils to do assignments on the computer .03 .66 33using the computer as a tool for demonstration .23 .56 13using the computer as a tool for instruction .21 .49 12encourage pupils to search for information on the Internet .26 .44 16teaching about the possibilities of computers .32 .40 8
18
Table 2. Pearson product-moment correlation coefficients among the research variables (n=468). {1} {2} {3} {4} {5} {6} {7} {8} {9} {1} supportive computer use {2} class use of computers .39** {3} gender .05 .20** {4} age -.26** -.02 .27** {5} computer experience (in years) .40** .21** .16** -.14** {6} intensity of computer use .57** .25** .07 -.24** .24** {7} computer training .21** .22** .12* .13** .11* .03 {8} general computer attitudes .61** .30** .09 -.26** .38** .44** .16** {9} attitudes toward comp in education .35** .31** -.01 -.14** .21** .28** .07 .45** {10}technological innovativeness .43** .35** .04 -.15** .24** .24** .19** .57** .60** * p < .05 ** p<.001
19
Table 3. Overview of the direct effects on supportive computers use: standardised regression coefficients (ß) and fit indices (n = 468). Model A Model B Model C Demographics gender .14** n.s. n.s. age -.29*** -.14*** n.s. Computer experience computer experience in years - .25*** .16*** intensity of computer use - .48*** .37*** computer training - .19*** .13*** Attitude measures general computer attitudes - - .37*** attitudes toward computers in education
- - n.s.
technological innovativeness - - n.s. Adjusted R² ‘supportive computer use’ .08 .45 .53 X² 0.00 2.11 27.15 df (p-value) 0 (-) 3 (.550) 17 (.056) Goodness of Fit Index (GFI) (and Adjusted GFI)
1.00 .99 (.99) .99 (.97)
- not included in model; n.s. not significant ; * p <.05; ** p < .01; *** p < .001
20
Figure 1. Predictors of supportive use of computers: estimates of direct and indirect effects: Final path model (n = 468).
AGE
ATTITUDES TO-WARD COMPUTERS
IN EDUCATION
SUPPORTIVE USE OF COMPUTERS
β= 39
R²=.53
GENERAL COMPUTER ATTITUDES
TECHNOLOGICAL INNOVATIVENESS
INTENSITY OF COMPUTER USE
COMPUTER EXPERIENCE
IN YEARS COMPUTER TRAINING
GENDER
R²=.20
R²=.20
R²=.06 R²=.06
R²=.22
R²=.48 β= .37 β= .36
β= .45
β= .33 β= -.24
β= .21
β= -.20
β= -.16
β= .18
r= .27
β= .20
β= .37
β= .43
β= .10
β= .13
β= .16
β= .10
β= .08

21
Table 4. Overview of the direct effects on class use of computers: standardised regression coefficients (ß) and fit indices (n = 468). Model A Model B Model C Demographics Gender .20*** .15*** .17*** Age n.s. n.s. n.s. Computer experience computer experience in years - .12** n.s. intensity of computer use - .21*** .15*** computer training - .18*** .15*** Attitude measures general computer attitudes - - n.s. attitudes toward computers in education
- - .15**
technological innovativeness - - .18*** Adjusted R² ‘class use of computers’ .04 .14 .21 X² 3.11 2.32 17.48 df (p-value) 1 (.078) 3 (.507) 16 (.355) Goodness of Fit Index (GFI) (+ Adjusted GFI)
.99 (.97) .99 (.98) .99 (.98)
- not included in model; n.s. not significant ; * p <.05; ** p < .01; *** p < .001

22
Figure 2. Predictors of class use of computers: estimates of direct and indirect effects: Final path model (n = 468).
AGE
ATTITUDES TO-WARD COMPUTERS
IN EDUCATION
CLASS USE OF COMPUTERS
β= .39
R²=.21
GENERAL COMPUTER ATTITUDES
TECHNOLOGICAL INNOVATIVENESS
INTENSITY OF COMPUTER USE
COMPUTER EXPERIENCE
IN YEARS COMPUTER TRAINING
GENDER
R²=.20
R²=.20
R²=.06 R²=.06
R²=.22
R²=.48 β= .15
β= .18
β= .36
β= .45
β= .33
β= -.24
β= .21
β= -.20
β= -.15
β= .18
r= .27
β= .17
β= .20
β= .15
β= .43
β= .10
β= .15
β= .08
β= .10
23
APPENDIX A Factor analysis on the three attitude scales: Attitudes toward Computers in Education (Factor 1), General Computer Attitudes (Factor 2), and Technological Innovativeness (Factor 3). factor factor factor {1} {2} {3}the computer increases the level of creativity of pupils .77 .20 .04 the use of computer helps pupils to achieve better text writing .72 .09 -.06 the efficiency of the learning process is increased through the use of computers .68 .12 .30 computer knowledge and practical experience should be more integrated in the curriculum
.58 .14 .26
the computer provides opportunity for improving the learning performance .56 .13 .38 pupils with learning difficulties can strongly benefit from the didactic possibilities which the use of computers entail
.55 .04 .33
the computer used as a learning tool, increases student motivation .48 .15 .32 computers can help the teacher to apply differentiation among the students .45 .15 .38 When using computers, I’m afraid to break something* .05 .81 -.07 Computers make me nervous* .20 .76 .16 I like working with computers .25 .68 .32 Computers don’t frighten me .11 .66 .21 I will never be able to use computers* .09 .65 .21 I have more negative than positive experiences with computers* .14 .57 .43 Learning about computers is too time-consuming .15 .45 .27 I believe the need for the introduction of ICT in my practice .25 .22 .73 I find technological innovation beneficial for my teaching practice .21 .18 .72 I’m not interested in the introduction of ICT in my classroom .06 .33 .59 I believe a progressive introduction of technology into education responds to our society’s changing needs
.28 .17 .59
I highly value the introduction of ICT in the classroom as an example of innovation .41 .23 .52 * Negative items were reversed before analysis.