Embed Size (px)
Citation preview

DI
SC
US
SI
ON
P
AP
ER
S
ER
IE
S
Forschungsinstitut zur Zukunft der ArbeitInstitute for the Study of Labor
Explaining Charter School Effectiveness
IZA DP No. 6525
April 2012
Joshua D. AngristParag A. PathakChristopher R. Walters

Explaining Charter School Effectiveness
Joshua D. Angrist MIT, NBER and IZA
Parag A. Pathak
MIT and NBER
Christopher R. Walters MIT
Discussion Paper No. 6525 April 2012
IZA
P.O. Box 7240 53072 Bonn
Germany
Phone: +49-228-3894-0 Fax: +49-228-3894-180
E-mail: [email protected]
Any opinions expressed here are those of the author(s) and not those of IZA. Research published in this series may include views on policy, but the institute itself takes no institutional policy positions. The Institute for the Study of Labor (IZA) in Bonn is a local and virtual international research center and a place of communication between science, politics and business. IZA is an independent nonprofit organization supported by Deutsche Post Foundation. The center is associated with the University of Bonn and offers a stimulating research environment through its international network, workshops and conferences, data service, project support, research visits and doctoral program. IZA engages in (i) original and internationally competitive research in all fields of labor economics, (ii) development of policy concepts, and (iii) dissemination of research results and concepts to the interested public. IZA Discussion Papers often represent preliminary work and are circulated to encourage discussion. Citation of such a paper should account for its provisional character. A revised version may be available directly from the author.

IZA Discussion Paper No. 6525 April 2012
ABSTRACT
Explaining Charter School Effectiveness* Estimates using admissions lotteries suggest that urban charter schools boost student achievement, while charter schools in other settings do not. Using the largest available sample of lotteried applicants to charter schools, we explore student-level and school-level explanations for this difference in Massachusetts. In an econometric framework that isolates sources of charter effect heterogeneity, we show that urban charter schools boost achievement well beyond that of urban public school students, while non-urban charters reduce achievement from a higher baseline. Student demographics explain some of these gains since urban charters are most effective for non-whites and low-baseline achievers. At the same time, non-urban charter schools are uniformly ineffective. Our estimates also reveal important school-level heterogeneity within the urban charter sample. A non-lottery analysis suggests that urban charters with binding, well-documented admissions lotteries generate larger score gains than under-subscribed urban charter schools with poor lottery records. Finally, we link charter impacts to school characteristics such as peer composition, length of school day, and school philosophy. The relative effectiveness of urban lottery-sample charters is accounted for by these schools’ embrace of the No Excuses approach to urban education. JEL Classification: I21, I24, I28, J45 Keywords: human capital, charter schools, achievement Corresponding author: Joshua Angrist Department of Economics MIT E52-353 50 Memorial Drive Cambridge, MA 02139-437 USA E-mail: [email protected]
* Special thanks go to Carrie Conoway, Sarah Cohodes, Jon Fullerton, Harvard’s Center for Education Policy Research, and the Massachusetts Department of Education for assistance and data, and to our charter team collaborators, Sue Dynarski and Tom Kane for their valuable input. Seminar participants at Boston College, Columbia, Harvard, HEC Montreal, Miami Ohio, The University of Trento, The University of Virginia, Wharton, and the August 2011 Impact Evaluation Network meeting in Buenos Aires provided helpful comments. This work was funded by the Institute for Education Sciences under grant 24-5099-00-0-24-061. We also thank the Massachusetts Department of Elementary and Secondary Education for financial support. Pathak gratefully acknowledges support from the NSF. The views expressed here are those of the authors alone. This is a revised version of NBER Working Paper No. 17332, released August 2011.

I Introduction
A growing body of evidence suggests that urban charter schools have the potential to generate
impressive achievement gains, especially for minority students living in high-poverty areas. In a
series of studies using admissions lotteries to identify causal effects, we looked at the impact of
charter attendance in Boston and at a KIPP school in Lynn, Massachusetts (Abdulkadiroglu et
al., 2009, 2011; Angrist et al., 2010a, 2010b). Boston and Lynn charter middle schools increase
student achievement by about 0.2 standard deviations (σ) per year in English Language Arts
(ELA) and about 0.4σ per year in math. Among high school students, attendance at a Boston
charter school increases student achievement by about 0.2σ per year in ELA and 0.3σ per
year in math. Lottery studies of charter schools in the Harlem Children’s Zone (Dobbie and
Fryer, 2011a) and a Washington DC charter boarding school (Curto and Fryer, 2011) document
similarly large gains. Studies of Chicago and New York charter schools also report positive
effects (Hoxby and Rockoff, 2004; Hoxby, Murarka and Kang, 2009; Dobbie and Fryer, 2011b).
While these results are encouraging, they come from schools operating in traditional (for
charters) urban settings. Interest in charter schools is growing rapidly in school districts outside
central cities (see, e.g., the discussion of New York area charters in Hu, 2011), but results
for more diverse sets of charter schools are also more mixed. In a recent report evaluating
roughly two dozen Massachusetts charter schools from around the state, we find little evidence
of achievement gains at schools outside of high-poverty urban areas (Angrist et al., 2011). Some
of the estimates for non-urban Massachusetts charters show significant negative effects. These
results echo findings from a multi-state study of 36 charter middle schools using admissions
lotteries (Gleason et al., 2010).1 Here too, charter schools outside of urban areas seem to do
little for achievement, though, as in our earlier work, urban schools with high-minority, high-
poverty enrollment generate some gains.2
This paper documents the magnitude of treatment effect heterogeneity in a large sample of
Massachusetts charter schools and develops a framework for interpreting this heterogeneity using
both student- and school-level explanatory variables. We begin with a semiparametric investi-
gation of potential outcomes that assigns a role to variation in no-treatment counterfactuals and1Other studies documenting heterogeneity in the effects of charter schools include Hoxby (2004), Zimmer et
al. (2009), and Imberman (2011). The Imberman study reports that urban charters born as charters have large
effects on discipline and attendance, while converted schools do not.2A focus on differences between urban and non-urban schools also appears in research on Catholic schools.
Evans and Schwab (1995) and Neal (1997) show that Catholic school attendance leads to increases in high school
graduation and college attendance for cohorts graduating in the early 1980s. Both studies find larger benefits for
black students and for students in urban settings. Grogger et al. (2000) and Altonji et al. (2005) report similar
results on Catholic schooling for more recent cohorts.
1

to charter applicants’ demographic characteristics and baseline achievement. This investigation
includes a Blinder-Oaxaca (1973) decomposition of the urban charter advantage. The resulting
estimates show that students at urban charters in the lottery sample are typical of the urban
student population, and that urban charter attendance boosts achievement well beyond ambient
non-charter levels. Student demographics and baseline scores play a role in this – urban schools
work best for minority students and students with low baseline scores – but non-urban charters
appear to be ineffective for most subgroups.
We then investigate school-level characteristics that might explain differences in charter
school effectiveness. Our school-level investigation of charter effect heterogeneity is built on a
set of non-lottery estimates that rely on statistical controls to eliminate selection bias. The
observational analysis suggests that the sample of urban schools for which a lottery-based anal-
ysis is feasible, that is, over-subscribed schools with good lottery records, boost scores more
than other urban charter schools. Finally, we show that urban and lottery-sample charter ef-
fectiveness can be explained by adherence to a No Excuses approach to urban education that
emphasizes instruction time, comportment, selective teacher hiring, and focuses on traditional
math and reading skills. Conditional on No Excuses status, factors such as time in school and
per-pupil expenditure are not predictive of charter effectiveness. Interestingly, peer effects also
play no role in explaining charter effectiveness.
The results reported here contribute to a growing body of evidence documenting the effec-
tiveness of No Excuses practices in various contexts. Dobbie and Fryer (2011b) show that an
index measuring teacher feedback, data-driven instruction, tutoring, increased instruction time,
and high expectations is a significant predictor of effectiveness in a sample of New York char-
ter schools. These practices are typically understood to be central elements of the No Excuses
model (Thernstrom and Thernstrom, 2004; Carter, 2000).3 Similarly, Fryer (2011) reports on
an experiment implementing No Excuses strategies in nine low-performing traditional public
schools in Houston. This intervention appears to have produced substantial gains, suggesting
that the No Excuses model may be effective beyond the charter context.
The following section details school participation, describes the data, and outlines our em-
pirical strategy for the lottery analysis. Section III presents the findings that motivate our
investigation of charter effect heterogeneity. Section IV outlines the econometric framework
used to investigate this heterogeneity and reports the results of this investigation. Section V
discusses our observational analysis of the connection between charter effectiveness and school
practices. Finally, we present a case study of a single non-urban charter school that embraces3We note, however, that Dobbie and Fryer use a narrower definition of No Excuses that is limited to school
disciplinary practices. They argue that disciplinary practices do not predict achievement gains after accounting
for the elements measured by their index.
2

some elements of the urban No Excuses approach. This school does not produce gains compa-
rable to urban No Excuses schools; in fact, attendance in the elementary school years seems to
reduce achievement. Together, the findings reported here suggest that No Excuses pedagogy
drives the success we observe among urban schools, but efficacy of the No Excuses package may
depend on completeness of the package and/or factors specific to the urban environment.
II Lottery Analysis: Data and Empirical Strategy
Lottery and Survey Data
We attempted to collect lottery data for the set of Massachusetts charter schools serving middle
and high school grades and meeting a set of pre-specified eligibility criteria.4 The school-selection
process is detailed in Table 1. Schools eligible for our study accept students in the relevant entry
grades (4th-7th grade for middle school and 9th grade for high school). Excluded are closed
schools, schools that opened after the 2009-2010 school year, and alternative schools serving non-
traditional populations (usually students at risk of dropping out). The resulting set of eligible
schools includes 28 of the 34 charters with middle school entry grades and eight of 16 schools
with high school entry grades.5 Eligible schools that are not included in the lottery analysis
were either under-subscribed or failed to keep sufficient lottery records. The final sample of over-
subscribed schools with usable records includes 17 middle schools and six high schools. These
schools are listed in Appendix Table A1. The lottery sample includes nine urban middle schools,
eight non-urban middle schools, four urban high schools, and two non-urban high schools.6
In an effort to document differences in school practice, we surveyed the full set of eligible
charter schools, regardless of the quality of their lottery records. Twenty-nine school adminis-
trators completed this survey.7 As shown in Panel A of Table 2, this survey reveals important
differences between urban and non-urban charter schools. Urban schools are younger than non-
urban schools; in Spring 2010, the average urban school had been open for 8.7 years, while
the average non-urban school had been open for 12.4 years. Urban charter schools also run a
longer school day and year than do non-urban schools. The average urban charter year lasts 1894We focus on middle and high schools because data for elementary school lotteries are much less widely
available. Moreover, pre-lottery test scores – a key component of the observational analysis – are unavailable for
elementary school applicants.5Three eligible schools serve both middle and high school grades, so there are 33 eligible campuses. Schools
are classified as both middle and high if they have entrance lotteries at both levels, or if lottery records at the
middle school level were available early enough for participants to be observed in high school.6Urban areas are those in which the local district superintendent participates in the Massachusetts Urban
Superintendents Network. The distinction between urban and non-urban charter schools in Massachusetts is
essentially identical to splits based on high poverty or high minority enrollment.7This generates data for 31 schools since two surveyed campuses admit in both middle and high school.
3

days and has a school day of 467 minutes, compared to 183 days and 422 minutes at non-urban
schools. The extra time appears to go to increased math and reading instruction; urban schools
spend 36 extra minutes per day on math and 37 extra minutes per day on reading. In addition,
urban charter schools are 35 percentage points more likely to have Saturday school.
Urban and non-urban schools also differ with respect to school philosophy and organization.
Urban charters are more likely than non-urban charters to require parents to sign a contract (72
percent compared to 46 percent), to require students to sign a contract (61 percent compared
to 55 percent), and to use uniforms (89 percent compared to 73 percent). Urban charter schools
are also much more likely to use a formal reward system to shape student behavior; 67 percent of
urban schools use such a system, while only 18 percent of non-urban schools do so. The survey
results reveal a particularly sharp division between urban and non-urban charters with respect
to the No Excuses approach to education. As discussed by Thernstrom and Thernstrom (2003)
and Carter (2000), No Excuses principles include a strict disciplinary environment, an emphasis
on student behavior and comportment, extended time in school, an intensive focus on traditional
reading and math skills, and teacher quality. Two-thirds of urban charter administrators identify
somewhat or fully with No Excuses, while no non-urban charter identifies with this approach.
Table 2 also compares the inputs and resources used by urban and non-urban charter schools.
All urban charters qualify for Federal Title I funds.8 Urban charters spend about as much
as traditional public schools, while non-urban charter schools spend less ($13,668 compared
to $11,091).9 Urban schools are more likely to hire paid tutors to work with their students.
Involuntary teacher separations are higher in urban charters, but the requirement to take calls
after hours and the use of unpaid tutors is less prevalent in urban schools. On the other hand,
urban charter schools are substantially more likely to use paid tutors.
Differences in teacher characteristics across settings are also of interest. Compared to non-
urban charters and public schools, urban charters have substantially younger teachers. This
can be seen in Panel B of Table 2, which reports staff proportions under age 32 and over age
49. Probably due to these age differences, urban charter teachers are less likely to be licensed
than traditional public school teachers. Student/teacher ratios at charter schools are generally
smaller than staff ratios at traditional public schools, while non-urban charter schools have the
smallest classes.8Schools are eligible for Title I status if 40 percent of their students are from low-income families. See
http://www2.ed.gov/programs/titleiparta/index.html for details.9Column (4) shows selected characteristics of traditional public schools in the 2010-2011 school year, gathered
from http://profiles.doe.mass.edu. Survey measures are unavailable for traditional public schools.
4

Student Data
The student-level data used here come from administrative records covering all Massachusetts’
public schools.10 Our sample covers the 2001-2002 school year through the 2010-2011 school year.
The administrative records include information on demographics and school(s) of attendance,
as well as Massachusetts Comprehensive Assessment System (MCAS) scores. The MCAS is a
set of high-stakes standardized tests given to students in grades 3-8 and grade 10. The primary
outcomes analyzed in our study are math and English Language Arts (ELA) scores. The data
appendix provides details on the availability of outcomes for each applicant cohort. Raw MCAS
scores were standardized by subject, grade level, and year.
The lottery analysis sample matches applicant records to administrative data using appli-
cants’ name, year, and grade. Where available, information on date of birth, town of resi-
dence, race/ethnicity, and gender was used to break ties. Ninety-two percent of applicants were
matched. Applicants were excluded from the lottery analysis if they were disqualified from the
lottery they entered (this mostly affected applicants to the wrong grade level). We also dropped
siblings of current students, late applicants, and some out-of-area applicants.11 Students missing
baseline demographic information in the state database were dropped as well.
Descriptive Statistics
We begin with a statistical picture of the Massachusetts student population in traditional public
and charter schools, presented in Table 3 separately for urban and non-urban areas. Traditional
schools are defined as those that are not charters, alternative programs for older students,
exclusively special education, exam, or magnet schools. The table shows average demographic
characteristics, participation rates in limited English proficiency (LEP) and special education
(SPED) programs, and average baseline test scores. Baseline (pre-charter enrollment) scores are
from 4th grade for middle school and 8th grade for high school.
Traditional urban students are unlike traditional students in the rest of the state. Specifically,
urban students are more likely to be black or Hispanic, to participate in LEP or SPED programs,
and to receive a subsidized lunch. Urban students also have much lower baseline test scores
than other public school students, with scores 0.43σ and 0.47σ below the state average in math
and ELA at the middle school level, and 0.42σ and 0.39σ below the average for high school.
In contrast, non-urban students score 0.21σ and 0.23σ above the middle school average; the10Records are from the Student Information Management System, or SIMS. See the data appendix for details.11Charter schools typically give priority to sibling applicants, as well as to students in the local school district
or region. Our applicant risk sets (discussed in the next section) distinguish between in-area and out-of-area
applicants for schools that take substantial numbers of both. Out-of-area applicants were dropped at schools with
fewer than five out-of-area applicants.
5

corresponding non-urban advantages in high school are 0.27σ and 0.28σ.
Eligible charter school students who live in urban and non-urban areas are more similar to
their peers in regular public schools than to one another. On the other hand, we see important
differences by charter status as well. Urban charter schools serve a higher proportion of black
students than do urban public schools. Urban charter students are also less likely to participate
in LEP or SPED programs, or to qualify for a subsidized lunch. Charter school students in both
urban and non-urban areas have slightly higher baseline test scores than their public school
counterparts. Applicants to charter schools for whom we have lottery data are similar to the
population of enrolled charter students in both urban and non-urban areas.
Empirical Strategy
The lottery-based identification strategy captures causal effects for applicants to over-subscribed
charters with high-quality lottery records. The second-stage equation for the lottery analysis is
yigt = α2t + β2g +∑j
δjdij +X ′iθ + τsigt + εigt, (1)
where yigt is a test score for student i in grade g in year t, α2t and β2g are year and grade
effects, Xi is a vector of pre-lottery demographic characteristics (race, special education, limited
English proficiency, subsidized lunch status, and a female-minority interaction), and εigt is an
error term. The set of dij includes a separate dummy variable for every combination of charter
school lotteries (indexed by j) seen in the lottery sample. In what follows, we refer to these
combinations as “risk sets.” The variable of interest, sigt, measures years spent in charter schools
between application and test dates.12 The parameter τ captures the causal effect of charter
school attendance.
OLS estimates of equation (1) fail to capture causal effects if the decision to apply to or
attend a charter school is correlated with unmeasured ability, motivation, or family background.
We therefore use a dummy variable, Zi, indicating lottery offers as an instrumental variable for
time spent in charter school. The first stage for this 2SLS procedure is
sigt = α1t + β1g +∑j
κjdij +X ′iµ+ πZi + ηigt, (2)
where π is the effect of a lottery offer on charter attendance. As in the second stage equation, the
first stage includes risk set controls and baseline demographic characteristics, as well as year and12Students who transfer public schools are assigned to the school attended longest in a given year. Students with
any charter attendance are coding as having been in charter for the year. Students attending multiple charters in
a given year are coded as having been a student at the charter school attended longest. The variable sigt counts
years spent at any charter school, including those without lottery records.
6
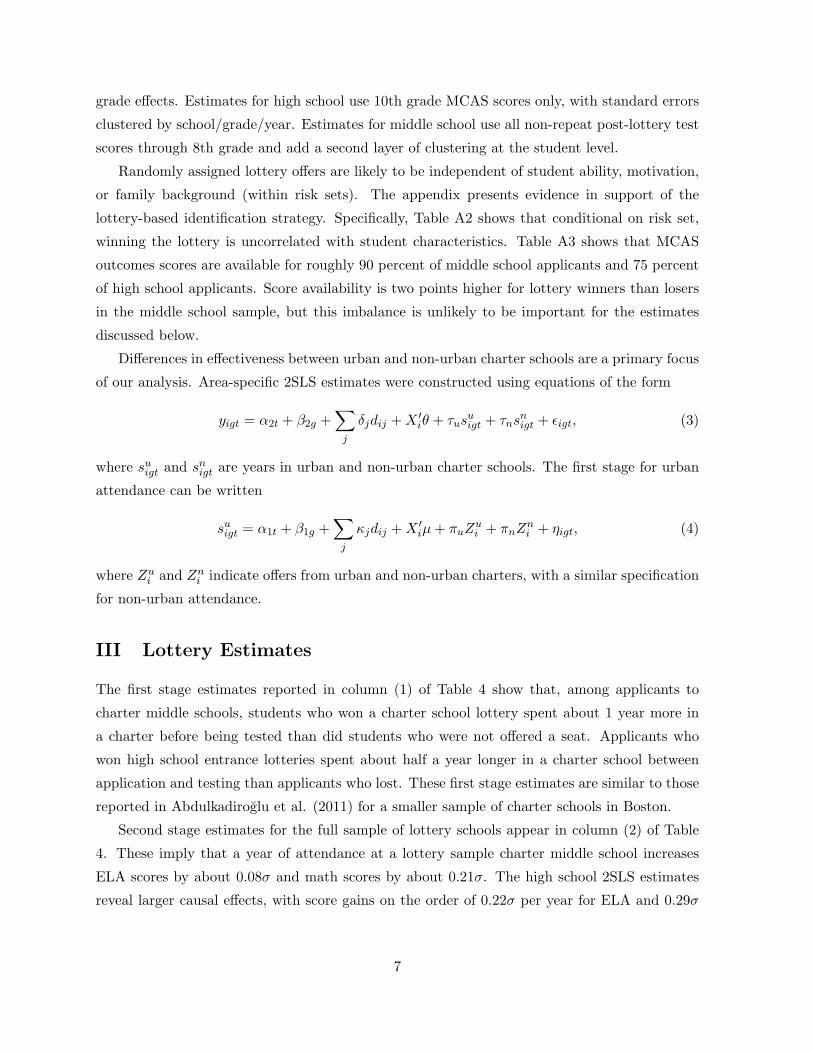
grade effects. Estimates for high school use 10th grade MCAS scores only, with standard errors
clustered by school/grade/year. Estimates for middle school use all non-repeat post-lottery test
scores through 8th grade and add a second layer of clustering at the student level.
Randomly assigned lottery offers are likely to be independent of student ability, motivation,
or family background (within risk sets). The appendix presents evidence in support of the
lottery-based identification strategy. Specifically, Table A2 shows that conditional on risk set,
winning the lottery is uncorrelated with student characteristics. Table A3 shows that MCAS
outcomes scores are available for roughly 90 percent of middle school applicants and 75 percent
of high school applicants. Score availability is two points higher for lottery winners than losers
in the middle school sample, but this imbalance is unlikely to be important for the estimates
discussed below.
Differences in effectiveness between urban and non-urban charter schools are a primary focus
of our analysis. Area-specific 2SLS estimates were constructed using equations of the form
yigt = α2t + β2g +∑j
δjdij +X ′iθ + τus
uigt + τns
nigt + εigt, (3)
where suigt and snigt are years in urban and non-urban charter schools. The first stage for urban
attendance can be written
suigt = α1t + β1g +∑j
κjdij +X ′iµ+ πuZ
ui + πnZ
ni + ηigt, (4)
where Zui and Zni indicate offers from urban and non-urban charters, with a similar specification
for non-urban attendance.
III Lottery Estimates
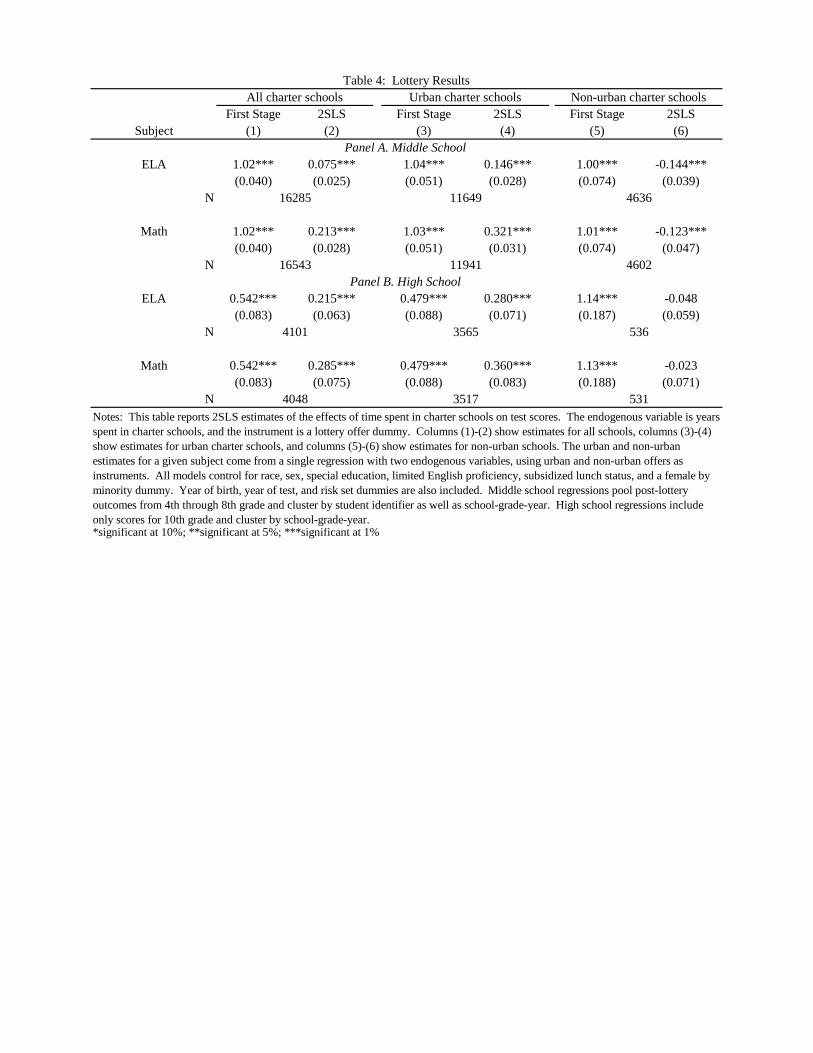
The first stage estimates reported in column (1) of Table 4 show that, among applicants to
charter middle schools, students who won a charter school lottery spent about 1 year more in
a charter before being tested than did students who were not offered a seat. Applicants who
won high school entrance lotteries spent about half a year longer in a charter school between
application and testing than applicants who lost. These first stage estimates are similar to those
reported in Abdulkadiroglu et al. (2011) for a smaller sample of charter schools in Boston.
Second stage estimates for the full sample of lottery schools appear in column (2) of Table
4. These imply that a year of attendance at a lottery sample charter middle school increases
ELA scores by about 0.08σ and math scores by about 0.21σ. The high school 2SLS estimates
reveal larger causal effects, with score gains on the order of 0.22σ per year for ELA and 0.29σ
7

per year for math.13
Estimates for the full state sample mask considerable heterogeneity by urban status, a pattern
documented in columns (3) through (6) of Table 4. Although first stages at urban and non-
urban middle schools are similar, the corresponding second stage estimates differ markedly.
2SLS estimates for urban middle schools, reported in column (4) of Table 4, suggest these
schools generate gains of about 0.15σ in ELA and 0.32σ in math per year enrolled. In contrast,
estimates for non-urban charter middle schools are negative. In particular, as can be seen in
column (6), charter students at non-urban middle schools appear to lose ground relative to
their public school peers at a rate of 0.14σ per year in ELA and 0.12σ per year in math. Not
surprisingly, high school lottery results for urban schools are similar to the statewide results
(since only two of the high schools in the state sample are non-urban), showing large gains in
math and ELA. On the other hand, 2SLS estimates for non-urban charter high schools are small,
negative, and not significantly different from zero.14
Variation in charter effects across demographic subgroups is documented in Table 5, sepa-
rately for urban and non-urban schools. Urban charter schools boost scores for most subgroups,
though not uniformly. Girls realize slightly larger gains in math, while boys see slightly larger
ELA gains. Black and Hispanic students benefit considerably from urban charter attendance in
middle school, but the estimated math gains for whites are smaller, with no increase in whites’
ELA scores. Urban charter middle schools appear to produce especially large achievement gains
for students eligible for a subsidized lunch and for those with low baseline scores. Attendance
at urban charter high schools increases math scores in every group and raises reading scores for
everyone except whites, though estimates for small groups are imprecise.
Non-urban charter attendance fails to raise scores for most of the subgroups examined in
Table 5, and appears to reduce achievement for girls, whites, and students with low baseline
scores in middle school. Estimates for non-urban black and Hispanic students are negative in
middle school, though not significantly different from zero. Most of the estimates for non-urban
charter high schools are also negative, though effects here are less precise than those for non-
urban middle school (high school estimates for blacks and Hispanics are omitted due to the small
size of these non-urban groups).15
13Results for writing scores, not reported here, are similar to those for ELA. See our working paper for details
(Angrist et al. 2011).14As shown in columns (3) and (5), the first stage for urban high schools is smaller than the first stage for
non-urban high schools. This difference reflects the fact that a larger proportion of the non-urban high school
sample comes from entrance lotteries in middle grades, generating more potential years of charter exposure by the
time applicants were tested in high school. One of two non-urban high schools admits students in middle school,
while one of four urban high schools admits in middle school.15Clustering the non-urban high school standard errors by school-grade-year as in Table 6 produced standard
8
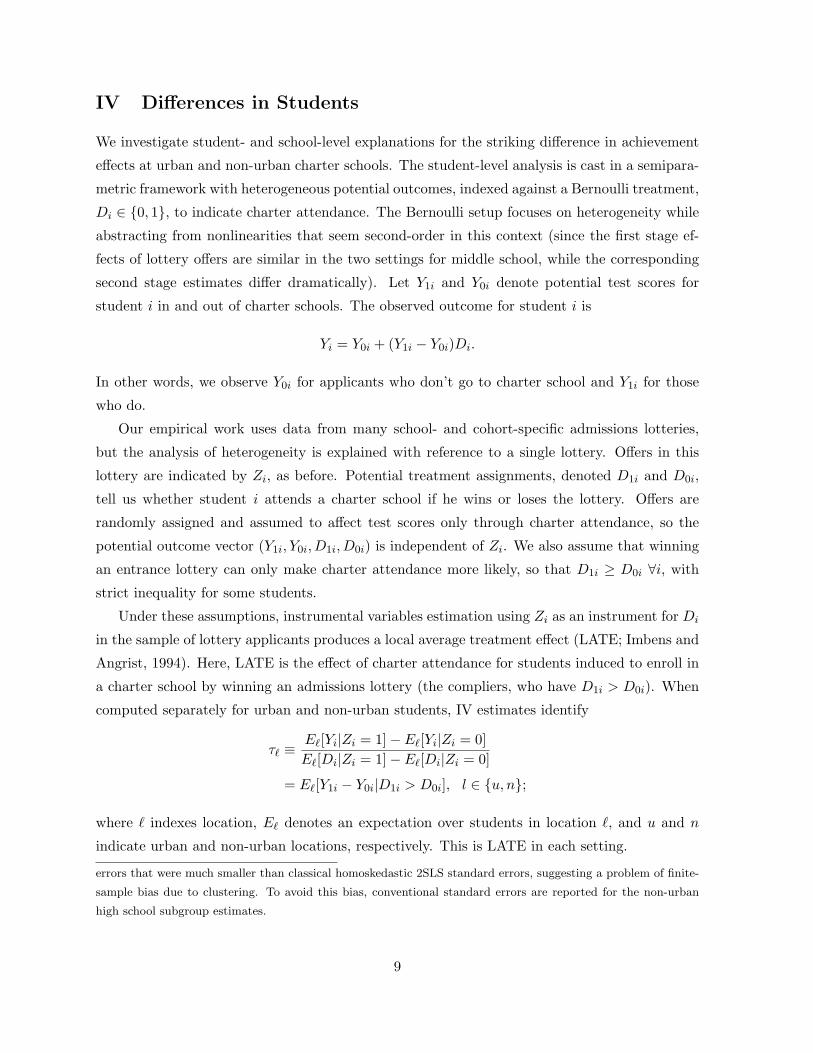
IV Differences in Students
We investigate student- and school-level explanations for the striking difference in achievement
effects at urban and non-urban charter schools. The student-level analysis is cast in a semipara-
metric framework with heterogeneous potential outcomes, indexed against a Bernoulli treatment,
Di ∈ {0, 1}, to indicate charter attendance. The Bernoulli setup focuses on heterogeneity while
abstracting from nonlinearities that seem second-order in this context (since the first stage ef-
fects of lottery offers are similar in the two settings for middle school, while the corresponding
second stage estimates differ dramatically). Let Y1i and Y0i denote potential test scores for
student i in and out of charter schools. The observed outcome for student i is
Yi = Y0i + (Y1i − Y0i)Di.
In other words, we observe Y0i for applicants who don’t go to charter school and Y1i for those
who do.
Our empirical work uses data from many school- and cohort-specific admissions lotteries,
but the analysis of heterogeneity is explained with reference to a single lottery. Offers in this
lottery are indicated by Zi, as before. Potential treatment assignments, denoted D1i and D0i,
tell us whether student i attends a charter school if he wins or loses the lottery. Offers are
randomly assigned and assumed to affect test scores only through charter attendance, so the
potential outcome vector (Y1i, Y0i, D1i, D0i) is independent of Zi. We also assume that winning
an entrance lottery can only make charter attendance more likely, so that D1i ≥ D0i ∀i, with
strict inequality for some students.
Under these assumptions, instrumental variables estimation using Zi as an instrument for Di
in the sample of lottery applicants produces a local average treatment effect (LATE; Imbens and
Angrist, 1994). Here, LATE is the effect of charter attendance for students induced to enroll in
a charter school by winning an admissions lottery (the compliers, who have D1i > D0i). When
computed separately for urban and non-urban students, IV estimates identify
τ` ≡E`[Yi|Zi = 1]− E`[Yi|Zi = 0]E`[Di|Zi = 1]− E`[Di|Zi = 0]
= E`[Y1i − Y0i|D1i > D0i], l ∈ {u, n};
where ` indexes location, E` denotes an expectation over students in location `, and u and n
indicate urban and non-urban locations, respectively. This is LATE in each setting.
errors that were much smaller than classical homoskedastic 2SLS standard errors, suggesting a problem of finite-
sample bias due to clustering. To avoid this bias, conventional standard errors are reported for the non-urban
high school subgroup estimates.
9

We pinpoint three sources of student-level heterogeneity that might contribute to the differ-
ence between τu and τn. The first is the urban/non-urban difference in treated and non-treated
counterfactuals (that is, distinct differences in average Y1i and Y0i). This investigation tells us
whether the urban charter advantage reflects high scores in the treated state, low non-treated
outcomes, or both. The second is variation in Y0i across charter and non-charter students within
each area. This tells us whether charter applicants and/or charter lottery compliers are unusual
in either setting. Finally, we decompose the difference in charter effectiveness across areas into
a component due to differences in student populations and a component due to differences in
effectiveness conditional on student characteristics.
Gaps in Treatment and No-Treatment Counterfactuals
The urban charter advantage can be split into two parts, the first capturing differences in
potential outcomes in the treated state (differences in Y1i) and the second capturing differences
in potential outcomes in the non-treated state (differences in Y0i). Specifically, we have
τu − τn =Eu[Y1i|D1i > D0i]− En[Y1i|D1i > D0i]︸ ︷︷ ︸γ1
(5)
− (Eu[Y0i|D1i > D0i]− En[Y0i|D1i > D0i])︸ ︷︷ ︸γ0
.
Here, γ1 measures the difference in treated potential outcomes for compliers at urban and non-
urban charter schools, while γ0 measures the difference in non-treated potential outcomes be-
tween these two groups.
Pooling urban and non-urban charter applicants, we estimate γ0 using
Yi(1−Di) = ψ(1−Di) + γ0(1−Di)Ui +∑j
δjdij + εi (6)
where Ui is an urban status indicator. The first stage equation for 1−Di is
1−Di =∑j
κjdij +∑j
πjdijZi + ηi. (7)
The first stage equation for the interaction between 1 − Di and urban status uses the same
specification as equation (7).16 For a model without covariates, Abadie (2003) shows that
2SLS estimation of this type of system produces estimates of marginal mean counterfactuals for
compliers; in this case, the 2SLS estimate is the mean of Y0i for compliers. (We estimate γ1 using
a model that replaces (1−Di) with Di in equations (6) and (7).) Our parameterization differs16Since applicants to urban and non-urban charter schools are disjoint sets, the main effect for urban status is
collinear with the dij and therefore omitted.
10

from Abadie’s in two ways. First, we’re interested in the difference in marginal mean outcomes
between urban and non-urban compliers: ψ equals the average of Y0i for lottery compliers in
non-urban areas, while ψ + γ0 is the average of Y0i for compliers in urban areas. Second, our
estimating equation includes a saturated model for risk sets. In this case, the 2SLS estimands
are weighted averages of mean Y0i for compliers across risk sets, with weights proportional to
the variance of the first-stage fitted values in the risk set (this is a consequence of Theorem 3 in
Angrist and Imbens 1995).17
Columns (1) and (2) of Table 6 report 2SLS estimates of urban and non-urban charter effects
using scores one year after application for middle school and 10th grade scores for high school.
Column (3), which reports τu− τn, shows that the differences in middle school charter effects by
urban status are 0.38σ in ELA and 0.66σ in math. Columns (4) and (5) show large differences in
non-charter fallback between urban and non-urban compliers. The estimates of γ0 imply that,
when enrolled in public schools, non-urban middle school compliers outscore urban compliers by
0.67σ in ELA and 0.57σ in math. On the other hand, in charter schools, non-urban compliers
outscore urban compliers by only 0.29σ in ELA, and urban compliers score 0.09σ higher in math
(though this estimate is not statistically significant).
Panel B of Table 6 reports the corresponding estimates for high school. Just as in middle
school, lower non-treated outcomes for urban compliers are part of the urban impact advantage,
though differences in treated outcomes are larger in high school than in middle school. In
public school, non-urban compliers outscore urban compliers by 0.87σ in ELA and 0.76σ in
math. In charter schools, these gaps shrink to 0.50σ and 0.23σ (the latter estimate is not
statistically significant). In other words, charter high school compliers start well behind non-
urban compliers. Charter attendance closes most of this gap in middle school, especially for
math, and some though not all of the corresponding gap in high school.
Non-treated Gaps in Urban and Non-urban Areas
Table 6 compares the no-treatment outcomes of urban compliers to the corresponding outcomes
of non-urban compliers. By contrast, here we benchmark achievement in each area using the
local non-charter mean. This tells us whether the urban charter advantage is driven by unusually
low no-treatment outcomes for compliers, or whether urban lottery compliers are, in fact, typical
of their milieu. Figure 1 illustrates the alternative scenarios we have in mind: the left panel
describes a situation in which the achievement of untreated urban students is comparable to17For example, the probability limit of the 2SLS estimate of ψ in equation (6) is
ψ =Xj∈NU
„fj ·π2
j ·V ar(Zi|dij=1)Pk fk·π2
k·V ar(Zi|dik=1)
«E[Y0i|D1i > D0i, dij = 1]
where NU is the set of non-urban lotteries and fj is the fraction of non-urban students in risk set j.
11
ambient non-charter achievement, while the right panel describes a situation in which the urban
fallback is unusually low.
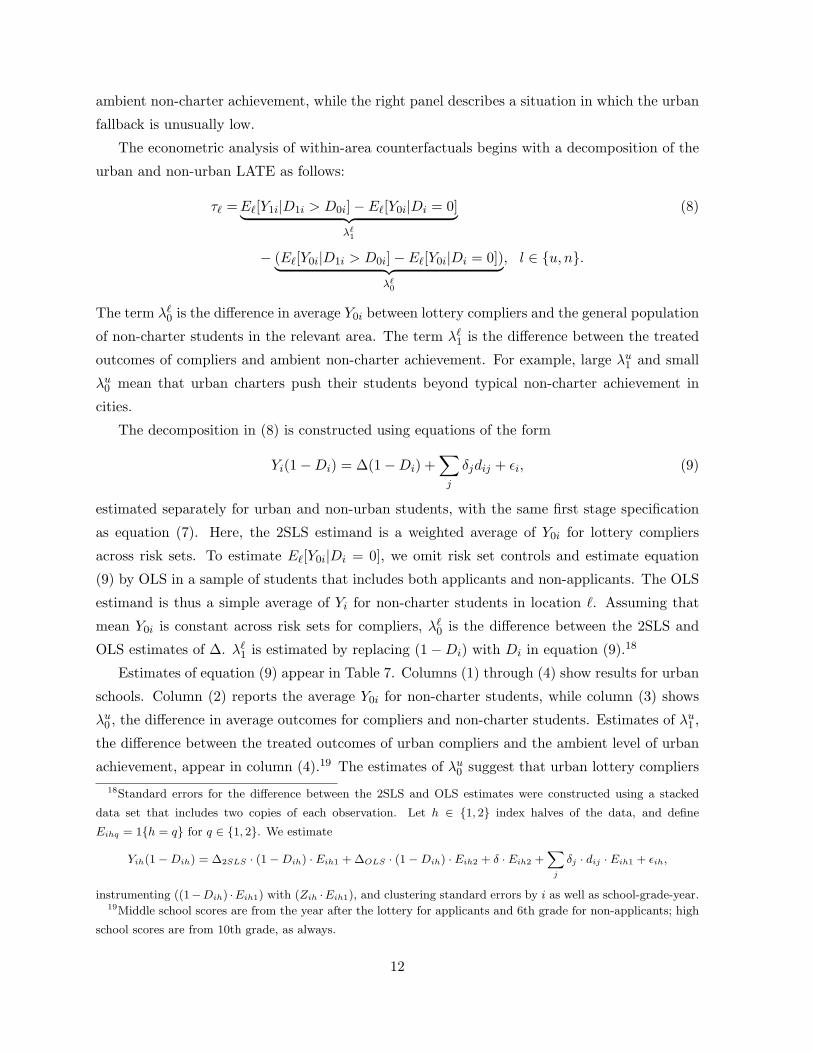
The econometric analysis of within-area counterfactuals begins with a decomposition of the
urban and non-urban LATE as follows:
τ` =E`[Y1i|D1i > D0i]− E`[Y0i|Di = 0]︸ ︷︷ ︸λ`1
(8)
− (E`[Y0i|D1i > D0i]− E`[Y0i|Di = 0])︸ ︷︷ ︸λ`0
, l ∈ {u, n}.
The term λ`0 is the difference in average Y0i between lottery compliers and the general population
of non-charter students in the relevant area. The term λ`1 is the difference between the treated
outcomes of compliers and ambient non-charter achievement. For example, large λu1 and small
λu0 mean that urban charters push their students beyond typical non-charter achievement in
cities.
The decomposition in (8) is constructed using equations of the form
Yi(1−Di) = ∆(1−Di) +∑j
δjdij + εi, (9)
estimated separately for urban and non-urban students, with the same first stage specification
as equation (7). Here, the 2SLS estimand is a weighted average of Y0i for lottery compliers
across risk sets. To estimate E`[Y0i|Di = 0], we omit risk set controls and estimate equation
(9) by OLS in a sample of students that includes both applicants and non-applicants. The OLS
estimand is thus a simple average of Yi for non-charter students in location `. Assuming that
mean Y0i is constant across risk sets for compliers, λ`0 is the difference between the 2SLS and
OLS estimates of ∆. λ`1 is estimated by replacing (1−Di) with Di in equation (9).18
Estimates of equation (9) appear in Table 7. Columns (1) through (4) show results for urban
schools. Column (2) reports the average Y0i for non-charter students, while column (3) shows
λu0 , the difference in average outcomes for compliers and non-charter students. Estimates of λu1 ,
the difference between the treated outcomes of urban compliers and the ambient level of urban
achievement, appear in column (4).19 The estimates of λu0 suggest that urban lottery compliers18Standard errors for the difference between the 2SLS and OLS estimates were constructed using a stacked
data set that includes two copies of each observation. Let h ∈ {1, 2} index halves of the data, and define
Eihq = 1{h = q} for q ∈ {1, 2}. We estimate
Yih(1−Dih) = ∆2SLS · (1−Dih) · Eih1 + ∆OLS · (1−Dih) · Eih2 + δ · Eih2 +Xj
δj · dij · Eih1 + εih,
instrumenting ((1−Dih) ·Eih1) with (Zih ·Eih1), and clustering standard errors by i as well as school-grade-year.19Middle school scores are from the year after the lottery for applicants and 6th grade for non-applicants; high
school scores are from 10th grade, as always.
12

are positively selected from the urban middle school population, but the estimated gaps are
small, and marginally significant only for middle school ELA (λu0 for high school is virtually zero
in both subjects). Because urban charter compliers have non-charter achievement levels that
are fairly typical of students in urban areas, the large score gains generated by urban charter
schools can be attributed to high scores in the treated state.
Columns (7) and (8) of Table 7 report estimates of λn0 and λn1 for students at non-urban
charter schools. As in urban areas, the non-charter achievement level of non-urban middle
school compliers is slightly higher than that of students in the surrounding public schools. The
ELA scores of non-urban middle school compliers in public schools exceed the ambient non-
urban achievement level by a statistically significant 0.10σ, while the estimate of λn1 for ELA
is a precisely estimated −0.09σ. This implies that non-urban charter middle schools move
their students from atypically high ELA achievement levels to levels below those of non-urban
public school students. Non-charter math achievement of non-urban middle school compliers
is statistically indistinguishable from the ambient non-charter level, while non-urban charter
attendance pulls compliers 0.14σ below the non-charter mean. The results for non-urban high
school students show more positive selection (high λn0 ) than in middle school. As can be seen
by comparing columns (7) and (8) in Panel B, charter attendance leaves non-urban high school
students essentially unchanged from this higher starting point.
Combined with the estimates of γ0 and γ1 in Table 6, these results paint a consistent picture
of the urban charter advantage. Urban middle school charters push the scores of their students
from a typically low level up to a level much closer to the achievement seen among non-urban
charter students (the scenario sketched in the left panel of Figure 1). Non-urban charter middle
schools reduce the scores of their students, in some cases markedly so. The corresponding results
for high schools are like like those for middle schools in that urban charter high schools push
their students beyond the level of achievement typical of urban public high schools. Non-urban
charter high schools leave scores unchanged from a higher non-charter counterfactual baseline.
Accounting for Student Demographics
The role student demographics play in generating the urban charter advantage is explored with
the help of a decomposition in the spirit of Blinder (1973) and Oaxaca (1973). The first step
uses the methods of Abadie (2003) to identify a linear local average response function for lottery
compliers conditional on a vector of observable demographic variables, Xi. Specifically, we have
E`[Yi|D1i > D0i, Di, Xi, dij ] = X ′iθ` + ω`Di +DiX
′iρ` +
∑j
δjdij , l ∈ {u, n}. (10)
This equation has a causal interpretation because conditional on being a complier, treatment
status (charter enrollment) is ignorable. Abadie (2003) shows that 2SLS using Bernoulli instru-
13
ments for a Bernoulli treatment consistently estimates this sort of linear model for local average
causal response.
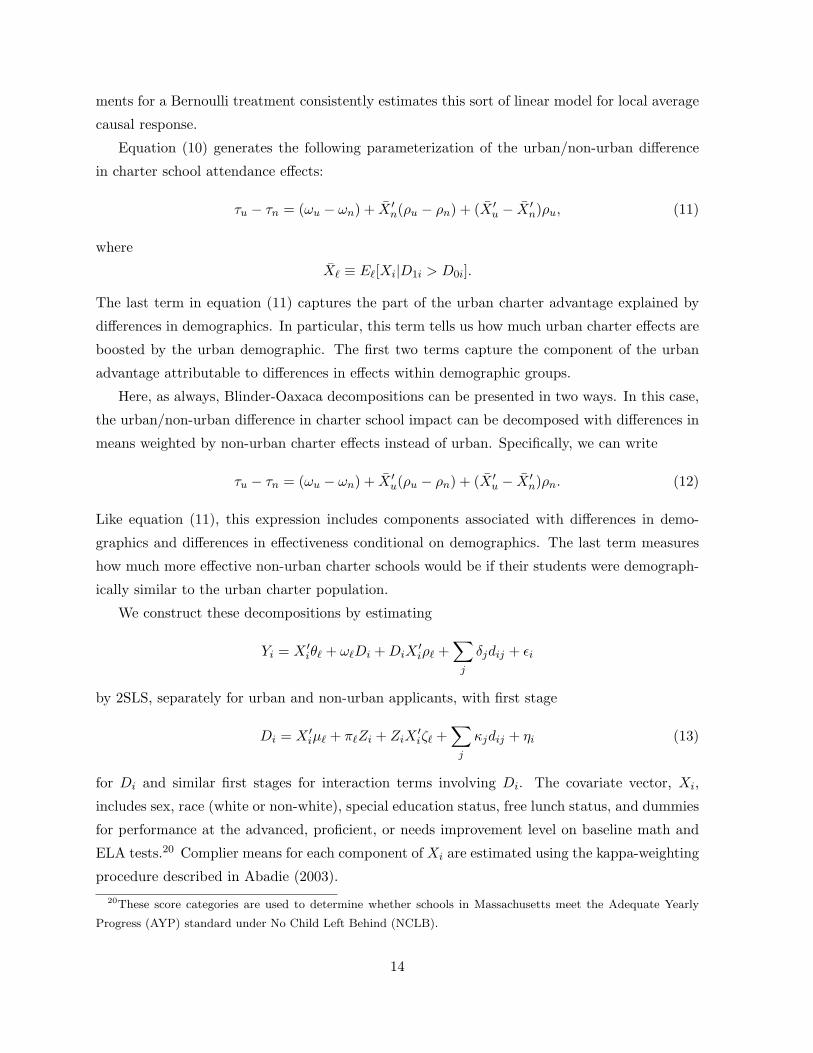
Equation (10) generates the following parameterization of the urban/non-urban difference
in charter school attendance effects:
τu − τn = (ωu − ωn) + X ′n(ρu − ρn) + (X ′
u − X ′n)ρu, (11)
where
X` ≡ E`[Xi|D1i > D0i].
The last term in equation (11) captures the part of the urban charter advantage explained by
differences in demographics. In particular, this term tells us how much urban charter effects are
boosted by the urban demographic. The first two terms capture the component of the urban
advantage attributable to differences in effects within demographic groups.
Here, as always, Blinder-Oaxaca decompositions can be presented in two ways. In this case,
the urban/non-urban difference in charter school impact can be decomposed with differences in
means weighted by non-urban charter effects instead of urban. Specifically, we can write
τu − τn = (ωu − ωn) + X ′u(ρu − ρn) + (X ′
u − X ′n)ρn. (12)
Like equation (11), this expression includes components associated with differences in demo-
graphics and differences in effectiveness conditional on demographics. The last term measures
how much more effective non-urban charter schools would be if their students were demograph-
ically similar to the urban charter population.
We construct these decompositions by estimating
Yi = X ′iθ` + ω`Di +DiX
′iρ` +
∑j
δjdij + εi
by 2SLS, separately for urban and non-urban applicants, with first stage
Di = X ′iµ` + π`Zi + ZiX
′iζ` +
∑j
κjdij + ηi (13)
for Di and similar first stages for interaction terms involving Di. The covariate vector, Xi,
includes sex, race (white or non-white), special education status, free lunch status, and dummies
for performance at the advanced, proficient, or needs improvement level on baseline math and
ELA tests.20 Complier means for each component of Xi are estimated using the kappa-weighting
procedure described in Abadie (2003).20These score categories are used to determine whether schools in Massachusetts meet the Adequate Yearly
Progress (AYP) standard under No Child Left Behind (NCLB).
14

Blinder-Oaxaca decompositions suggest that favorable demographics enhance urban charter
effectiveness, but differences in student populations do not fully account for the urban charter
advantage. This can be seen in Table 8, which shows the components of equations (11) and (12)
for middle schools. (The non-urban high school samples are too small to admit meaningful inves-
tigations of effect heterogeneity using this approach.) Column (1) shows the difference in charter
middle school treatment effects by urban status.21 Columns (2) and (3) report the components
of decomposition (11), which multiplies the urban/non-urban difference in demographics by
treatment effects for urban schools. Column (2) shows how urban effectiveness might change if
urban schools were to serve the non-urban population. These results suggest that 47 percent of
the urban advantage in ELA (0.18/0.39) can be explained by the level of student demographics.
The corresponding estimate for math is 51 percent. Urban schools are especially effective for
poor and minority students, and they serve more of these students than do non-urban schools.
On the other hand, column (3) shows that even with the same student mix as non-urban charter
schools, urban charters would be more effective than non-urban charters. The urban charter
advantage can therefore be attributed to a combination of student demographics and larger
treatment effects within demographic groups. As shown in columns (4) and (5), decomposition
(12) produces qualitatively similar results, though the standard errors for this decomposition
are much larger due to the relative imprecision of the estimated ρn.
V Differences in Schools
Our exploration of school-level heterogeneity in achievement effects builds on observational es-
timates, since this provides a larger sample of schools with more variation in characteristics and
practices and allows us to compare effects for eligible charter schools with and without lottery
records. The observational estimates use a combination of matching and regression to control for
observed differences between students attending different types of schools. Specifically, students
attending lottery-eligible charters are matched to a control sample with the same baseline school,
baseline year, sex, and race. Charter students are matched if they fall into a cell that includes
at least one regular public school student; likewise, regular public school students are matched
if they fall into in a cell that includes at least one student in an eligible charter school. Every
charter student in the matched sample is therefore compared to at least one demographically
similar student from the same cohort and sending school. This procedure yields matches for
92 percent of students in eligible charter schools. To validate the observational research design,
we compared lottery-based and observational results for schools where both are available. This21These differences differ slightly from those reported in Table 6 because equation (13) imposes first stage
coefficients that are constant across risk sets, while the earlier estimates allow the first stage coefficients to vary.
15

comparison was encouraging, as the two designs produced qualitatively similar estimates for
most schools.22
An observational model with interaction terms captures variation in charter effects with
student, school, and peer characteristics. Specifically, we estimate the following equation for
student i from cell c, observed in grade g in year t:
yigtc = αt + βg + ιc +X ′iθ + P ′iγ +Mi · P ′iδ + τisigt + εigtc (14)
where
τi = φ0 + φ1Mi + P ′iφ2 +Mi · P ′iφ3 +W ′s(i)φ4. (15)
Here, sigt measures years spent in eligible charter schools for student i from baseline through year
t, while Xi is a vector of additional student characteristics including limited English proficiency,
special education status, subsidized lunch status, and baseline test scores.23 Mi is a dummy
for minority status, while Pi is a vector of peer characteristics and Ws(i) describes other school
characteristics (for charter schools only).24 Equation (14) is estimated in a pooled sample of
middle and high school students, with standard errors double-clustered at the student and school
levels.
Consistent with the findings reported in Table 4, estimates of equation (14) reveal substan-
tially larger treatment effects at urban charter schools. As shown in columns (1) and (5) of Table
9, the urban advantage is roughly 0.11σ in ELA and 0.18σ in math. Interestingly, controlling for
urban and other school characteristics, oversubscribed schools with high-quality lottery records
also seem to be more effective than non-lottery schools: lottery-sample schools generate gains
that are 0.10σ and 0.13σ larger than the effects of non-lottery schools. This is further evidence
of the importance of school-level heterogeneity in charter effects.
Columns (2) and (6) in Table 9 show the results of adding instruction time (minutes per
day and in the relevant subject) and per-pupil expenditures to the list of interactions. These
variables are often thought to be part of the education production function. Motivated in
part by the long days at successful charter schools (Pennington, 2007), the Massachusetts leg-
islature recently authorized a pilot program to extend the school day by two hours in some22The results of this validation exercise appear in Appendix Table A4. Observational estimates come from
models including grade, year, and matching cell fixed effects, demographics and baseline scores, and variables
measuring years spent in eligible lottery and non-lottery charter schools. Observational estimates for schools in
the urban lottery sample are strikingly similar to the lottery results. The match between lottery and observational
results for non-urban schools is not as good, with more positive observational estimates than generated by lottery
methods. This seems unlikely to affect the main conclusions from the observational analysis, however.23The observational regressions also control for years spent in ineligible charters and alternative schools.24The main effect for Mi in equation (14) is absorbed by fixed effects for cells used in the match. Peer
characteristics are jackknife means of baseline achievement and free lunch status for a student’s classmates in the
relevant grade and year, centered to have mean zero in the estimation sample.
16

traditional public schools. Per-pupil expenditure is also of longstanding interest to researchers
and policy-makers; increasing per-pupil expenditure is sometimes seen as an alternative to struc-
tural reforms (Hanushek, 1997). As it turns out, however, these school-environment variables
are unrelated to variation in charter school treatment effects and accounting for these measures
of practice does little to account for the urban and lottery-sample advantages.
We next ask whether school approach or philosophy explains charter-effect heterogeneity.
The estimates in columns (3) and (7) of Table 9 come from models that swap a No Excuses
dummy for other measures of school practice.25 No Excuses charter schools generate ELA and
math gains that are 0.18σ and 0.27σ larger than the effects of other charters. Moreover, No
Excuses status accounts fully for the urban and lottery sample advantages in both subjects:
conditional on No Excuses status, with no other inputs included, the estimated urban and
lottery coefficients are small and insignificant, while still reasonably precisely estimated.
Because charter students are (somewhat) positively selected, a possible explanation for char-
ter effectiveness is a peer effect. Rothstein (2004) emphasizes the potential importance of peer
effects for the achievement of low-income students:
“Ambitions are contagious; if children sit next to others from higher social classes,
their ambitions grow. This finding has been reconfirmed often. Lower-class children
achieve less if the share of low-income children in their school is higher. The drop is
most severe when the subsidized lunch population exceeds 40%. This truth has not
changed since Brown vs. Board of Education.”
Our findings for charter schools provide little support for this theory. As can be seen in columns
(4) and (8) of Table 9, the signs of the peer coefficients suggest that score gains vary inversely with
peer achievement and family income, though these interaction effects are not significant for non-
minority students. The negative relationship between peer achievement and score gains is more
pronounced for minorities, as evidenced by the significant negative interactions between minority
status and peer baseline scores.26 Importantly, No Excuses status remains a strong predictor of
charter school effectiveness in models that include peer characteristics, while instructional time
and spending play little role.27
25The No Excuses dummy is constructed from responses to this question: Do you see your school as adhering
to a particular approach or philosophy, such as No Excuses?26With peer characteristics included, the urban coefficient becomes negative, but this reflects linear extrapola-
tion to a scenario where the peer variables are the same in urban and non-urban areas, a situation never observed
in our data (the mean baseline score is markedly higher for every non-urban school).27Appendix Table A5 replicates the observational findings related to No Excuses using the lottery sample. In
the lottery analysis, peer characteristics are jackknife means for students in the same risk set (instead of the same
school), and the instrument set includes interactions of lottery offer dummies and these variables.
17
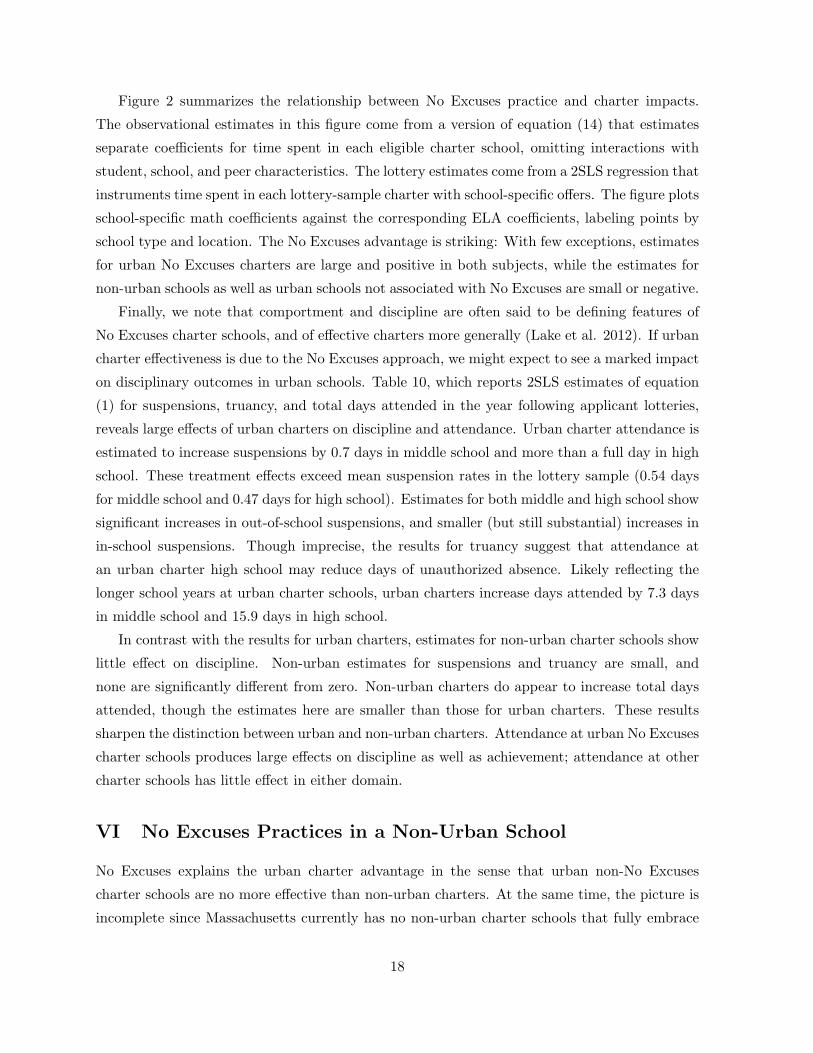
Figure 2 summarizes the relationship between No Excuses practice and charter impacts.
The observational estimates in this figure come from a version of equation (14) that estimates
separate coefficients for time spent in each eligible charter school, omitting interactions with
student, school, and peer characteristics. The lottery estimates come from a 2SLS regression that
instruments time spent in each lottery-sample charter with school-specific offers. The figure plots
school-specific math coefficients against the corresponding ELA coefficients, labeling points by
school type and location. The No Excuses advantage is striking: With few exceptions, estimates
for urban No Excuses charters are large and positive in both subjects, while the estimates for
non-urban schools as well as urban schools not associated with No Excuses are small or negative.
Finally, we note that comportment and discipline are often said to be defining features of
No Excuses charter schools, and of effective charters more generally (Lake et al. 2012). If urban
charter effectiveness is due to the No Excuses approach, we might expect to see a marked impact
on disciplinary outcomes in urban schools. Table 10, which reports 2SLS estimates of equation
(1) for suspensions, truancy, and total days attended in the year following applicant lotteries,
reveals large effects of urban charters on discipline and attendance. Urban charter attendance is
estimated to increase suspensions by 0.7 days in middle school and more than a full day in high
school. These treatment effects exceed mean suspension rates in the lottery sample (0.54 days
for middle school and 0.47 days for high school). Estimates for both middle and high school show
significant increases in out-of-school suspensions, and smaller (but still substantial) increases in
in-school suspensions. Though imprecise, the results for truancy suggest that attendance at
an urban charter high school may reduce days of unauthorized absence. Likely reflecting the
longer school years at urban charter schools, urban charters increase days attended by 7.3 days
in middle school and 15.9 days in high school.
In contrast with the results for urban charters, estimates for non-urban charter schools show
little effect on discipline. Non-urban estimates for suspensions and truancy are small, and
none are significantly different from zero. Non-urban charters do appear to increase total days
attended, though the estimates here are smaller than those for urban charters. These results
sharpen the distinction between urban and non-urban charters. Attendance at urban No Excuses
charter schools produces large effects on discipline as well as achievement; attendance at other
charter schools has little effect in either domain.
VI No Excuses Practices in a Non-Urban School
No Excuses explains the urban charter advantage in the sense that urban non-No Excuses
charter schools are no more effective than non-urban charters. At the same time, the picture is
incomplete since Massachusetts currently has no non-urban charter schools that fully embrace
18

the No Excuses approach. We can’t say, therefore, whether non-urban students would realize
the same sort of gains that urban No Excuses students enjoy.
In an effort to paint a more complete picture of charter effect heterogeneity, we collected data
from a K-12 non-urban charter school that incorporates many practices more commonly found
in urban charters. This school, which we refer to as non-urban charter high school (NCHS),
falls outside of our main sampling frame due to kindergarten entry, but it provides a unique
opportunity to study elements of No Excuses practice in a non-urban setting. As shown in
column (1) of Table 11, NCHS features an extended day, Saturday school, long periods of math
and reading instruction, parent and student contracts, uniforms, and a reward system. On the
other hand, the teacher age distribution and fraction licensed at NCHS look more non-urban
than urban. As can be seen in column (2), NCHS has more minority students than most non-
charters, though most NCHS students are white.
Our analysis of NCHS uses data from kindergarten entrance lotteries from 2004-7, as well
as expansion lotteries held in two years in which the school added middle and high school seats.
The kindergarten cohort analysis uses MCAS scores in grades 3 through 6, while the analysis of
expansion lotteries uses scores in grades 5 through 8 and 10 (see the data appendix for details).28
The effect of NCHS is estimated using a version of equation (1) that takes time spent at NCHS
as the endogenous variable of interest, instrumented with a lottery offer dummy. The risk sets
for this analysis correspond to interactions of application cohort and application grade.
Our analysis of NCHS generates mixed findings. The first stage estimates in column (3)
show that that kindergarten lottery winners spent an average of 2.4 more years at NCHS than
lottery losers prior to taking the MCAS. The corresponding 2SLS estimates imply that NCHS
attendance reduces ELA and math scores by 0.05σ and 0.09σ, both significant effects. On the
other hand, the 2SLS estimates for the middle and high school expansion lotteries are large
and positive, though imprecise and not significantly different from zero. Although somewhat
inconclusive, these results fail to show the sharp evidence of achievement gains generated by the
most effective urban charters (including some for which a single-school analysis produces clear
evidence of gains).
The relatively weak NCHS results suggest that the No Excuses treatment interacts favor-
ably with the urban demographic mix. Few NCHS students are as disadvantaged as those
attending urban charters. The Blinder-Oaxaca decomposition reported in Table 9 shows that
urban charters are especially effective for a nonwhite high-poverty population with low baseline
achievement. It’s worth noting, however, that an analysis of NCHS impacts in demographic
subgroups fails to uncover substantial positive effects, though the subgroup samples are small
and the resulting estimates imprecise.28Table A10 reports on lottery balance at NCHS; Table A11 reports on attrition.
19

A second possibility is that NCHS is not “No Excuses enough”. An analysis of effects on
suspension along the lines of that reported for the full sample in Table 10 shows low rates overall
and no increase for those who attend NCHS (though NCHS’ longer school year is reflected in
a marginally significant impact on days attended). NCHS also employs older teachers than
do the charter schools in our urban sample. Moreover, NCHS reported no involuntary teacher
separations. Many of the most effective urban charter schools rely on an inexperienced though
perhaps relatively flexible teaching staff, and are quick to replace teachers who appear to be
struggling or otherwise ill-suited to the school’s approach. Consistent with the notion that
teacher matching is an important part of charter school effectiveness, Dobbie and Fryer (2011b)
report that selective teacher hiring predicts charter school success, including at charter schools
that identify with a No Excuses disciplinary approach. Likewise, Fryer’s (2011) effort to give
Houston public schools a No Excuses makeover includes an effort to replace veteran teachers
deemed ineffective.
VII Conclusions
Massachusetts’ urban charter schools generate impressive achievement gains, while non-urban
charters are largely ineffective and appear to reduce achievement for some. Candidate explana-
tions for this constellation of findings include the fact that urban charter schools serve larger
shares of minority students in districts where the surrounding achievement level is generally low,
keep their students in school longer, spend more money per-pupil, and are much more likely to
identify with the No Excuses instructional approach than are non-urban schools. Our analy-
sis examines the contribution of these student- and school-level factors to the urban charter
advantage.
Massachusetts’ urban charter schools, including the over-subscribed schools at the heart of
our lottery analysis, serve a typical urban population characterized by low test scores and high
poverty rates. On average, urban charters push their students well beyond the achievement
levels characteristic of urban public school districts, while non-urban charter schools leave their
students’ achievement unchanged or diminished from a higher starting point. Urban charter
schools are most effective for minorities, poor students, and low baseline achievers, so part of
the urban charter advantage can be explained by student demographics. On the other hand,
non-urban charter schools fail to show clear gains for any group; the urban advantage would
likely remain were non-urban students more like those found in cities. Our analysis also reveals
important heterogeneity within the set of urban schools. Over-subscribed schools with well-
documented admissions processes are more effective than other urban charters.
Our analysis of the relationship between school characteristics and treatment effects suggests
20

that adherence to the No Excuses paradigm can account for both the urban and lottery-sample
charter advantages. Instruction time and per-pupil expenditures are not strongly correlated
with school-specific impacts and do not explain differences in effectiveness after controlling for
No Excuses status. Consistent with a No Excuses explanation of the urban charter advantage,
the large achievement gains generated by urban charter schools are mirrored by substantial
effects on disciplinary outcomes in the urban sample. Our case study of a non-urban K-12
school that uses many elements of the No Excuses model fails to reveal comparable achievement
gains. This finding points to possibly important interactions between No Excuses and population
characteristics, as well as the importance of behavioral standards and teacher characteristics,
since disciplinary and hiring practices at this school appear to differ from those typical of urban
charters.
Our negative estimates for non-urban charter middle schools raise the question of why,
despite their unimpressive achievement effects, many of these schools are over-subscribed. One
possibility is that parents misjudge the consequences of non-urban charter attendance. In a study
of school choice, Rothstein (2006) argues that parental choice is driven primarily by levels of peer
achievement rather than school effectiveness. Of course, non-urban charter schools may generate
gains on dimensions that non-urban families value more than the skills measured by the MCAS,
especially in view of the fact that most non-urban students do reasonably well in any case. Still,
it seems unlikely that most non-urban parents would welcome a deterioration in basic skills. In
ongoing work, we’re studying other outcomes in an effort to determine whether the heterogeneous
findings for achievement reported here have longer-term consequences. Preliminary results shows
positive effects of urban charter high schools on SAT scores, suggesting the gains reported here
persist in an important way.
Finally, it’s worth noting that the charter school effect heterogeneity documented here is
relevant to the ongoing debate over charter expansion. Like many states, Massachusetts caps
the number of charter schools. The U.S. Department of Education is pressing states to lift
these caps. In 2010, the Massachusetts state legislature passed a bill relaxing the charter cap
for districts in the lowest decile of MCAS performance. This law gives priority to “proven
providers” who have previously operated schools deemed to be successful, but does not clearly
define success.29 Our methods show how a distinction between effective and ineffective charters
can be grounded in rigorous empirical analysis, while our results suggest that charter expansion
policies favoring operators and pedagogical models with documented effectiveness increases the
likelihood that charters will reduce achievement gaps.29See Candal (2010) for a detailed discussion of the new Massachusetts charter school law.
21
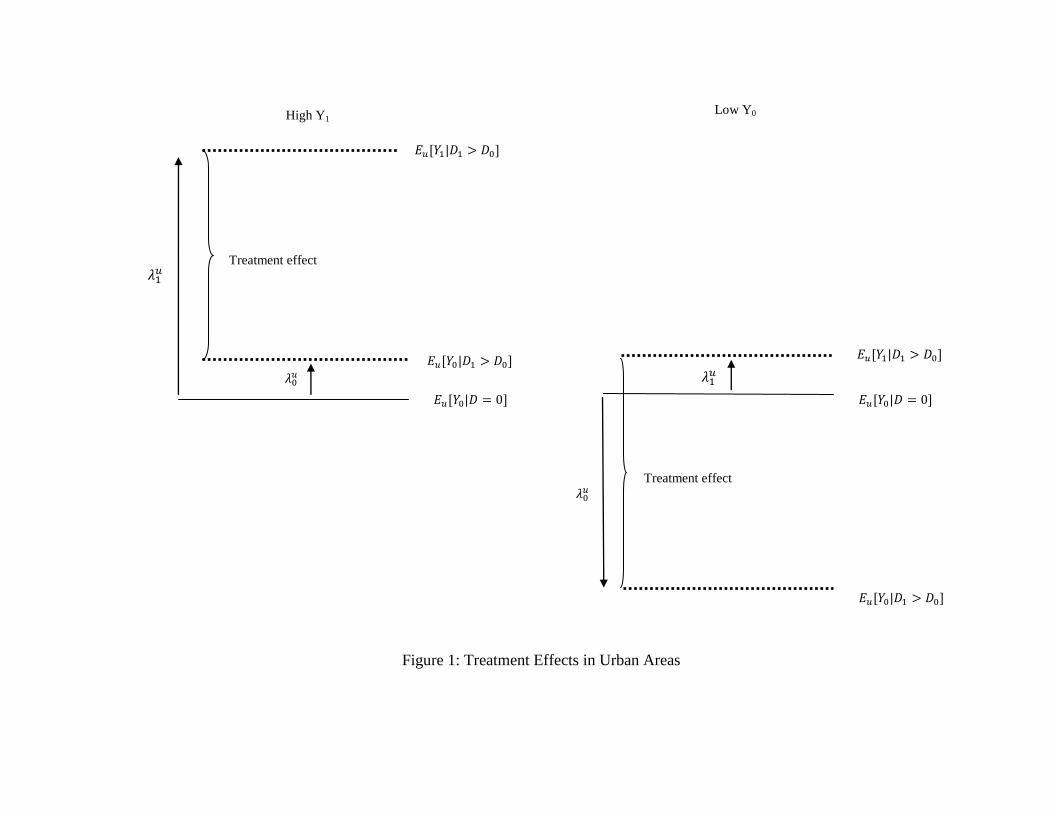
Figure 1: Treatment Effects in Urban Areas
Treatment effect
Treatment effect
High Y1 Low Y0

Figure 2: School-specific Treatment Effects
A. Lottery Estimates
B. Observational Estimates
Notes: These figures plot school-specific math effects against school-
specific ELA effects. Middle and high-school estimates are pooled to
create the figures.

Middle (entry in 4-7)
and high (entry in 9)
school charters*
Charters eligible for
lottery study
Charters included
in lottery study
School level Urban status Boston status (1) (2) (3)
Middle Urban 22 17 9
Boston 12 9 7
Non-Boston 10 8 2
Nonurban 12 11 8
Total (Urban and Nonurban) 34 28 17
High Urban 12 6 4
Boston 8 5 4
Non-Boston 4 1 0
Nonurban 4 2 2
Total (Urban and Nonurban) 16 8 6
* There is an exception to the 9th grade entry criteria for high school. Two schools with lotteries at the middle school entry point which also
enroll students in the high school grades are included in the high school sample.
Table 1: School Participation
Notes: This table reports the number of middle and high charter schools in Massachusetts and their participation in the observational and
lottery studies. The numbered notes below describe the schools included in each column. "Urban" towns are defined by the Massachusetts
Department of Elementary and Secondary Education as the towns where the district superintendents participate in the Massachusetts Urban
Superintendents Network. These towns include: Boston, Brockton, Cambridge, Chelsea, Chicopee, Everett, Fall River, Fitchburg,
Framingham, Haverhill, Holyoke, Lawrence, Leominster, Lowell, Lynn, Malden, New Bedford, Pittsfield, Quincy, Revere, Somerville,
Springfield, Taunton, and Worcester.
1. Middle and high charter schools in Massachusetts with the designated entry grades (in 4-7 and 9)*, including schools opened in 2010 and
2. Middle and high charter schools in Massachusetts with the designated entry grades (in 4-7 and 9)*, excluding closed schools, alternative
3. Middle and high charter schools that are included in column (3), excluding schools that are undersubscribed or have insufficient lottery

All charters Urban charters Non-urban charters Regular public schools
(1) (2) (3) (4)
Years open 10.1 8.6 12.4 -
Days per year 186 189 183 -
Average minutes per day 450 467 422 -
Have Saturday school 0.310 0.444 0.091 -
Avg. math instruction (min) 82 96 60 -
Avg. reading instruction (min) 83 97 60 -
CMO or Network Affiliation 0.345 0.278 0.455 -
Fully or somewhat "No excuses" 0.414 0.667 0.000 -
Parent contract 0.621 0.722 0.455 -
Student contract 0.586 0.611 0.545 -
Uniforms 0.828 0.889 0.727 -
Reward system 0.483 0.667 0.182 -
Avg. per-pupil expenditure $12,618 $13,668 $11,091 $13,047
Title I eligible 0.862 1.000 0.636 0.503
Fraction of teachers leaving voluntarily 0.089 0.081 0.101 -
Fraction of teachers leaving involuntarily 0.053 0.063 0.039 -
Unpaid tutors/volunteers 0.793 0.722 0.909 -
Paid tutors 0.103 0.167 0.000 -
Proportion of teachers 32 and younger 0.557 0.696 0.329 0.201
Proportion of teachers 49 and older 0.165 0.077 0.309 0.422
Proportion of teachers licensed to teach assignment 0.637 0.619 0.668 0.981
Proportion of core classes taught by highly qualified teachers 0.943 0.924 0.975 0.976
Student/teacher ratio 12.0 12.6 11.1 15.2
N (schools) 29 18 11 1810
Notes: This table reports characteristics of Massachusetts charter and traditional schools. Panel A shows the results of a survey of charter school administrators, while
panel B shows teacher characteristics gathered from http://profiles.doe.mass.edu. Statistics are unweighted school-level means from the 2010-2011 school year.
Column (1) reports results from the statewide sample of charter schools with entry in middle (4th-7th) or high school (9th) grades. The charter sample also excludes
schools closed prior to Spring 2011, schools that opened after Spring 2010, and schools serving non-traditional student populations. Columns (2) and (3) show results
for the uban and non-urban charter subsamples. Column (4) reports teacher characteristics for all traditional public schools in Massachusetts. Highly qualified
teachers are teachers that possess a Massachusetts teaching license and demonstrate subject matter competency, either by passing a subject test or meeting one of
several other criteria.
Table 2: Characteristics of Charter and Public Schools
Panel B. Teacher Characteristics
Panel A. School Characteristics

Urban Non-urban Urban Non-urban Urban Non-urban
(1) (2) (3) (4) (5) (6)
Female 0.486 0.488 0.501 0.478 0.496 0.509
Black 0.183 0.027 0.381 0.035 0.479 0.022
Hispanic 0.319 0.038 0.246 0.039 0.233 0.025
Special education 0.191 0.165 0.167 0.158 0.176 0.185
Subsidized lunch 0.687 0.146 0.642 0.211 0.686 0.103
Limited English proficiency 0.160 0.017 0.082 0.022 0.085 0.008
Baseline Math score -0.427 0.210 -0.322 0.259 -0.356 0.305
Baseline ELA score -0.466 0.232 -0.312 0.275 -0.375 0.391
Years in charter 0.00 0.00 2.09 1.97 1.59 1.25
N (students) 171703 415794 8388 9070 4155 1701
N (schools) 262 400 17 11 9 8
Female 0.499 0.494 0.557 0.545 0.548 0.538
Black 0.189 0.028 0.527 0.021 0.614 0.028
Hispanic 0.275 0.034 0.183 0.010 0.257 0.017
Special education 0.172 0.156 0.166 0.109 0.178 0.114
Subsidized lunch 0.612 0.126 0.608 0.146 0.717 0.123
Limited English proficiency 0.094 0.009 0.024 0.004 0.035 0.003
Baseline Math score -0.420 0.268 -0.371 0.321 -0.320 0.440
Baseline ELA score -0.392 0.278 -0.318 0.412 -0.315 0.552
Years in charter 0.00 0.00 1.77 1.81 0.64 1.30
N (students) 132774 357733 2676 909 3029 351
N (schools) 104 316 6 2 4 2
Notes: This table reports descriptive statistics for the sample of public school students (columns 1 and 2), the sample of students in
eligible charter schools (columns 3 and 4), and the sample of charter applicants (columns 5 and 6) from 2002-2011. The sample is
restricted to students in Massachusetts public schools at baseline with at least one followup test score. The number of schools in
columns (1) and (2) is counted in 6th grade for middle school and 10th grade for high school. Years in charter school is measured as
time spent in eligible charter schools through 8th grade for middle school and 10th grade for high school.
Table 3: Descriptive Statistics for Students
Charter applicants (lottery)Regular Public Schools Charter schools (eligible)
Panel A. Middle Schools (5th-8th grade)
Panel B. High Schools (10th grade)
First Stage 2SLS First Stage 2SLS First Stage 2SLS
Subject (1) (2) (3) (4) (5) (6)
ELA 1.02*** 0.075*** 1.04*** 0.146*** 1.00*** -0.144***
(0.040) (0.025) (0.051) (0.028) (0.074) (0.039)
N
Math 1.02*** 0.213*** 1.03*** 0.321*** 1.01*** -0.123***
(0.040) (0.028) (0.051) (0.031) (0.074) (0.047)
N
ELA 0.542*** 0.215*** 0.479*** 0.280*** 1.14*** -0.048
(0.083) (0.063) (0.088) (0.071) (0.187) (0.059)
N
Math 0.542*** 0.285*** 0.479*** 0.360*** 1.13*** -0.023
(0.083) (0.075) (0.088) (0.083) (0.188) (0.071)
N
*significant at 10%; **significant at 5%; ***significant at 1%
Table 4: Lottery Results
Notes: This table reports 2SLS estimates of the effects of time spent in charter schools on test scores. The endogenous variable is years
spent in charter schools, and the instrument is a lottery offer dummy. Columns (1)-(2) show estimates for all schools, columns (3)-(4)
show estimates for urban charter schools, and columns (5)-(6) show estimates for non-urban schools. The urban and non-urban
estimates for a given subject come from a single regression with two endogenous variables, using urban and non-urban offers as
instruments. All models control for race, sex, special education, limited English proficiency, subsidized lunch status, and a female by
minority dummy. Year of birth, year of test, and risk set dummies are also included. Middle school regressions pool post-lottery
outcomes from 4th through 8th grade and cluster by student identifier as well as school-grade-year. High school regressions include
only scores for 10th grade and cluster by school-grade-year.
All charter schools Urban charter schools Non-urban charter schools
16285 11649 4636
16543 11941 4602
Panel A. Middle School
Panel B. High School
4101 3565 536
4048 3517 531

Female Male Black/Hispanic White
School level Subject (1) (2) (3) (4) (5) (6)
Middle ELA 0.124*** 0.173*** 0.211*** 0.034 0.182*** 0.279***
(0.037) (0.040) (0.037) (0.047) (0.033) (0.057)
N 5852 5797 8176 2537 7992 2840
Math 0.379*** 0.276*** 0.421*** 0.133** 0.348*** 0.388***
(0.042) (0.041) (0.040) (0.054) (0.036) (0.055)
N 5994 5947 8415 2583 8182 2869
High ELA 0.245*** 0.303*** 0.337*** -0.092 0.291*** 0.274*
(0.082) (0.113) (0.072) (0.399) (0.077) (0.152)
N 1954 1611 3059 311 2556 768
Math 0.384*** 0.345*** 0.395*** 0.244 0.359*** 0.455***
(0.103) (0.128) (0.082) (0.411) (0.089) (0.119)
N 1927 1590 3016 310 2520 810
Middle ELA -0.169*** -0.114* -0.241 -0.150*** -0.119 -0.188**
(0.049) (0.060) (0.251) (0.040) (0.099) (0.076)
N 2348 2288 237 4169 466 1134
Math -0.159*** -0.084 -0.230 -0.115** -0.128 -0.159**
(0.060) (0.070) (0.285) (0.045) (0.127) (0.071)
N 2332 2270 236 4135 456 1072
High ELA 0.003 -0.088 - -0.025 -0.204 0.109
(0.099) (0.092) (0.070) (0.222) (0.130)
N 281 255 496 71 123
Math -0.046 0.030 - 0.026 0.457* -0.057
(0.116) (0.127) (0.082) (0.243) (0.177)
N 281 250 494 68 119
*significant at 10%; **significant at 5%; ***significant at 1%
Notes: This table reports 2SLS estimates of the effects of time spent in charter schools for subgroups of students. All regressions include year
dummies, grade dummies, risk set dummies, and demographic controls. Middle school standard errors are clustered on student identifier as well as
school-grade-year. High school standard errors are clustered by school-grade-year for urban schools and are unclustered for non-urban schools.
Table 5: Lottery Results for Subgroups
Sex Race Subsidized
lunch
Lowest baseline
quartile
Panel A. Urban Schools
Panel B. Non-urban Schools

Urban effect Non-urban effect Effect difference ϒ0 ϒ1
Subject (1) (2) (3) (4) (5)
ELA 0.188*** -0.188*** 0.376*** -0.666*** -0.291***
(0.064) (0.054) (0.084) (0.077) (0.057)
N 4551 2323
Math 0.483*** -0.177** 0.659*** -0.570*** 0.090
(0.074) (0.074) (0.105) (0.082) (0.064)
N 4858 2239
ELA 0.438*** 0.064 0.373* -0.873*** -0.500***
(0.137) (0.151) (0.204) (0.181) (0.126)
N 3790 435
Math 0.590*** 0.065 0.526** -0.758*** -0.232
(0.162) (0.146) (0.218) (0.178) (0.156)
N 3743 432
*significant at 10%; **significant at 5%; ***significant at 1%
Table 6: Gaps in Treatment and No-treatment Counterfactuals
Notes: This table estimates components of the difference in charter treatment effects by urban status due to differences in
non-charter "fallback" and differences in treated outcomes. Outcomes are test scores the year after the lottery. Columns
(1) and (2) display urban and non-urban charter treatment effects, and column (3) gives the difference. Column (4)
shows an estimate of the difference in average Y0 between urban and non-urban compliers, computed as described in the
text. Column (5) shows an estimate of the difference in Y1 between these two groups.
Differences in potential outcomes
Panel A. Middle School
Panel B. High School

Treatment effect Eu[Y0|D=0] λ0u
λ1u Treatment effect En[Y0|D=0] λ0
nλ1
n
Subject (1) (2) (3) (4) (5) (6) (7) (8)
ELA 0.188*** -0.422*** 0.118** 0.306*** -0.188*** 0.260*** 0.102** -0.086***
(0.064) (0.012) (0.054) (0.049) (0.054) (0.007) (0.050) (0.030)
N 4551 117601 2323 316953
Math 0.483*** -0.399*** 0.077 0.560*** -0.177** 0.236*** 0.010 -0.143***
(0.074) (0.011) (0.049) (0.054) (0.074) (0.007) (0.061) (0.042)
N 4858 160394 2239 370813
ELA 0.417*** -0.369*** -0.004 0.410*** 0.064 0.250*** 0.237 0.301***
(0.140) (0.018) (0.096) (0.119) (0.151) (0.008) (0.152) (0.051)
N 3790 143583 435 362206
Math 0.557*** -0.371*** 0.074 0.602*** 0.065 0.241*** 0.207 0.271***
(0.164) (0.021) (0.099) (0.151) (0.146) (0.008) (0.145) (0.041)
N 3743 141468 432 360278
*significant at 10%; **significant at 5%; ***significant at 1%
Notes: This table compares potential outcomes for compliers and traditional public school students. For lottery applicants, outcomes are test scores in the year after the lottery
for middle school and in 10th grade for high school. For non-applicants, outcomes are 6th grade scores in middle school, and 10th grade scores in high school. The treatment is
a dummy for charter attendance. Columns (1) and (5) show 2SLS estimates of the effect of charter attendance on test scores in urban and non-urban areas, with the lottery offer
dummy interacted with risk sets as instruments and risk sets as maintained controls. Columns (2) and (6) shows average test scores for non-charter students, including non-
applicants. Columns (3) and (7) show differences between the average non-charter scores of compliers and non-charter students. Columns (4) and (8) show differences between
the treated outcomes of compliers and the scores of non-charter students.
Table 7: Potential Outcome Gaps in Urban and Non-urban Areas
Urban Non-urban
Panel A. Middle School
Panel B. High School

Urban vs. non-urban
difference in TE
Due to diffs in
cov. levels
Due to diffs in cov-
specific TE
Due to diffs in
cov. levels
Due to diffs in cov-
specific TE
Subject (1) (2) (3) (4) (5)
ELA 0.389*** 0.184** 0.205** 0.197 0.192
(0.073) (0.077) (0.095) (0.146) (0.180)
N 5734
Math 0.633*** 0.322*** 0.312*** 0.250 0.383*
(0.079) (0.075) (0.094) (0.163) (0.200)
N 5731
*significant at 10%; **significant at 5%; ***significant at 1%
Table 8: Decomposing Differences in Impact for Middle School
Decomposition 1 (urban loading) Decomposition 2 (non-urban loading)
Notes: This table decomposes the difference between urban and non-urban charter treatment effects. Outcomes are test scores the year
after the lottery. The treatment is a dummy for charter attendance. Column (1) shows the difference in urban vs. non-urban treatment
effects, computed as described in the text. Columns (2) and (3) report the components of the urban/non-urban difference due to
differences in covariate levels and differences in covariate-specific effects, weighting the difference in covariate means by the urban
treatment effects. Columns (4) and (5) report a decomposition that weights the difference in means by the non-urban treatment effects.
The covariates used in the decompositions are race (white vs. non-white), sex, special education, free/reduced price lunch, and baseline
score categories (advanced, proficient, needs improvement, warning) in math and ELA.
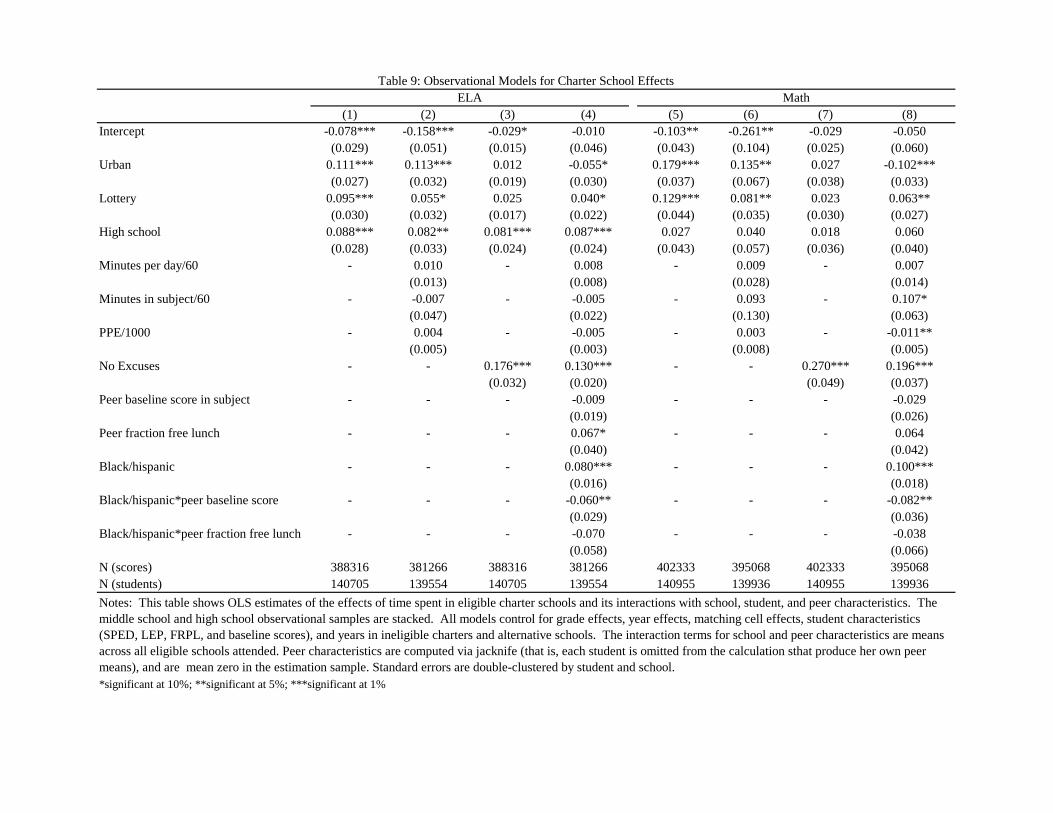
(1) (2) (3) (4) (5) (6) (7) (8)
Intercept -0.078*** -0.158*** -0.029* -0.010 -0.103** -0.261** -0.029 -0.050
(0.029) (0.051) (0.015) (0.046) (0.043) (0.104) (0.025) (0.060)
Urban 0.111*** 0.113*** 0.012 -0.055* 0.179*** 0.135** 0.027 -0.102***
(0.027) (0.032) (0.019) (0.030) (0.037) (0.067) (0.038) (0.033)
Lottery 0.095*** 0.055* 0.025 0.040* 0.129*** 0.081** 0.023 0.063**
(0.030) (0.032) (0.017) (0.022) (0.044) (0.035) (0.030) (0.027)
High school 0.088*** 0.082** 0.081*** 0.087*** 0.027 0.040 0.018 0.060
(0.028) (0.033) (0.024) (0.024) (0.043) (0.057) (0.036) (0.040)
Minutes per day/60 - 0.010 - 0.008 - 0.009 - 0.007
(0.013) (0.008) (0.028) (0.014)
Minutes in subject/60 - -0.007 - -0.005 - 0.093 - 0.107*
(0.047) (0.022) (0.130) (0.063)
PPE/1000 - 0.004 - -0.005 - 0.003 - -0.011**
(0.005) (0.003) (0.008) (0.005)
No Excuses - - 0.176*** 0.130*** - - 0.270*** 0.196***
(0.032) (0.020) (0.049) (0.037)
Peer baseline score in subject - - - -0.009 - - - -0.029
(0.019) (0.026)
Peer fraction free lunch - - - 0.067* - - - 0.064
(0.040) (0.042)
Black/hispanic - - - 0.080*** - - - 0.100***
(0.016) (0.018)
Black/hispanic*peer baseline score - - - -0.060** - - - -0.082**
(0.029) (0.036)
Black/hispanic*peer fraction free lunch - - - -0.070 - - - -0.038
(0.058) (0.066)
N (scores) 388316 381266 388316 381266 402333 395068 402333 395068
N (students) 140705 139554 140705 139554 140955 139936 140955 139936
*significant at 10%; **significant at 5%; ***significant at 1%
Table 9: Observational Models for Charter School Effects
ELA Math
Notes: This table shows OLS estimates of the effects of time spent in eligible charter schools and its interactions with school, student, and peer characteristics. The
middle school and high school observational samples are stacked. All models control for grade effects, year effects, matching cell effects, student characteristics
(SPED, LEP, FRPL, and baseline scores), and years in ineligible charters and alternative schools. The interaction terms for school and peer characteristics are means
across all eligible schools attended. Peer characteristics are computed via jacknife (that is, each student is omitted from the calculation sthat produce her own peer
means), and are mean zero in the estimation sample. Standard errors are double-clustered by student and school.

Mean 2SLS Mean 2SLS
School level Outcome (1) (2) (3) (4)
Middle Total days suspended 0.537 0.710*** 0.080 -0.016
(0.080) (0.040)
N 5123 2641
0.073 0.172*** 0.020 -0.002
(0.034) (0.016)
N 5123 2641
0.464 0.538*** 0.060 -0.014
(0.067) (0.032)
N 5123 2641
Days truant 0.594 0.128 0.235 -0.111
(0.208) (0.214)
N 5123 2641
Total days attended 173 7.28*** 171 5.52***
(1.19) (1.59)
N 5175 2605
High Total days suspended 0.465 1.27*** 0.126 -0.100
(0.194) (0.080)
N 3582 533
0.086 0.277*** 0.036 -0.024
(0.076) (0.023)
N 3582 533
0.379 0.993*** 0.090 -0.075
(0.162) (0.073)
N 3582 533
Days truant 5.69 -11.5 0.305 -0.370
(7.58) (1.36)
N 3582 533
Total days attended 163 15.9*** 168 9.41*
(4.22) (5.47)
N 3647 530
Notes: This table reports 2SLS estimates of the effects of charter school attendance on disciplinary outcomes and attendance in
the year after the lottery. Standard errors are clustered by school-grade-year.
*significant at 10%; **significant at 5%; ***significant at 1%
Urban Non-urban
Table 10: Effects on Discipline and Attendance
Days of in-school
suspension
Days of out-of-school
suspension
Days of in-school
suspension
Days of out-of-school
suspension

First stage 2SLS
Variable name (1) Variable name (2) Subject (3) (4)
Average minutes per day 455 Female 0.520
Have Saturday school Yes Black 0.137 ELA 2.49*** -0.058**
Avg. math instruction (min) 90 Hispanic 0.025 (0.243) (0.026)
Avg. reading instruction (min) 90 Special education 0.143
Parent contract Yes Subsidized lunch 0.119 Math 2.47*** -0.097***
Student contract Yes Limited English proficiency 0.009 (0.244) (0.032)
Uniforms Yes N 871 N 1243 1244
Reward system Yes
Fraction of teachers leaving voluntarily 0.131 ELA 0.519*** 0.199
Fraction of teachers leaving involuntarily 0.000 (0.112) (0.219)
Teachers licensed to teach assignment 0.803
Proportion of teachers 32 and younger 0.440 Math 0.520*** 0.254
Proportion of teachers 49 and older 0.240 (0.113) (0.262)
N 258 257
Practices and teacher characteristics Student characteristics Lottery Estimates
Notes: This table reports survey results, teacher characteristics, descriptive statistics, and lottery-based 2SLS estimates for NCHS. Column (1) shows
selected survey responses and teacher characteristics. Column (2) shows descriptive statistics for all students attending NCHS in 4th grade between 2002
and 2011. Columns (3) and (4) show 2SLS estimates of the effects of NCHS attendance on test scores, instrumenting for years at NCHS with a lottery
offer dummy. The 2SLS models control for year effects, grade effects, and risk set effects. Standard errors are clustered at the student level. The
kindergarten lottery estimates use scores in grades 3-6, while the expansion lottery estimates use scores in grades 5-8 and 10.
Table 11: Practices and Effects at NCHS
Kindergarten Lotteries
Expansion Lotteries
Data Appendix
The data used for this study come from charter school lottery records, student demographic and
school attendance information in the Massachusetts Student Information Management System
(SIMS), and test scores from the Massachusetts Comprehensive Assessment System (MCAS)
database. This appendix describes each data source and details the procedures used to clean
and match them. The steps used here are an updated version of the methods described in the
data appendix to Angrist et al. (2010).
A Data Sets
A.1 Charter School Entrance Lotteries
Data description and sample restrictions
Our sample of applicants is obtained from records of lotteries held at 20 Massachusetts charter
schools between 2002 and 2010. The participating schools and lottery years are listed in Table
A1, along with schools eligible for the lottery study that did not contribute records. A total
of 100 school-specific entry cohorts are included in the analysis. Lotteries at three schools
contribute observations to both the middle and high school samples.
The raw lottery records typically include applicants’ names, dates of birth, contact infor-
mation, and other information used to define lottery groups, such as sibling and out-of-area
status. The first five rows in each panel of Table A6 show the sample restrictions we impose
on the raw lottery records, separately by lottery cohort and school level. We exclude duplicate
applicants and applicants listed as applying to the wrong entry grade. We also drop late appli-
cants, out-of-area applicants, and sibling applicants, as these groups are typically not included
in the standard lottery process. Imposing these restrictions reduces the number of middle school
lottery records from 13,038 to 11,220 and reduces the number of high school records from 9,506
to 9,009.
Lottery offers
In addition to the data described above, the lottery records also include information regarding
offered seats. We used this information to reconstruct indicator variables for whether lottery
participants received randomized offers. For most schools and years, we code the offer variable
as one for applicants who received offered seats at any time after the lottery, including offers
to waitlisted students. This definition corresponds to the ”ever offer” instrument used by Ab-
dulkadiroglu et al. (2011). For a few schools, information on waitlist offers was unavailable, but
records were sufficient to determine the students who received offers on the day of the lottery.
The offer variables for these schools are coded as one for the initially offered students and zero
35

otherwise. The instrument Zi used in our analyses is one for any student who received an offer
from any school included in our lottery sample. Offer rates were 67 percent and 64 percent in
our middle and high school samples, respectively.
A.2 Student Information Management System Data
Data description
Our study uses SIMS data from the 2001-2002 school year through the 2010-2011 school year.
Each year of data includes an October file and an end-of-year file. The SIMS records information
on demographics and schools attended for all students in Massachusetts’ public schools. An
observation in the SIMS refers to a student in a school in a year, though there are some student-
school-year duplicates for students that switch grades or programs within a school and year.
Coding of demographics and attendance
The SIMS variables used in our analysis include grade, year, name, town of residence, date of
birth, sex, race, special education and limited English proficiency status, free or reduced price
lunch, and school attended. We constructed a wide-format data set that captures demographic
and attendance information for every student in each year in which he or she is present in
Massachusetts’ public schools. This file uses information from the longest-attended school in
the first calendar year spent in each grade. Attendance ties were broken at random; this affects
only 0.007 percent of records. Students classified as SPED, LEP, or free/reduced price lunch in
any record within a school-year-grade retain that designation for the entire school-year-grade.
We measure charter school attendance in calendar years. A student is coded as attending a
charter school in a particular year when there is any SIMS record reporting charter attendance
in that year. Students who attend more than one charter school within a year are assigned to
the charter they attended longest.
A.3 Massachusetts Comprehensive Assessment System Data
Data description and sample restrictions
We use MCAS data from the 2001-2002 school year through the 2010-2011 school year. Each
observation in the MCAS database corresponds to a student’s test results in a particular grade
and year. We use math and English Language Arts (ELA) tests in grades 3 through 8 and
10, as well as Writing Topic and Writing Composition scores in grades 4, 7, and 10. The test
score variables are standardized to have mean zero and standard deviation one within a subject-
grade-year in Massachusetts. Repetitions of the same test subject and grade are dropped. In
cases with multiple records within a year and grade, ties are broken at random; this affected
0.10 percent of MCAS records.
36

In the lottery-based middle school analysis, all post-lottery test scores through 8th grade are
used as outcomes. High school outcomes are from 10th grade. The most recent pre-lottery score
in a subject defines a student’s baseline score. For the observational analysis, outcome grades
are 5th through 8th for middle school 10th for high school; baseline scores are from 4th grade
for middle school and 7th or 8th grade for high school.
B Matching Data Sets
B.1 Match from the MCAS to the SIMS
The processed SIMS and MCAS files were merged by grade, year, and a state student identifier
known as the SASID. Scores that could not be matched to the SIMS were dropped. This
restricted eliminated 0.7 percent of MCAS scores statewide.
B.2 Match from the Lottery Records to the State Database
Match procedure
Lottery records were matched to the state SIMS/MCAS database by name, application year,
and application grade. In some cases, this procedure did not produce a unique match. We
accepted some matches based on fewer criteria where the information on grade, year, and town
of residence seemed to make sense.
Match success rate
Our matching procedure successfully located most applicants in the SIMS database. Table A7
reports cohort-specific match rates from the lottery records to the combined SIMS/MCAS file,
separately for middle and high school. The overall match rates for middle and high school were
92.1 percent and 93.7 percent, respectively. Table A7 also reports separate match rates for
offered and non-offered students. In middle school, offered students were slightly more likely
to be matched (94.0 percent compared to 89.4 percent). Offered and non-offered applicants to
charter high schools were matched to the SIMS at almost similar rates (94.0 percent compared
to 93.3 percent).
C Construction of the Outcome Data Sets
C.1 Lottery Sample
Further sample restrictions
Once matched to the SIMS, each student is associated with a unique SASID; at this point,
we can therefore determine which students applied to multiple schools in our lottery sample.
37
Following the match, we reshape the lottery data set to contain a single record for each student.
If students applied in more than one year to lotteries at a particular school level (middle or
high), we keep only the records associated with their first year of application. In our basic
lottery analyses, we also exclude students without baseline demographics in the SIMS; in effect,
this rule limits the sample to students in Massachusetts’ public schools at baseline. Rows 6-9 in
each panel of Table A6 report the impact of these restrictions on sample sizes for middle and
high school. The set of matched first-time applicants with baseline demographics includes 7,530
middle school students and 5,260 high school students.
Final set of outcomes and students
To generate the middle school analysis file, the matched lottery/SIMS/MCAS file is reshaped
to long format, with each observation referring to a test score outcome for a student in a
particular year. The high school analysis file uses only 10th grade outcomes, so it includes a
single observation for each student. Table A8 summarizes the analysis files for middle and high
school. Columns (1) and (2) list the application and outcome grades for each cohort, and column
(3) lists the number of applicants satisfying the sample restrictions from Table A5. In middle
school, 7,307 of 7,530 students contribute at least one test score to the analysis. In high school,
4,025 of 5,260 students have at least one score. Middle school applicants contribute different
numbers of scores to the analysis depending on their years and grades of application; math
and ELA tests were not given in every middle school grade until 2006, and some cohorts are
not observed through 8th grade. Table A9 lists the grades and years in which math and ELA
subjects were administered. As shown in columns (5) through (8) of Table A8, we find 16,543
out of 18,798 expected scores for middle school math, 16,285 of 18,515 for middle school ELA,
4,047 of 5,260 for high school math, and 4,100 of 5,260 for high school ELA. These outcomes
are used to produce the 2SLS estimates reported in Tables 5 through 8.
C.2 Observational Sample
To produce the analysis file used for the observational analysis, we begin with the matched
SIMS/MCAS state database. As described in Section V, we define cells based on baseline
school, baseline year, race, and sex, separately for middle school and high school. We then
count the number of students in each cell who go on to spend time in eligible charter schools
and regular public schools in the relevant range of grades (5th through 8th for middle school
and 10th for high school). Observations in cells that do not include at least one student who
attends eligible charter schools and one student who attends regular public schools are dropped.
We then produce a long format data file containing the full set of test score outcomes for the
remaining sample of matched students at the relevant school level, as well as variables counting
years of attendance at each eligible charter school. This file is used to produce the observational
38

estimates. Our matching procedure excludes 23 percent of students who attend eligible charter
schools in middle or high school.
D Sample for NCHS
Our case study of NCHS uses lottery data from kingergarten entrance lotteries held between 2004
and 2007, as well as 5th, 7th, and 10th grade lotteries held in 2005 and 2010. To construct the
analytic sample, we follow the same data assembly and matching procedures described above.
The processing and construction of lottery data for NCHS is detailed in tables A12 through
A14. The lottery records include 977 records that meet our sample restrictions. Table A13
shows that we find matches for 92.8 percent of these applicants in the SIMS (95.6 percent for
offered students, 90.8 percent for non-offered students). After eliminating unmatched students
and repeat applicants, we are left with 902 randomized applicants (see the last row of Table
A12). As reported in Table A14, our analytic sample includes scores for 778 of these students.
We find 1501 out of 1641 expected scores in both math and ELA.
39

School Town Urban Grades
Eligible
middle
Eligible
high Years in lottery study
(1) (2) (3) (4) (5) (6) (7)
Academy of the Pacific Rim Charter School Boston Yes 5-12 Yes 2005-2010
Advanced Math and Science Academy Charter School Marlborough 6-12 Yes
Barnstable Horace Mann Charter School Marstons Mills 4-5 Yes
Berkshire Arts and Technology Charter Public School Adams 6-12 Yes
Boston Collegiate Charter School Boston Yes 5-12 Yes Yes 2002-2010
Boston Preparatory Charter Public School Boston Yes 6-11 Yes 2005-2010
Cape Cod Lighthouse Charter School Orleans 6-8 Yes 2007-2010
Christa McAuliffe Regional Charter Public School Framingham Yes 6-8 Yes
City on a Hill Charter Public School Boston Yes 9-12 Yes 2002, 2004-2009
Codman Academy Charter Public School Boston Yes 9-12 Yes 2004, 2008-2009
Community Charter School of Cambridge Cambridge Yes 7-12 Yes
Dorchester Collegiate Academy Charter School Boston Yes 4-5 Yes
Edward Brooke Charter School Boston Yes K-8 Yes 2006-2009
Excel Academy Charter School Boston Yes 5-8 Yes 2008-2010
Four Rivers Charter Public School Greenfield 7-12 Yes Yes 2003-2010
Francis W Parker Charter Essential School Devins 7-12 Yes 2006-2010
Global Learning Charter Public School New Bedford Yes 5-12 Yes 2006-2007, 2009
Hampden Charter School of Science Chicopee Yes 6-10 Yes
Health Careers Academy Charter School Boston Yes 9-12 Yes
Innovation Academy Charter School Tyngsboro 5-11 Yes 2007-2010
KIPP Academy Lynn Lynn Yes 5-8 Yes 2005-2009
Marblehead Community Charter Public School Marblehead 4-8 Yes 2005-2007, 2010
MATCH Charter Public School Boston Yes 6-12 Yes Yes 2002-2010
New Leadership Charter School Springfield Yes 6-12 Yes
North Central Charter Essential School Fitchburg Yes 7-12 Yes
Phoenix Charter Academy Chelsea Yes 9-12 Yes
Pioneer Charter School of Science Everett Yes 7-11 Yes
Pioneer Valley Performing Arts Charter Public School South Hadley 7-12 Yes 2006-2010
Rising Tide Charter Public School Plymouth 5-8 Yes 2009
Roxbury Preparatory Charter School Boston Yes 6-8 Yes 2002-2010
Salem Academy Charter School Salem 6-12 Yes 2010
Smith Leadership Academy Boston Yes 6-8 Yes
Sturgis Charter Public School Hyannis 9-12 Yes 2004, 2006, 2008-2009
Table A1: Massachusetts Charter Schools Eligible for the Lottery Study
Notes: This table lists all charter schools in Massachusetts eligible for the lottery study. To be counted as eligible, a school must be open in the relevant years and meet the entry grade and
student population restrictions required for inclusion in column (3) of Table 1.

All lotteries
Lotteries with
baseline scores All lotteries
Lotteries with
baseline scores
(1) (2) (3) (4)
0.020** 0.023** 0.007 0.000
(0.010) (0.010) (0.015) (0.015)
-0.005 -0.011 0.001 0.010
(0.011) (0.011) (0.016) (0.017)
-0.006 -0.005 -0.002 -0.004
(0.009) (0.010) (0.010) (0.010)
0.003 0.003 -0.001 -0.002
(0.004) (0.004) (0.006) (0.006)
0.009 0.010 0.007 0.010
(0.014) (0.014) (0.018) (0.018)
0.005 0.007 0.029* 0.023
(0.011) (0.012) (0.015) (0.016)
-0.003 -0.004 0.004 -0.002
(0.011) (0.011) (0.014) (0.014)
0.000 0.001 0.009 0.009
(0.007) (0.008) (0.006) (0.006)
- -0.006 - -0.041
(0.027) (0.032)
- -0.015 - -0.012
(0.026) (0.034)
p-value, from F-test 0.367 0.452 0.595 0.741
N 7530 7060 5261 4671
* significant at 10%; ** significant at 5%; *** significant at 1%
White
Table A2: Covariate Balance
Middle school High school
Hispanic
Black
Baseline Math Score
Notes: This table reports coefficients from regressions of the variable in each row on an indicator variable equal to one if
the student won the lottery. Regressions include risk set dummies and baseline grade dummies and exclude students with
sibling priority and late applicants. Samples in columns (1) and (3) are restricted to students from cohorts where we
should observe at least one test score. Samples in columns (2) and (4) are restricted to students who also have baseline
test scores. F-tests are for the null hypothesis that the coefficients on winning the lottery in all regressions are all equal to
zero. These test statistics are calculated for the subsample that has non-missing values for all variables tested.
Asian
Female
Subsidized Lunch
Special Education
Limited English Proficiency
Baseline ELA Score

Proportion of non-
offered with MCAS Differential
School level Subject (1) (2)
Middle ELA 0.903 0.024***
(0.007)
N 2933 7530
Math 0.907 0.019***
(0.007)
N 2933 7530
High ELA 0.766 0.004
(0.015)
N 1829 5261
Math 0.753 0.009
(0.015)
N 1829 5261
* significant at 10%; ** significant at 5%; *** significant at 1%
Table A3: Attrition
Notes: This table reports coefficients from regressions of an indicator variable equal to one if a
student has a followup test score on an indicator variable equal to one if the student won the
lottery. Column (1) shows the fraction of non-offered students with followup scores, while
column (2) shows the differential by offer status. Regressions include risk set dummies as well
as demographic variables, year of birth dummies, year of baseline dummies, and baseline grade
dummies. The sample is restricted to students who participated in an effective lottery from
cohorts where we should observe follow-up scores.

Lottery estimate Lottery sample
Non-lottery
sample Lottery estimate Lottery sample
Non-lottery
sample
School level Subject (1) (2) (3) (4) (5) (6)
Middle ELA 0.146*** 0.158*** -0.035*** -0.144*** -0.009 -0.013
(0.028) (0.010) (0.012) (0.039) (0.007) (0.011)
N 11649 4636
Math 0.321*** 0.249*** -0.024* -0.123*** -0.015** -0.008
(0.031) (0.013) (0.014) (0.047) (0.007) (0.012)
N 11941 4602
High ELA 0.280*** 0.261*** 0.103*** -0.048 0.068*** -
(0.071) (0.020) (0.018) (0.059) (0.015)
N 3565 536 14357
Math 0.360*** 0.304*** -0.011 -0.023 0.043** -
(0.083) (0.036) (0.018) (0.071) (0.018)
N 3517 531 14274
*significant at 10%; **significant at 5%; ***significant at 1%
Table A4: Comparison of Lottery and Observational Estimates for Eligible Charters
Urban Non-urban
Notes: This table reports estimates of the effects of years in charter schools on test scores. Eligible charters are schools with entry grades 4-7 (middle) or 9 (high), and
that meet the other restrictions from Table 1. The sample is produced by matching charter students to students in traditional public schools on cells defined by sending
school, baseline year, and baseline demographics (race, sex, limited English proficiency, special education status, and free lunch status). All models control for cell fixed
effects, year effects, grade effects, and baseline test scores. Middle school regressions pool outcomes from 5th through 8th grade and cluster by student identifier as well
Observational estimates Observational estimates
131136
136046
7940
7753
248711
239288

(1) (2) (3) (4) (5) (6) (7) (8)
Intercept 0.035 -0.123 0.027 -0.060 0.071** -0.295* 0.059** -0.072
(0.024) (0.085) (0.023) (0.119) (0.029) (0.159) (0.028) (0.220)
Urban 0.082*** 0.049 -0.009 0.044 0.191*** 0.067 0.060 0.028
(0.022) (0.032) (0.029) (0.062) (0.029) (0.044) (0.038) (0.091)
High school 0.061 0.016 0.044 -0.029 -0.019 -0.061 -0.044 -0.048
(0.046) (0.049) (0.045) (0.054) (0.054) (0.060) (0.053) (0.064)
Minutes per day/60 - -0.021* - -0.024* - -0.030 - -0.054*
(0.013) (0.013) (0.024) (0.029)
Minutes in subject/60 - 0.006 - 0.001 - 0.130 - 0.267**
(0.027) (0.028) (0.092) (0.104)
PPE/1000 - 0.026*** - 0.017* - 0.039*** - 0.011
(0.009) (0.010) (0.013) (0.015)
No Excuses - 0.127*** 0.075** - 0.183*** 0.113***
(0.028) (0.032) (0.035) (0.032)
Peer baseline score in subject - - - -0.155 - - - -0.158
(0.148) (0.157)
Peer fraction free lunch - - - -0.099 - - - -0.137
(0.211) (0.209)
Black/hispanic - - - 0.057 - - - 0.071
(0.043) (0.043)
Black/hispanic*peer baseline score - - - 0.233 - - - -0.009
(0.170) (0.177)
Black/hispanic*peer fraction free lunch - - - 0.568** - - - 0.290
(0.288) (0.267)
N (scores) 17845 17221 17845 17221 17955 17324 17955 17324
N (students) 9305 9005 9305 9005 9273 8974 9273 8974
*significant at 10%; **significant at 5%; ***significant at 1%
Table A5: Lottery Models for Charter School Treatment Effects
ELA Math
Notes: This table reports 2SLS estimates of the effects of years of attendance at eligible charter schools and its interactions with school, student, and peer characteristics. The
instruments are interactions of each characteristic with the offer dummy. For school characteristics, the attributes of the schools a student applied to are used to construct the
instruments. Peer characteristics are baseline characteristics of students in the risk set, and are computed via jacknife (that is, each student is omitted from the calculation that
produces her own peer mean). Peer variables are mean zero in the estimation sample. The middle school and high school observational samples are stacked. All models control for
grade effects, year effects, risk set effects, student characteristics. Main effects of school characteristics are not included in the regressions, while main effects for student and peer
characteristics are included. Standard errors are double-clustered by student and school-year-grade.

2002-2003 2003-2004 2004-2005 2005-2006 2006-2007 2007-2008 2008-2009 2009-2010 2010-2011 All lotteries
(1) (2) (3) (4) (5) (6) (7) (8) (9) (10)
Total number of entry grade records 313 394 391 990 1578 2124 2132 2877 2239 13038
Excluding disqualified applicants 313 394 391 990 1577 2106 2115 2873 2225 12984
Excluding late applicants 313 391 390 972 1551 2046 2054 2829 2222 12768
Excluding applicants from outside of area 313 387 388 963 1540 2028 2041 2741 2202 12603
Excluding siblings 295 358 343 890 1378 1787 1801 2395 1973 11220
Excluding records not matched to the SIMS 267 311 305 838 1311 1710 1669 2095 1825 10331
Reshaping to one record per student 267 311 304 741 1115 1505 1424 1757 1568 8992
Excluding repeat applications 267 308 302 728 1093 1470 1360 1705 1497 8730
In Massachusetts public schools at baseline 201 228 223 603 924 1291 1195 1578 1287 7530
Excluding students without a test score 187 208 210 569 883 1219 1129 1475 1080 6960
Total number of entry grade records 775 717 1313 1219 1148 1411 1392 1531 - 9506
Excluding disqualified applicants 775 717 1309 1218 1146 1408 1391 1520 - 9484
Excluding late applicants 765 710 1280 1215 1138 1408 1372 1517 - 9405
Excluding applicants from outside of area 765 706 1278 1206 1134 1403 1372 1504 - 9368
Excluding siblings 732 677 1218 1165 1120 1362 1334 1401 - 9009
Excluding students not matched to the SIMS 645 614 1121 1074 1091 1306 1255 1321 - 8427
Reshaping to one record per student 573 614 895 852 834 936 863 937 - 6504
Excluding repeat applications 573 612 891 846 812 919 830 895 - 6378
In Massachusetts public schools at baseline 406 462 732 690 692 821 715 742 - 5260
Excluding students without a test score 328 358 583 519 567 659 574 537 - 4125
Table A6: Sample Restrictions for the Lottery Analysis
Lottery cohort
Panel A. Middle School
Panel B. High School
Notes: This table summarizes the sample restrictions imposed for the lottery analysis. Disqualified applications are defined as duplicate records and applications to the wrong grade.
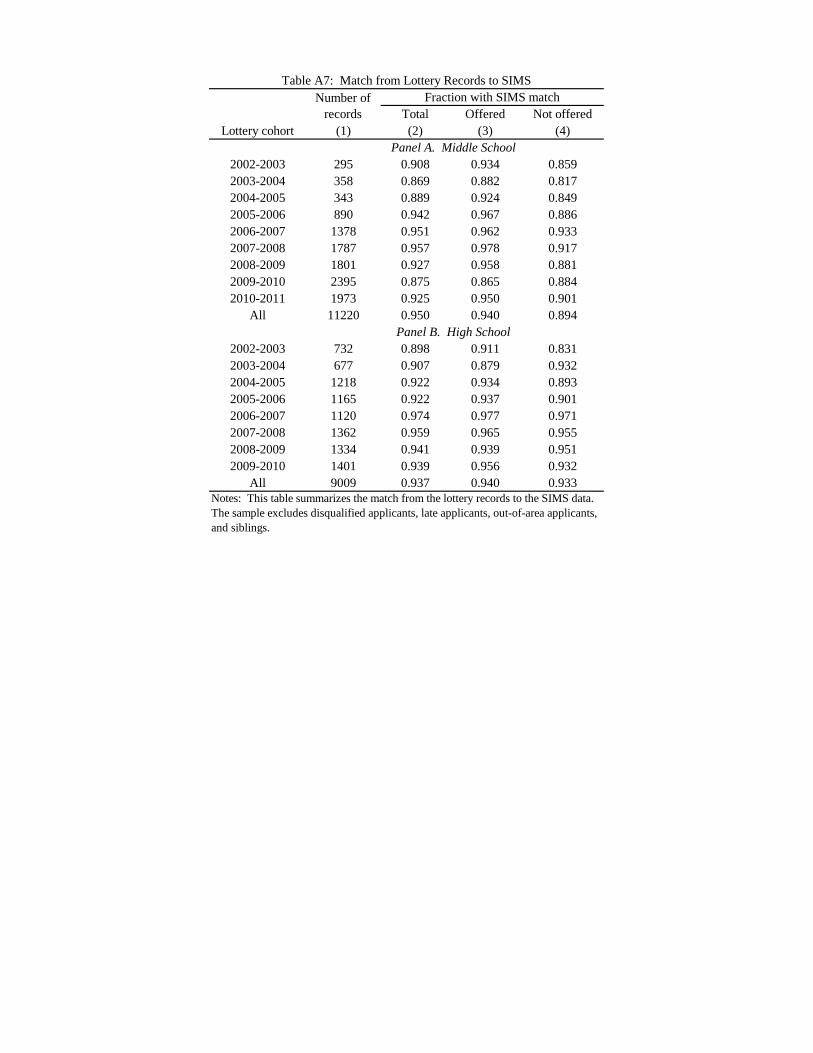
Total Offered Not offered
Lottery cohort (1) (2) (3) (4)
2002-2003 295 0.908 0.934 0.859
2003-2004 358 0.869 0.882 0.817
2004-2005 343 0.889 0.924 0.849
2005-2006 890 0.942 0.967 0.886
2006-2007 1378 0.951 0.962 0.933
2007-2008 1787 0.957 0.978 0.917
2008-2009 1801 0.927 0.958 0.881
2009-2010 2395 0.875 0.865 0.884
2010-2011 1973 0.925 0.950 0.901
All 11220 0.950 0.940 0.894
2002-2003 732 0.898 0.911 0.831
2003-2004 677 0.907 0.879 0.932
2004-2005 1218 0.922 0.934 0.893
2005-2006 1165 0.922 0.937 0.901
2006-2007 1120 0.974 0.977 0.971
2007-2008 1362 0.959 0.965 0.955
2008-2009 1334 0.941 0.939 0.951
2009-2010 1401 0.939 0.956 0.932
All 9009 0.937 0.940 0.933
Notes: This table summarizes the match from the lottery records to the SIMS data.
The sample excludes disqualified applicants, late applicants, out-of-area applicants,
and siblings.
Table A7: Match from Lottery Records to SIMS
Number of
records
Fraction with SIMS match
Panel A. Middle School
Panel B. High School

Application
grades
Outcome
grades
Number of
applicants
Number with a
test score
Number of math
scores expected
Number of ELA
scores expected
Number of math
scores observed
Number of ELA
scores observed
Lottery cohort (1) (2) (3) (4) (5) (6) (7) (8)
2002-2003 5-6 6-8 201 187 402 290 351 253
2003-2004 5-7 6-8 228 208 510 418 433 356
2004-2005 5-7 6-8 223 210 619 547 542 472
2005-2006 4-7 4-8 603 569 2115 2115 1894 1894
2006-2007 4-7 4-8 924 883 3037 3037 2693 2700
2007-2008 4-7 4-8 1291 1219 4287 4280 3724 3701
2008-2009 5-7 5-8 1195 1129 3385 3385 2950 2956
2009-2010 5-7 5-8 1578 1475 3156 3156 2856 2850
2010-2011 4-7 4-8 1287 1427 1287 1287 1100 1103
All 4-7 4-8 7530 7307 18798 18515 16543 16285
2002-2003 5,9 10 406 328 406 406 327 328
2003-2004 5,7,9 10 462 258 462 462 352 356
2004-2005 7,9 10 732 583 732 732 569 579
2005-2006 7,9 10 690 519 690 690 507 514
2006-2007 9 10 692 567 692 692 561 562
2007-2008 9 10 821 659 821 821 637 657
2008-2009 9 10 715 574 715 715 564 570
2009-2010 9 10 742 537 742 742 530 534
All 5,7,9 10 5260 4025 5260 5260 4047 4100
Table A8: Outcome Data for the Lottery Analysis
Panel A. Middle School
Panel B. High School
Notes: This table summarizes observed test score outcomes for charter school lottery applicants. The sample is restricted to randomized applicants matched to
baseline SIMS demographics. Expected test scores are post-lottery scores in grades 4-8 for middle school and grade 10 for high school that would be taken in Spring
2010 or earlier given normal academic progress after the lottery. Table A1 lists the schools participating in each cohort and their entry grades. Table A7 lists the
availability of math and ELA tests by year.

4th grade 5th grade 6th grade 7th grade 8th grade 10th grade
Subject School year (1) (2) (3) (4) (5) (6)
ELA 2001-2002 Yes Yes Yes
2002-2003 Yes Yes Yes
2003-2004 Yes Yes Yes
2004-2005 Yes Yes Yes
2005-2006 through 2010-2011 Yes Yes Yes Yes Yes Yes
Math 2001-2002 Yes Yes Yes Yes
2002-2003 Yes Yes Yes Yes
2003-2004 Yes Yes Yes Yes
2004-2005 Yes Yes Yes Yes
2005-2006 through 2010-2011 Yes Yes Yes Yes Yes Yes
Table A9: Availability of MCAS ELA and Math Tests by Year
Notes: This table reports the years and grades in which MCAS ELA and math tests were administered between 2002 and 2011.

Offer coefficient
(1)
White -0.050
(0.033)
Asian 0.019
(0.021)
Black 0.017
(0.024)
Female -0.063
(0.039)
Free/reduced price lunch 0.041
(0.026)
Special Education 0.004
(0.024)
Limited English Proficiency 0.005
(0.010)
p-value from F-test 0.418
N 712
* significant at 10%; ** significant at 5%; *** significant at 1%
Table A10: Covariate Balance for NCHS
Notes: This table reports coefficients from regressions of demographic
characteristic on a dummy for receiving an offer from NCHS, controlling
for risk sets (dummies for year of application*grade of
application*contemporaneous sibling applicant). F-statistics and p-
values are from tests of the hypothesis that all coefficients are equal to
zero. Demographics for middle and high school are measured in the
grade prior to the lottery; demographics for elementary school are
measured in kindergarten.

Proportion of non-
offered with MCAS Differential
Subject (1) (2)
ELA 0.875 -0.044**
(0.020)
712
Math 0.874 -0.040**
(0.020)
712
* significant at 10%; ** significant at 5%; *** significant at 1%
Table A11: Attrition for NCHS
Notes: Column (1) reports the fraction of non-offered NCHS
applicants with at least one test score. Column (2) reports
coefficients from regressions of an indicator variable equal to one
if the student has a test score on an indicator variable equal to one
if the student won the lottery. Regressions include risk set
dummies, race dummies, and sex dummies. Robust standard errors
are reported in parentheses.

2004 2005 2006 2007 2010 All lotteries
(1) (2) (3) (4) (5) (6)
Total number of records 196 312 182 256 263 1209
Excluding siblings 152 263 133 187 242 977
Excluding students not matched to the SIMS 146 247 127 176 211 907
Excluding repeat applicants 146 247 125 175 209 902
Table A12: NCHS Lottery Records
Lottery cohort
Notes: This table summarizes the raw NCHS lottery data. The top row gives the total number of records, and each successive row adds
sample restrictions. The second row eliminates students with sibling priority. The third row eliminates students who cannot be matched to
the SIMS database. The fourth row excludes the second record for student who applied to NCHS more than once.
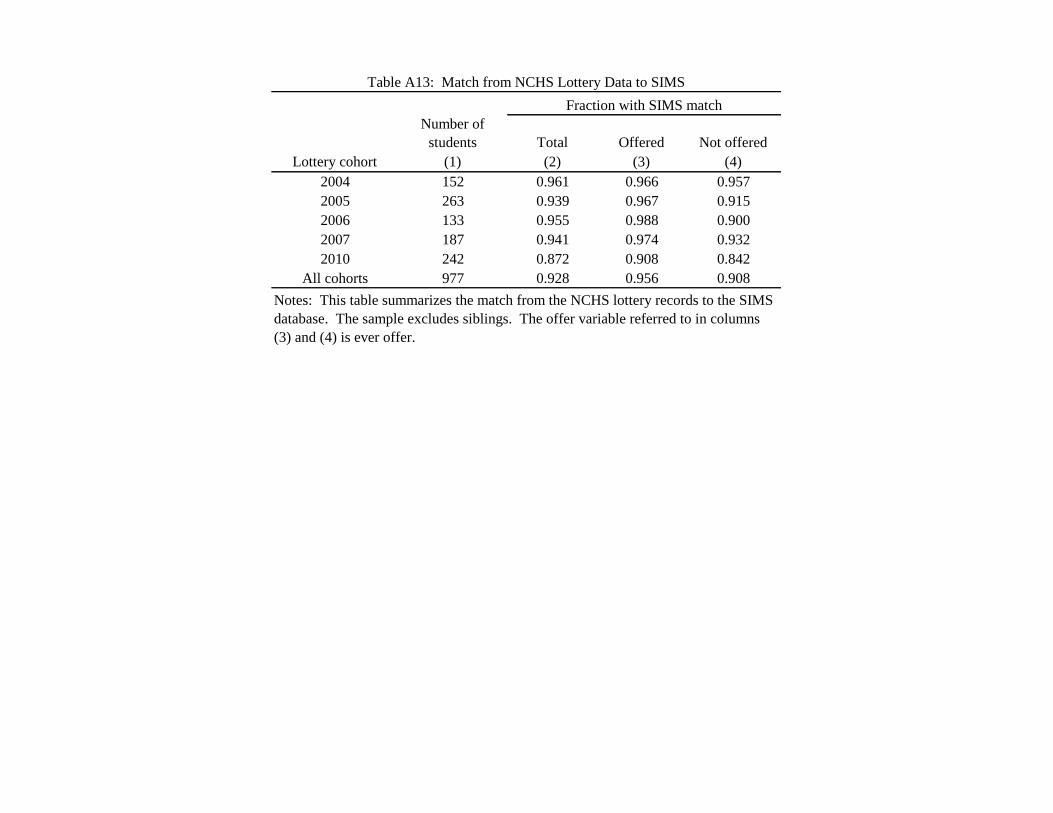
Number of
students Total Offered Not offered
Lottery cohort (1) (2) (3) (4)
2004 152 0.961 0.966 0.957
2005 263 0.939 0.967 0.915
2006 133 0.955 0.988 0.900
2007 187 0.941 0.974 0.932
2010 242 0.872 0.908 0.842
All cohorts 977 0.928 0.956 0.908
Table A13: Match from NCHS Lottery Data to SIMS
Fraction with SIMS match
Notes: This table summarizes the match from the NCHS lottery records to the SIMS
database. The sample excludes siblings. The offer variable referred to in columns
(3) and (4) is ever offer.
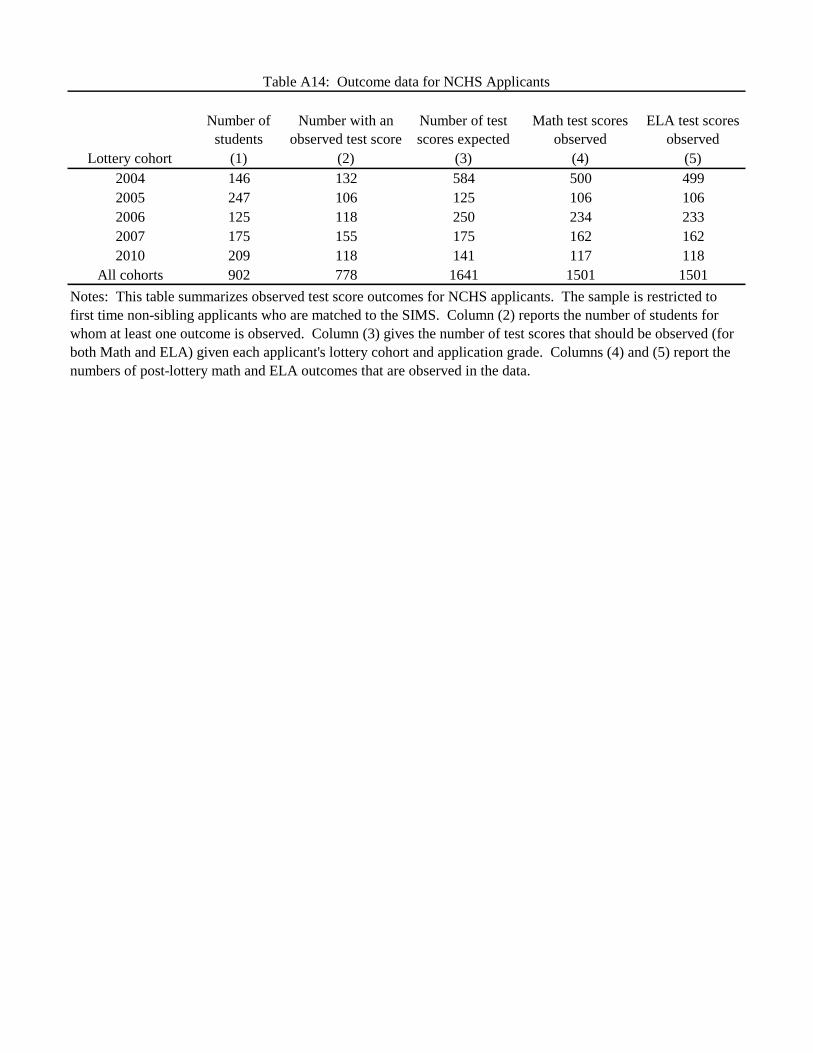
Number of
students
Number with an
observed test score
Number of test
scores expected
Math test scores
observed
ELA test scores
observed
Lottery cohort (1) (2) (3) (4) (5)
2004 146 132 584 500 499
2005 247 106 125 106 106
2006 125 118 250 234 233
2007 175 155 175 162 162
2010 209 118 141 117 118
All cohorts 902 778 1641 1501 1501
Table A14: Outcome data for NCHS Applicants
Notes: This table summarizes observed test score outcomes for NCHS applicants. The sample is restricted to
first time non-sibling applicants who are matched to the SIMS. Column (2) reports the number of students for
whom at least one outcome is observed. Column (3) gives the number of test scores that should be observed (for
both Math and ELA) given each applicant's lottery cohort and application grade. Columns (4) and (5) report the
numbers of post-lottery math and ELA outcomes that are observed in the data.

References
[1] Abadie, A. (2003). “Semiparametric instrumental variable estimation of treatment response
models.” Journal of Econometrics 113(2), 231-263.
[2] Abdulkadiroglu, A., Angrist, J., Cohodes, S., Dynarski, S., Fullerton, J., Kane, T., and
Pathak, P. (2009). “Informing the debate: Comparing Boston’s charter, pilot, and tradi-
tional schools.” Boston, MA: The Boston Foundation.
[3] Abdulkadiroglu, A., Angrist, J., Dynarski, S., Kane, T., and Pathak, P. (2011). “Account-
ability and flexibility in public schools: Evidence from Boston’s charters and pilots.” The
Quarterly Journal of Economics, forthcoming.
[4] Altonji, J., Elder, T., and Taber, C. (2005). “Selection on observed and unobserved vari-
ables: Assessing the effectiveness of Catholic schools. Journal of Political Economy 113(1),
151-184.
[5] Angrist, J., Dynarski, S., Kane, T., Pathak, P., and Walters, C. (2010a). “Inputs and
impacts in charter schools: KIPP Lynn.” American Economic Review 100(2), 239-243.
[6] Angrist, J., Dynarski, S., Kane, T., Pathak, P., and Walters, C. (2010b). “Who benefits
from KIPP?” NBER Working Paper 15740.
[7] Angrist, J., and Imbens, G. (1995). “Two-stage least squares estimation of average causal
effects in models with variable treatment intensity.” Journal of the American Statistical
Association 90(430), 431-442.
[8] Angrist, J., Pathak, P., and Walters, C. (2011). “Explaining charter school effectiveness.”
NBER Working Paper 17332.
[9] Blinder, A. (1973). “Wage discrimination: Reduced form and structural variables.” Journal
of Human Resources 8, 436-455.
[10] Candal, C. (2010). “Charter school caps and strings attached: The Achievement Gap Act
of 2010 and charter policy.” Pioneer Institute White Paper.
[11] Carter, S. (2000). “No Excuses: Lessons from 21 high-performing, high-poverty schools.”
Washington, DC: Heritage Foundation.
[12] Curto, V., and Fryer, R. (2011). “Estimating the returns to urban boarding schools: Evi-
dence from SEED.” NBER Working paper 16746.
54

[13] Dobbie, W., and Fryer, R. (2011a). “Are high-quality schools enough to close the achieve-
ment gap? Evidence from the Harlem Children’s Zone.” American Economic Journal:
Applied Economics 3(3), 158-187.
[14] Dobbie, W., and Fryer, R. (2011b). “Getting beneath the veil of effective schools: Evidence
from New York City.” NBER Working Paper 17632.
[15] Evans, W., and Schwab, R. (1995). “Finishing high school and starting college: Do Catholic
schools make a difference?” The Quarterly Journal of Economics 110(4), 941-974.
[16] Fryer, R. (2011). “Injecting successful charter school strategies into traditional public
schools: Early results from an experiment in Houston.” NBER Working Paper 17494.
[17] Gleason, P., Clark, M., Tuttle, C., and Dwoyer, E. (2010). “The evaluation of charter school
impacts: Final report.” Washington, D.C.: National Center for Education Evaluation and
Regional Assistance, Institute of Education Sciences, U.S. Department of Education (No.
NCEE 2010-4029).
[18] Grogger, J., Neal, D., Hanushek, E., and Schwab, R. (2000). “Further evidence on the effects
of Catholic secondary schooling.” Brookings-Wharton Papers on Urban Affairs, 151-201.
[19] Hanushek, E. (1997). “Assessing the effects of school resources on student performance: An
update.” Educational Evaluation and Policy Analysis 19(2), 141-164.
[20] Hoxby, C. (2004). “Achievement in charter schools and regular public schools in the United
States: Understanding the differences.” Harvard Program on Education Policy and Gover-
nance Working Paper.
[21] Hoxby, C., Murarka, S., and Kang, J. (2009). “How New York City’s charter schools affect
achievement.” Cambridge, MA: New York City Charter Schools Evaluation Project.
[22] Hoxby, C., and Rockoff, J. (2004). “The impact of charter schools on student achievement.”
Harvard Institute of Economic Research Working Paper Series.
[23] Hu, W. (2011). “Charter school battle shifts to affluent suburbs.” New York Times 16 July
2011: A1. Print.
[24] Imbens, G. and Angrist, J. (1994). “Identification and estimation of local average treatment
effects.” Econometrica 62(2), 467-475.
[25] Imberman, S. (2011). “Achievement and behavior in charter schools: Drawing a more
complete picture.” Review of Economics and Statistics 93(2), 416-435.
55

[26] Lake, R., Bowen, M., Demeritt, A., McCullough, M., Haimson, J., and Gill, B. (2012).
“Learning from charter school management organizations: Strategies for student behavior
and teacher coaching.” Center on Reinventing Public Education and Mathematica Policy
Research.
[27] Neal, D. (1997). “The effects of Catholic secondary schooling on educational achievement.”
Journal of Labor Economics 15(1), 98-123.
[28] Oaxaca, R. (1973). “Male-female wage differentials in urban labor markets.” International
Economic Review 14, 673-709.
[29] Pennington, H. (2007). “The Massachusetts Expanding Learning Time to Support Student
Success Initiative.” Mimeo, Center for American Progress.
[30] Rothstein, J. (2006). “Good principals or good peers? Parental valuation of school charac-
teristics, Tiebout equilibrium, and the incentive effects of competition among jurisdictions.”
American Economic Review 96(4), 1333-1350.
[31] Rothstein, R. (2004). Class and Schools: Using Social, Economic, and Educational Reform
to Close the Black-White Achievement Gap. Washington, DC: Economic Policy Institute.
[32] Thernstrom, A. and Thernstrom, S. (2003). No Excuses: Closing the Racial Gap in Learn-
ing. New York: Simon & Schuster.
[33] Zimmer, R., Gill, B., Booker, K., Lavertu, S., Sass, T., and Witte, J. (2009). “Charter
schools in eight states: Effects on achievement, attainment, integration and competition.”
Santa Monica, CA: RAND Corporation.
56