Embed Size (px)
Citation preview
Experts’ Meeting on Intellectual Property and Socio-Economic Development
WIPO
Geneva
December/2013
Contribution to the Country Study of Brazil IP Use in Brazil
1
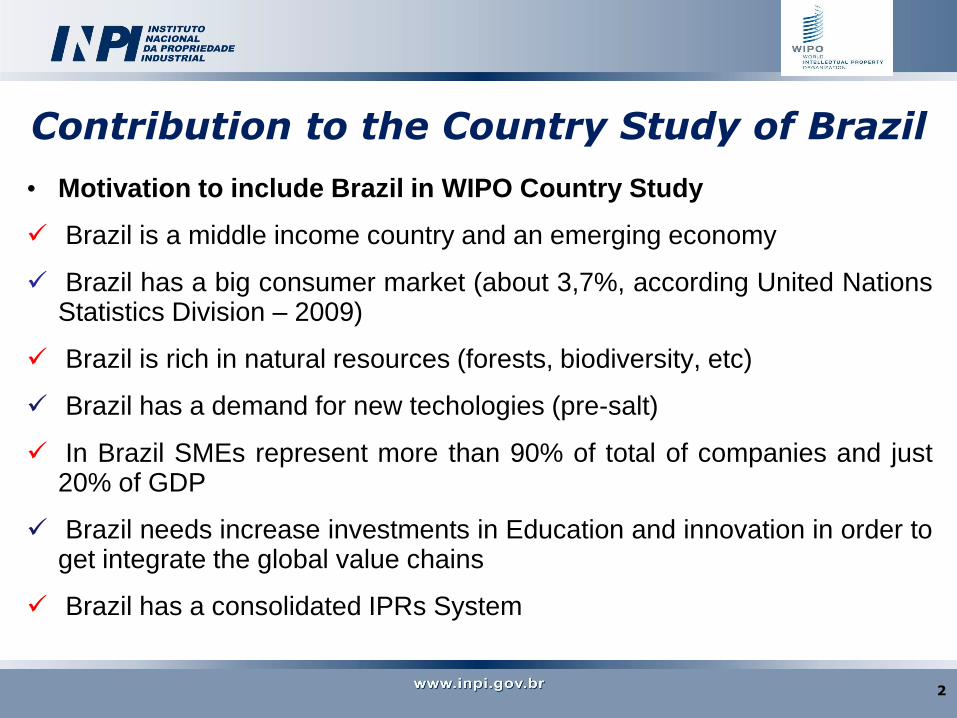
Contribution to the Country Study of Brazil
• Motivation to include Brazil in WIPO Country Study
Brazil is a middle income country and an emerging economy
Brazil has a big consumer market (about 3,7%, according United Nations Statistics Division – 2009)
Brazil is rich in natural resources (forests, biodiversity, etc)
Brazil has a demand for new techologies (pre-salt)
In Brazil SMEs represent more than 90% of total of companies and just 20% of GDP
Brazil needs increase investments in Education and innovation in order to get integrate the global value chains
Brazil has a consolidated IPRs System
2
Contribution to the country study Brazil
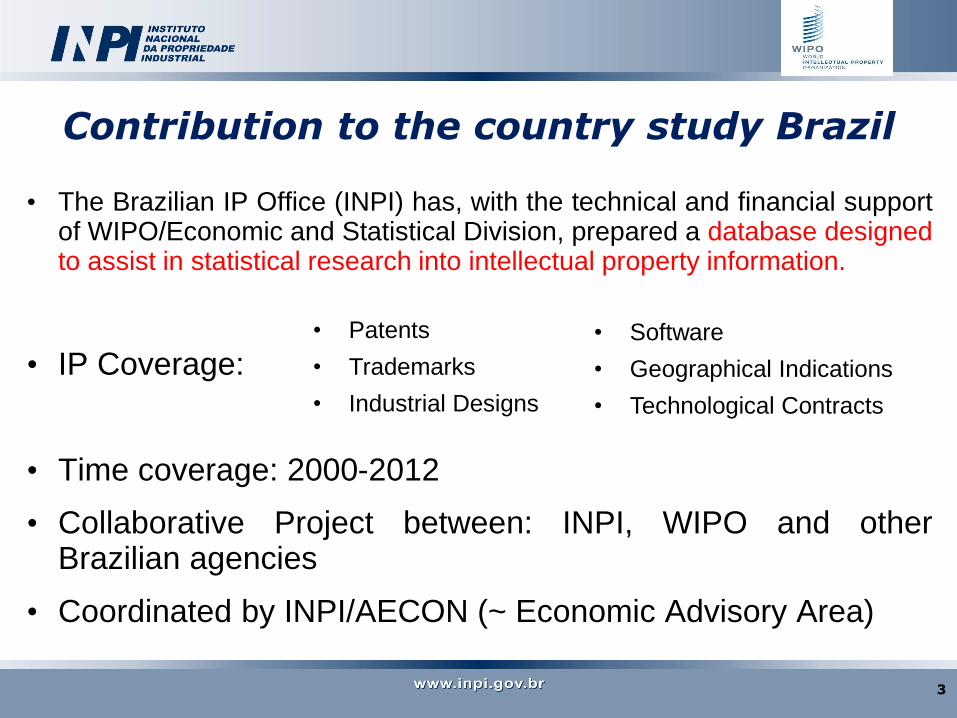
• The Brazilian IP Office (INPI) has, with the technical and financial support of WIPO/Economic and Statistical Division, prepared a database designed to assist in statistical research into intellectual property information.
• IP Coverage:
• Time coverage: 2000-2012
• Collaborative Project between: INPI, WIPO and other Brazilian agencies
• Coordinated by INPI/AECON (~ Economic Advisory Area)
• Patents
• Trademarks
• Industrial Designs
• Software
• Geographical Indications
• Technological Contracts
3
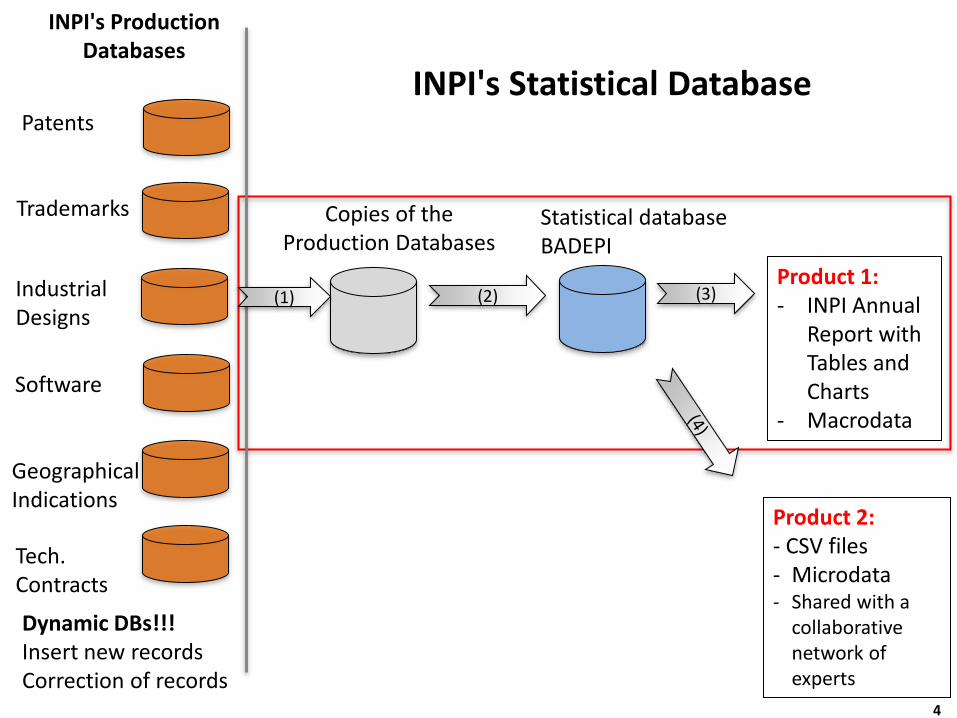
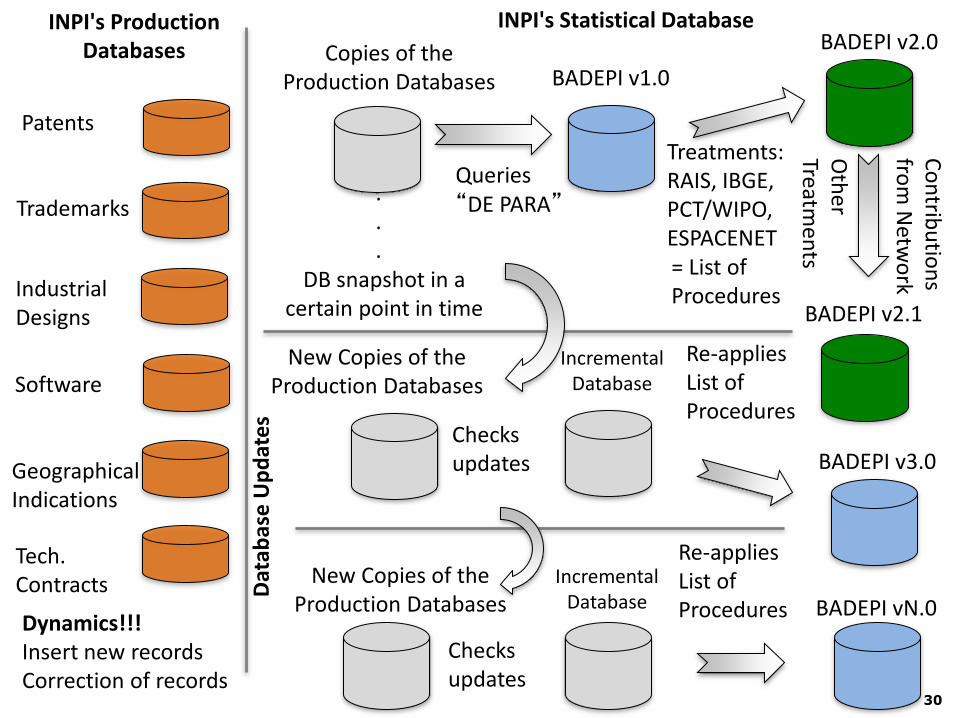
Statistical database BADEPI
(2)
INPI's Production Databases
Patents
Trademarks
Dynamic DBs!!! Insert new records Correction of records
Industrial Designs
Software
Geographical Indications
Tech. Contracts
INPI's Statistical Database
Copies of the Production Databases
Product 1: - INPI Annual
Report with Tables and Charts
- Macrodata
Product 2: - CSV files - Microdata - Shared with a
collaborative network of experts
(3) (1)
4
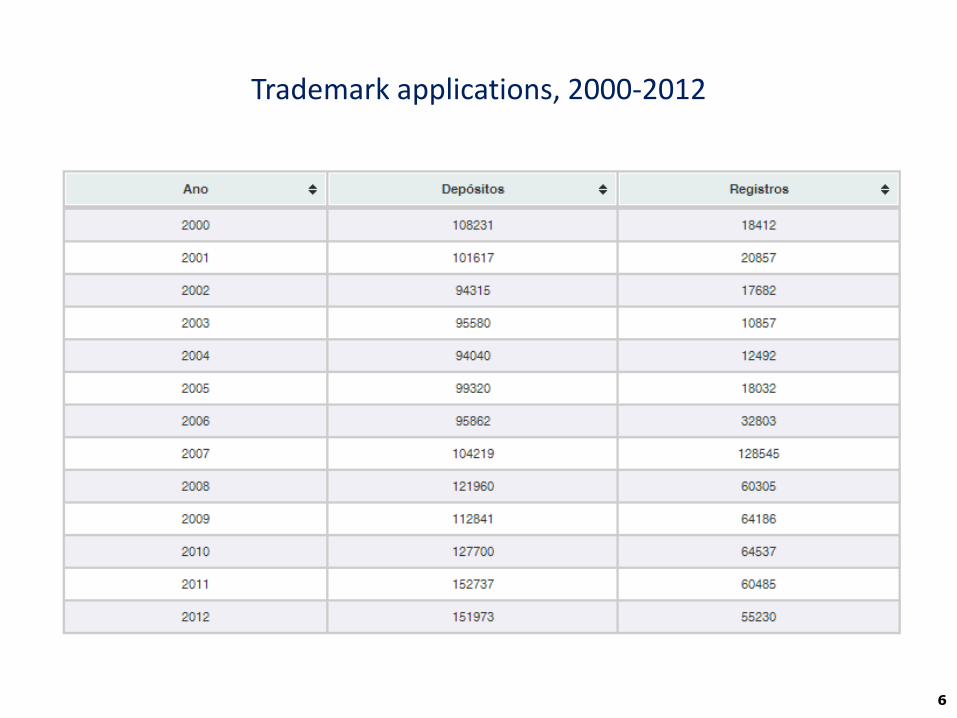
Trademark applications, 2000-2012
6
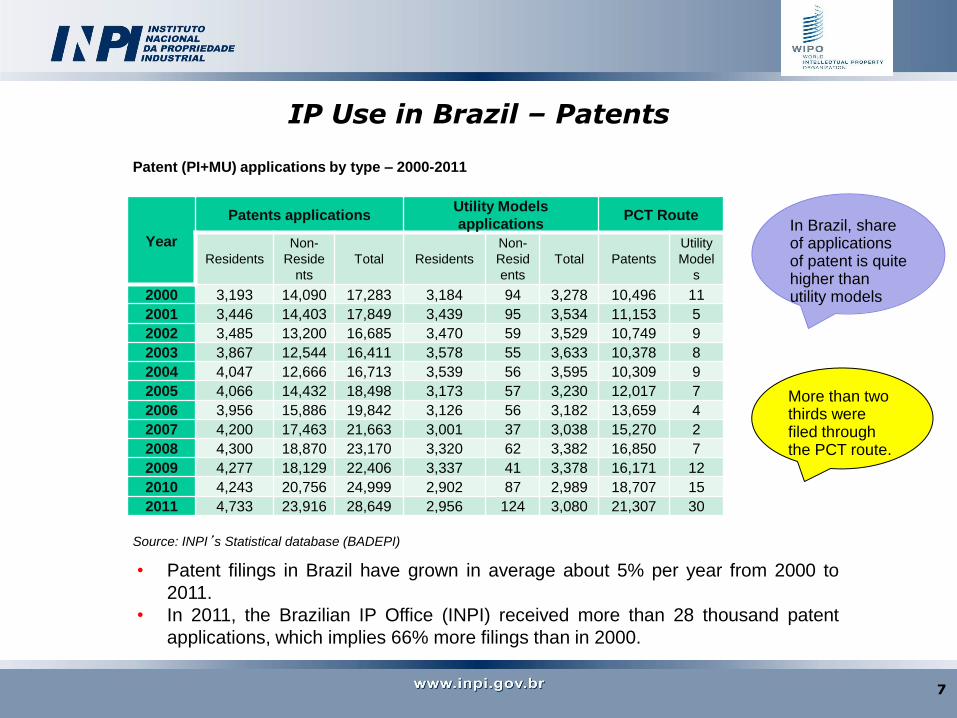
• Patent filings in Brazil have grown in average about 5% per year from 2000 to
2011.
• In 2011, the Brazilian IP Office (INPI) received more than 28 thousand patent
applications, which implies 66% more filings than in 2000.
Year
Patents applications Utility Models
applications PCT Route
Residents
Non-
Reside
nts
Total Residents
Non-
Resid
ents
Total Patents
Utility
Model
s
2000 3,193 14,090 17,283 3,184 94 3,278 10,496 11
2001 3,446 14,403 17,849 3,439 95 3,534 11,153 5
2002 3,485 13,200 16,685 3,470 59 3,529 10,749 9
2003 3,867 12,544 16,411 3,578 55 3,633 10,378 8
2004 4,047 12,666 16,713 3,539 56 3,595 10,309 9
2005 4,066 14,432 18,498 3,173 57 3,230 12,017 7
2006 3,956 15,886 19,842 3,126 56 3,182 13,659 4
2007 4,200 17,463 21,663 3,001 37 3,038 15,270 2
2008 4,300 18,870 23,170 3,320 62 3,382 16,850 7
2009 4,277 18,129 22,406 3,337 41 3,378 16,171 12
2010 4,243 20,756 24,999 2,902 87 2,989 18,707 15
2011 4,733 23,916 28,649 2,956 124 3,080 21,307 30
Source: INPI’s Statistical database (BADEPI)
Patent (PI+MU) applications by type – 2000-2011
IP Use in Brazil – Patents
More than two thirds were filed through the PCT route.
In Brazil, share of applications of patent is quite higher than utility models
7
IP Use in Brazil – Patents
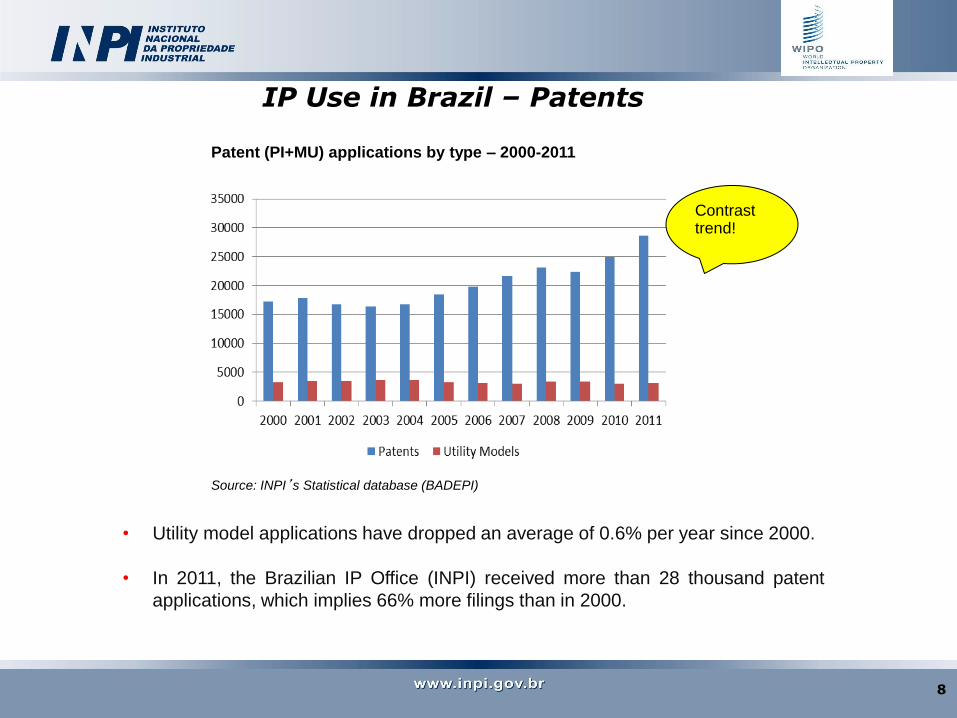
• Utility model applications have dropped an average of 0.6% per year since 2000.
• In 2011, the Brazilian IP Office (INPI) received more than 28 thousand patent
applications, which implies 66% more filings than in 2000.
Source: INPI’s Statistical database (BADEPI)
Patent (PI+MU) applications by type – 2000-2011
Contrast trend!
8
IP Use in Brazil – Patents
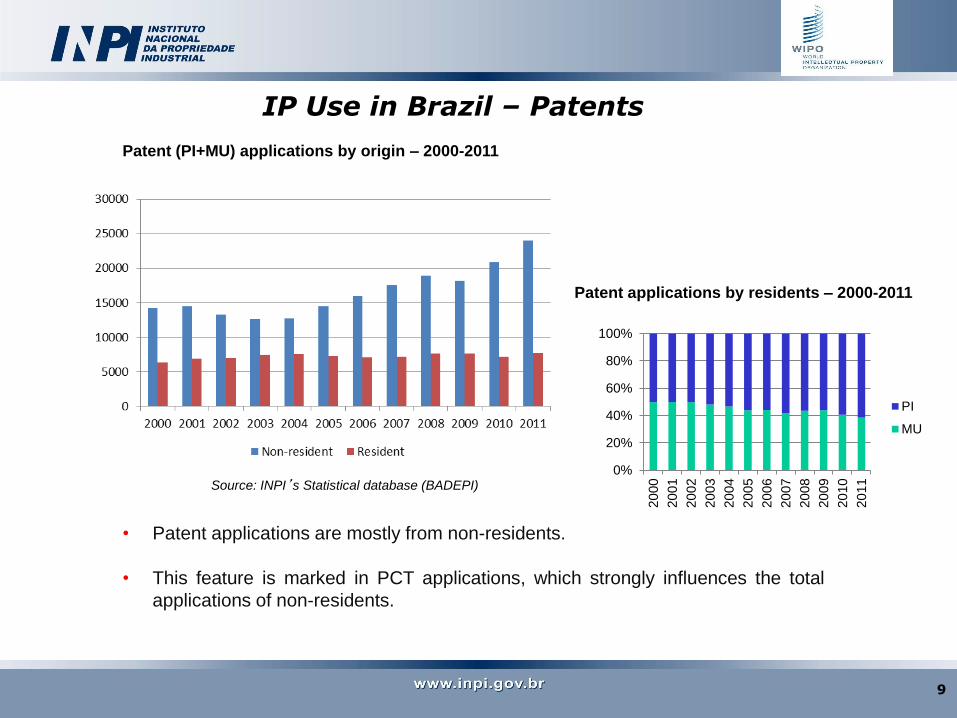
• Patent applications are mostly from non-residents.
• This feature is marked in PCT applications, which strongly influences the total
applications of non-residents.
Source: INPI’s Statistical database (BADEPI)
Patent (PI+MU) applications by origin – 2000-2011
0%
20%
40%
60%
80%
100%
20
00
20
01
20
02
20
03
20
04
20
05
20
06
20
07
20
08
20
09
20
10
20
11
PI
MU
Patent applications by residents – 2000-2011
9
IP Use in Brazil – Patents
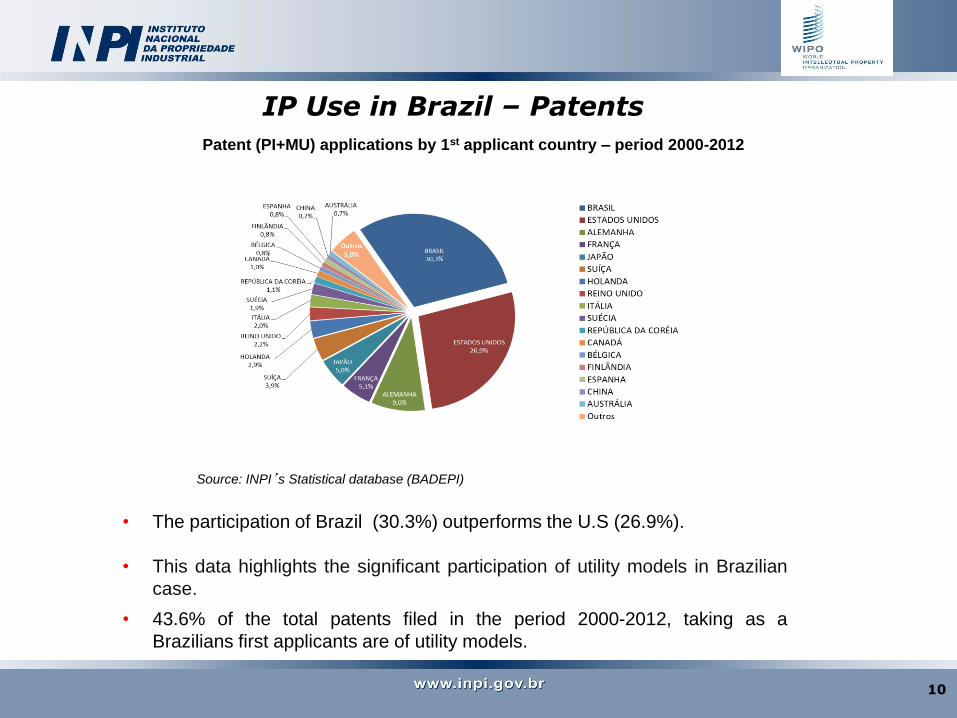
• The participation of Brazil (30.3%) outperforms the U.S (26.9%).
• This data highlights the significant participation of utility models in Brazilian
case.
• 43.6% of the total patents filed in the period 2000-2012, taking as a
Brazilians first applicants are of utility models.
Source: INPI’s Statistical database (BADEPI)
Patent (PI+MU) applications by 1st applicant country – period 2000-2012 Patent & Utility Model applicationsby 1st applicant country, 2000-2012
10
IP Use in Brazil – Patents
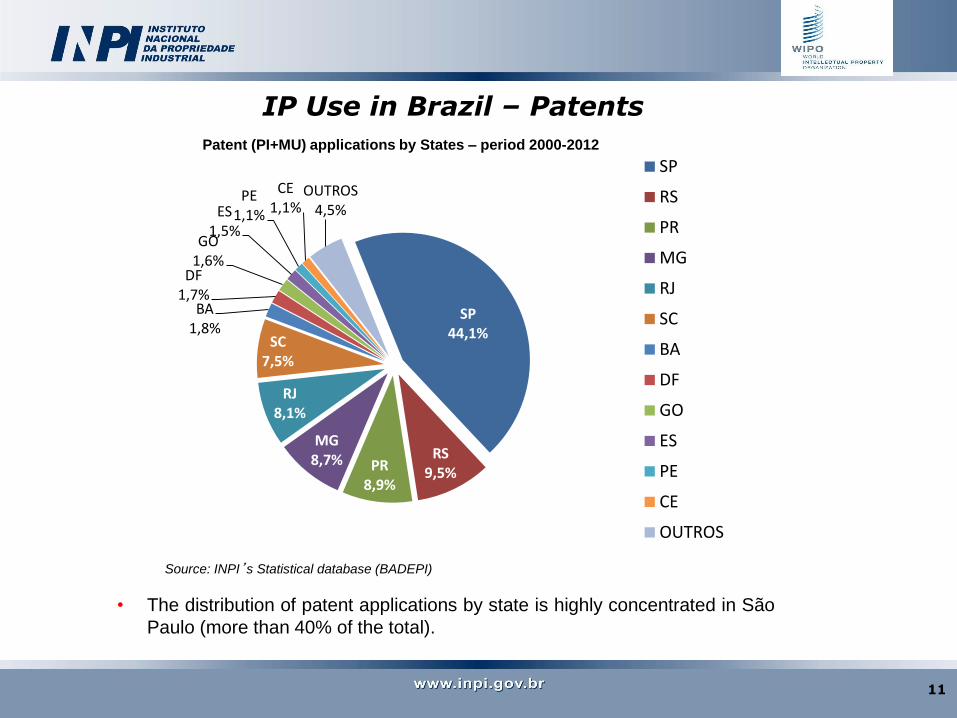
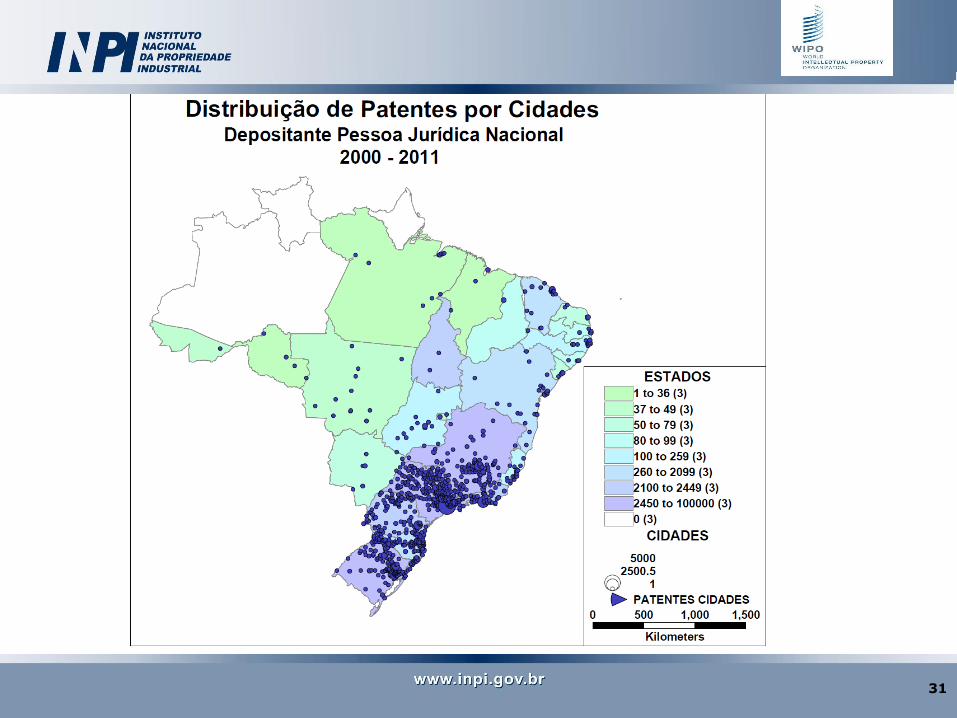
• The distribution of patent applications by state is highly concentrated in São
Paulo (more than 40% of the total).
Source: INPI’s Statistical database (BADEPI)
Patent (PI+MU) applications by States – period 2000-2012
SP 44,1%
RS 9,5% PR
8,9%
MG 8,7%
RJ 8,1%
SC 7,5%
BA 1,8%
DF 1,7%
GO 1,6%
ES 1,5%
PE 1,1%
CE 1,1%
OUTROS 4,5%
SP
RS
PR
MG
RJ
SC
BA
DF
GO
ES
PE
CE
OUTROS
11
IP Use in Brazil – Patents
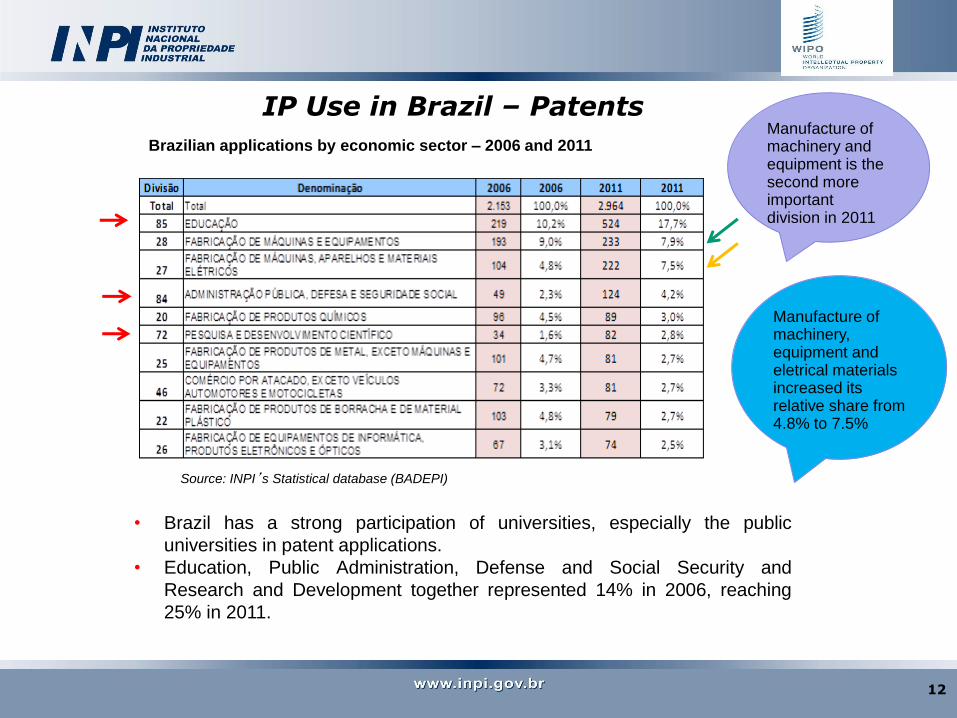
• Brazil has a strong participation of universities, especially the public
universities in patent applications.
• Education, Public Administration, Defense and Social Security and
Research and Development together represented 14% in 2006, reaching
25% in 2011.
Source: INPI’s Statistical database (BADEPI)
Brazilian applications by economic sector – 2006 and 2011 Manufacture of machinery and equipment is the second more important division in 2011
Manufacture of machinery, equipment and eletrical materials increased its relative share from 4.8% to 7.5%
12
IP Use in Brazil – Industrial Designs
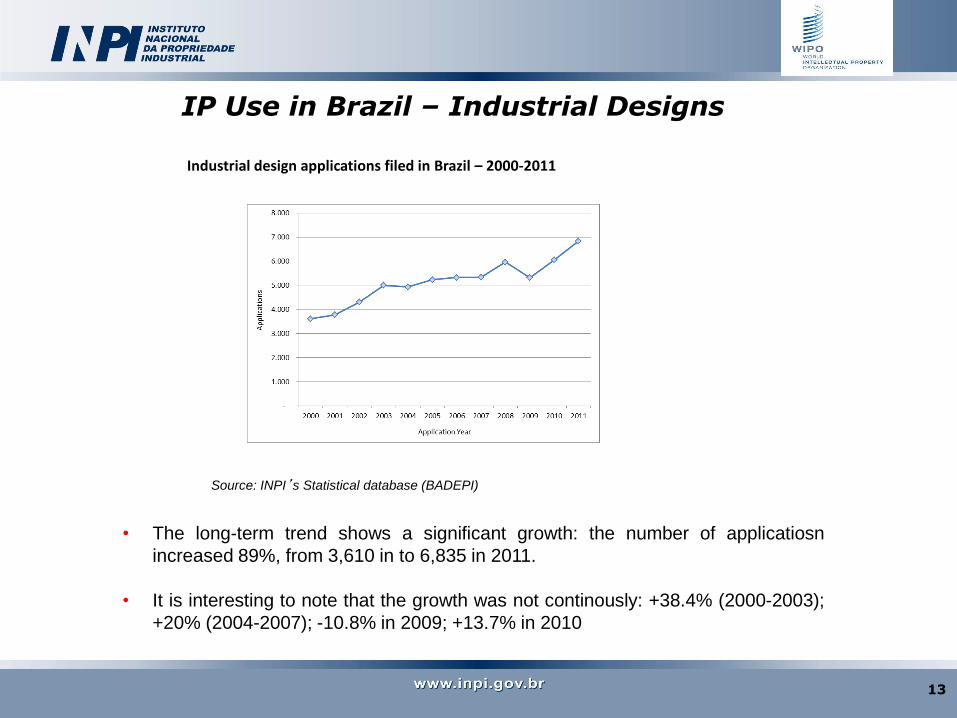
• The long-term trend shows a significant growth: the number of applicatiosn
increased 89%, from 3,610 in to 6,835 in 2011.
• It is interesting to note that the growth was not continously: +38.4% (2000-2003);
+20% (2004-2007); -10.8% in 2009; +13.7% in 2010
Source: INPI’s Statistical database (BADEPI)
Industrial design applications filed in Brazil – 2000-2011
13
IP Use in Brazil – Industrial Designs
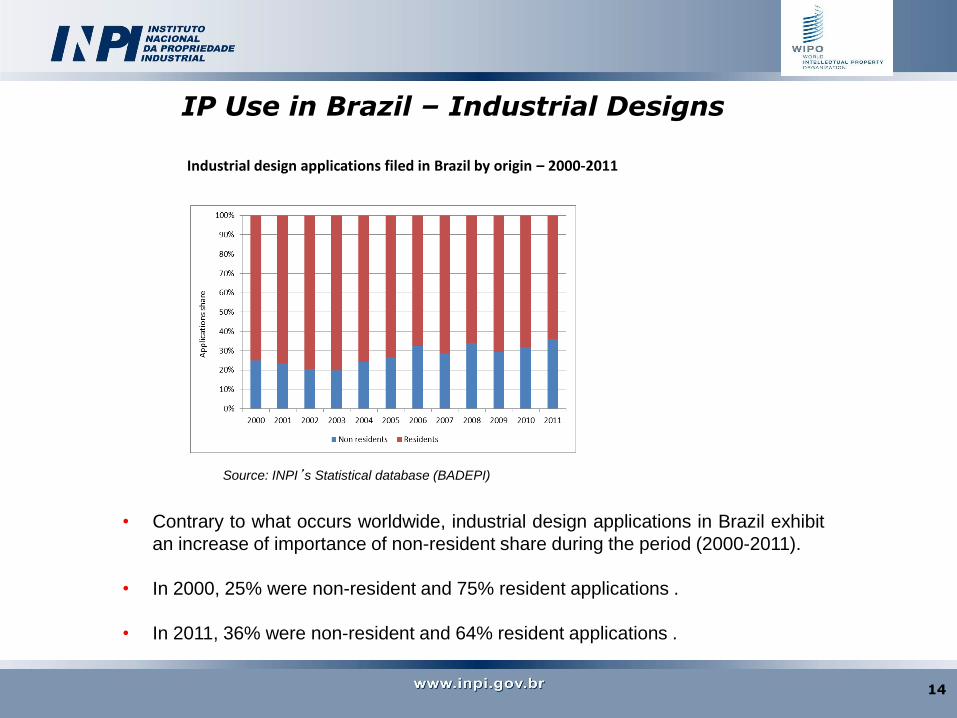
• Contrary to what occurs worldwide, industrial design applications in Brazil exhibit
an increase of importance of non-resident share during the period (2000-2011).
• In 2000, 25% were non-resident and 75% resident applications .
• In 2011, 36% were non-resident and 64% resident applications .
Source: INPI’s Statistical database (BADEPI)
Industrial design applications filed in Brazil by origin – 2000-2011
14
IP Use in Brazil – Industrial Designs
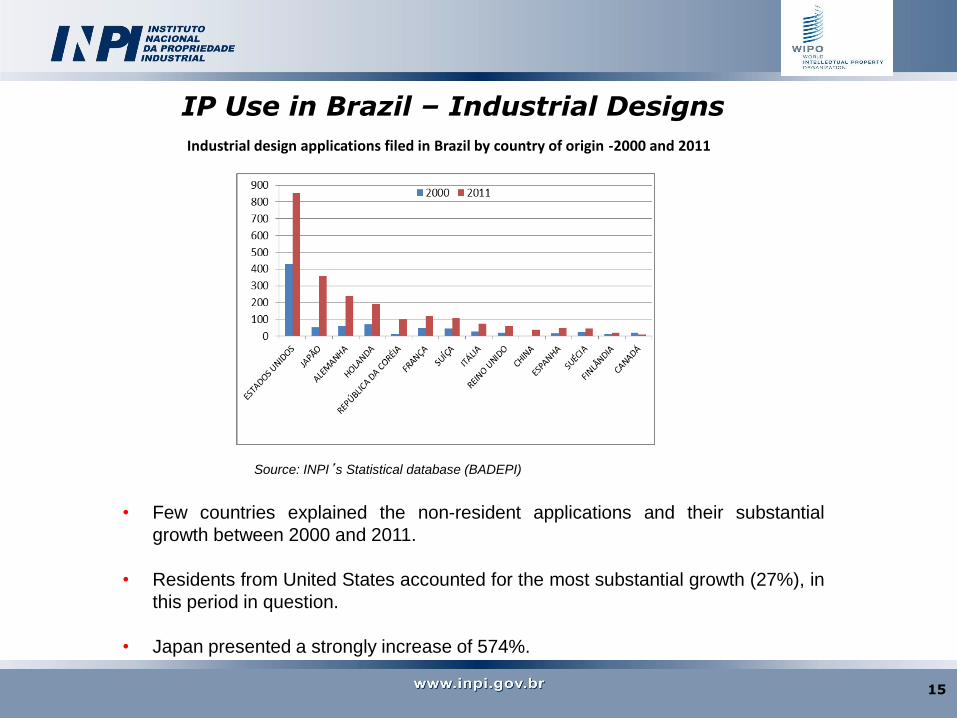
• Few countries explained the non-resident applications and their substantial
growth between 2000 and 2011.
• Residents from United States accounted for the most substantial growth (27%), in
this period in question.
• Japan presented a strongly increase of 574%.
Source: INPI’s Statistical database (BADEPI)
Industrial design applications filed in Brazil by country of origin -2000 and 2011
15
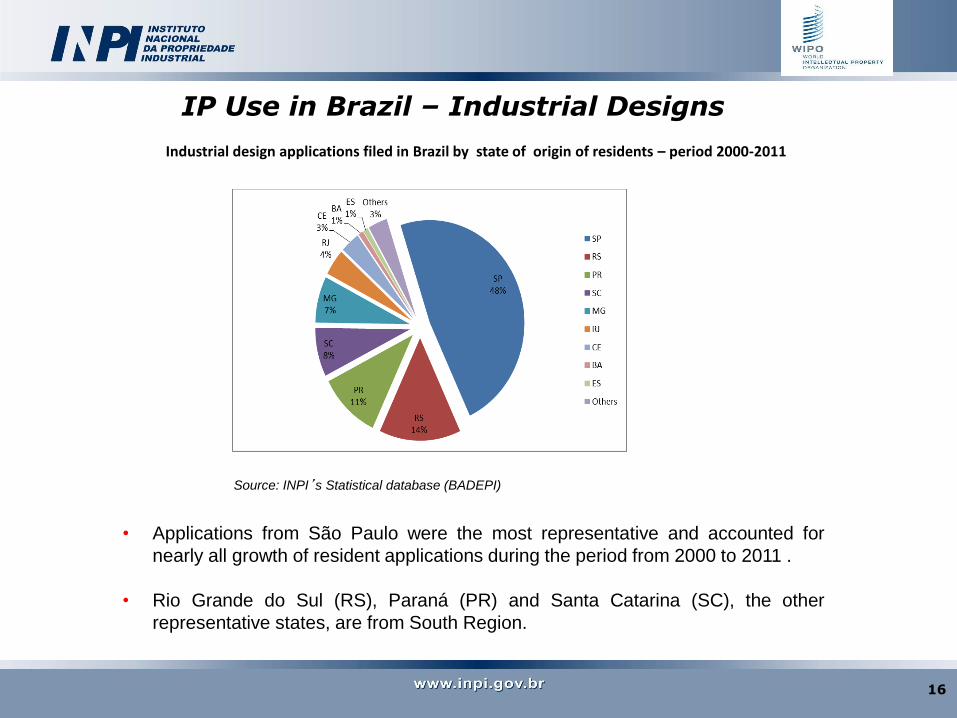
IP Use in Brazil – Industrial Designs
• Applications from São Paulo were the most representative and accounted for
nearly all growth of resident applications during the period from 2000 to 2011 .
• Rio Grande do Sul (RS), Paraná (PR) and Santa Catarina (SC), the other
representative states, are from South Region.
Source: INPI’s Statistical database (BADEPI)
Industrial design applications filed in Brazil by state of origin of residents – period 2000-2011
16
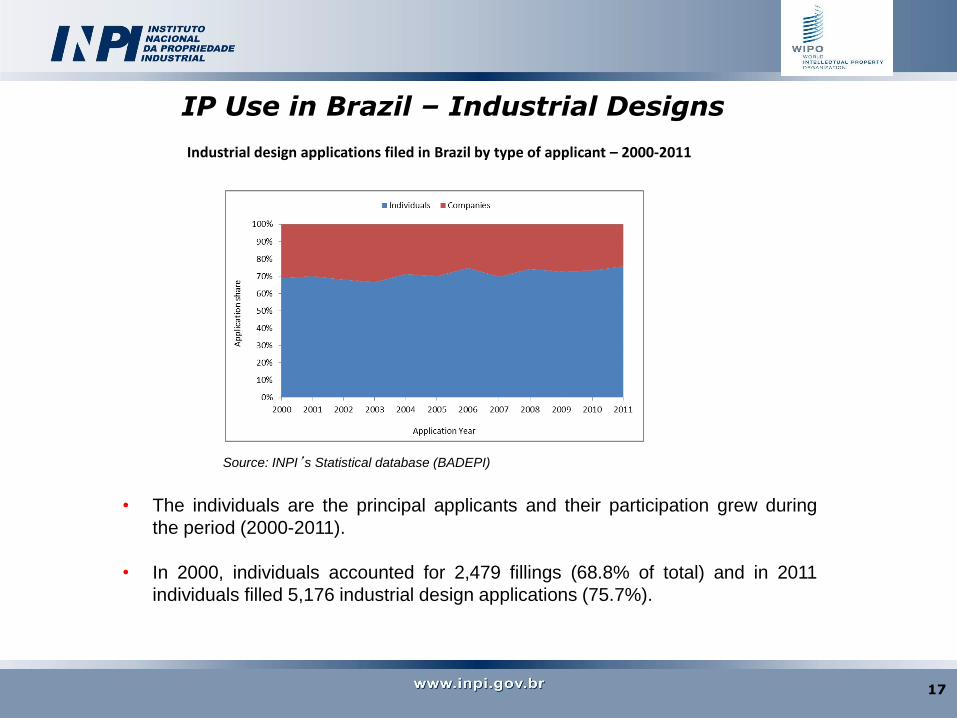
IP Use in Brazil – Industrial Designs
• The individuals are the principal applicants and their participation grew during
the period (2000-2011).
• In 2000, individuals accounted for 2,479 fillings (68.8% of total) and in 2011
individuals filled 5,176 industrial design applications (75.7%).
Source: INPI’s Statistical database (BADEPI)
Industrial design applications filed in Brazil by type of applicant – 2000-2011
17
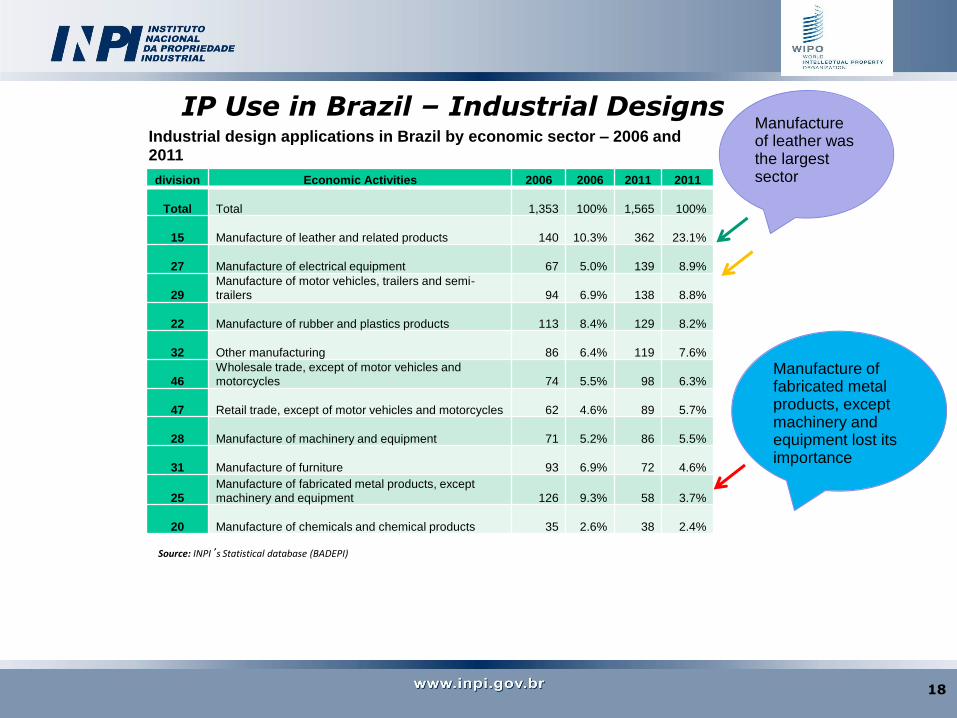
IP Use in Brazil – Industrial Designs
Source: INPI’s Statistical database (BADEPI)
Industrial design applications in Brazil by economic sector – 2006 and 2011
Manufacture of leather was the largest sector
Manufacture of fabricated metal products, except machinery and equipment lost its importance
division Economic Activities 2006 2006 2011 2011
Total Total
1,353
100%
1,565
100%
15 Manufacture of leather and related products
140 10.3%
362 23.1%
27 Manufacture of electrical equipment
67 5.0%
139 8.9%
29 Manufacture of motor vehicles, trailers and semi-
trailers
94 6.9%
138 8.8%
22 Manufacture of rubber and plastics products
113 8.4%
129 8.2%
32 Other manufacturing
86 6.4%
119 7.6%
46 Wholesale trade, except of motor vehicles and
motorcycles
74 5.5%
98 6.3%
47 Retail trade, except of motor vehicles and motorcycles
62 4.6%
89 5.7%
28 Manufacture of machinery and equipment
71 5.2%
86 5.5%
31 Manufacture of furniture
93 6.9%
72 4.6%
25 Manufacture of fabricated metal products, except
machinery and equipment
126 9.3%
58 3.7%
20 Manufacture of chemicals and chemical products
35 2.6%
38 2.4%
Source: INPI’s Statistical database (BADEPI)
18
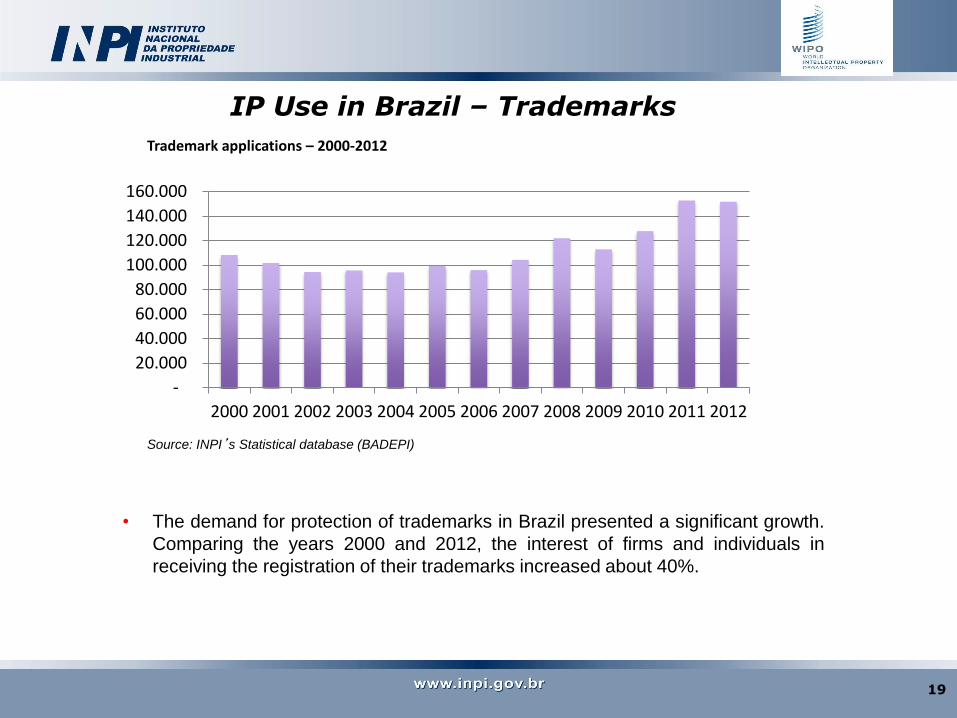
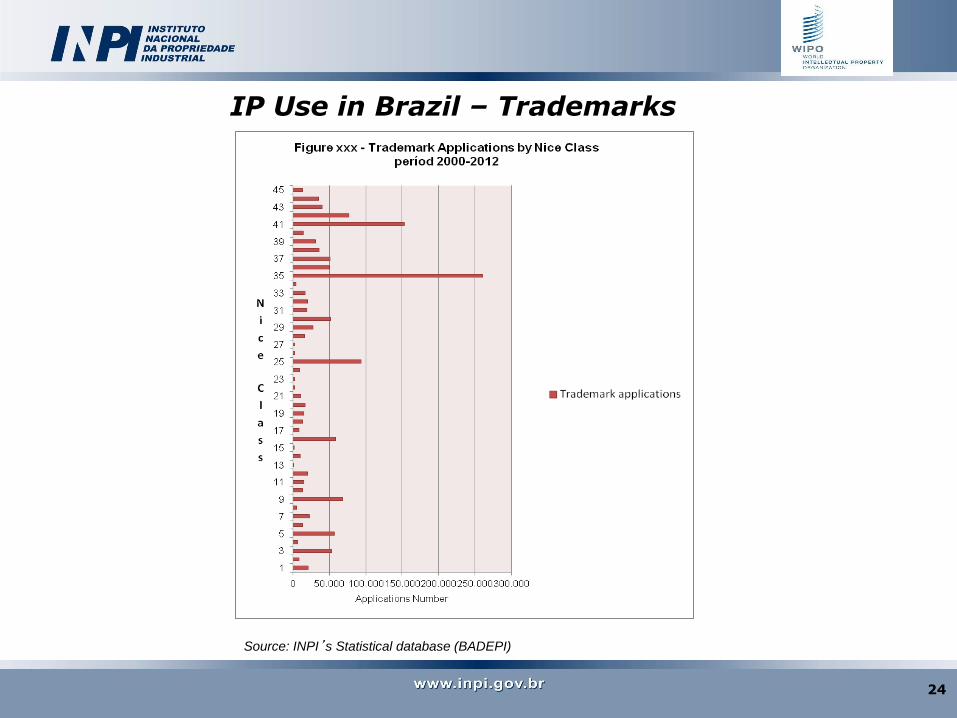
IP Use in Brazil – Trademarks
• The demand for protection of trademarks in Brazil presented a significant growth.
Comparing the years 2000 and 2012, the interest of firms and individuals in
receiving the registration of their trademarks increased about 40%.
Source: INPI’s Statistical database (BADEPI)
Trademark applications – 2000-2012
-
20.000
40.000
60.000
80.000
100.000
120.000
140.000
160.000
2000 2001 2002 2003 2004 2005 2006 2007 2008 2009 2010 2011 2012
19
IP Use in Brazil – Trademarks
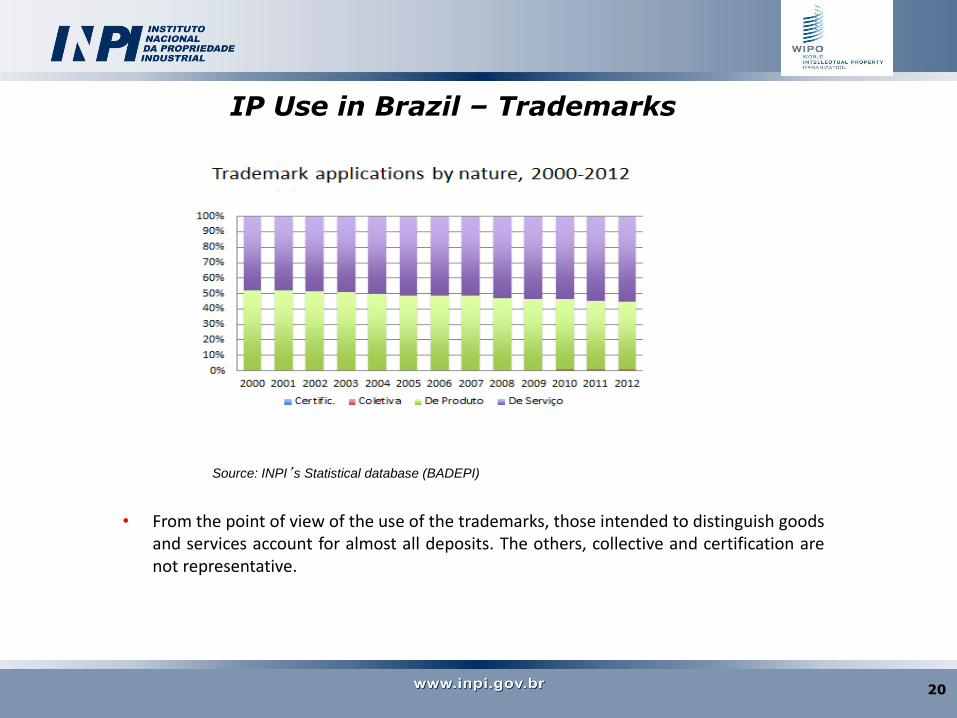
• From the point of view of the use of the trademarks, those intended to distinguish goods and services account for almost all deposits. The others, collective and certification are not representative.
Source: INPI’s Statistical database (BADEPI)
20
IP Use in Brazil – Trademarks
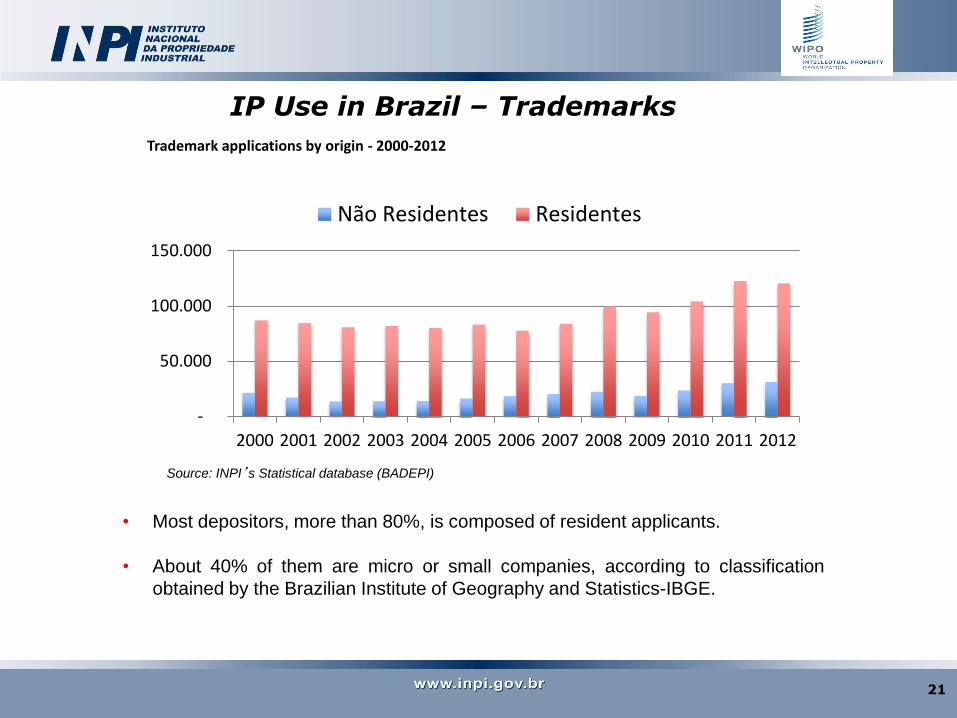
• Most depositors, more than 80%, is composed of resident applicants. • About 40% of them are micro or small companies, according to classification
obtained by the Brazilian Institute of Geography and Statistics-IBGE.
Source: INPI’s Statistical database (BADEPI)
-
50.000
100.000
150.000
2000 2001 2002 2003 2004 2005 2006 2007 2008 2009 2010 2011 2012
Não Residentes Residentes
Trademark applications by origin - 2000-2012
21
IP Use in Brazil – Trademarks
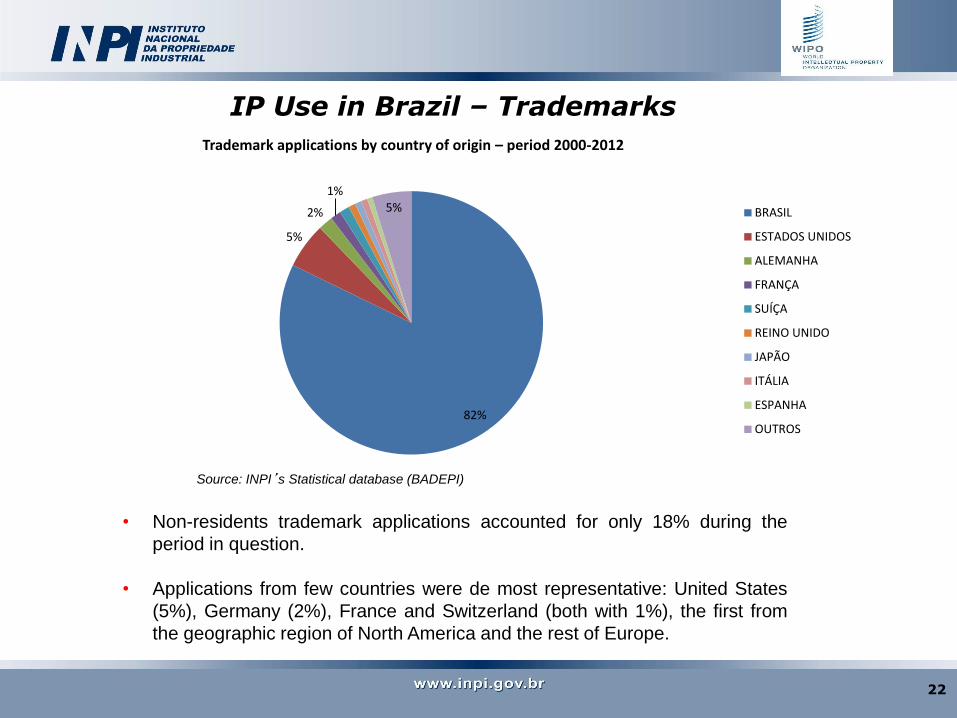
• Non-residents trademark applications accounted for only 18% during the
period in question.
• Applications from few countries were de most representative: United States
(5%), Germany (2%), France and Switzerland (both with 1%), the first from
the geographic region of North America and the rest of Europe.
Source: INPI’s Statistical database (BADEPI)
Trademark applications by country of origin – period 2000-2012
82%
5%
2%
1%
5% BRASIL
ESTADOS UNIDOS
ALEMANHA
FRANÇA
SUÍÇA
REINO UNIDO
JAPÃO
ITÁLIA
ESPANHA
OUTROS
22
IP Use in Brazil – Trademarks
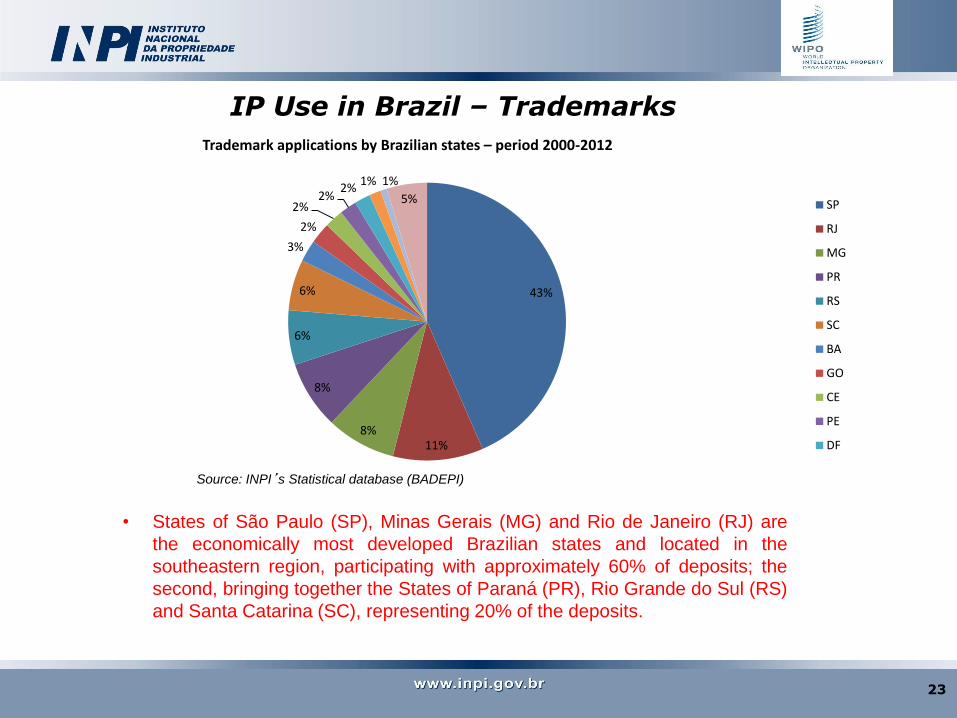
• States of São Paulo (SP), Minas Gerais (MG) and Rio de Janeiro (RJ) are
the economically most developed Brazilian states and located in the
southeastern region, participating with approximately 60% of deposits; the
second, bringing together the States of Paraná (PR), Rio Grande do Sul (RS)
and Santa Catarina (SC), representing 20% of the deposits.
Source: INPI’s Statistical database (BADEPI)
Trademark applications by Brazilian states – period 2000-2012
43%
11% 8%
8%
6%
6%
3%
2%
2% 2%
2% 1% 1%
5% SP
RJ
MG
PR
RS
SC
BA
GO
CE
PE
DF
23
IP Use in Brazil – Trademarks
Source: INPI’s Statistical database (BADEPI)
24
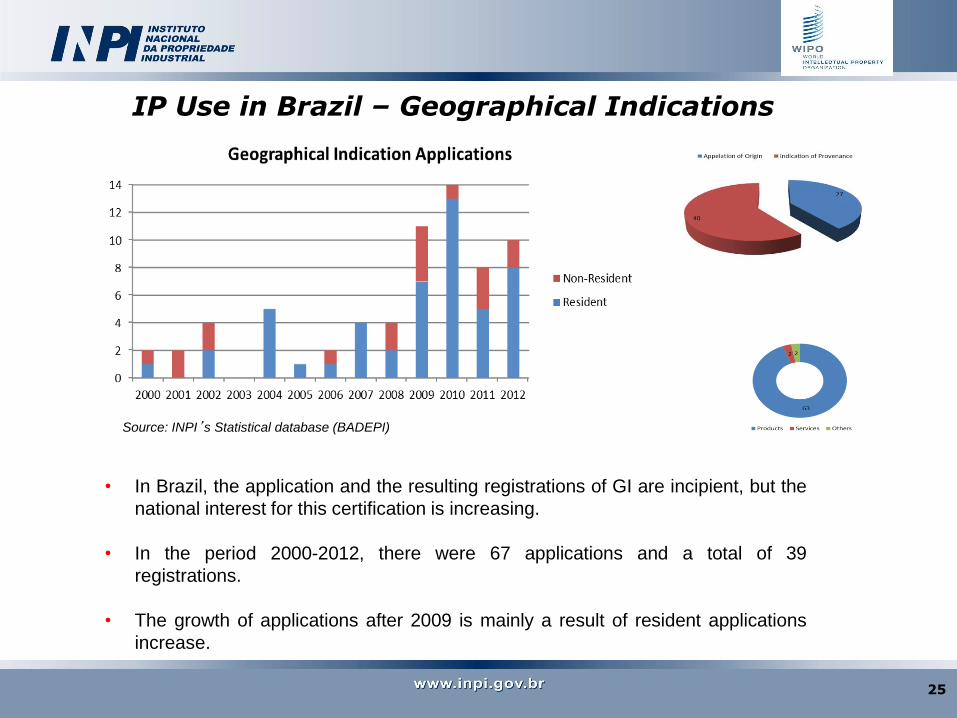
IP Use in Brazil – Geographical Indications
• In Brazil, the application and the resulting registrations of GI are incipient, but the
national interest for this certification is increasing.
• In the period 2000-2012, there were 67 applications and a total of 39
registrations.
• The growth of applications after 2009 is mainly a result of resident applications
increase.
Source: INPI’s Statistical database (BADEPI)
25
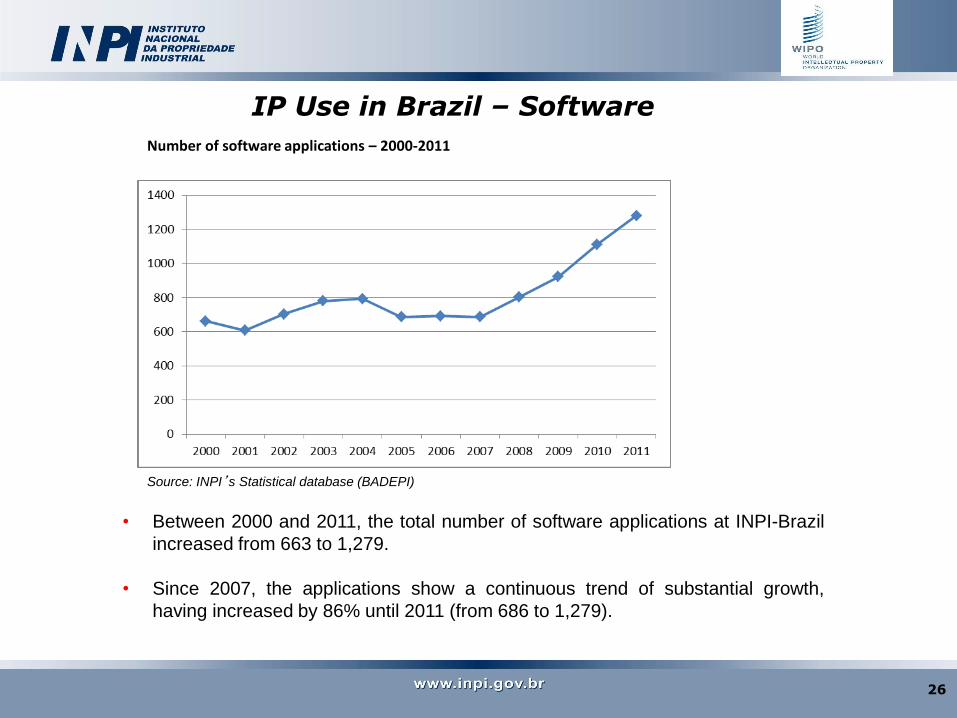
IP Use in Brazil – Software
• Between 2000 and 2011, the total number of software applications at INPI-Brazil
increased from 663 to 1,279.
• Since 2007, the applications show a continuous trend of substantial growth,
having increased by 86% until 2011 (from 686 to 1,279).
Source: INPI’s Statistical database (BADEPI)
Number of software applications – 2000-2011
26
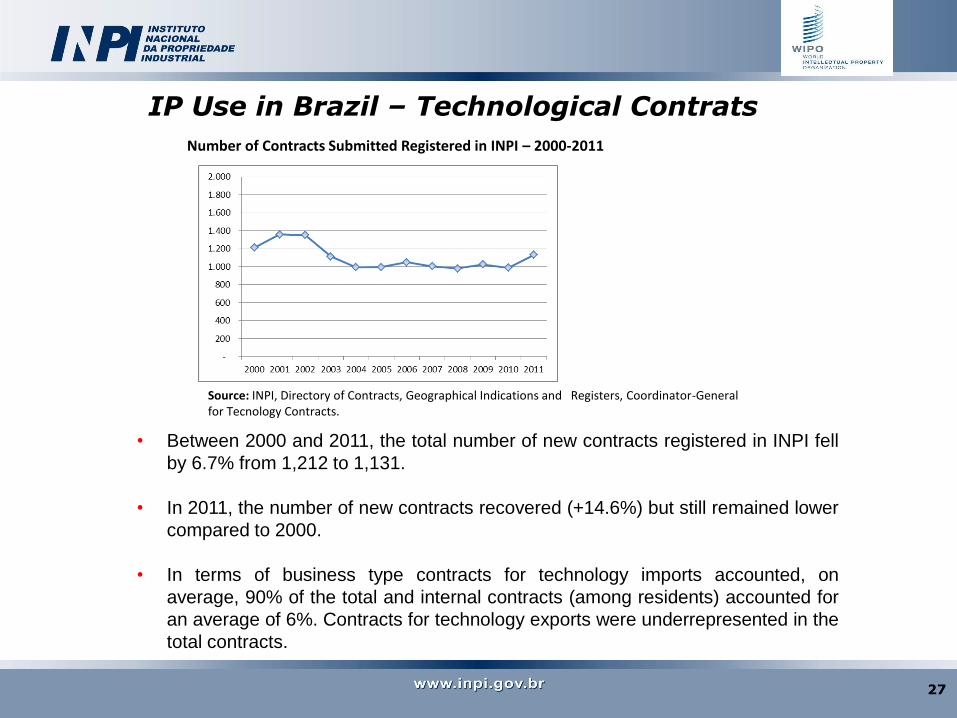
IP Use in Brazil – Technological Contrats
• Between 2000 and 2011, the total number of new contracts registered in INPI fell
by 6.7% from 1,212 to 1,131.
• In 2011, the number of new contracts recovered (+14.6%) but still remained lower
compared to 2000.
• In terms of business type contracts for technology imports accounted, on
average, 90% of the total and internal contracts (among residents) accounted for
an average of 6%. Contracts for technology exports were underrepresented in the
total contracts.
Source: INPI, Directory of Contracts, Geographical Indications and Registers, Coordinator-General for Tecnology Contracts.
Number of Contracts Submitted Registered in INPI – 2000-2011
27
IP Use in Brazil – Technological Contrats
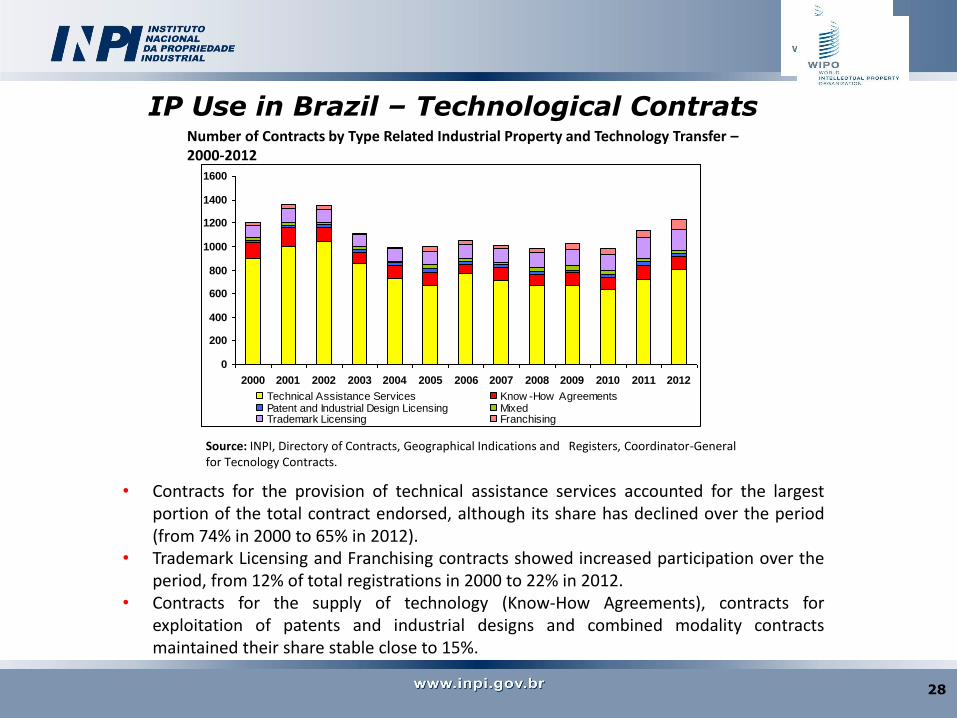
• Contracts for the provision of technical assistance services accounted for the largest portion of the total contract endorsed, although its share has declined over the period (from 74% in 2000 to 65% in 2012).
• Trademark Licensing and Franchising contracts showed increased participation over the period, from 12% of total registrations in 2000 to 22% in 2012.
• Contracts for the supply of technology (Know-How Agreements), contracts for exploitation of patents and industrial designs and combined modality contracts maintained their share stable close to 15%.
Source: INPI, Directory of Contracts, Geographical Indications and Registers, Coordinator-General for Tecnology Contracts.
Number of Contracts by Type Related Industrial Property and Technology Transfer – 2000-2012
0
200
400
600
800
1000
1200
1400
1600
2000 2001 2002 2003 2004 2005 2006 2007 2008 2009 2010 2011 2012
Technical Assistance Services Know -How AgreementsPatent and Industrial Design Licensing MixedTrademark Licensing Franchising
28
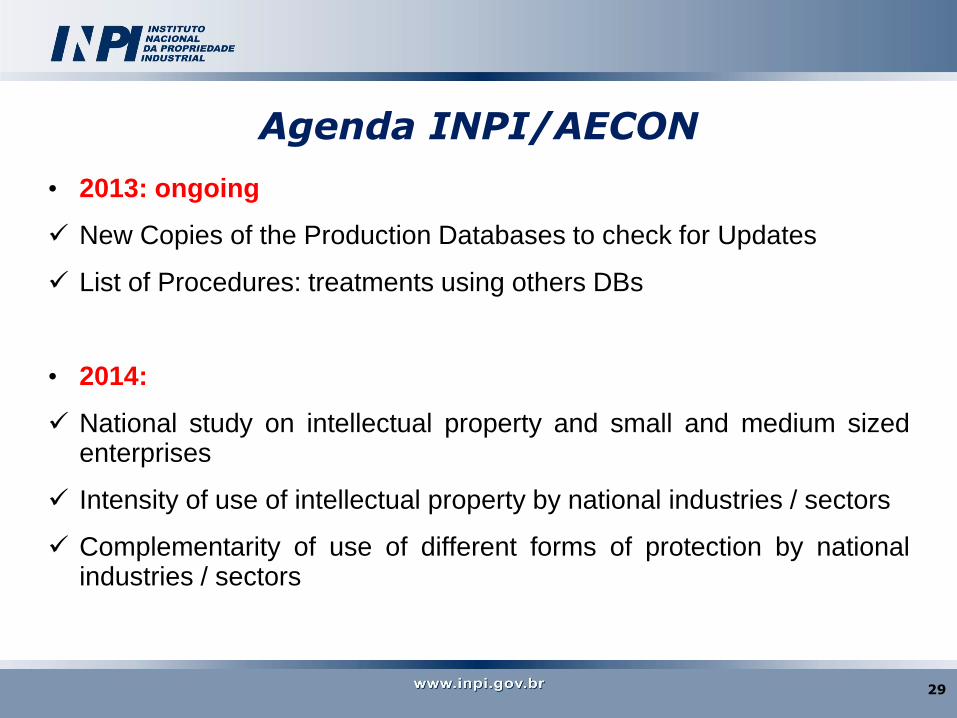
Agenda INPI/AECON
• 2013: ongoing
New Copies of the Production Databases to check for Updates
List of Procedures: treatments using others DBs
• 2014:
National study on intellectual property and small and medium sized enterprises
Intensity of use of intellectual property by national industries / sectors
Complementarity of use of different forms of protection by national industries / sectors
29
.
.
.
BADEPI v1.0
Queries “DE PARA”
Treatments: RAIS, IBGE, PCT/WIPO, ESPACENET = List of Procedures
BADEPI v2.0 C
on
tribu
tion
s fro
m N
etwo
rk
BADEPI v2.1
Oth
er
Treatmen
ts
Incremental Database
Re-applies List of Procedures
Checks updates BADEPI v3.0
Re-applies List of Procedures
Checks updates
BADEPI vN.0
Dat
abas
e U
pd
ates
INPI's Production Databases
Patents
Trademarks
Dynamics!!! Insert new records Correction of records
Industrial Designs
Software
Geographical Indications
Tech. Contracts
INPI's Statistical Database
Copies of the Production Databases
DB snapshot in a certain point in time
New Copies of the Production Databases
New Copies of the Production Databases
Incremental Database
30
31
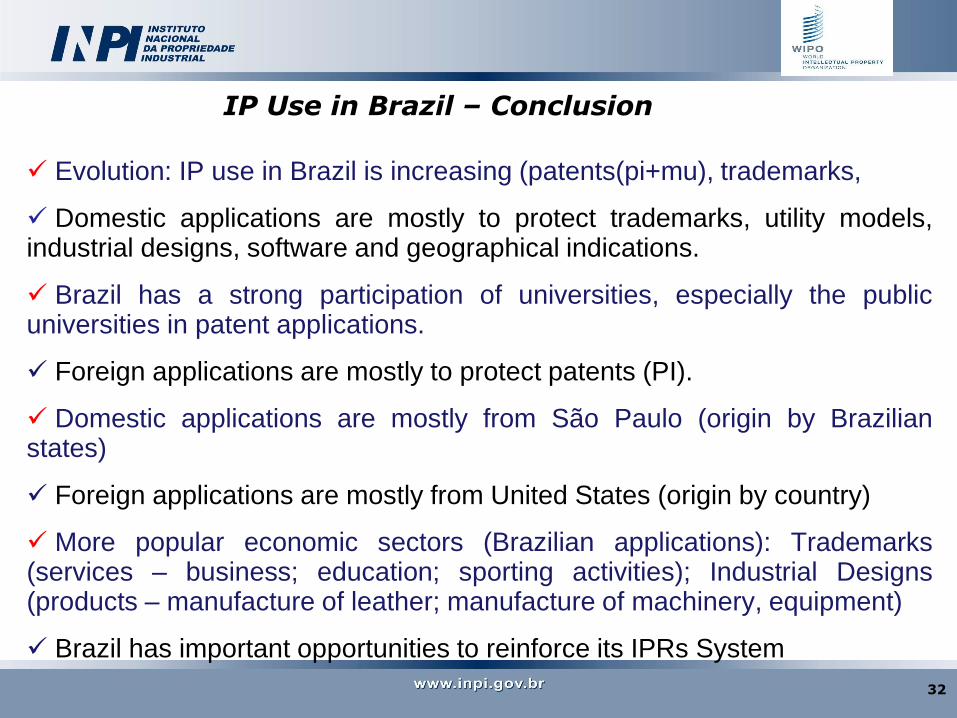
Evolution: IP use in Brazil is increasing (patents(pi+mu), trademarks,
Domestic applications are mostly to protect trademarks, utility models, industrial designs, software and geographical indications.
Brazil has a strong participation of universities, especially the public universities in patent applications.
Foreign applications are mostly to protect patents (PI).
Domestic applications are mostly from São Paulo (origin by Brazilian states)
Foreign applications are mostly from United States (origin by country)
More popular economic sectors (Brazilian applications): Trademarks (services – business; education; sporting activities); Industrial Designs (products – manufacture of leather; manufacture of machinery, equipment)
Brazil has important opportunities to reinforce its IPRs System
IP Use in Brazil – Conclusion
32
Thanks!
Sergio M Paulino de Carvalho
Marina Filgueiras Jorge
Vera Pinheiro
Felipe Lopes
Vivian Iris
Leonardo Ribeiro (INMETRO)
33
![A General Introduction to American Literature. Discussions China, experts agree, is the nation of the future […] The commercial and intellectual success](https://img.pdfslide.us/doc/110x75/56649d015503460f949d40fd/a-general-introduction-to-american-literature-discussions-china-experts-agree.jpg)


![NOUTATI NOV 2012 FULL VERSION - drept.unibuc.ro · Socio-economic benefits of intellectual property protection in developing countries [Text tiparit] / Shahid Alikhan. - Alikhan,](https://img.pdfslide.us/doc/110x75/5e09a413db512b7aec31becc/noutati-nov-2012-full-version-drept-socio-economic-benefits-of-intellectual-property.jpg)