Embed Size (px)
Citation preview

Experts in Teamwork 2011, Gullfaks village
Technical Report for Group 2 Challenge 1: Geological and geophysical uncertainties
Okorie Ekwe Agwu Guowen Lei Trygve Andreas Elind Thorstein Otto Viseth Joakim Onarheim Martens

I
Preface

II
Abstract This work has been a modest attempt to study the geological and geophysical uncertainties that make communication possible between sand bodies in the Beta Ridge on the one hand. On the other hand it is an attempt to increase oil recovery by modifying water model representing the Ridge.
It was required that the model should be modified to a case where all faults was sealed and then increase the number of wells (injectors and producers) to increase recovery.
A close geological look at the Beta Ridge revealed that the factors that affect the communication are the extensive faulting in the area due to the late Jurassic rifting can either increase or decrease the communication. In addition, the sedimentology of the reservoir formations has different qualities regarding the communication. Some depositional environments can have large continuous sand bodies, with relatively good initial porosity and permeability. Also affecting the communication is the different local and regional diagenetic processes.
The geophysical uncertainties in the Ridge include the quality of the seismic data, the many faults in the area, the amount of noise in the data and the horizontal and vertical seismic resolution.
Based on the simulation results and a review of diverse cases of faults opened or sealed, the following are the conclusion that could be drawn: that there is communication between beta ridge and the Gullfaks main field via the Tordis area. This is because the fault displacement in the Tordis area is smaller and favourable for communication. Also the communication between Gulltop, Gullveig and Tordis is good. The communication between Skinfaks and the other fields of the Beta ridge is limited due to the fact that there are faults oriented in the east - west direction between Skinfaks and Gullveig and thus isolating Skinfaks. The other fundamental reason for the limited communication in the Skinfaks field is the low permeability in the area.
The part A of the project can be found in appendix 2.

III
Contents
Preface ......................................................................................................................................... I
Abstract ..................................................................................................................................... II
1 Introduction ........................................................................................................................ 2
1.1 Geological description of the beta ridge ...................................................................... 2
1.1.1 Sedimentology and stratigraphy of the reservoirs in the beta ridge ............................ 3
1.1.2 Geological elements in the beta ridge that leads to good communication .................. 6
1.2 Geophysical uncertainties in the beta ridge, ................................................................ 7
2 Simulations of the western province .................................................................................. 9
2.1 Model description ...................................................................................................... 10
2.2 Simulation results ...................................................................................................... 14
2.2.1 Pressure distribution in field for cases of faults sealed and faults open .................... 14
2.3 Summary of the faults communication ...................................................................... 18
2.4 Review of field parameters after sealing and non-sealing of faults .......................... 21
2.5 Review of field production and other parameters after adding one new producer and one new injector well with faults open ................................................................................. 23
2.6 Review of simulation results for new wells installed in faults partly opened model 27
2.7 Review of simulation results with faults sealed with new wells ............................... 29
3 Discussion and economic analysis ................................................................................... 33
3.1 Economic evaluation ................................................................................................. 33
3.2 Procedure ................................................................................................................... 33
3.3 Economic Assumptions ............................................................................................. 33
3.4 Results from normal- best- and worst case ................................................................ 34
4 Conclusion ........................................................................................................................ 36
5 The teams assessment of the social relevance of the project ........................................... 37
6 References ........................................................................................................................ 38
7 Appendix 1: Seismic interpretations ................................................................................ 39
8 Appendix 2: Project part A ............................................................................................... 43

2
1 Introduction
1.1 Geological description of the beta ridge The Beta Ridge is a subsurface ridge-structure located west for the Gullfaks field, on the Norwegian continental shelf in the northern part of the North Sea.
It covers an elongated and narrow area, in an area called the Tampen Spur. Here the Beta Ridge is situated west of the Gullfaks main field with an SSW-NNE orientation.
In addition, the Beta Ridge lies on the western flank of a rift system called the Viking Graben. This rift system in the northern part of the North Sea was created in two main phases of extension, where the most important phase for the creation of the Viking Graben, was the
Figure 1.1: Map of Gullfaks Mainfield and Gullfaks satellite fields. The location of the Beta Ridge (marked in blue). Fields that are located on the Beta Ridge are Skinfaks, Gullveig, Gulltopp and Tordis[1].

3
one during the late Jurassic-early Cretaceous. This rifting process deformed the succession of layers in the area (pre-rift sediments), from the Triassic and the Jurassic, into large oblique fault blocks who in turn where heavily faulted, creating series of smaller tilted fault blocks. During the rifting, there was also re-deposition of sediments (synrift-sediments) in to the basins that were created between the tilted fault blocks. The origin of these sediments is the tops of the tilted fault blocks, which in some cases were moved above the sea level of that time and eroded. [2]
Many of Norway’s large hydrocarbon-fields (e.g. Statfjord, Gullfaks, Snorre), are located within the fault blocks in this area.
Skinfaks, Gullveig and Gulltopp are Gullfaks Satellite fields located on separate, westward rotated fault blocks along the Beta Ridge [3]. Further to the north on the Beta Ridge we find the Tordis field, which has been proven to have good communication with both the Gulltopp and Gullveig field.
1.1.1 Sedimentology and stratigraphy of the reservoirs in the beta ridge The main group of oil-producing formations in the Beta Ridge, and on the Norwegian continental shelf in general, is called the BRENT Group. The BRENT Group consists of five formations: Broom/Oseberg1, Rannoch, Etive, Ness and Tarbert.
These formations are deposits from different facies (depositional environment) in the large Brent Delta, which prograded northwards in the North Sea during the Middle Jurassic. In the last part of Middle Jurassic, the rifting in the North Sea increased so that the area became flooded and the Brent group deposits ended [2].
Although the Gullveig field contains some gas in the Statfjord formation (Table 1.1), the main reservoir formations within the Beta Ridge are the Tarbert, Ness and to some extent the Rannoch/Etive in the Brent Group. These formations come from different depositional environments within the Brent delta. The Tarbert formation consists of deposits from the retreating delta front, Ness consists of deposits from the delta plain and Rannoch/Etive is deposits from the delta slope and the protruding delta front.
1 recent geological interpretations, question the Broom and Oseberg formation's connection to the Brent Group. Today, geologists believe that they were formed independently of the Brent group, as sandy delta deposits from the Shetland platform and the Norwegian mainland. [2]

4
Table 1.1: Hydrocarbon systems on the Gullfaks MainField and the Gullfaks Satellite Fields. The formations in the Brent Group are the most important hydrocarbon systems in the Beta Ridge (Gullveig , Skinfaks and Gulltopp) [3].
The depositional environment of a formation is an important factor for how good it will be as a reservoir. The deposition will have an influence on the reservoir properties, as well as the reservoir size, geometry and possible connectivity to other field segments. Usually, the delta front has good reservoir qualities, with large lateral continuous sand bodies, and with relatively good initial porosity and permeability. In comparison, the delta plain typically has some thin sand bodies from channel deposits, which are continuous in one lateral direction. Between the channels there are mostly mud deposits. (Figure 1.2)
Figure 1.2: Stratigraphic column of the Brent Group in Gullfaks South (represents the Gullfaks satellite fields). Notice how the permeability changes from the Tarbert (retreating delta front deposits) to Ness formation (delta plain deposits), and also how each formations contains impermeable sections wich would reduce communication between the sections within the formation [3].

5
In the Beta Ridge area, the sedimentology and reservoir quality of the Brent Group differ a bit from the Gullfaks main field.
The following text is taken from the Reservoir Management Plan of The Gullfaks Field and Satellites 2007 by Statoil Hydro, and is giving a description about Gullfaks Satellites in general, about the formations Tarbert, Ness and Etive/Rannoch:
“The Tarbert Formation in the Gullfaks Satellites consists of massive, homogeneous and highly permeable reservoir sands, separated by thin shales, coals and carbonates. (…)The Ness Formation in the Gullfaks satellites is characterized by frequently alternating reservoirs sands, thin shales and coal layers, causing vertical flooding and pressure barriers and is thus similar to the Tarbert-1 unit. The sands are generally thinner than in the Tarbert Formation. Sand permeability also varies greatly in the Ness Formation.(…) The Etive Formation and Rannoch-3 and 2 units are relatively homogenous. The Etive Formation is relatively thin (10-20m) in the GF SAT area and consists of medium to fine grained, relatively clean sandstone, while the Rannoch 3 and 2 units consists of very fine to fine sand with high mica content (…)”[3]
Tarbert formation has better properties for providing good horizontal and vertical communication (although some vertical permeability barriers), then the Ness formation with non-continuous reservoir sands and much heterogeneity.
There are also differences from one field to the next on the Beta Ridge, regarding the reservoir properties, the continuity and thickness of the different formations. E.g. in the Gullveig field, the Brent group generally has better properties than in the other Gullfaks satellite fields. This is probably caused by shallower burial depths [3].

6
1.1.2 Geological elements in the beta ridge that leads to good communication The following are geological elements believed to enhance good communication in the Beta ridge. They include:
Faults In the Viking Graben, the pre-Cretaceous deposits are heavily faulted due to the extensive late Jurassic rifting. Because of the extensional tectonics, the most common fault type is normal faults. In many places, such as the Beta Ridge, the sediment layers from the Triassic and Jurassic, has been displaced and rotated by the faulting.
The displacement from a fault can create a structural trap where hydrocarbons can accumulate, e.g. a permeable sand layer can be displaced next to an impermeable shale layer, or the rocks close to the fault plane can become so deformed that they will act as a barrier for flow (Figure 1.3).
A fault can also increase or create communication (Figure 1.3). Permeable layers that normally don’t have any communication, e.g. two horizontal layers, separated by an impermeable fluid barrier, can be displaced next to each other by a fault. This can create communication between layers that normally would have been separated from each other.
Figure 1.3: This illustration shows a non-sealing, normal faulted section of layers. Notice how the permeable Layer 1 on the right side of the fault is displaced down and gains communication with Layer 2 on the left side. Layer 1 on the left side of the fault becomes a possible trap for HC accumulation.
In general, the North-South communication in the Beta Ridge is good. Statoil has tested and found out that it is good pressure communication between the reservoirs in the Gulltopp, Gullveig and Tordis field. One exception is the Skinfaks field, which has limited communication with both Gullveig and Gulltopp to the north. Skinfaks probably get most of its pressure support from an isolated water aquifer [4].
On the seismic from the area, there are many faults seen cutting perpendicular to the length of the Beta Ridge inside and around the Skinfaks field [1]. These faults could be a reason for the limited communication from Skinfaks to the other fields in the Beta Ridge.

7
When we simulated the pressure communication for the Gullfaks Western Province, we noticed that the permeability in the grid blocks around the Skinfaks field was very low. If the average permeability around Skinfaks is that low in situ, the limited communication is likely to be caused by this. The Beta Ridge also has communication with the Gullfaks Main field. This implies that the East-West communication either must go through or around the Main Fault (See Appendix: A1.1, A1.2, A1.3). From seismic we can see that the Main N-S fault (Tordis Fault) has a large throw in the southern and middle part of the Beta Ridge (See Appendix: A1.1, A1.4, A1.5).
Diagenetic processes that affect the communication Different diagenetic processes (process < 200 ⁰C) can have local and regional influence on the permeability and communication throughout the Beta Ridge. Different diagenetic processes occur with different sediment compositions, pore fluids, burial depths and temperatures.
The degree of compaction would usually decrease permeability. Different factors affecting the compaction of a sediment rock is burial depth, rate of burial, degree of consolidation, grain size, grain shape, sorting and mineral composition.
Extensive cementation between the grains in an area of a rock layer will reduce the porosity, permeability and essentially the horizontal and vertical communication through that rock layer. Mica and clay grains (detrital or diagenetic) in a sand formation will also reduce permeability.
Feldspar can be dissolved due to diagenetic processes, creating secondary porosity but also clay minerals, resulting with a decrease in permeability.
Cores form the Brent Group in the northern Viking Graben, shows that the sandstones is not very indurated and contains small amounts of quartz cement down to burial depths of 2,5 - 3,5 km. Below a depth of 2,5 – 3,5 km, the quartz cementation increases [5]. In the northern Viking Graben, dissolved feldspar and authigenic kaolinite (clay mineral generated in situ) occurs from the shallowest parts of the Brent group and further down. Dissolution of K-feldspar and illitization of kaolinite, happens at depth around 3,5 – 4,0 km [5]. The alteration of kaolinite and K-feldspar forming illite has a negative effect on the permeability, since illite is a clay mineral which tend to clog the pore throats.
1.2 Geophysical uncertainties in the beta ridge, The geophysical uncertainties in the Beta Ridge are linked to the quality of the seismic and how the seismic is interpreted. It is important to correctly distinguish between data caused by real seismic reflectors and data caused by noise. To reduce the uncertainty, it is important

8
to have good quality seismic data and enough wells to correlate the seismic data. When you correlate with a sufficient amount of wells, it is easier to distinguish noise from real seismic events.
Many seismic surveys have been carried out in the Gullfaks area. The most recent acquisitions with newer technology and better quality, has questioned that some of the features that earlier were interpret as faults, in reality could be seismic artefacts caused by noise [6]. The seismic resolution is an important uncertainty factor. If a fault throw is very small (i.e. smaller than the wavelength of the sound wave divided by four), it is not possible to identify the fault from seismic. Another geophysical uncertainty factor, is tuning effects in the seismic data, i.e. if the distance between two reflectors are so small that their reflections causes interference.
It is also hard to say anything about the sealing capacity of faults, from seismic alone. Fractures in the Beta Ridge rock formations could have influence on the permeability and communication, and are not likely to be visible in seismic.
In summary, the following are the geophysical uncertainty factors in the Beta Ridge:
1 The quality of the seismic data 2 Many faults (may cause diffractions and shadow zones) 3 Noise in the seismic data 4 The seismic resolution and tuning effects
To reduce geophysical uncertainty it is important to drill wells so that you can correlate the seismic properly.
9
2 Simulations of the western province As discussed in the previous part, the transmissibility across faults plays an important role in reservoir’s uncertainties. Faults influence flow in a reservoir simulation model in two ways. Firstly, they alter the connectivity of sedimentological flow units. Displacements across faults can cause partial or total juxtaposition of different flow units. This may connect stratigraphically disconnected high permeability units as well as juxtaposing high against low permeability units. For faults incorporated discretely in flow simulation models, these effects are captured as a function of the relative depths of the corners of the grid-blocks separated by a fault. Faults generally increase the overall vertical connectivity of a reservoir and decrease the overall horizontal connectivity, but the precise influence of fault displacements on reservoir connectivity is complex, as seismic data cannot resolve details of fault structure: What appears to be a single fault on seismic often comprises multiple fault strands which can have a significantly different effect on flow unit connectivity than a single strand [7].
Fault transmissibility is edited by the keyword of MULTFLT, whilst transmissibility multipliers are numerical devices used in lieu of these properties. As the permeability of sub-surface faults can be estimated, it seems sensible that these estimates are used to determine the transmissibility multipliers for faults in reservoirs for which no dynamic data is available. The use of dynamic data in explaining faulted simulation models is beyond the scope of this contribution, which aims only to present a method for determining transmissibility multipliers based on a static geological prediction. Dynamic information, when available, provides the only firm indication of the behavior of any particular fault in a reservoir and must therefore be the prime data explaining the overall transmissibility assigned to the fault. Nonetheless, an appreciation of the dependencies contained within fault transmissibility multipliers is necessary if the dynamic information is used to construct models which not only match the production and pressure history, but are also geologically acceptable.
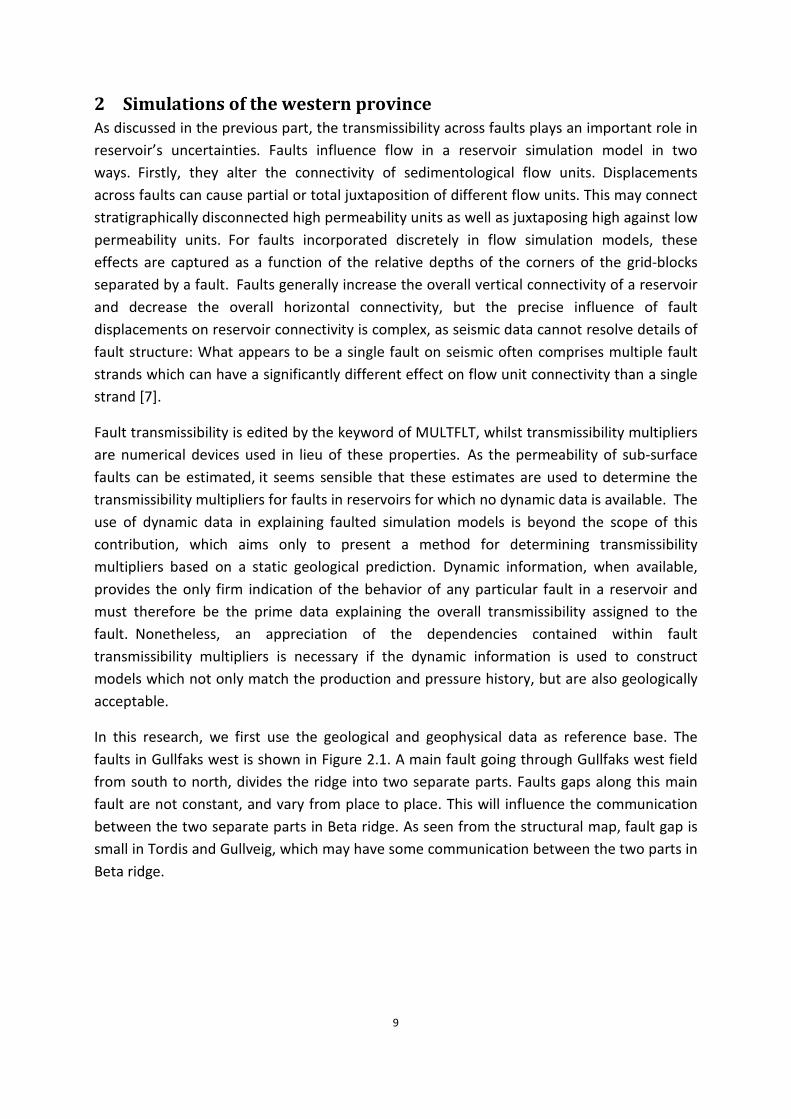
In this research, we first use the geological and geophysical data as reference base. The faults in Gullfaks west is shown in Figure 2.1. A main fault going through Gullfaks west field from south to north, divides the ridge into two separate parts. Faults gaps along this main fault are not constant, and vary from place to place. This will influence the communication between the two separate parts in Beta ridge. As seen from the structural map, fault gap is small in Tordis and Gullveig, which may have some communication between the two parts in Beta ridge.

10
Figure 2.1: Gullfaks west fault structure map [6]
2.1 Model description As introduced by Statoil, the Beta ridge model is based on the regional maps (BCU_070904, TBrent_070904, BBrent_070904) and faults (TBrent_rms_fpoly and BBrent_rms_fpoly), and also on Tarbert, NessIII, NessII, NessI, and Etive/Rannoch isocores. The model covers Vestlig provins as well as Gullfaks main field. Gullfaks main field grid is not cleaned up and inactive.

11
Vestlig provins includes Gullfaks vestflanke (D and E segments) Tordis field, Vigdis field, betadalen, and betaryggen, as show in Figure 2.2.
Figure 2.2: Reference Model of Beta Ridge
Model grid has 5 active layers, Tarbert, NessIII, NessII, NessI, and Etive/Rannoch from the top downwards. It is a water only model, injection and production is sometimes through pseudo wells (for all real injection/production taking place in a single layer). Wells injecting into or producing from more than one layer has been retained with their true name. For example, the water leakage from Gullfaks main is pseudo to a water injection well at east side of Beta ridge, and this injection well perforated all layers.
In modeling the role of faults in reservoir, MULTFLT is used to modify the transmissibility across the faults. There are two possible reservoir models related to the faults transmissibility. One is that the faults are not totally closed, which is shown in Figure 2.3. Here are most of the faults’ transmissibility is set to 0. The circles 1 and 2, indicated by the red ring, show where the transmissibility across the fault at Tordis and Gullveig are not set to zero. In these areas, fluid may go through the faults and communicate with each part.

12
Figure 2.3: Model Transmissibility panel distribution with faults open.
The other possible case is that all of the faults are closed, which means that the transmissibility across the faults are set to zero. This is done particularly at the areas of Tordis and Gullveig, Figure 2.4. The part called Vigdis field is also separated by a fault in its south direction.
1
2

13
Figure 2.4: Model Transmissibility panel distribution with faults sealed.

14
2.2 Simulation results
2.2.1 Pressure distribution in field for cases of faults sealed and faults open In order to prove which of these cases can model the reservoir most accurate, pressures with time are compared and analyzed. Faults open are shown from Figure 2.5 - Figure 2.13 and faults totally sealed are shown in Figure 2.16 - Figure 2.22. The white block in the model shows where the pressure is less than 200 Bara. As can be seen from this pressure distribution with time, pressure in model with faults partly opened are separated in the eastern part firstly and then go through the faults in Tordis area, afterward separated to the west part. However, the pressure in the sealed model shows that pressure can’t separate smoothly; pressure boundary and isolated island appear near the faults and in some closed blocks. The circled areas in Fig 3.27 and Fig 3.28 are where pressures are higher than 500 Bara. Water leaks from Gullfaks main to Gullfaks west, and the reservoir pressure in Gullfaks main is around 300 Bara. If this pressure in Gullfaks west is higher than reservoir pressure in Gullfaks main, it is impossible to flow from Gullfaks main to Gullfaks west. In conclusion, the case which all of the faults in Gullfaks west are sealed is unreasonable.
(a)The pressure distribution when faults are partly opened.
Figure 2.5: Pressure distribution in 1, Jan, 1986 Figure 2.6: Pressure distribution at 1, Jan 1990

15
Figure 2.7: Pressure distribution in 1, Jan, 1995 Figure 2.8: Pressure distribution at 1, Jan 2000
Figure 2.9: Pressure distribution in 1,Jan,2005 Figure 2.10: Pressure distribution at 1, Jan 2010

16
Figure 2.11: Pressure distribution in 1,Jan, 2015 Figure 2.12: Pressure distribution at 1, Jan 2020
Figure 2.13: Pressure distribution in 1,Jan, 2025
(b)The pressure distribution when faults are totally sealed.

17
Figure 2.14: Pressure distribution at 1, Jan 1986 Figure 2.15: Pressure distribution at 1, Jan 1990
Figure 2.16: Pressure distribution at 1, Jan 1995 Figure 2.17: Pressure distribution at 1, Jan 2000
Figure 2.18: Pressure distribution at 1, Jan 2005 Figure 2.19: Pressure distribution at 1, Jan 2010

18
Figure 2.20: Pressure distribution at 1, Jan 2015 Figure 2.21: Pressure distribution at 1, Jan 2020
Figure 2.22: Pressure distribution at 1, Jan 2025
2.3 Summary of the faults communication Based on the pressure distribution vs. time from 1986 to 2025, the flow path of leakage water from Gullfaks main to Beta ridge can be shown in Figure 2.23. From the simulations we can see that Tordis is in good communication with Gulltop and Gullveig. This implies that the communication in the Beta ridge is mostly good in the North South direction, except for Skinfaks which has limited communication with Gulltop and Gullveig. The reason for this could be that the faults in the north part of Skinfaks is sealed. The reservoir permeability in Skinfaks is lower than in the other fields Figure 2.24.

19
Figure 2.23: Injection water flow path
Water flow way

20
Figure 2.24: Permeability distribution in the model

21
2.4 Review of field parameters after sealing and non-sealing of faults
(a) FPR –Field Pressure
The simulation result of reservoir average pressure (FPR) and the water total production (FWPT) are compared. The results can be seen in Figure 2.25 and Figure 2.26. From this, we can see that the reservoir pressure has built up after sealing the north-south faults. At reservoir condition, the injected water is stored in the reservoir and gives support to underground energy. This also can be proven by the total water production rate.
(b) FWPT – Field Water Production Total
When the north-south faults are sealed, total water production from Beta ridge is reduced (Figure 2.26). The increased reservoir average pressure and the reduced water total production indicate that the injected water can’t leak to the other part of Beta. The energy is stored in some small part and can’t be separated to support the well producing.
(c) BPR – Block Pressure
In order to trace the water separation in the model, two simulations are run with faults open and sealed. Grid block pressure at two different grid positions is compared. One is located in the eastern part (I=12, J=62) while the other is in the western part (I=22, J=22). When the faults are partly opened, there is an increase in BPR resulting from the ultimate tendency of pressure movement from one part of the fault to another. On the other hand, since there is communication between the ridge and the main field, there is also the tendency for pressure to increase since pressure transmission is unrestricted. The gradual increase in pressure at the later parts of the blue and green lines underlines this fact (Figure 2.27). The reverse is the case when the faults are sealed. The pressure depletion in BPR comes as a result of the fact that there is no pressure communication and it is difficult to maintain the pressure as soon as production in each side of the fault begins.

22
Figure 2.25: Reservoir Pressure Comparison between Fault opened and sealed
Figure 2.26: Water Total Production Comparison between Faults Open and Sealed

23
Figure 2.27: Comparison of grid block pressure in each side of fault with and without faults sealed
2.5 Review of field production and other parameters after adding one new producer and one new injector well with faults open
Two new wells are planned based on the partly sealed faults model, which are named NTNU_2_P for producer and NTNU_2_I for injector (Figure 2.28). Since the model is purely a water model, both producer and injector are essentially water. The water injection well is located in the eastern part of the main faults, and the producer is located in the western block. 1000 Sm3/day water is injected into Gullfaks west from the beginning of the year 2012 and NTNU_2_P also began to produce at that time. The performance of the reservoir is forecasted until 2025.

24
Figure 2.28: The location of the two new wells installed in the model
Figure 2.29 to Figure 2.32 show the results obtained from the simulation runs. A brief summary of what each graph shows is presented.
(a) FPR –Field Pressure
In Figure 2.29, the average reservoir pressure decreases gradually with time after new wells were added. The total injected water was increased from 2.34×10⁸ Sm3 to 2.45×10⁸ Sm3 at the end of 31st October 2025.
(b) FWIT AND FWPT
On the other hand, the total water production increased from 2.94×10⁸ Sm3 to 3.15×10⁸ Sm3 at the end of 31st October 2025. Figure 2.30 to Figure 2.32 depicts total injected and produced water respectively for the time period of production. From the figures we discover that there is a significant increase in produced water when new wells are added. This is seen

25
in the increase of 2.1×10⁷ Sm3. The total injected water increase is not as high as the produced water. This can be seen in the small added volume of 1.1×10⁷ Sm3.
Figure 2.29: Comparison of reservoir pressure with and without new wells
Figure 2.30: Comparison of total injected water with time with and without new wells

26
Figure 2.31: Comparison of total produced water with time with and without new wells
Figure 2.32: Comparison of total injected and produced water with time with and without new wells

27
2.6 Review of simulation results for new wells installed in faults partly opened model
(a) WBP-Well Bottom Pressure
The Figure 2.33 primarily shows the well bottom hole pressure for the two new wells installed in the model. From these figures, it is clear that the BHP in both wells dropped significantly sometime in 2012. The BHP in the producer well remained a bit constant for an interval before a gradual incresase in 2020. This is not the case with the injector well, the BHP dropped and later showed a sharp rise way beyond the BHP of the producer. All these can be attributed to the fact that as more water is injected, extra energy is given to the well and that is seen in the sharp increase in the BHP of the injector.
Figure 2.33: WBHP for both new wells installed in the model

28
(b) WWIR and WWPR- Well water injection and production rate for newly installed wells
Figure 2.34: Injection and production rates in the new wells installed in the model
Figure 2.34 shows in detail how the rates in both the injector and producer wells were taken and the effects they had on each other. It is seen that at a constant injection rate of 2000 Sm3/day, the producer well showed a remarkable increase in rate of water produced. This can be attributed to the fact that the rate of injection of water imparted some energy to the producer well, which boosted its rate. A case for when the rate of injection was reduced to one half ie 1000 Sm3/day the production was also reduced. This is a good indication that production is greatly influenced by the injection rate. At the end of 2025, the water produced by NTNU_2_P is about 2.2×10⁷ Sm3 and the water injection is about 9.84×10⁶ Sm3.
(c) WWIT and WWPT – Well Water injection and Production Total

29
Figure 2.35: The Effect Of Total Water Injected In New Injector Well On Total Water Produced In New Producer Well. As seen in Figure 2.35 it is clear that when injection was started in 2012, the producer well was influenced to produce more. This is also seen from the increased total water produced (Figure 2.30).
When the faults are partly opened, water can go through the faults from the eastern part to western part and water production is increased.
2.7 Review of simulation results with faults sealed with new wells In order to improve the recovery, one producer and two new water injection well are planned. The producer’s position is at Tordis oil field. One water injector is planned in the eastern part of the faults (NTNU_2_I), and another one is planned in the western part of the faults (NTNU_2_J). Both of the two water injector perforated at the same layer, as well as same injection rate: 2000 Sm3/Day.
(a) FWIT AND FWPT – Field water injection and production total with new wells and without new wells for faults sealed

30
Figure 2.36: Comparison of water total injection and production with and without new wells in faults sealed model (b )FPR – Field Pressure
As can be seen from Figure 2.37, the reservoir average pressure will be less than the original model, and then higher than the original in later stages. This is caused by the high production rate for the new producer at the beginning, which is shown in Figure 2.38. The fact that the added produced water is less than the added injected water could be caused by the sealed faults, which stopped the water influx from eastern part to western part. NTNU_2_I, in the eastern part, keeps more constant pressure as compared with NTNU_2_J, which is located in the western part, Figure 2.39. This means that the producer only got support from the NTNU_2_J, which is located at the same side of the main fault.

31
Figure 2.37: Comparison of reservoir average pressure with and without new wells in faults sealed model
Figure 2.38: Well bottom hole pressure of 3 new wells

32
Figure 2.39: Well production and injection of 3 new wells

33
3 Discussion and economic analysis The communication condition in the faults is a key factor in reservoir simulation. In increased recovery factor analyzing, faults that is sealed or partly open will influence the final production. Since reservoir simulation is based on water model, it is hard to say how much oil will be produced from the producer.
Based on the geology and geophysics study, as well as the simulation results, our group decides to use the model where faults are partly opened in Tordis field for the following economic analysis.
3.1 Economic evaluation In this section we have evaluated the development of one production well and one injection well, using data from the Eclipse simulation. These two wells are both assumed to be subsea wells and drilled using a semi-submersible rig.
3.2 Procedure This project will be evaluated using net present value (NPV) and internal rate of return (IRR).
3.3 Economic Assumptions We have done the following economic assumptions: The oil price for 2011 is 90 USD per barrel. This price will increase 1 % each year. The inflation will be 0% and the discount factor will be 5%. In the sensitivity analysis of the project we assume that in a best case scenario, the oil price will increase 5 % each year, we will produce 30 % more and the investment costs will be 40% less. In a worst case scenario, the oil price will decrease 3 % each year, we will produce 30% less and the investment costs will be 40 % higher. The operational costs are assumed to be constant.

34
3.4 Results from normal- best- and worst case
Figure 3.2: Normal Case Scenario
Figure 3.1: Cumulative Net Present Value

35
Figure 3.3: Worst Case Scenario
Figure 3.4: Best Case Scenario
As we can see from Figure 3.1 - Figure 3.4, the normal case will paid back at around 2017, worst case around 2020, and the best case around 2013.
Table 3.1: Internal Rate of Return (IRR) Normal Case 26 % Worst Case -4 % Best Case 57 % Table 3.1 shows the internal rate of return for the project in the different scenarios.
-kr 2 000 000 000,00
-kr 1 500 000 000,00
-kr 1 000 000 000,00
-kr 500 000 000,00
kr 0,00
kr 500 000 000,00
kr 1 000 000 000,00
kr 1 500 000 000,00
kr 2 000 000 000,00
2019 2020 2021 2022
Worst Case
-kr 2 000 000 000,00
-kr 1 500 000 000,00
-kr 1 000 000 000,00
-kr 500 000 000,00
kr 0,00
kr 500 000 000,00
kr 1 000 000 000,00
kr 1 500 000 000,00
2011 2012 2013 2014
Best Case

36
4 Conclusion This work has been a modest attempt at study the geological and geophysical uncertainties that make communication possible between sand bodies in the Beta Ridge, and an attempt to increase oil recovery by modifying a water model representing the Ridge. The following conclusions may be drawn based on the results obtained from these attempts.
The geological elements leading to communication in the Beta Ridge are mainly:
• Faults o Can create communication between different formations
• The sedimentology and depositional history of the formations
o The high energy environment in the Brent delta (typical delta front, like Tarbert Fm and Etive Fm), is more prone to have homogenous sand deposits covering a large area.
• Diagenetic processes o Or rather the absence of diagenetic processes is more likely to preserve the
permeability and communication.
The following are the geophysical uncertainties in the Beta Ridge
• The quality of the seismic data • Many faults (diffractions and shadow zones) • Noise in the seismic data • The horizontal and vertical seismic resolution
Based on the simulation results and a review of diverse cases of faults opened or sealed, the following are the conclusion that could be drawn: there is communication between beta ridge and the Gullfaks main field via the Tordis area. This is because the fault displacement in the Tordis area is smaller and favourable for communication. Also the communication between Gulltop, Gullveig and Tordis is good. The communication between Skinfaks and the other fields of the Beta ridge is limited due to the fact that there are faults oriented in the east - west direction between Skinfaks and Gullveig and thus isolating Skinfaks. The other fundamental reason for the limited communication in the Skinfaks field is the low permeability in the area.

37
5 The teams assessment of the social relevance of the project At the end of the project, the team came to the conclusion that the project has a high social relevance. The fundamental reasons are that since the world is in high demand for energy, more oil recovery, as seen in the result of the project, is desirable because it means energy abundance for society’s use.
The increased oil recovery discovered at the end of the project means better revenue for Statoil in particular and the society at large.
Proposal as to how the project can be followed up on: The work done in the project cannot be said to be exhaustive hence the need for a follow up on it.
The following are the ways this could be done:
• Studies on core samples and well logs is required for better correlation with seismic data
• More simulation runs should be made to find where more wells could be placed for more recovery
• Electrical mapping should be used to ascertain oil bearing formations • The model could be improved to include oil and water and not just water only. This
would enable us to find how much oil can actually be recovered so that better economic analysis could be done.
• Other IOR methods could be used e.g. use of surfactant flooding, WAG, Polymer flooding etc.

38
6 References
1. Statoil, Structural Geology on Gullfaks (powerpoint presentation). 2011, Statoil. 2. Ivar B. Ramberg, I.B., Arvid Nøttvedt Landet blir til - Norges Geologi. 2007: Norsk
Geologisk Forening 3. StatoilHydro, Reservoar management plan for the gullfaks field and gullfaks satellites
2007. 4. Tveitera, L.K., Email about communication in the Beta Ridge. 2011. 5. K.Bjørlykke, T.N., M.Ramm, G.C.Saigal, Diagenetic processes in the Brent Group
(Middle Jurassic) reservoir of the North Sea. Geological Society London - Special Publications, 1992.
6. J. Hesthammer, M.L., H. Fossen, Use and abuse of seismic data in reservoir characterisation. Marine and Petroleum Geology, 2001.
7. Rasoul Sorkhabi, Y.T., The Place of Faults in Petroleum Traps. AAPG Special Volumes, 2005.
8. Childs, K.e.a., Multiple fault strands effect on flow unit connectivity. American universities press, 1997.
9. J. Hesthammer, H.F., Structural geology of the Gullfaks Field, northern North Sea. Universitet i Bergen, Statoil, 1998.
10. Statoil, Discovery Evaluation Report, Well 34/10-47 S/ ST2 & -47A. 2003.
[1, 7-10]

39
7 Appendix 1: Seismic interpretations
A1.1: Seismic line from Gullveig field (Line 2000), Shows well paths for well 34/10: -37, -37 A, K-2H, K-2AH. I have interpreted the fault and three horizons. Notice the scale and throw of the fault. The main fault is mapped in yellow color.

40
A1.2: Seismic line from Gullveig field (Line 2000), Shows well paths for well 34/10: -37, -37 A, K-2H, K-2AH. The main fault is interpreted in yellow.

41
A1.3: This is a contour map of the Ness Reflector in the Gullveig area (made in Seisworks 3D). The fault is cut out with a fault polygon, and the Gullveig field with its closure to the fault, is seen on the left side of the fault.

42
A1.4: Seismic line across the Beta Ridge, South of the Gullveig field (the arrow illustrates the displacement of the intra Ness Fm. Reflector)
A1.5: Seismic line across the Beta Ridge, North of the Gullveig field (the arrow illustrates the displacement of the intra Ness Fm. Reflector)

43
8 Appendix 2: Project part A
Expert in teamwork (TPG 4851)
Gullfaks Project, Part A
Production and pressure behaviour analysis: A case study of the Beta Ridge in the Gullfaks Field
Spring 2011
for
Group 2: Okorie Agwu, Guowen Lei, Thorstein Otto Viseth, Joakim Martens, Trygve Elind

1
Contents 1 Introduction ........................................................................................................................ 2
1.1 General introduction to The Beta Ridge ...................................................................... 2
1.1.1 The Gullveig Field ...................................................................................................... 3
1.1.2 The Gulltopp Field ...................................................................................................... 3
1.1.3 The Rimfaks and Skinfaks Fields ................................................................................ 3
1.1.4 The Tordis Field .......................................................................................................... 3
1.1.5 The Vigdis Field .......................................................................................................... 3
1.2 Statement of the problem ............................................................................................. 4
1.2.1 Objectives of the project ............................................................................................. 4
2 Data analysis ...................................................................................................................... 5
2.1 General method used for data analysis ........................................................................ 5
2.2 Assumptions made in the analysis ............................................................................... 6
2.3 Uncertainties ................................................................................................................ 6
3 Results ................................................................................................................................ 7
3.1 Production and injection analysis (question 1) ........................................................... 7
3.2 Average reservoir pressure depletion analysis (question2) ......................................... 7
3.3 Reasons for differences between calculated and measured pressure (question 3) ...... 7
3.4 Recovery factor calculations (question 4a) ................................................................. 8
3.5 Interference of fields with each other (question 4b) .................................................... 8
3.6 Sensitivity analysis ...................................................................................................... 8
4 Summary .......................................................................................................................... 12
4.1 Conclusion ................................................................................................................. 12
4.2 Recommendations ..................................................................................................... 12
5 References ........................................................................................................................ 13

1 Introduction
General introduction to The Beta Ridge 1.1The Beta Ridge is essentially a group of fields/reservoirs in the western part of the Gullfaks Main Field in the North Sea. These fields, often called the Gullfaks Satellites, include one or more of the following: Gullfaks South field, Gullveig field, Rimfaks, Skinfaks, Gulltopp, Tordis, Gullfaks West, Vigdis etc.
Figure 1 shows the structure of the beta ridge with its component fields indicated with a red ring.
Figure 1: The beta ridge [1]

1.1.1 The Gullveig Field The Gullveig field consists of a westerly dipping fault block along the beta ridge, north of Rimfaks and west of Gullfaks south. Top reservoir (Brent group) lies at approximately 2,400m MSL. The reservoir is delineated to the east by a large easterly dipping fault with a NNE-SSW orientation.
Good seismic and core data shows that Gullveig lies in an area with few faults [1]. The following are the production and injection wells in the Gullveig field: K-2H/AH,K-4H(Brent formation) and K-2H (Statfjord formation).The Gullveig Brent reservoir gets support from surrounding water volumes rock compaction and expansion of hydrocarbon zone. The field essentially contains oil and a gas cap.
The Gullvieg field is developed by subsea wells.
1.1.2 The Gulltopp Field The Gulltopp structure is located along the beta ridge and lies 3-4 km north of Gullveig .The Gulltopp structure can be ascribed to an eastward protrusion of the main beta ridge fault. This reservoir is assisted by gas lift when pressure declines. The field essentially contains oil, and is drained by a 10 km. well from Gullfaks A.
1.1.3 The Rimfaks and Skinfaks Fields These structures are shallower than the Gullfaks south structure with top reservoir at approximately 2600m-2700m MSL. Rimfaks lies on a rotated westerly dipping fault block and is delineated by three large faults to the west, north and east. The faults in Rimfaks are oriented in the N-S, NW-SE and E-W, with the N-S faults dominating. The pressure data and production history indicate good reservoir communication in the Rimfaks Brent group reservoir. This is due to the fact that there is little internal faulting and that the sands have a continuous lateral distribution and good cross fault communication. There is good communication within each segment in the Rimfaks Brent, but limited communication between the segments due to the larger fault throw at segment boundaries.
Both Rimfaks and Skinfaks fields have initial oil and gas cap present.The Skinfaks field is developed by subsea wells.
1.1.4 The Tordis Field The Tordis field consists of four reservoirs: Tordis, Tordis Osr, Tordis Sørøst,and Borg. The STOOIP in the Tordis field is estimated to be about 117.8MSm³. The recovery was in 2005 was about 45.6%. The projected IOR to 2020 is about 65. This field is developed by subsea wells.
1.1.5 The Vigdis Field Vigdis is an oil field located between the Snorre and Gullfaks fields in the Tampen area in the northern part of the North Sea. The sea depth in the area is 280 metres. The field comprises several discoveries, and has been developed with subsea templates connected to Snorre A.

The wellstream is routed to Snorre A through two flow lines. Injection water is transported by pipeline from Snorre A. Oil from Vigdis is processed in a dedicated processing module on Snorre A. The PDO for Vigdis Extension, including the discovery 34/7-23 S and adjoining deposits, was approved on 20.12.2002.
The reservoir in the Vigdis Brent deposit consists of Middle Jurassic sandstones of the Brent Group, while the Vigdis Øst deposit has reservoirs in Lower Jurassic and Upper Triassic sandstones of the Statfjord Formation. The Borg Nordvest deposit has reservoir in Upper Jurassic intra-Draupne sandstones. The reservoirs are at a depth of 2 200 – 2 600 meters. The quality of the reservoirs is generally good.
Production is based on partial pressure maintenance using water injection. Parts of the reservoirs are affected by the pressure blowdown of the Statfjord field, so water injection is used to counteract the effect.
Statement of the problem 1.2The problem in the BETA Ridge is essentially related to production with reservoir depletion and aquifer support. Here Improved Oil Recovery (IOR) measures have to be evaluated and concrete recommendations are required based on ideas supported by technical analysis.
1.2.1 Objectives of the project The basic objectives of this work are:
• Analyze production with pressure depletion and aquifer support and see how this affects the recovery in the BETA Ridge.
• Calculate the average reservoir pressure depletion at the Beta Ridge. • Make comparisons of the calculated reservoir pressure depletion at the Beta
Ridge, with the measured reservoir depletion in wells A-32 drilled to the Beta Ridge and draw conclusions on why they differ.
• Make evaluations of the recovery factors for the fields to date. • Find out how the different fields interfer with each other. • Find out the expected recovery factor of the Beta Ridge over its full
production life.

2 Data analysis
General method used for data analysis 2.1The general method used for data analysis involving oil and gas production is the Material Balance Equation (MBE). A breakdown of the material balance formula is shown below:
Amount of fluids present Amount of fluids Final amount of fluids in the reservoirinitially (st.vol) produced (st. vol) remaining (st. vol)
− =
(1)
The Complete Black Oil MBE is given as
2 ,( ) ( )O g f w e i i gF Np E mE E W W G B= + + + + + (2)
Where;
Production terms:
( )p o p s g p wF N B R R B W B = + − + (3)
Oil and solution gas expansion terms:
2 2 1 2 2( ) ( )o O O so so gE B B R R B= − + − (4)
Expansion of the gas cap:
21
1
gg O
g
BE B
B
=
(5)
Rock and water compressibility / Expansion terms:
1, 1(1 )
1r w w
f w Ow
C C SE m BS
+= +
− (6)
However, the Material Balance would be used later for the sensitivity analysis of this project; hence the formula used specifically for the pressure depletion analysis is given by:
tV V C P∆ = ∆ (7)
Where: ΔV = Injected volume- produced volume,
ΔP is pressure depletion,

Ct = Total Compressibility,
V = Volume in place.
Assumptions made in the analysis 2.2The following were the assumptions made in the analysis of the production with pressure depletion in the Project:
• the oil, gas and water volumes in the ridge was converted to water volumes • the actual reservoir volume of the lies between 5E9 Sm3 and 10E9 Sm3 • the fields that make up the ridge were assumed to be just one field with the
parameters of a chosen field taken as representative values for the Beta ridge • the initial pressure of the Beta Ridge is 380 bars • the total compressibility of the system lies between 4.5E-5 and 9E-5 bar-1
Uncertainties 2.3The following were taken as uncertainties in the analysis:
• Gas cap size • Pressure and temperature changes due to injection • Aquifer support • Reservoir properties heterogeneity • Communication between fields • The main driving mechanism for the Beta Ridge

3 Results
Production and injection analysis (question 1) 3.1Production was analyzed in the Beta Ridge by summing all the volumes produced in each field for different years. The volumes had already been converted to reservoir conditions as given in the data base. The outflow volume from the Beta Ridge to the main field was added to the production volumes. This gave a total of 804263 Sm3/day
The injected volumes were taken as inputs to the system while the produced volumes were taken as output volumes. This gave a total of 677551 Sm3/day.
The injected volumes were then taken away from the produced volumes to get the volume change in the system. This amounted to 126712 Sm3/day.
Since this volumes were recorded as Sm³/day, then it was multiplied by 365 to get it to annual volumes. Hence the volume change at the Beta Ridge per year was calculated to be 46,249,880 Sm3.
Average reservoir pressure depletion analysis (question2) 3.2From the results obtained from the volume change and with estimated volumes of the system, as well as the assumed compressibility value of the system, the pressure decline for the Beta Ridge was established by dividing the volume change by the product of the assumed volume of the ridge and the assumed compressibility factor of the ridge.
This is given by the relation: t
dVdPV C
=
(8)
This gave approximately 236.2 bar.
Reasons for differences between calculated and measured pressure 3.3(question 3)
The fundamental reasons for the differences in reservoir pressure in the calculated and measured pressure include:
First, geological factor: There are 6 satellite fields, with some distance to each other. The wells in each field did not start production at the same time: Tordis field started production in 1994 while the Gullveig field started production in 1998. This means that if the formations in the ridge are connected it will take less time to influence each other. If the formations are not connected, the observed pressure data cannot represent the real pressure data of the BETA ridge. In our material balance analysis we assume that each of fields communicates with each other and the production of one field will influence the other field. The presence

or absence of formation communication may therefore be the main reason for this difference.
Secondly, the data used for the analysis is converted from oil, water and gas to water volumes. In addition the injection- data suggest there is leakage from Gullfaks main field. All of this is based on simulation. In this processing, the obtained data for material balance is not exact.
All in all, there are two main reasons for the difference between the calculated and the measured pressure. Firstly the measured reservoir depletion in Wells A-32 cannot represent the whole reservoir pressure of BETA. Secondly the data used for calculation is based on the assumption of accurate leakage from Gullfaks main field and the conversion of oil and gas volumes to water.
Recovery factor calculations (question 4a) 3.4It was quite difficult to calculate the recovery factor for each field due to the fact that data on the actual oil in place for each field was not found. Besides, the volumes as used in the other calculations is a combination of oil ,water and gas volumes and it would quite be irrational to use this volumes in calculation of recovery factor since we just need volume of oil in place.
Interference of fields with each other (question 4b) 3.5There are real interferences of each field that make up the Beta Ridge with each other as well as with the main field. For instance, due to the differences in structure and locations of each of these fields, the pressure in the Gullfaks west may be strongly influenced by production in the Tordis and Gullveig fields.
Also, the outflow from the system to the Gullfaks main field makes it formidable to conclude that the Beta Ridge components interfere with each other.
Sensitivity analysis 3.6Sensitivity analysis (SA) is the study of how the variation (uncertainty) in the output of a mathematical model can be apportioned, qualitatively or quantitatively, to different sources of variation in the input of the model. It is a technique for systematically changing parameters in a model to determine the effects of such changes.
The need for the sensitivity analysis arose from the fact that we need to have a better understanding of the effect of each parameter on the calculated average reservoir pressure. As shown in Figure 2, we use this data as reference, and got the volume of reserves is about 6.8×10⁹ Sm3 (Figure 3). In this condition, the lowest reservoir pressure is 252 bar in the year 2011. Changing the volume or compressibility, respectively, we can find the influence of each factor. As it is shown in Table 1, the pressure is the same when we change the volume or Ct in the same variation (Figure 4). This is because in the simplified equation (equation 7), both volume and Ct have the same coefficient. But, comparing the physical meaning of

volume and compressibility of rock and fluid, compressibility is more stable with the lab data or experience. While the volume of reservoir, particularly the water volume is difficult to obtain, and can change in a wide range.
Figure 2: Average reservoir pressure (well testing and simulation)
01.01.199301.03.1995
01.01.199801.04.1999
01.01.200101.07.2002
01.01.2005
260
280
300
320
340
360
380
400
Tryk
k (ba
r) re
f. 26
00 m
SVD
MHN
Tarbert2/3
Tarbert1
Ness3
Etive/Rannoch
Tarbert 2/3 - MDT
Tarbert 1 - MDT
Ness3 - MDT
Etive/Rannoch - MDT
Trykk i Gullveig Brent Simulerte reservoartrykk og målte MDT formasjonstrykk
K-4H MDT
K-2AH MDT
34/10-37AMDT
Produksjonstart Tordis
Produksjonsstart Gullveig

Figure 3: Reservoir pressure depletion with time (Volume= 6,8*109 sm3, Ct=9*10-5)
Figure 4: Reservoir pressure depletion with time (with different volume assumptions)
200,00
220,00
240,00
260,00
280,00
300,00
320,00
340,00
360,00
380,00
400,00
1982.2.181987.8.111993.1.311998.7.242004.1.142009.7.62014.12.272020.6.182025.12.92031.6.1
Pres
sure
(bar
))
Time
200,00
220,00
240,00
260,00
280,00
300,00
320,00
340,00
360,00
380,00
400,00
1982.2.181987.8.111993.1.311998.7.242004.1.142009.7.62014.12.272020.6.182025.12.92031.6.12036.11.21
Pres
sure
(bar
)
Time
1.00E+105.00E+09

Table 1:Table 1 Sensitivity analysis with volume and Ct Variation Volume Pressure Ct Pressure(Ct)
+50% 50.00% 1.02E+10 294.6 50.00% 1.43E-
04 294.6
+40% 40.00% 9.53E+09 288.5 40.00% 1.30E-
04 288.5
+30% 30.00% 8.85E+09 281.5 30.00% 1.19E-
04 281.5
+20% 20.00% 8.16E+09 273.3 20.00% 1.08E-
04 273.3
+10% 10.00% 7.48E+09 263.6 10.00% 9.90E-
05 263.6
0 0.00% 6.80E+09 252 0.00% 9.00E-
05 252.0
-10% -
10.00% 6.12E+09 237.7 -
10.00% 8.10E-
05 237.7
-20% -
20.00% 5.44E+09 219.9 -
20.00% 7.20E-
05 219.9
-30% -
30.00% 4.76E+09 197 -
30.00% 6.48E-
05 197.0
-40% -
40.00% 4.08E+09 166.5 -
40.00% 5.76E-
05 166.5
-50% -
50.00% 3.40E+09 123.8 -
50.00% 5.18E-
05 123.8

4 Summary
Conclusion 4.1From the results obtained in the project it is safe to make the following conclusions:
• That the pressure in one part of the Beta Ridge may be strongly influenced by the production in other parts of the Ridge.
• That declining reservoir pressure may be as a result of distance from the injectors. • That oil recovery may drop and water cut may increase due to outflow (leakage) from
the Beta Ridge to the Main Gullfaks field.
Recommendations 4.2Based on the calculations done, we can make the following recommendations to improve IOR on the Beta Ridge:
• Since there is significant pressure decline in the ridge, then the distance between the injectors and the producer wells should be reduced.
• Since significant amounts of water may be produced as a result of leakage of oil to the main field, the ridge should be reperforated and produced higher up in the structure.

5 References
1. StatoilHydro, Reservoir mangement plan for Gullfaks,GF RESU-HF-07 0122. 2007.