Embed Size (px)
Citation preview
1
Expert Report on COVID testing
at the request of Mr. Dominic Desjarlais 1188 avenue Union, 6e étage,
Bureau 626, Montréal H3B 0E5 and Mr. Rocco Galati 1062 College Street,
Lower Level, Toronto ON M6H 1A9
Dr Clare Craig BM BCh FRCPath, Diagnostic Pathologist
with the collaboration of Dr Tanya (Tetyana) Klymenko PhD, FHEA, FIBMS,
Senior Lecturer, Sheffield Hallam University on aspects relating to PCR
Contents
1. Introductory summary
2. What is COVID and what causes it?
3. What COVID tests are available?
4. Advantages and Disadvantages of different tests
5. Diagnosing infectiousness
6. Case Definition for Diagnosis
7. Testing Strategy in a Pandemic
8. How testing can go wrong creating false positive pseudo-epidemics
9. What is PCR?
10. How PCR testing is carried out
11. Manufacturer’ responsibilities
12. Interpretation of PCR test results
13. What causes false positive test results – the broad picture
14. What causes false positive test results - the details
15. The use of confirmatory testing to validate PCR
16. PCR testing errors in COVID testing- overview
17. Evidence of a false positive problem in COVID testing
18. Asymptomatic spread exists as an idea only because of the PCR testing strategy
19. Consequences of current policy regarding the PCR test
20. Mass testing with Lateral Flow tests
21. Effects of variants on PCR testing
22. Interpreting recent synchronous rises in cases
23. Summary

© La Fondation DDLP)(F peuple du libertés et droits des défense la pour Titre du rapport :
Auteure du rapport : Klymenko Tanya Dr & pathologist Craig, Clare Dr Tous droits réservés. Tous droits de traduction et d’adaptation réservés; toute production, reproduction ou publication en totalité ou d’un extrait quelconque de ce rapport par quelque procédé que ce soit, et notamment par photocopie ou, sous une forme matérielle ou numérique quelconque sont strictement interdites sans l’autorisation écrite de l’auteur ou de l’éditeur. Il est également interdit d’exécuter, de communiquer ou de présenter l’ouvrage en public sans avoir obtenu au préalable l’approbation de l’auteur ou de l’éditeur.
1re version, Mai 2021, réalisée au Québec
Expert testing VIDCO on Report
Pour [email protected] au écrivez-nous FDDLP, la avec communiquer
2
1. Introductory summary
1.1. COVID-19 (hereinafter “COVID”) is an acute respiratory infection caused by the virus
SARS-CoV-2 (Severe Acute Respiratory Syndrome-Coronavirus-2). There are a number of
tests to diagnose COVID, but PCR testing is the one used to determine case numbers. It is
our opinion that there are many issues with PCR testing which leads to inflation of the
case numbers:
1.1.1. issues with the strategy for testing, including the definition of a case;1
1.1.2. emphasizing speed and volume of testing over quality;
1.1.3. choosing to prioritize finding every possible case over ensuring the PCR positive
results are definite cases.
1.2. Regarding the way testing has been carried out there are issues with:
1.2.1. PCR as a diagnostic test in general;
1.2.2. this specific PCR test;
1.2.3. the fact that the results are being interpreted to label as cases numerous
people who are not infectious;
1.2.4. lack of quality controls;
1.2.5. total absence of confirmatory testing.
1.3. False positive pseudo-epidemics have previously been caused by PCR testing. This is
where the illusion of an epidemic occurs due to erroneous test results. When these
events have occurred in the past those involved have fully believed they were in a fully
fledged epidemic. Even in retrospect, with plenty of evidence that they had been
mistaken, it can be difficult to persuade those who believed it at the time, that they were
wrong. It is our opinion that there are large numbers of false positive results leading to
an exaggerated number of cases and deaths, with both categories including individuals
falsely labelled as having COVID.
1.4. Asymptomatic positives have been misinterpreted because of this testing strategy. There
is minimal to no evidence that people who are asymptomatic, but have tested positive,
can spread disease. It is our opinion that, aside from presymptomatic spread,
3
asymptomatic transmission is insignificant, if it exists at all, and policy should not be
based on studies, largely using modelled data, that have massively exaggerated this risk.
1.5. The inflation of COVID case numbers and the misinterpretation of the significance of a
positive test in an asymptomatic individual together have led to disastrous policy
decisions.
2. What is COVID and what causes it?
2.1. COVID is a disease caused by infection with the virus SARS-CoV-2. A virus is an infectious
agent, but unlike bacteria, it is incapable of replication outside of a cell. Viruses are made
up of replicative material contained in a protein shell. The replicative material can be DNA
or a different nucleic acid, RNA. Human cells work by converting DNA into RNA and then
into functional proteins. The protein shell includes proteins that can bind to the surface
of human cells and allow the virus to enter the cell. Once inside the cell, the virus hijacks
that replicative apparatus, and its RNA will be made into proteins. These proteins form
the viral particles that will enable viral spread. The viral material is replicated repeatedly
creating numerous viral particles and ultimately these virus particles are released to
infect other cells and to be exhaled and infect others.
2.2. A novel virus will spread in an epidemic fashion in a susceptible population. However,
after passing once through the population, the population will reach levels of immunity
that impact on viral spread. This immunity is comprised of the population’s prior
immunity, together with those who developed a new immune response to the novel
virus. After passing once through the population, the virus will become endemic. That
means epidemic spread is no longer a concern. However, a susceptible population
remains and, as with all respiratory viruses, localized outbreaks will be seen each winter.
A seasonal pattern develops with peak contagion mid-winter which is due to seasonal
depression of the immune system rather than increased virulence of the virus, which
remains the same. The virus cannot spread in an epidemic way so interventions are of no
benefit. Every winter, people succumb to respiratory viruses, including occasional young,
previously healthy, individuals. However, no intervention has ever been shown to have
any effect at all on these seasonal deaths from endemic viruses.
4
2.3. By April 2021, there had been 400 deaths per million people worldwide. However,
Canada had had 636 deaths per million. Canada accounts for 0.5% of the World’s
population but has had 0.8% of the world’s COVID cases and 0.8% of the world’s COVID
deaths.2
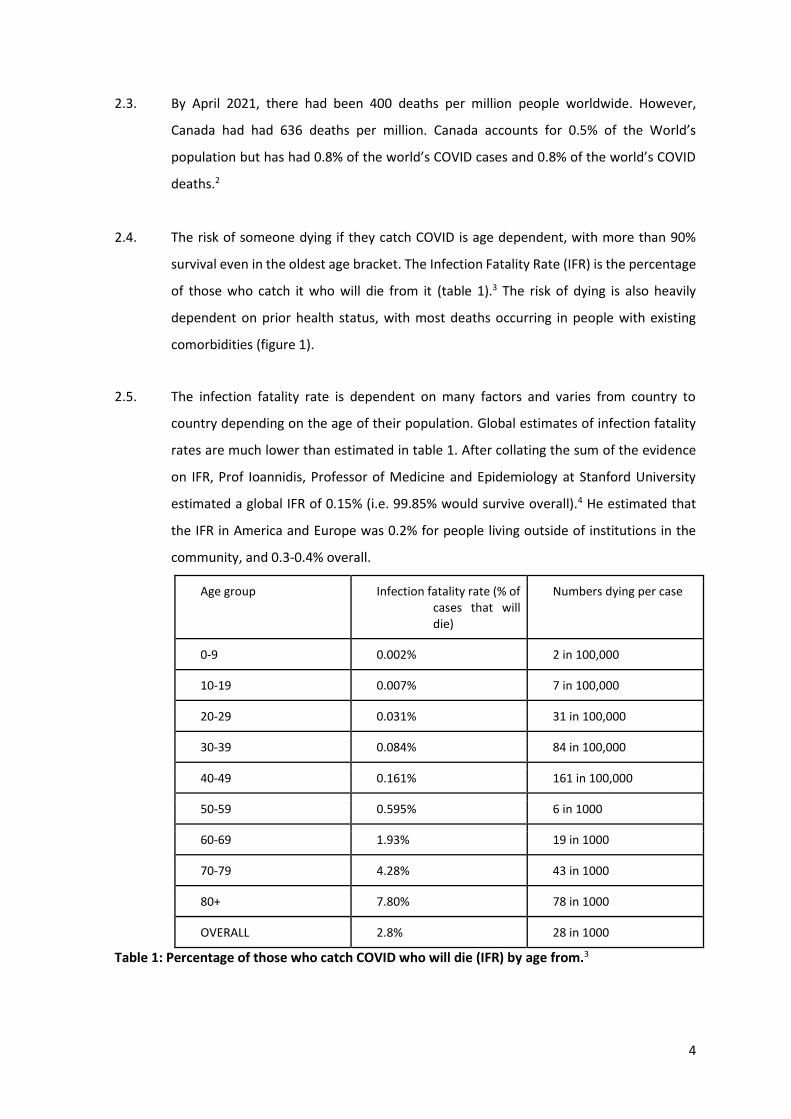
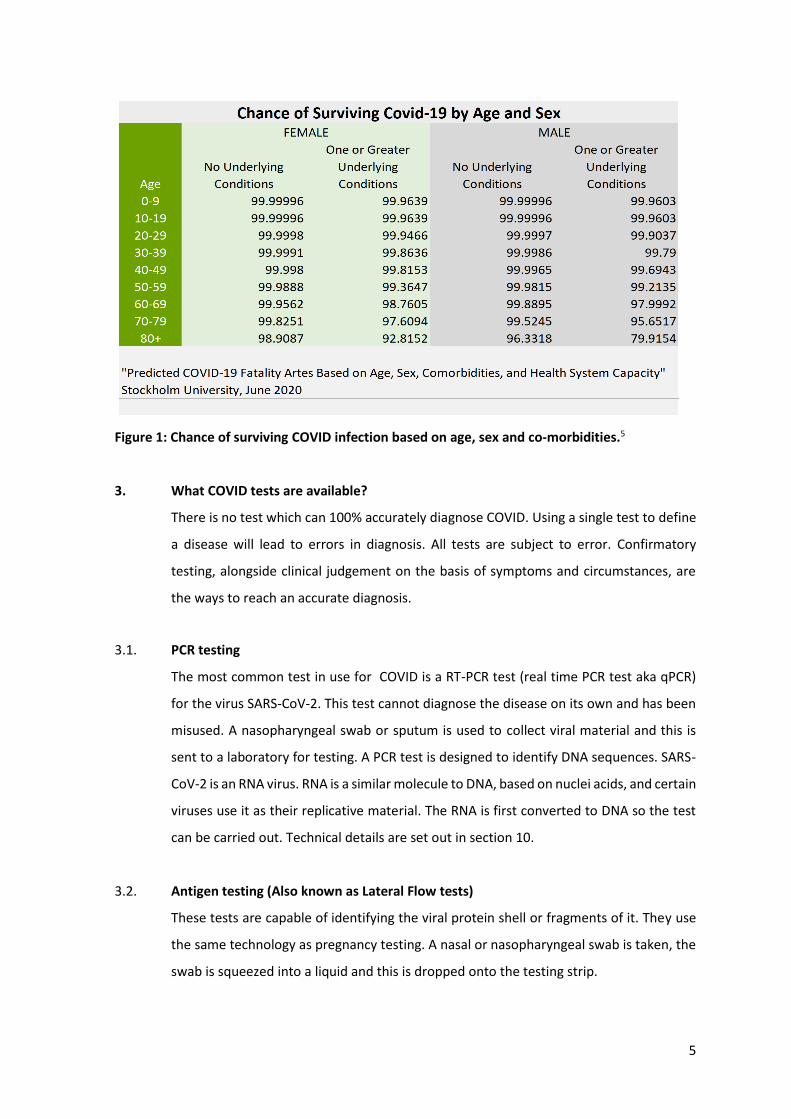
2.4. The risk of someone dying if they catch COVID is age dependent, with more than 90%
survival even in the oldest age bracket. The Infection Fatality Rate (IFR) is the percentage
of those who catch it who will die from it (table 1).3 The risk of dying is also heavily
dependent on prior health status, with most deaths occurring in people with existing
comorbidities (figure 1).
2.5. The infection fatality rate is dependent on many factors and varies from country to
country depending on the age of their population. Global estimates of infection fatality
rates are much lower than estimated in table 1. After collating the sum of the evidence
on IFR, Prof Ioannidis, Professor of Medicine and Epidemiology at Stanford University
estimated a global IFR of 0.15% (i.e. 99.85% would survive overall).4 He estimated that
the IFR in America and Europe was 0.2% for people living outside of institutions in the
community, and 0.3-0.4% overall.
Age group Infection fatality rate (% of cases that will die)
Numbers dying per case
0-9 0.002% 2 in 100,000
10-19 0.007% 7 in 100,000
20-29 0.031% 31 in 100,000
30-39 0.084% 84 in 100,000
40-49 0.161% 161 in 100,000
50-59 0.595% 6 in 1000
60-69 1.93% 19 in 1000
70-79 4.28% 43 in 1000
80+ 7.80% 78 in 1000
OVERALL 2.8% 28 in 1000
Table 1: Percentage of those who catch COVID who will die (IFR) by age from.3
5
Figure 1: Chance of surviving COVID infection based on age, sex and co-morbidities.5
3. What COVID tests are available?
There is no test which can 100% accurately diagnose COVID. Using a single test to define
a disease will lead to errors in diagnosis. All tests are subject to error. Confirmatory
testing, alongside clinical judgement on the basis of symptoms and circumstances, are
the ways to reach an accurate diagnosis.
3.1. PCR testing
The most common test in use for COVID is a RT-PCR test (real time PCR test aka qPCR)
for the virus SARS-CoV-2. This test cannot diagnose the disease on its own and has been
misused. A nasopharyngeal swab or sputum is used to collect viral material and this is
sent to a laboratory for testing. A PCR test is designed to identify DNA sequences. SARS-
CoV-2 is an RNA virus. RNA is a similar molecule to DNA, based on nuclei acids, and certain
viruses use it as their replicative material. The RNA is first converted to DNA so the test
can be carried out. Technical details are set out in section 10.
3.2. Antigen testing (Also known as Lateral Flow tests)
These tests are capable of identifying the viral protein shell or fragments of it. They use
the same technology as pregnancy testing. A nasal or nasopharyngeal swab is taken, the
swab is squeezed into a liquid and this is dropped onto the testing strip.
6
3.3. Antibody testing
Antibodies are produced by the immune system in response to infection and these can
be tested for with a blood sample. Antibodies that will only be present in active or recent
infection (IgM antibodies) and antibodies that will remain present over a longer time
course (IgG antibodies) can be tested separately.
3.4. Viral culture
Swab samples can be taken and used to try and infect cells that are growing in culture in
a laboratory. Viable virus will invade, replicate and then successfully burst open these
cells.
3.5. Whole genome sequencing
Every letter of the genetic sequence present in a sample can be read with whole genome
sequencing. This is only possible for DNA samples so RNA would have to be converted to
DNA first. The resulting sequences of billions of letters are compared with databases of
known human, bacterial and viral sequences to try to allocate each strand of DNA to a
category and decide whether there is sufficient, specific SARS-CoV-2 RNA (converted to
DNA) present to make a diagnosis.
4. Advantages and Disadvantages of different tests
4.1. PCR testing
Advantages:
Numerous genetics and microbiology laboratories carry out PCR testing every day to
diagnose genetic conditions, cancer risk and cancer mutations relevant to treatment and
infectious diseases. The global polymerase chain reaction market size was valued at USD
4.5 billion in 20196 and has grown significantly in 2020. It is usually a reliable test that
allows detection of specific nucleic acid sequences. The test itself is readily adapted to
testing something new.
7
Disadvantages:
Although it is good at correctly identifying genetic material from a virus, it does not detect
whole virus. It is therefore not a good test for infectivity. COVID patients are infectious
for 7-8 days,7 but the person infected can test positive with PCR when they are no longer
infectious. People who have had COVID can test positive with PCR results for 80 days8 or
more, even when they are no longer infected or contagious. This is because after the
infection, when no viable virus capable of infecting others is being produced, there will
remain debris of the viral genetic sequence that cells will continue to reproduce. Patients
who are immune and never have symptoms can test positive. PCR testing also has a
propensity to false positive results creating pseudo-epidemics in the absence of real
disease. PCR tests have to be transported to a laboratory for processing and results take
24-48 hours.
4.2. Antigen testing
Advantages:
Results of antigen testing take only 30 minutes. Because they detect viral particles they
identify actively infective patients and do not detect those who have passed beyond the
infectious phase. The lack of labour and transportation required makes these a cheap
option.
Disadvantages:
These tests have been criticized for missing genuine cases. However, this conclusion can
only be reached by assuming that PCR results never overcall. They do miss a small
proportion of cases and have a low false positive rate too (as does any test).
4.3. Antibody testing
Advantages:
The manufacturers designed these tests using pre-COVID blood donor samples as a
negative control. They therefore are a good way of testing who has developed a new
immune response to COVID, and do not demonstrate who had prior immunity to COVID.
A positive test demonstrates that the patient has developed immunity as a result of a
genuine COVID infection, and was not immune prior to COVID’s arrival.
8
Disadvantages:
Although they are a good test from 7-10 days after symptom onset in severe disease, it
takes longer for the immune response to develop in mild and moderate cases so these
are not useful for distinguishing current infections.
4.4. Viral Culture
Advantages:
Viral Culture is the gold standard test, that is, it is considered the most accurate testthat
other tests should be compared to it in order to determine their accuracy. Only viable
virus capable of infection will be detected using this test.
Disadvantages:
Testing is expensive and requires skilled laboratory staff with laboratories that reach the
optimum biosafety standards.
4.5. Whole genome sequencing
Advantages:
By reading every letter of the sequence,9 it is hard for a different virus to mimic and result
in a false positive.
Disadvantages:
Whole genome sequencing has only been used in clinical medicine recently and, thus far,
has been used to add qualitative information where a diagnosis is already known. It has
never been used as a diagnostic test before and has not been stress tested to understand
the risks of it going wrong or results being misinterpreted. It is expensive. Only samples
with a good quality and quantity of DNA can be tested.
5. Diagnosing Infectiousness
5.1. A meaningful test would identify infectious individuals.
9
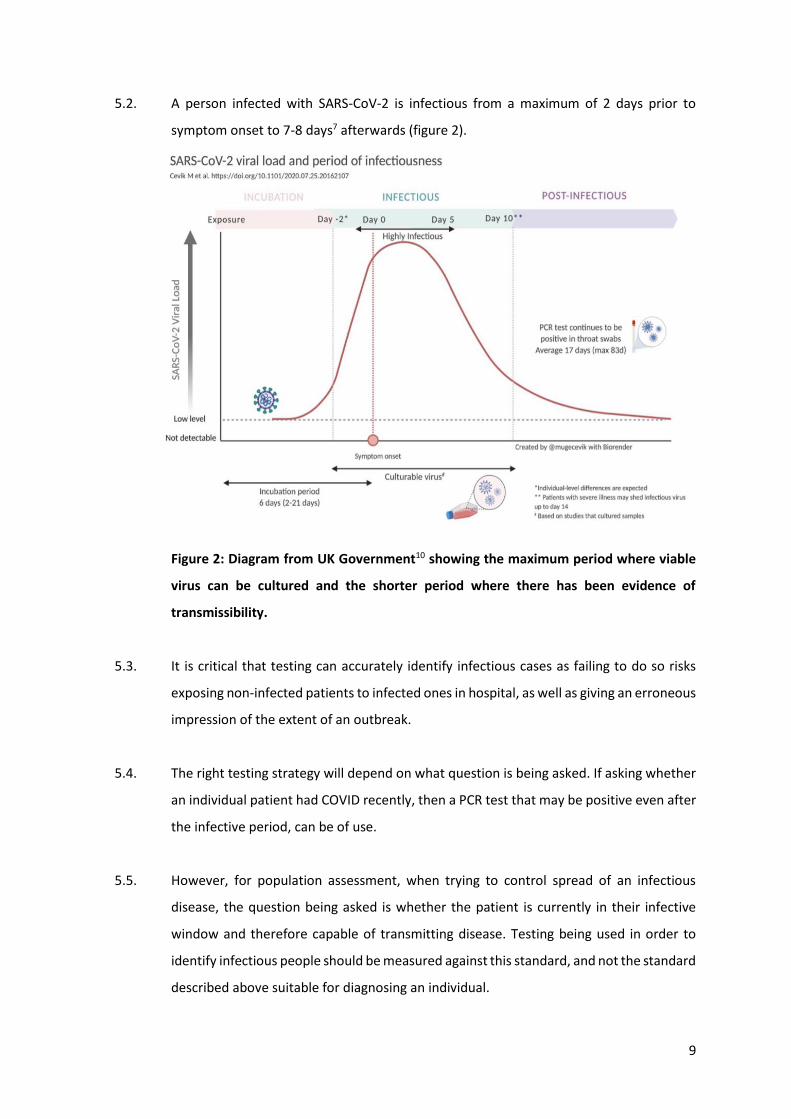
5.2. A person infected with SARS-CoV-2 is infectious from a maximum of 2 days prior to
symptom onset to 7-8 days7 afterwards (figure 2).
Figure 2: Diagram from UK Government10 showing the maximum period where viable
virus can be cultured and the shorter period where there has been evidence of
transmissibility.
5.3. It is critical that testing can accurately identify infectious cases as failing to do so risks
exposing non-infected patients to infected ones in hospital, as well as giving an erroneous
impression of the extent of an outbreak.
5.4. The right testing strategy will depend on what question is being asked. If asking whether
an individual patient had COVID recently, then a PCR test that may be positive even after
the infective period, can be of use.
5.5. However, for population assessment, when trying to control spread of an infectious
disease, the question being asked is whether the patient is currently in their infective
window and therefore capable of transmitting disease. Testing being used in order to
identify infectious people should be measured against this standard, and not the standard
described above suitable for diagnosing an individual.
10
5.6. After an infection, viral debris can remain for some time. The patient is no longer
contagious. In fact, the RNA present is not sufficient to make an intact viral particle.
However, RNA continues to be present and can be shed onto a swab resulting in a positive
test. The average time patients continue to shed RNA for is 17 days after symptoms
onset11 (or between 15 and 20 days). There are reports of shedding continuing for up to
83 days in the upper respiratory tract on occasion8.
5.7. The CDC estimate in section 5.6 is based on assessment of all research on the topic.
However, there are outliers within the research. For example, van Kampen et al found
that <5% were still viral culture positive after 15.2 days.12 (see section 12.12 figure 14)
and Bullard et al found no viable virus after 8 days.13
5.8. We concur with the CDC when they stated:14
“Thus, for persons recovered from SARS-CoV-2 infection, a positive PCR without new
symptoms during the 90 days after illness onset more likely represents persistent
shedding of viral RNA than reinfection.”
5.9. The two references above indicate that someone who has had a COVID infection can
continue to test positive for up to a quarter of a year.8,14 This phenomenon is well
recognised. According to the UK government guidance,15
“Immunocompetent staff, patients and residents who have tested positive for SARS-
CoV-2 by PCR should be exempt from routine re-testing by PCR or LFD antigen tests
(for example, repeated whole setting screening or screening prior to hospital
discharge) within a period of 90 days from their initial illness onset or test (if
asymptomatic) unless they develop new COVID-19 symptoms.”
This is to avoid unnecessary self-isolation of healthy individuals who would need to
withdraw from work.
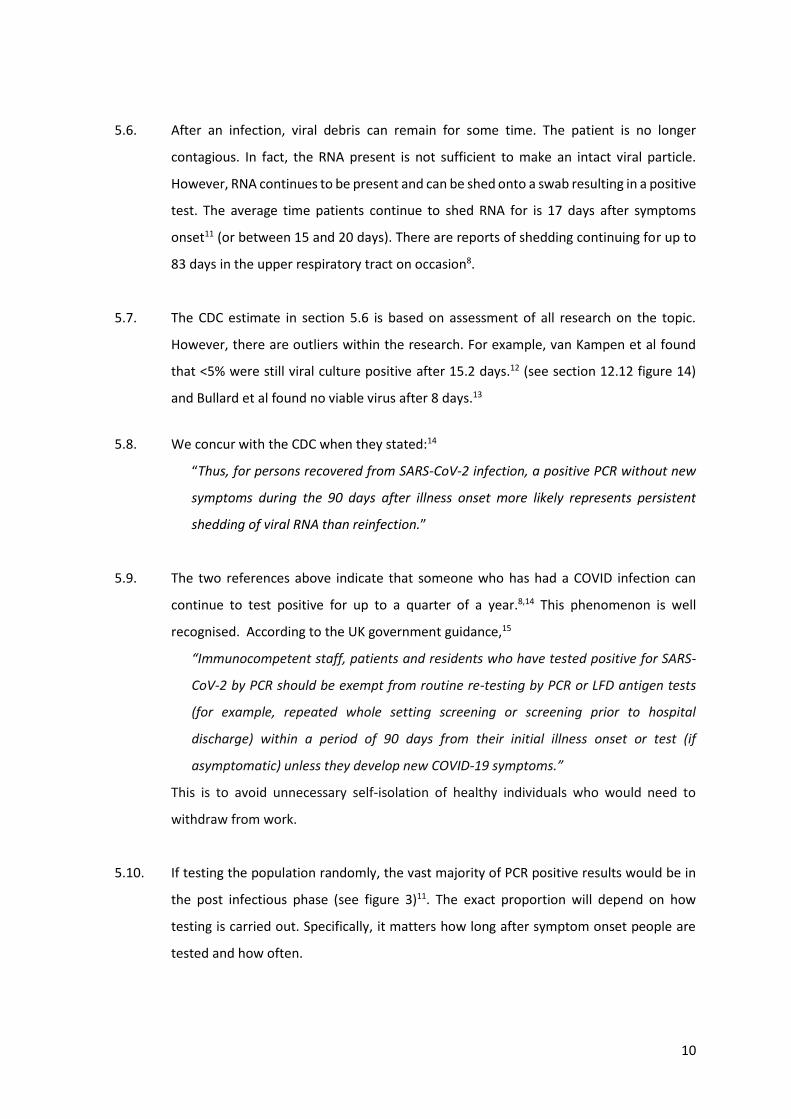
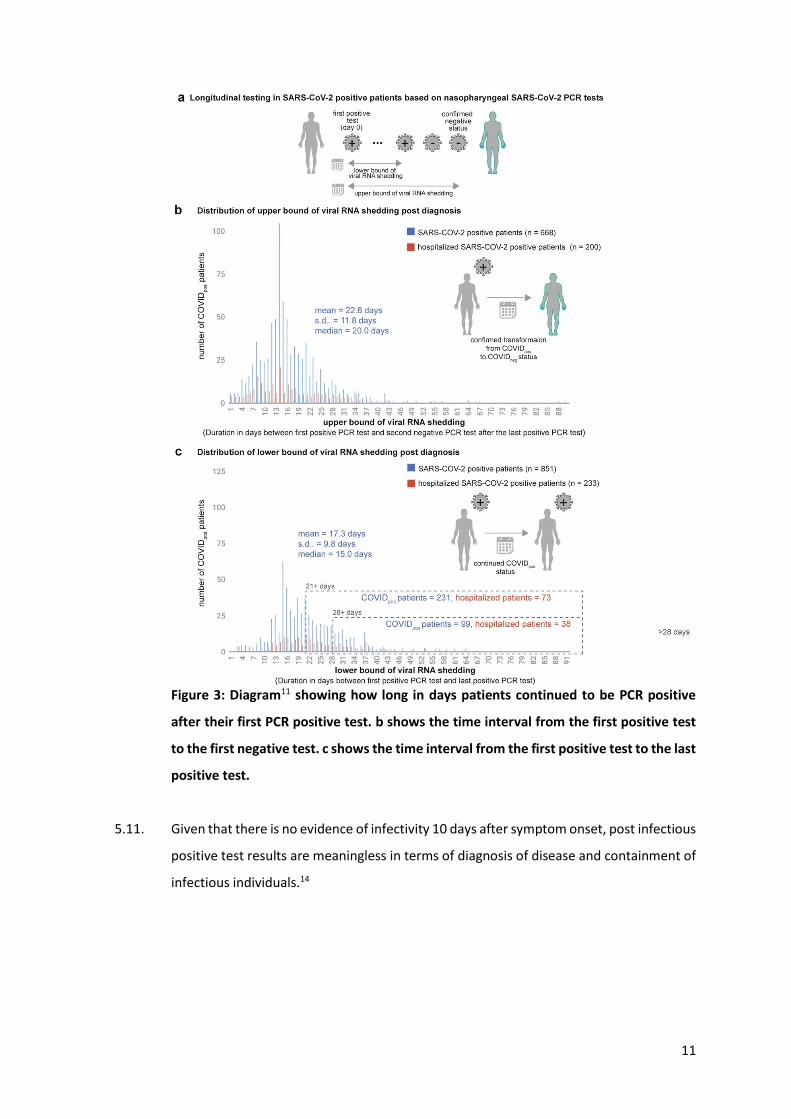
5.10. If testing the population randomly, the vast majority of PCR positive results would be in
the post infectious phase (see figure 3)11. The exact proportion will depend on how
testing is carried out. Specifically, it matters how long after symptom onset people are
tested and how often.
11
Figure 3: Diagram11 showing how long in days patients continued to be PCR positive
after their first PCR positive test. b shows the time interval from the first positive test
to the first negative test. c shows the time interval from the first positive test to the last
positive test.
5.11. Given that there is no evidence of infectivity 10 days after symptom onset, post infectious
positive test results are meaningless in terms of diagnosis of disease and containment of
infectious individuals.14
12
5.12. It is our professional opinion that:
5.12.1. PCR tests are poor at indicating whether a patient is currently infectious.
Antigen testing is a good indicator of whether a patient is currently infectious
(see section 20).16
5.12.2. Post infectious positive results are one cause of false positive results, but there
are many other causes (see section 13).
5.12.3. Post infectious and other false positive results have resulted in confusion over
what it means to test positive and be asymptomatic (see section 18).
6. Case definition for diagnosis
6.1. A disease by definition requires symptoms. Asymptomatic disease is an oxymoron.17 The
Miriam Webster dictionary definition of a disease is
“a condition of the living animal or plant body or of one of its parts that impairs normal
functioning and is typically manifested by distinguishing signs and symptoms.”18
Confusion can arise because in infectious disease people who do not yet have disease can
be about to develop it because they are presymptomatic and may be capable of
spreading it.
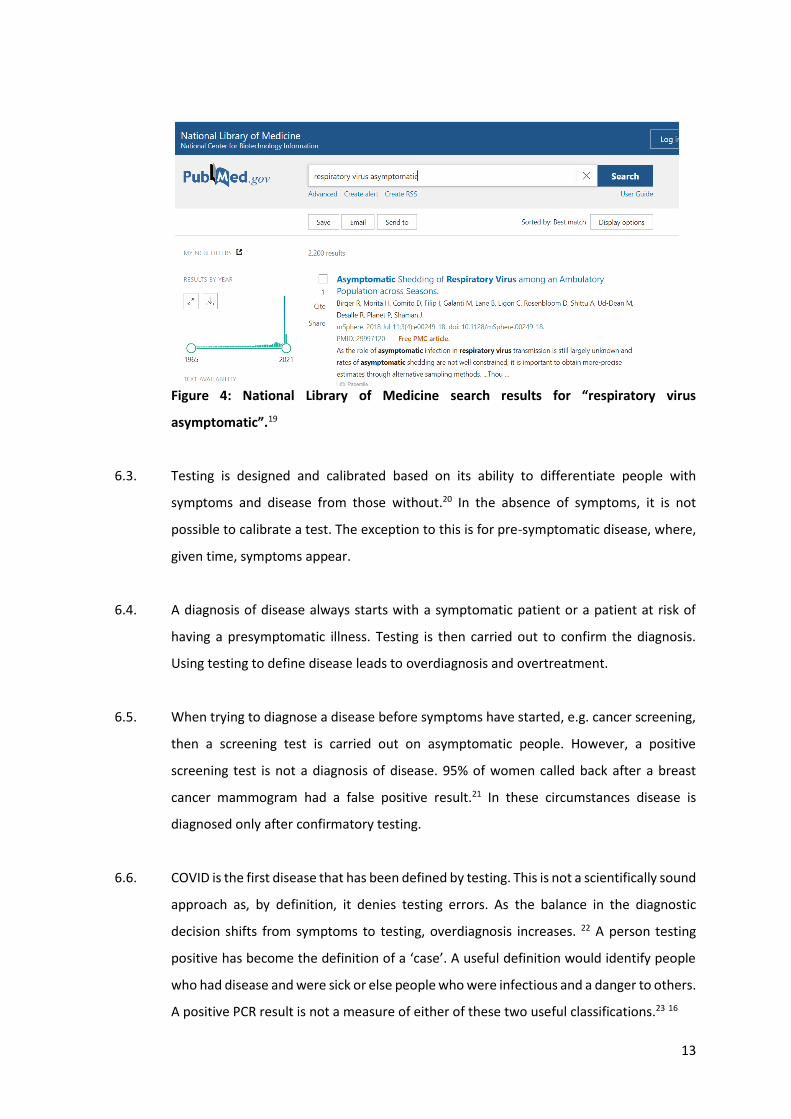
6.2. Of all the scientific publications since 1965 that contain the words “asymptomatic”;
“respiratory” and “virus”, 58% were published in 2020 and 2021. Of the earlier studies,
many defined asymptomatic disease based on PCR results (figure 4).19
13
Figure 4: National Library of Medicine search results for “respiratory virus
asymptomatic”.19
6.3. Testing is designed and calibrated based on its ability to differentiate people with
symptoms and disease from those without.20 In the absence of symptoms, it is not
possible to calibrate a test. The exception to this is for pre-symptomatic disease, where,
given time, symptoms appear.
6.4. A diagnosis of disease always starts with a symptomatic patient or a patient at risk of
having a presymptomatic illness. Testing is then carried out to confirm the diagnosis.
Using testing to define disease leads to overdiagnosis and overtreatment.
6.5. When trying to diagnose a disease before symptoms have started, e.g. cancer screening,
then a screening test is carried out on asymptomatic people. However, a positive
screening test is not a diagnosis of disease. 95% of women called back after a breast
cancer mammogram had a false positive result.21 In these circumstances disease is
diagnosed only after confirmatory testing.
6.6. COVID is the first disease that has been defined by testing. This is not a scientifically sound
approach as, by definition, it denies testing errors. As the balance in the diagnostic
decision shifts from symptoms to testing, overdiagnosis increases. 22 A person testing
positive has become the definition of a ‘case’. A useful definition would identify people
who had disease and were sick or else people who were infectious and a danger to others.
A positive PCR result is not a measure of either of these two useful classifications.23 16
14
6.7. Instead of finding characteristic symptoms and confirming with a test, people with a
positive test were studied to see what symptoms they had. Some had no symptoms and
never developed symptoms. Consequently, the list of possible symptoms became
extensive and the concept of an ‘asymptomatic disease’ (as opposed to presymptomatic)
was formed.24 The Canadian authorities list 18 different symptoms25, involving every
bodily system except the urinary tract and have different regional definitions for
presenting symptoms26:
“Each province and territory has its own list of clinical presentation and these can be
found on provincial and territorial health ministry websites.”
6.8. With regard to infectious diseases, there are four situations in which someone can test
positive but be asymptomatic:
6.8.1. Presymptomatic infection i.e. the incubation period after infection before
symptoms begin. The incubation period lasts on average 5 days and spread is
possible in the two days prior to symptom onset.10
6.8.2. Immune individual. Immunity does not stop viral entry into the respiratory tract.
An immune individual remains oblivious to the infection as their immune system
handles the infection preventing viral replication. Evidence of spread of other
diseases from immune individuals does not exist. The evidence that these
individuals are a source of infectious spread of COVID is lacking (see section 18).
6.8.3. A post infectious individual. For hepatitis, poliomyelitis and Salmonella Typhus, a
post infectious individual can become asymptomatic and continue to be infectious
e.g. Typhoid Mary. For COVID such post infectious individuals are unable to spread
disease (see section 5).
6.8.4. A test error resulting in a false positive test result.
6.9. As testing numbers increased, more testing of asymptomatic people was possible and,
therefore, the importance of symptoms as part of the case definition was diluted.
15
6.10. From the outset of the pandemic, countries were under pressure to promptly publish
daily figures. Centralized reporting and publishing of results meant that input from the
treating doctor could not be considered before cases were declared.
6.11. The media and even the public health bodies have conflated the meaning of the number
of “positive tests”, “cases” and “infections”. Only active infections, during the infective
window are of practical importance. These represent a small proportion of the numbers
reported. Inflated numbers are reported without thought about their meaning in terms
of risk of infecting others.
6.12. In March 2020, the Canadian Government used a symptom based case definition with
testing being used for confirmation.27 At the time, testing was restricted in number and
only used for suspicious cases. This meant that symptoms were a key eligibility criteria
for getting tested, and so were an indirect criteria in PCR positive individuals. The criteria
in March 2020 were:
Probable
A person:
with fever (over 38 degrees Celsius) and/or new onset of (or exacerbation of chronic)
cough
AND
who meets the 2019-nCoV exposure criteria
AND
in whom laboratory diagnosis of 2019-nCoV is inconclusive, not available, or negative
(if specimen quality or timing is suspect) or in whom the laboratory test for
2019-nCoV was positive but not confirmed by the National Microbiology
Laboratory (NML)
Confirmed
A person with laboratory confirmation of infection with 2019-nCoV which consists of
positive real-time PCR on at least two specific genomic targets or a single
positive target with sequencing AND confirmed by NML by nucleic acid
testing.

16
6.13. The current Canadian Government definition of a case is26:
“Probable case
A person who:
1. Has symptoms compatible with COVID-19
and
Had a high-risk exposure with a confirmed COVID-19 case (i.e. close
contact) or was exposed to a known cluster or outbreak of COVID-19
and
Has not had a laboratory-based NAAT (PCR) assay for SARS-CoV-2
completed or the result is inconclusive
or
Had SARS-CoV-2 antibodies detected in a single serum, plasma, or whole
blood sample using a validated laboratory-based serological assay for SARS-
CoV-2 collected within 4 weeks of symptom onset
or
2. Had a POC (point of care) NAAT (PCR) or POC antigen test for SARS-CoV-2 completed
and the result is preliminary (presumptive) positive
or
3. Had a validated POC antigen test for SARS-CoV-2 completed and the result is positive
Confirmed case
A person with confirmation of infection with SARS-CoV-2 documented by:
The detection of at least 1 specific gene target by a validated laboratory-
based nucleic acid amplification test (NAAT) assay (e.g. real-time PCR or
nucleic acid sequencing) performed at a community, hospital, or reference
laboratory (the National Microbiology Laboratory or a provincial public
health laboratory)
or
The detection of at least 1 specific gene target by a validated point-of-care
(POC) NAAT that has been deemed acceptable to provide a final result (i.e.
does not require confirmatory testing)
or
17
Seroconversion or diagnostic rise (at least 4-fold or greater from baseline) in
viral specific antibody titre in serum or plasma using a validated laboratory-
based serological assay for SARS-CoV-2”
Deceased case
A probable or confirmed COVID-19 case whose death resulted from a clinically
compatible illness, unless there is a clear alternative cause of death identified
(e.g., trauma, poisoning, drug overdose).
A Medical Officer of Health, relevant public health authority, or coroner may use their
discretion when determining if a death was due to COVID-19, and their
judgement will supersede the above-mentioned criteria.
A death due to COVID-19 may be attributed when COVID-19 is the cause of death or is
a contributing factor.
6.14. The Quebec case definition (translated from French):28
Confirmed Case:
Detection of SARS-CoV-2 nucleic acids
Death: Compatible clinical manifestations observed before death
AND
detection of SARS-CoV-2 nucleic acids
Case confirmed by epidemiological link:
Clinical symptoms compatible with COVID-19
AND
high risk exposure with a laboratory-confirmed case during its contagious
period,
AND
no other apparent cause
18
Death: Compatible clinical manifestations observed prior to death
AND
High-risk exposure with a laboratory-confirmed case during its period of
infectivity, and no other apparent cause
Probable case:
1. Presence of multisystem inflammatory syndrome in 19 years and younger
OR
Presence of severe respiratory illness in a person hospitalized and on oxygen
therapy
WHO
Has a negative NNAT [PCR] for SARS-CoV-2 following the onset of
multisystemic inflammatory syndrome or severe respiratory illness;
AND
Has a prior history of clinical manifestations compatible with COVID-19 to
document the onset of illness;
AND
Had serology that met pre-established criteria
2. Has a positive antigen test for SARS-CoV-2
WHO
Has clinical manifestations compatible with COVID-19
OR
Has had close contact with a COVID-19 case
OR
Has been exposed to an outbreak setting
AND
Does not meet the criteria for a confirmed case.
Clinical Case:
Clinical symptom consistent with COVID-19 with no other apparent cause.
19
6.15. The use of PCR, by the Canadian Government and the Quebec Ministry of Health and
Social Services to define a case, means the case definition does not meet the WHO
requirement of considering signs, symptoms and contacts before making a diagnosis.29
6.16. The definition of an outbreak is very wide. Anyone attending a large institution would be
at high risk of being included in this definition if they tested positive, as only one other
person must test positive to declare an outbreak. An outbreak is defined as26:
“Two or more confirmed cases of COVID-19 epidemiologically linked to a specific
setting and/or location.”
6.17. The definition of a probable case means that any two individuals who are contacts and
test positive will by definition be cases, even in the absence of symptoms. When carrying
out mass testing in large groups e.g. work places and schools, this is a poor definition as
the risk of two false positive test results will be significant when testing a large
population.
6.18. In Quebec, anyone with a pneumonia can be counted as a clinical case of COVID in the
absence of any other evidence of COVID.28
6.19. The definition of a COVID death includes not only deaths directly caused by COVID but
also any deaths where COVID was a contributing factor. Deaths from influenza were not
defined in the same way and were attributed to the underlying cause even where
influenza contributed to death.30 Defining deaths in this way will lead to concerning
numbers when making comparisons with death data from previous years.
6.20. If there are more than two patients with positive test results in a hospital setting then the
hospital will by definition be an “outbreak”. Anyone dying, untested, in such a hospital of
respiratory disease can be classed as a COVID death.
6.21. In Quebec, anyone dying of a respiratory illness requiring oxygen could be classed as a
COVID death if they have antibodies to SARS-CoV-2.28 The antibodies present may have
developed from an infection at some other point since March 2020.
20
7. Testing strategy in a pandemic
7.1. The Canadian Pandemic flu plan defines a pandemic as a disease resulting in more severe
disease than seasonal influenza, with deaths in the young and healthy:31
“Whatever the pandemic impact, the epidemiological picture is expected to be
significantly different from that of seasonal influenza, in that relatively more severe
disease and mortality will occur in the young and in persons without underlying
health conditions compared to seasonal influenza.
There are important concepts to consider when planning and implementing public
health measures. The measures should be used in combination to provide “multi-
layered protection”, as the effectiveness of each measure on its own may be limited.
Actions should be tailored to the anticipated pandemic impact and the local situation,
supporting the principles of flexibility and proportionality. Some measures, like hand
hygiene and respiratory etiquette, are applicable in all pandemics. Other measures
(e.g., proactive school closures and travel restrictions) might be used only in moderate-
to high-impact situations, as they can be associated with significant societal and
economic costs.
A risk management approach will help weigh the potential advantages of particular
interventions against their disadvantages and unintended consequences. Decisions
about which measures to deploy also raise fundamental ethical challenges. For
example, when considering restrictive measures, it is important to balance respect for
autonomy against protection of overall population health. In such situations, the
principles of proportionality, reciprocity and flexibility are involved, with a view to
safeguarding individual freedom to the extent possible while promoting protection
against the health and societal consequences of influenza infection.
While aggressive measures (e.g., widespread antiviral use and restriction of
movement) to attempt to contain or slow an emerging pandemic in its earliest stages
were previously considered possible on the basis of modeling, experience from the
2009 pandemic has resulted in general agreement that such attempts are impractical,
if not impossible.”
21
7.2. All tests strike a balance between false positive results and false negative results.
7.2.1. Diagnostic testing is never a black and white situation. There is always a grey area and it
matters how that is dealt with. A line must be drawn that determines what test results
will be called positive and what will be called negative. There is therefore a binary choice
either:
7.2.1.1. Sensitive testing: diagnose every possible case accepting that there will be
overcalling of cases that are not real (false positives) or
7.2.1.2. Specific testing: diagnose only definite cases accepting that there will be
undercalling of cases that are real (false negatives).
7.2.2. Neither scenario is ideal, but there are ways to test that will minimize problems. It is also
possible to measure these errors so that there is a full understanding of the risk of
incorrect diagnosis.
7.2.3. There is always a tradeoff between false negatives and false positives. Actions taken to
reduce false negative results will result in an increase in false positive results.
7.2.4. False negative test results have been the focus of testing strategy. However, a false
negative result is unlikely to result in a misdiagnosis, as the patient will still develop the
symptoms characteristic of the disease.
7.2.5. False positive results have the potential to exaggerate the cases and give the impression
of a crisis resulting in public health decisions that have a far greater negative impact on
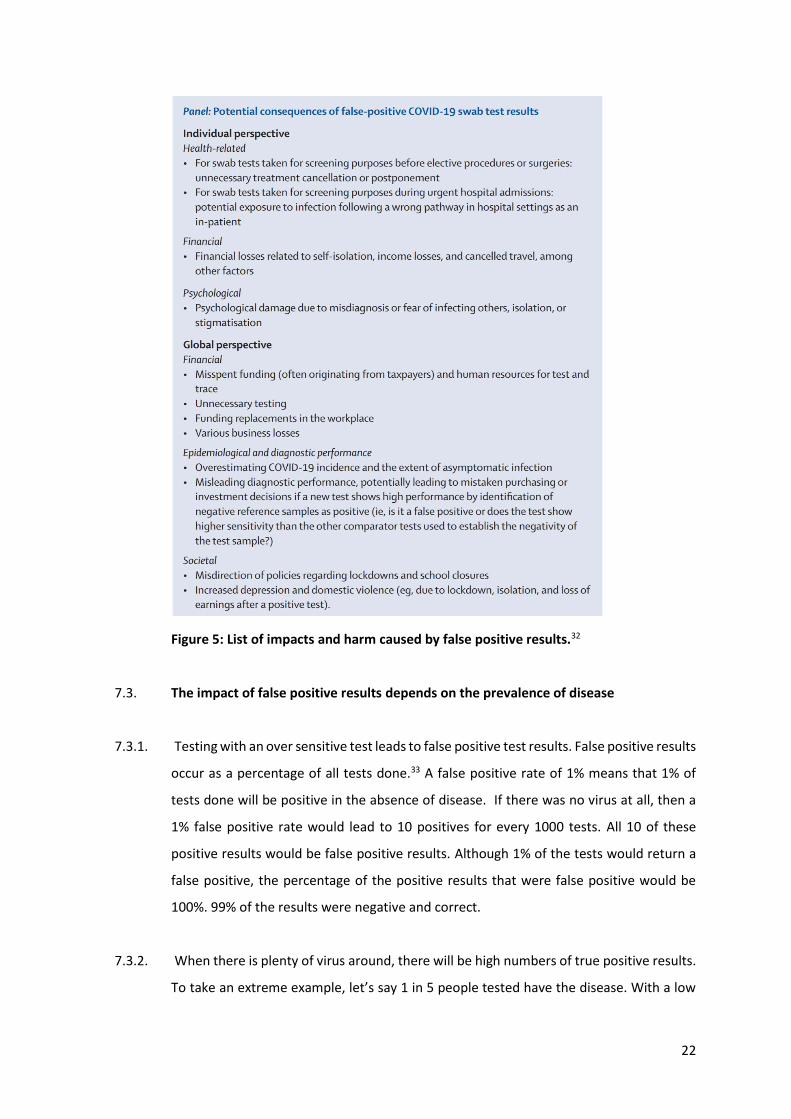
the population. We agree with this list of wide ranging negative impacts of false positive
results published by Surkova et al:32
22
Figure 5: List of impacts and harm caused by false positive results.32
7.3. The impact of false positive results depends on the prevalence of disease
7.3.1. Testing with an over sensitive test leads to false positive test results. False positive results
occur as a percentage of all tests done.33 A false positive rate of 1% means that 1% of
tests done will be positive in the absence of disease. If there was no virus at all, then a
1% false positive rate would lead to 10 positives for every 1000 tests. All 10 of these
positive results would be false positive results. Although 1% of the tests would return a
false positive, the percentage of the positive results that were false positive would be
100%. 99% of the results were negative and correct.
7.3.2. When there is plenty of virus around, there will be high numbers of true positive results.
To take an extreme example, let’s say 1 in 5 people tested have the disease. With a low
23
false positive rate, of say 1%, then for 100 tests, 1 will be false positive and, 20 will be
true positive. The remaining 79 results would be negative. Therefore, of all the positive
test results, only 5% would be false positive.
7.3.3. However, as the number of true positives fall and the proportion of tests done rises,
these ratios can change dramatically.34 For example, if only 1 in 100 of those tested is a
true positive. Out of 100 tests, 1% will be false positive and a further 1% would be true
positive. Therefore, of the positive results, only 50% of them will be true positives.
7.3.4. If testing is increased this effect is amplified. Say the 100 tests in the previous example
were those carried out on people in hospital who the doctors thought had the disease.
This would mean that the proportion that would be true positives would be high. If
instead you tested every hospital patient, the hospital staff, all care home residents and
staff, people wanting to visit care homes and anyone in the community with common
cold symptoms, then the proportion of true positives would fall. In the first example, the
ratio of true positives to false positives would be high, In the second example, false
positive results are likely to far exceed true positive results.
7.3.5. Let’s say we test 10,000 people. We do this by testing people who individually are much
less likely to have disease than patients in the hospital that the doctor thought had
disease. The one person that would have been tested positive, if we had focused testing
in hospitals, still tests positive. We also see, say, 5 further true positive tests from all the
extra people tested who individually were less likely to have disease. That would mean
that the 6 out of 10,000 tests would be true positive, a 0.06% true positive rate. However,
the 1% of tests testing false positive will result in 100 false positive test results. Therefore,
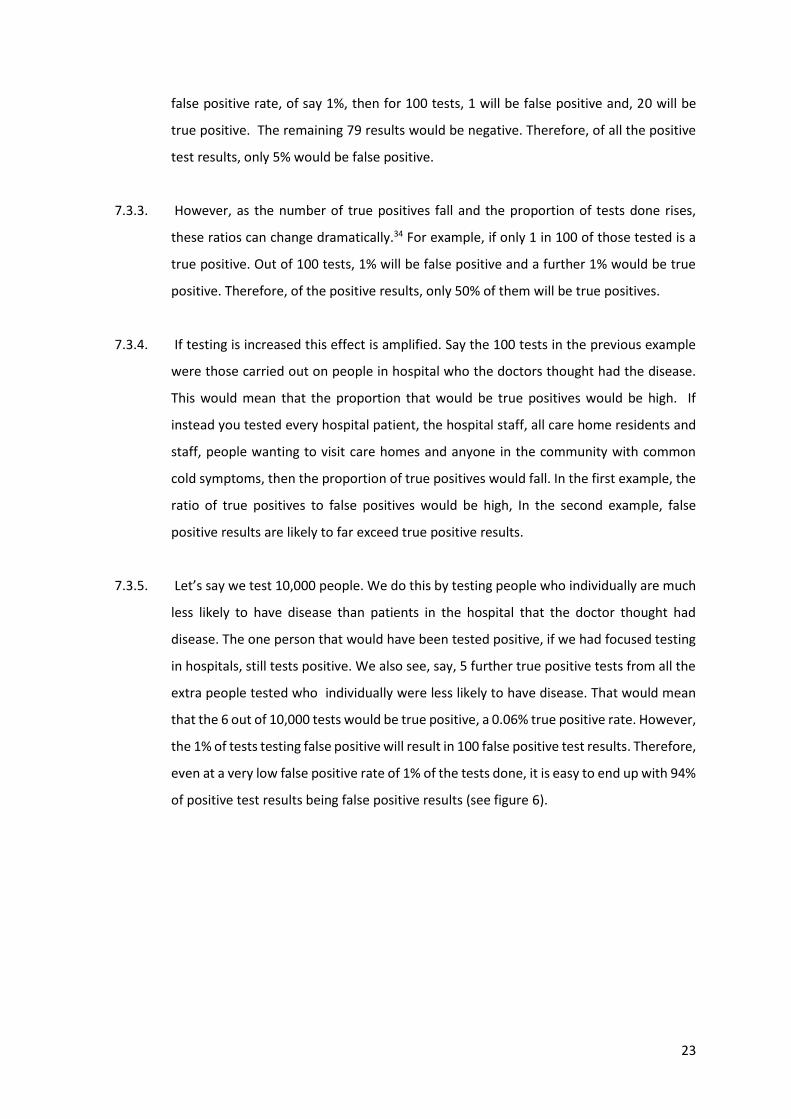
even at a very low false positive rate of 1% of the tests done, it is easy to end up with 94%
of positive test results being false positive results (see figure 6).
24
Figure 6: Low percentage false positive rates (per test carried out) can result in a high
proportion of positive test results being false positive results. A test with a low false
positive result of 1% will result in 44% of positive results being false positives when
testing for an uncommon condition with large testing volumes. The examples given can
be extended further as the more testing the greater the proportion of false positive
tests.
7.3.6. A false positive rate would lead to more false positive results. For example, a false positive
rate of 5% would lead to 500 false positive results per 10,000 tests.
7.3.7. False positive results are a known risk of PCR testing. The WHO states35 that they use PCR
for influenza surveillance, despite the inherent issues with erroneous results:
“The role of RT-PCR in influenza surveillance and diagnostics: Despite inherent issues
such as false positives (caused by contamination, the non-specific hydrolysis of primers
or reduced primer specificity due to virus evolution) and false negatives (caused by
factors such as poor sample quality, inefficient nucleic acid extraction, the presence of
reaction inhibitors or primer mismatch due to virus evolution) RT-PCR is the
established basis of both influenza virological surveillance and diagnostic activities in
a broad range of settings.”
25
7.3.8. We concur with the WHO when they stated,35 in regard to PCR testing for influenza
testing:
“Challenges encountered include the low sensitivity of some real-time RT-PCR kits, and
distinguishing unsubtypable influenza A viruses from false positive results. Issues of
under- or over-sensitivity are inherent challenges in RT-PCR testing and may be one
area in which WHO and WHOCC advice to laboratories could usefully be
strengthened.”
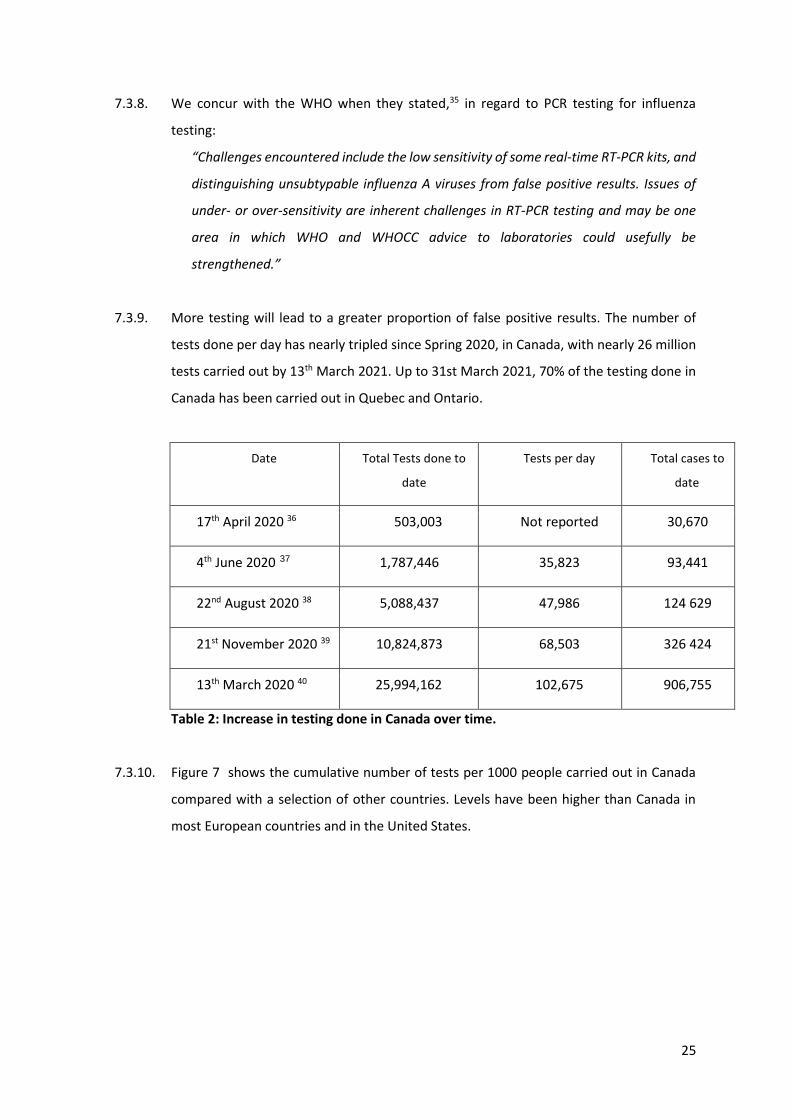
7.3.9. More testing will lead to a greater proportion of false positive results. The number of
tests done per day has nearly tripled since Spring 2020, in Canada, with nearly 26 million
tests carried out by 13th March 2021. Up to 31st March 2021, 70% of the testing done in
Canada has been carried out in Quebec and Ontario.
Date Total Tests done to
date
Tests per day Total cases to
date
17th April 2020 36 503,003 Not reported 30,670
4th June 2020 37 1,787,446 35,823 93,441
22nd August 2020 38 5,088,437 47,986 124 629
21st November 2020 39 10,824,873 68,503 326 424
13th March 2020 40 25,994,162 102,675 906,755
Table 2: Increase in testing done in Canada over time.
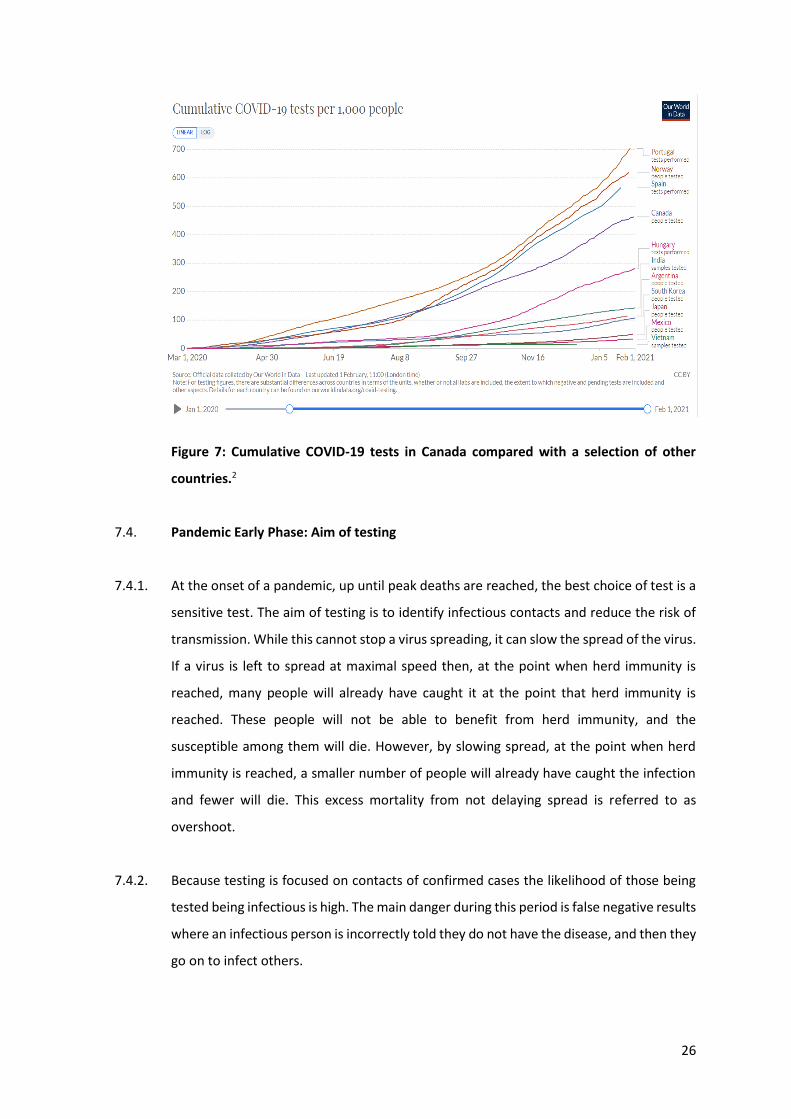
7.3.10. Figure 7 shows the cumulative number of tests per 1000 people carried out in Canada
compared with a selection of other countries. Levels have been higher than Canada in
most European countries and in the United States.
26
Figure 7: Cumulative COVID-19 tests in Canada compared with a selection of other
countries.2
7.4. Pandemic Early Phase: Aim of testing
7.4.1. At the onset of a pandemic, up until peak deaths are reached, the best choice of test is a
sensitive test. The aim of testing is to identify infectious contacts and reduce the risk of
transmission. While this cannot stop a virus spreading, it can slow the spread of the virus.
If a virus is left to spread at maximal speed then, at the point when herd immunity is
reached, many people will already have caught it at the point that herd immunity is
reached. These people will not be able to benefit from herd immunity, and the
susceptible among them will die. However, by slowing spread, at the point when herd
immunity is reached, a smaller number of people will already have caught the infection
and fewer will die. This excess mortality from not delaying spread is referred to as
overshoot.
7.4.2. Because testing is focused on contacts of confirmed cases the likelihood of those being
tested being infectious is high. The main danger during this period is false negative results
where an infectious person is incorrectly told they do not have the disease, and then they
go on to infect others.
27
7.4.3. The risk of false positive results will be real, but can be safely accepted as collateral
damage during this phase.
7.5. Pandemic early phase: Choice of Laboratory strategy
7.5.1. Laboratories are like any other undertaking. Restaurants can only do two of the following
three things: quality food; fast food or cheap food. The same is the case for laboratories,
but we can substitute quality testing, fast results and high volume throughput. During the
early phase of a pandemic, when the death curve is climbing, rapid results and scaling of
volume must be the two priorities. The aim of testing during this phase is to prevent
overshoot. In order to achieve this, infectious contacts must be diagnosed and isolated.
Having timely results is critical for that to be effective. It is also important that the volume
of tests processed is sufficient to enable all those in contact with an infectious case to be
tested. Therefore the quality of the testing is compromised in order to ensure fast high
volume testing.
7.6. Pandemic in early phase: Which is the best test to use for a new virus
7.6.1. There are now many superior tests available to diagnose COVID. However, at the outset
of the pandemic, a new test needed to be developed quickly and scaled up to provide
adequate numbers of tests. RT-PCR (quantitative polymerase chain reaction) testing was
the right choice of test for this role. It is easily adapted to new viruses and can be quickly
scaled up in already existing genetic laboratories.
7.6.2. RT-PCR testing is a way of identifying parts of the genetic sequence. It is designed for DNA
so when testing for SARS-CoV-2 (the virus that causes COVID), the genetic material must
first be converted into DNA. Several parts of the genetic sequence are searched for using
the test and, if adequate sequence is present that appears to be from SARS-CoV-2, then
the test is called positive.
7.6.3. The primary problem with PCR testing during the climb of the death curve, is that it is not
as sensitive as we would like. Swabbing of the nasopharynx does not always result in
there being sufficient viral material on the swab to make a diagnosis. It is generally
28
thought that 20% of real cases will be missed on one PCR test, although it has been
estimated to be as high as 30%.41
7.6.4. However, it was the most sensitive test available at the time, so it was the right choice at
the beginning of the pandemic.
7.6.5. In order to mitigate against this risk every choice made about how testing should be
carried out has been made to maximize the sensitivity of the test – to try and diagnose
any possible case. This inevitably maximizes the chance of a false positive result.
7.7. Pandemic After peak Deaths: Aim of testing
7.7.1. When peak deaths is reached, a change in test is required to prevent a false positive
problem. If testing is switched to a specific test, then cases will be missed and this is
difficult to justify. However, the testing strategy can become more specific by focusing
not on an individual, but on outbreaks. A failure to change testing strategy will result in
problematic false positive results ultimately leading to a false positive pseudo-epidemic
(see section 8).
7.7.2. It is essential that only definite outbreaks are diagnosed. To achieve this, specific testing
must be used that minimizes the risk of a false positive test result. Once a definite
outbreak has been diagnosed, then testing of individuals within that outbreak should be
carried out with more sensitive testing to ensure that all possible individuals are
diagnosed.
7.8. Pandemic After peak Deaths: Choice of laboratory strategy
7.8.1. It is imperative that testing quality is prioritized after peak deaths have been reached in
order to prevent a problem with false positive results. That requires compromising on
either volume or speed or results. Volume can safely be compromised in several ways:
7.8.2. no testing of asymptomatic people unless identified as contacts;
7.8.3. only testing those cases in a potential outbreak that reach strict symptomatic
eligibility criteria;
29
7.8.4. using rapid antigen testing as a gateway to PCR testing (only retesting those that
are positive).
7.8.5. A failure to make this change and to continue with high volume testing has resulted and
continues to result in a false positive problem with PCR testing.
8. How testing can go wrong creating false positive pseudo-epidemics
It is our professional opinion that Canada, including Quebec and Ontario, is in a false
positive pseudo-epidemic. The cases and death statistics have been inflated by false
positive test results, creating the illusion of an epidemic. Being in a false positive pseudo-
epidemic does not mean there is zero COVID, indeed, levels of real COVID would be
expected to rise in the winter, as they do for all endemic respiratory viruses. However,
the false positive problem will cause inflated case and death numbers well in excess of
the underlying true cases and deaths.
8.1. What is a false positive pseudo-epidemic?
8.1.1. A pseudo-epidemic can be created from false positive test results. This can and has
happened with any type of testing, but RT-PCR testing has a particular propensity to
create a pseudo-epidemic because of the degree of faith that doctors have about its
ability to correctly diagnose.
8.1.2. However, the hypothetical argument that RT-PCR testing should not be able to produce
a high false positive rate does not detract from real world cases where this has happened.
When it has happened, no-one has been able to fully explain why it did happen. Given
that RT-PCR induced false positive pseudo-epidemics have been well recorded, the
evidence that they can happen exists. The fact that the popular narrative on how RT-PCR
testing works cannot explain these events does not prevent them happening again. In
fact, they are more likely to happen again because this lack of understanding perpetuates
the myth of how RT-PCR cannot fail.42 43
30
8.2. Examples of false positive pseudo-epidemics
8.2.1. RT-PCR testing for the bacteria Bordetella Pertussis resulted in a false positive pseudo-
epidemic in 2006 in a hospital in Dartmouth,44 New Hampshire. A doctor was suspicious
that his colleague had caught whooping cough so they set up a PCR test for the causative
bacteria (Bordetella Pertussis) in their laboratory. After the PCR test was positive, they
started testing all symptomatic staff and patients in the hospital. This resulted in 15% of
the tests coming back positive and, as more people were tested, the increasing number
of ‘cases’ per day took on the appearance of epidemic spread. One of the doctors insisted
that further testing was carried out on those that were positive and attempts were made
to grow the bacteria in culture in the laboratory. However, not one of the samples was
confirmed with this more refined testing method. Consequently, 100% of the positives
were false positive RT-PCR test results. In retrospect, they concluded that the cause of
the symptoms was the common cold. They speculated about the cause of the false
positive PCR results but the underlying cause was never fully proved or understood.
8.2.2. In 2015 a false positive pseudo-epidemic was described in Colorado45. In this example
there was a genuine outbreak with a first wave, and then a second wave followed due to
false positive test results. Of note, the total positive rate during the real epidemic was 6%
but this rose to 34% during the false positive pseudo-epidemic. Only by cross checking
with antibody testing and bacterial culture did they prove that the PCR testing was
producing false positive results. Investigation in this case found significant sources of
cross contamination45:
“B pertussis DNA was widely detected on surfaces in Clinic A (11/18, 61% of sites
swabbed) and its satellite clinic, A1 (3/9, 33% of sites swabbed), compared with fewer
areas at Clinic B (2/20, 10% of sites swabbed). Large amounts of DNA (Ct value 33.2)
were found on nurses’ laptops in Clinic A and to a lesser degree (Ct value range 35.7–
41.0) on vaccine refrigerator surfaces and examination room provider areas
(worktops, sink areas, glove containers, biohazard bin, stool), patient areas (couch,
toys, chairs), and doorknobs, with higher densities in an examination room without a
sink. At the smaller satellite, Clinic A1, DNA was detected at the nurses’ station,
vaccine refrigerator, and doorknobs (Ct values 39.6–39.9).”
A sample of 39 of the cases from the second wave were investigated more thoroughly
with either antibody testing, bacterial culture or PCR testing at the CDC laboratories. Not
31
one of these cases were confirmed on further investigation, but 17 tested positive for
other respiratory pathogens. The failure to confirm the diagnosis in any of these cases
means that the second wave of this pseudo-epidemic also had a PCR false positive rate
of 100%.
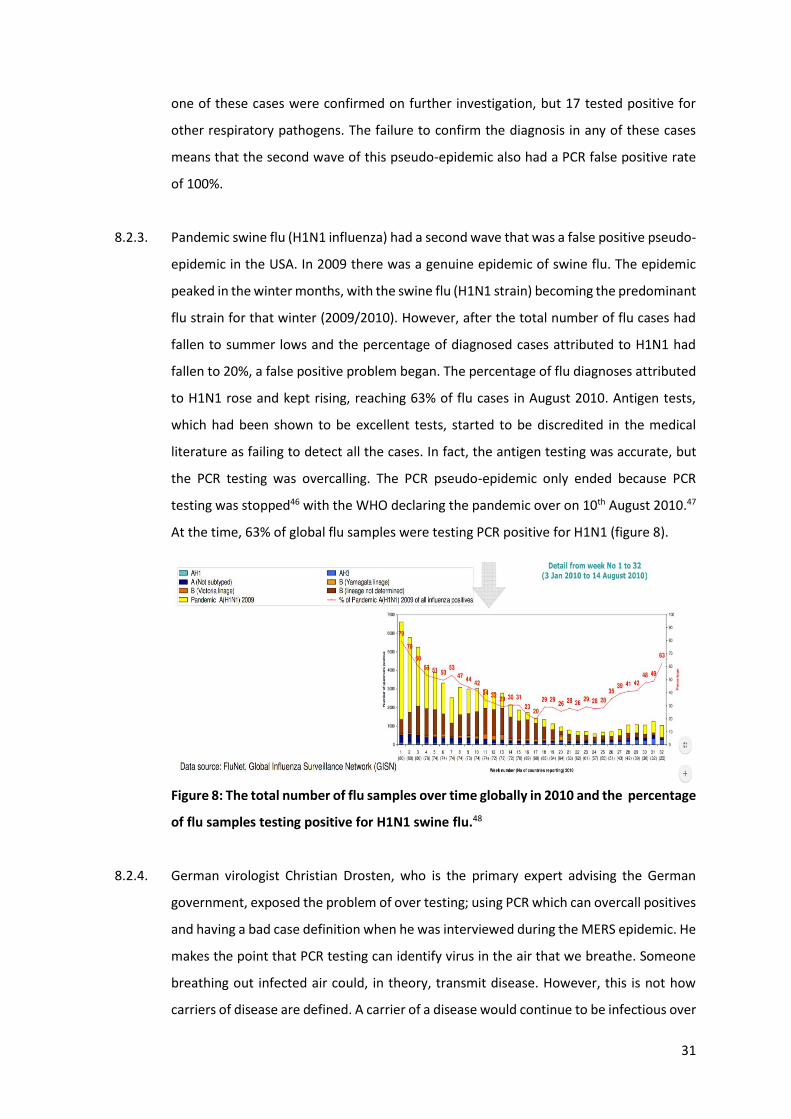
8.2.3. Pandemic swine flu (H1N1 influenza) had a second wave that was a false positive pseudo-
epidemic in the USA. In 2009 there was a genuine epidemic of swine flu. The epidemic
peaked in the winter months, with the swine flu (H1N1 strain) becoming the predominant
flu strain for that winter (2009/2010). However, after the total number of flu cases had
fallen to summer lows and the percentage of diagnosed cases attributed to H1N1 had
fallen to 20%, a false positive problem began. The percentage of flu diagnoses attributed
to H1N1 rose and kept rising, reaching 63% of flu cases in August 2010. Antigen tests,
which had been shown to be excellent tests, started to be discredited in the medical
literature as failing to detect all the cases. In fact, the antigen testing was accurate, but
the PCR testing was overcalling. The PCR pseudo-epidemic only ended because PCR
testing was stopped46 with the WHO declaring the pandemic over on 10th August 2010.47
At the time, 63% of global flu samples were testing PCR positive for H1N1 (figure 8).
Figure 8: The total number of flu samples over time globally in 2010 and the percentage
of flu samples testing positive for H1N1 swine flu.48
8.2.4. German virologist Christian Drosten, who is the primary expert advising the German
government, exposed the problem of over testing; using PCR which can overcall positives
and having a bad case definition when he was interviewed during the MERS epidemic. He
makes the point that PCR testing can identify virus in the air that we breathe. Someone
breathing out infected air could, in theory, transmit disease. However, this is not how
carriers of disease are defined. A carrier of a disease would continue to be infectious over
32
time. We agree with comments which apply not just to MERS but any novel virus
(translated from German).:49
“What are the regional focuses of the disease?
Apart from the statement that the Arabian Peninsula seems to be very badly affected,
little can be said so far. That is why there is so much research going on. The cases in
Europe and the USA can all be traced back to infections in the Arab region. However,
one must also be very clear: This region and especially in Saudi Arabia are currently
the most intensive tests.
Which is not a fault in itself, is it?
Oh well. The fact is that there has been a clear case definition so far, i.e. a strict scheme
that stipulates which patient was reported as a MERS case. This included, for example,
that the patient has pneumonia that affects both lungs. When a whole series of MERS
cases suddenly appeared in Jeddah at the end of March this year, the doctors there
decided to test all patients and the entire hospital staff for the pathogen. And to do
this, they chose a highly sensitive method, the polymerase chain reaction (PCR).
Sounds modern and contemporary.
Yes, but the method is so sensitive that it can detect a single genetic molecule of this
virus. If, for example, such a pathogen flits over the nasal mucous membrane of a
nurse for a day without becoming ill or noticing anything, then it is suddenly a MERS
case. Where previously terminally ill were reported, now suddenly mild cases and
people who are actually very healthy are included in the reporting statistics. This could
also explain the explosion in the number of cases in Saudi Arabia. In addition, the local
media boiled the matter up incredibly high.”
8.3. Faith in PCR testing amongst the medical profession
8.3.1. Most medical practitioners have substantial faith in diagnostic testing and this is usually
well founded. In specialties where testing is problematic, doctors are more familiar with
potential shortcomings and will use a combination of the clinical picture, multiple tests
and repeat testing to ensure they make sound decisions.
8.3.2. However, PCR testing is held in great esteem by medical professionals. It is a relatively
complex test. When carried out perfectly, the false positive rate is low. A UK Government
33
review estimated the false positive rate of PCR testing in general to be between 0.8% and
4.0% of tests carried out, which we agree is a fair estimate for PCR testing generally:50
“An attempt has been made to estimate the likely false-positive rate of national
COVID-19 testing programmes by examining data from published external quality
assessments (EQAs) for RT-PCR assays for other RNA viruses carried out between 2004-
2019 [7]. Results of 43 EQAs were examined, giving a median false positive rate of
2.3% (interquartile range 0.8-4.0%).” 50
8.3.3. Consequently, medical practitioners trust PCR test results absolutely, often discounting
false positive results as a possibility. The knowledge that it is a complex test is used as
evidence that it cannot go wrong. Evidence that it can go dramatically wrong is often not
known about or discounted because it does not fit in with their understanding of how the
testing works.
8.4. Inability to explain how false positive pseudo epidemics have occurred previously
8.4.1. Because a clear consensus explanation of why false positives results occur is not always
forthcoming, the fact they can and do occur is easily forgotten.
8.4.2. The fact that quality PCR testing usually results in a low false positive rate does not mean
that all PCR testing will result in a low false positive rate.
8.4.3. The accepted dogma that PCR testing will always have a low false positive rate, while true
much of the time, does not leave room to explain the false positive rate of 100% in the
examples of the pseudo-epidemics given above. Both of these examples were from well
resourced laboratories with skilled staff who were not working under undue pressure.45,44
9. What is PCR?
9.1. PCR is a biological technique used to amplify DNA.
9.2. It was not invented to be used as a diagnostic test. However, it has been adapted as a
useful tool in confirmatory diagnosis when there is a high suspicion of disease.
34
9.3. Kary Mullis won a Nobel prize in 1993 for inventing the technique. He said he invented it
for laboratory research, but that it was never intended to diagnose disease. That is
because, while it can identify viral material, it cannot distinguish this from viral particles
capable of infection. We agree with his summary when he said:51
“With PCR, if you do it well, you can find almost anything in anybody…. It tells you
something about what’s there. It allows you to take a very miniscule amount of
anything and make it measurable...that’s not a misuse. It’s a misinterpretation... It
doesn’t tell you that you’re sick and it doesn’t tell you that the thing you’ve ended up
with was going to hurt you or anything like that.”
9.4. PCR tests, even if performed correctly, cannot provide information on whether or not a
person is infected with an active, viable, pathogen, capable of infecting others. We concur
with the Swedish Public Health Body’s summary:52
“The PCR technology used in tests to detect viruses cannot distinguish between viruses
capable of infecting cells and viruses that have been neutralized by the immune system
and therefore these tests cannot be used to determine whether someone is contagious
or not. RNA from viruses can often be detected for weeks (sometimes months) after
the illness but does not mean that you are still contagious. There are also several
scientific studies that suggest that the contagion of covid-19 is greatest at the
beginning of the disease period.”
To illustrate, PCR is used in forensic science to amplify residual DNA from, say hair
remains, or other trace materials such that the genetic details of a perpetrator can be
identified long after they have left the scene.
9.5. Even when carried out optimally, a positive PCR test does not mean that the person
tested must be infected with a replicating virus and therefore capable of infecting others.
10. How PCR testing is carried out
10.1. COVID RT-PCR testing has six steps. Steps 2-4 are carried out simultaneously but it is
easier to consider them in order:
1. Reverse Transcription: Any viral RNA present is converted to DNA, meaning
that the sample then contains both the DNA created from this conversion,
mixed up with all the other DNA in the sample, including that from the patient’s
35
own cells, bacteria from the nose and mouth, other viruses and even potentially
from fragments of food.
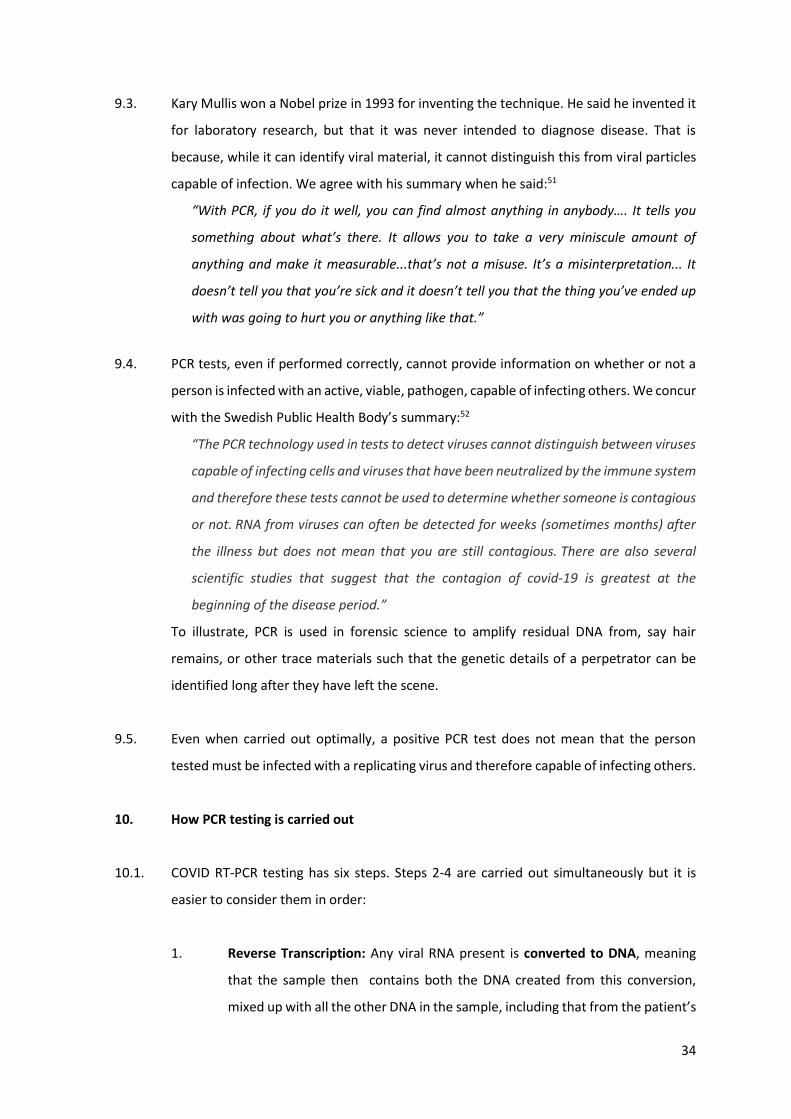
2. First Match and Doubling: The DNA of interest is replicated (or amplified) in a
series of repeated periods of temperature alteration called cycles, where each
cycle doubles the DNA from the last cycle. To ensure only the DNA we are
interested in is doubled, ‘primers’ that match the part of the SARS-CoV-2 virus
sequence being targeted are used to identify the strands to be replicated (figure
9). The primers for the target sequence are roughly 20 letters out of the total
~30,000 letters that make up the whole SARS-CoV-2 genome. The genetic
strands that match these primers and the part of the sequence between the
two primers will be replicated. This is usually 100 bases long.
Figure 9: The first part of the RT-PCR process selectively replicates the DNA
present.
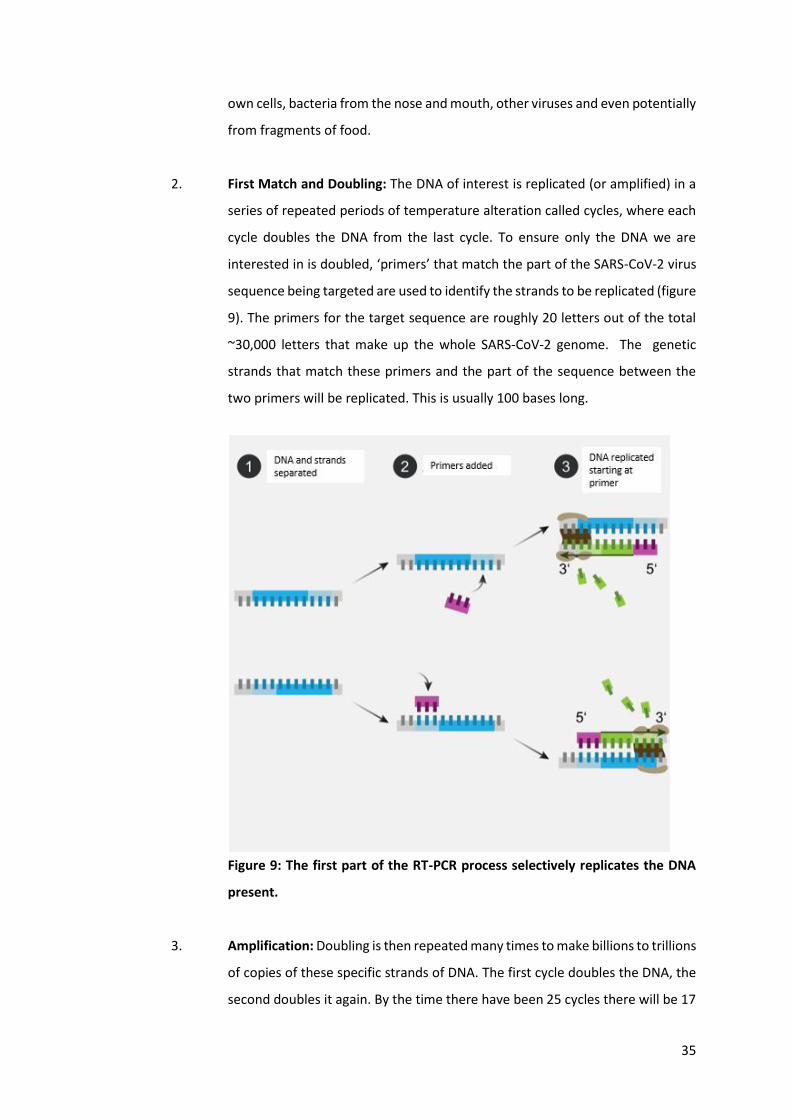
3. Amplification: Doubling is then repeated many times to make billions to trillions
of copies of these specific strands of DNA. The first cycle doubles the DNA, the
second doubles it again. By the time there have been 25 cycles there will be 17
36
million copies of what was there at the beginning. By 30 cycles that will be 535
million and by 40 cycles it will be 550 billion copies. This amplification process
is therefore exponential. (See figure 10)
Figure 10: showing exponential growth from doubling the DNA present.
4. Second Match: The third part of determining if SARS-CoV-2 virus is present
requires a detection event that is facilitated by a third fluorescently labeled
piece of synthetic DNA known as a “probe”. This probe must match a DNA
sequence between the two primers, and as amplification occurs, the
fluorescent probe is turned on in a process known as probe hydrolysis. This
probe hydrolysis is catalyzed by the DNA copying enzyme known as a
polymerase, and it only occurs if both primers and probe match the target
sequence. Since the probe, about 25 letters long, is such a small portion of the
whole SARS-CoV-2 genetic sequence (~30,000 letters), a good test requires two
or three probes to detect separate genes situated in different parts of the SARS-
CoV-2 genetic sequence (figure 11). Each of these probes require their own pair
of primers. All these components of a reaction need to be unique to the genetic
material of the virus and probing multiple locations in the viral genome is
critical. This would minimize the risk of mistaking other DNA present in the
sample (eg from other viruses) for SARS-CoV-2. However, in many cases, it is
not possible to design an assay that would not contain elements with similarity
37
to genetic material of different organisms. This is because the probe and
primers set has to satisfy a number of additional criteria. For example, to avoid
nonspecific binding, both primers have to contain an optimal percentage of GC
content relative to the total sequence. This constraint can lead to a design
where cross-reactivity (binding to the wrong sequence) is possible. This is a well
recognised parameter that needs to be reported.53 Some SARS-CoV-2 assays are
reported to have a potential for cross-reactivity (see section 14.39).
5. Checks against controls: Each test should be run including samples that we
know should test either negative or positive to ensure that the test has worked.
6. Interpretation of results: RT-PCR requires interpretation of a signal for each
target sequence (gene). A judgement must be given as to whether or not
exponential replication was seen, and whether sufficient signal was present to
call the result positive.
10.2. SARS-CoV-2 contains at least 20 genes. Depending on the protocol between one and
three genes are tested for in the PCR test (see section 14.5). The more genes tested for,
the more likely a positive result will be a true positive.
10.3. As of 4/09/2020 more than 20 different tests are on the WHO Emergency Use Listing for
In Vitro Diagnostics (IVDs) detecting SARS-CoV-2 Nucleic Acid, most of which rely on RT-
PCR detection of SARS-CoV-2. These tests target different regions of the virus. For
example, TaqPath COVID‑19 CE‑IVD RT‑PCR Kit, used in the UK Lighthouse labs, targets
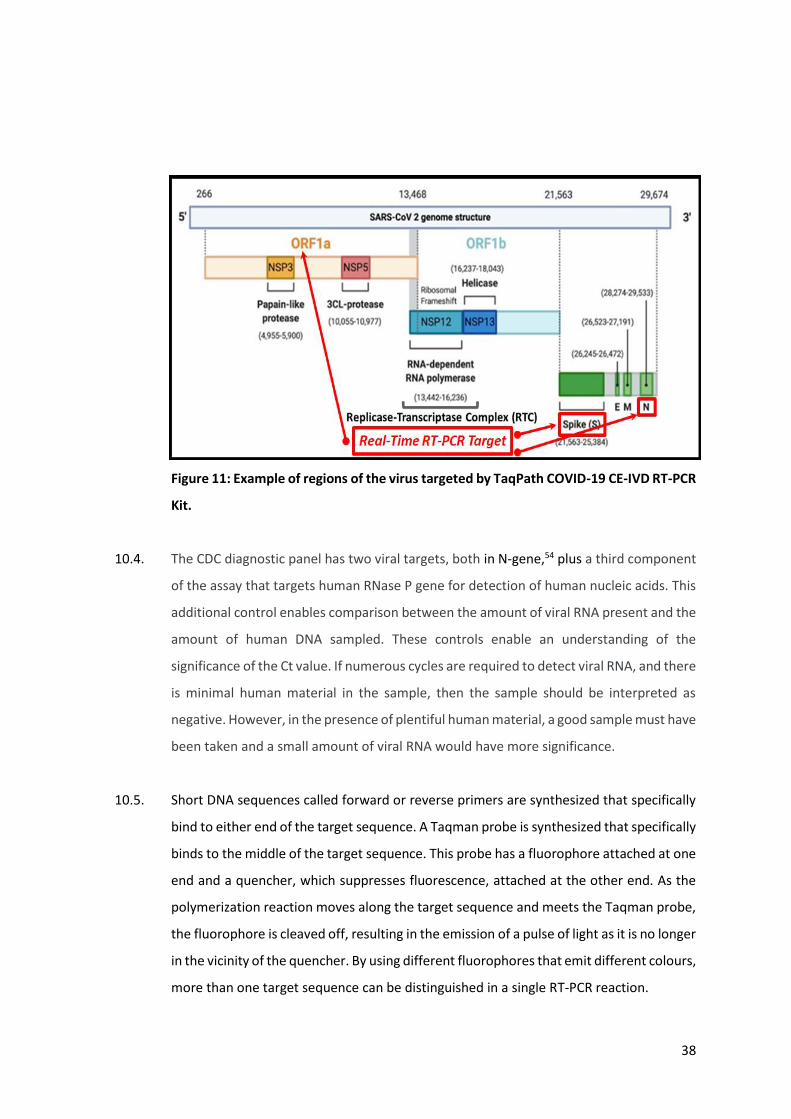
the ORF1a, Spike and Nucleocapsid genes of the virus (Figure 11).
38
Figure 11: Example of regions of the virus targeted by TaqPath COVID-19 CE-IVD RT-PCR
Kit.
10.4. The CDC diagnostic panel has two viral targets, both in N-gene,54 plus a third component
of the assay that targets human RNase P gene for detection of human nucleic acids. This
additional control enables comparison between the amount of viral RNA present and the
amount of human DNA sampled. These controls enable an understanding of the
significance of the Ct value. If numerous cycles are required to detect viral RNA, and there
is minimal human material in the sample, then the sample should be interpreted as
negative. However, in the presence of plentiful human material, a good sample must have
been taken and a small amount of viral RNA would have more significance.
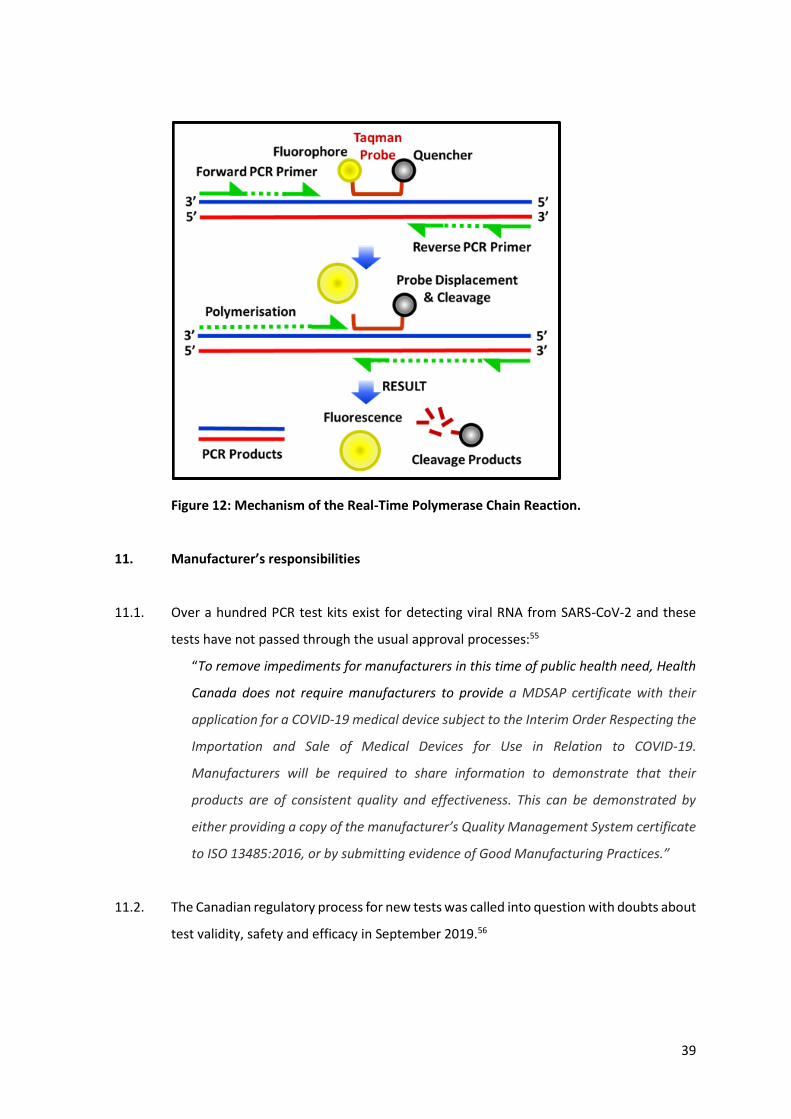
10.5. Short DNA sequences called forward or reverse primers are synthesized that specifically
bind to either end of the target sequence. A Taqman probe is synthesized that specifically
binds to the middle of the target sequence. This probe has a fluorophore attached at one
end and a quencher, which suppresses fluorescence, attached at the other end. As the
polymerization reaction moves along the target sequence and meets the Taqman probe,
the fluorophore is cleaved off, resulting in the emission of a pulse of light as it is no longer
in the vicinity of the quencher. By using different fluorophores that emit different colours,
more than one target sequence can be distinguished in a single RT-PCR reaction.
39
Figure 12: Mechanism of the Real-Time Polymerase Chain Reaction.
11. Manufacturer’s responsibilities
11.1. Over a hundred PCR test kits exist for detecting viral RNA from SARS-CoV-2 and these
tests have not passed through the usual approval processes:55
“To remove impediments for manufacturers in this time of public health need, Health
Canada does not require manufacturers to provide a MDSAP certificate with their
application for a COVID-19 medical device subject to the Interim Order Respecting the
Importation and Sale of Medical Devices for Use in Relation to COVID-19.
Manufacturers will be required to share information to demonstrate that their
products are of consistent quality and effectiveness. This can be demonstrated by
either providing a copy of the manufacturer’s Quality Management System certificate
to ISO 13485:2016, or by submitting evidence of Good Manufacturing Practices.”
11.2. The Canadian regulatory process for new tests was called into question with doubts about
test validity, safety and efficacy in September 2019.56
40
11.3. Manufacturer’s sales will continue as long as the ‘crisis’ continues. They are therefore
incentivized to find ‘cases’.
11.4. No standards have been produced by public health bodies or government to determine
the criteria for a manufacturer to be able to call a positive result.
11.5. 60 million tests have been distributed by TIB MolBiol in 12 months.57 The package inserts
state at the top:58
“Instructions for life science research use only. Not tested for use in diagnostic
procedures.”
11.6. A PCR test kit instruction manual states:59
“Kits and reagents are sold for research use only. Not for use in diagnostic procedures.“
11.7. A further test kit manual states:60
“This product is for research use only and is not intended for diagnostic use.
This product is intended for the detection of 2019-Novel Coronavirus (2019-nCoV). The
detection result of this product is only for clinical reference, and it should not be used
as the only evidence for clinical diagnosis and treatment.”
12. Interpretation of PCR test results
12.1. It is critical to make a distinction between ‘colonization’ of the throat with a few viruses
that do not cause infection (as described by Drosten in section 8.2.4) and a genuine
infection. The latter results from exponential growth of virus which leads to symptoms
and the ability to infect others.
12.2. In the past viral culture was considered the gold standard test for all viral infections. It
remains so for some viral61 infections. Viral culture tests for virus that is able to enter cells
and replicate before either bursting them open or changing the cell appearance in a
measurable way.
12.3. Viral culture remains35 an essential tool to calibrate PCR and other testing. The WHO have
emphasized the importance of viral culture:
41
“The requirement for suitably equipped NICs [National Influenza Centres] to conduct
virus isolation must continue to be emphasized. Although RT-PCR (both real-time and
conventional) is increasingly the method of choice for influenza virological
surveillance, this should not distract from the crucial role of virus isolation.”
12.4. To ensure a test is measuring what you intend it to measure, calibration work must be
undertaken. This can be carried out either against a better “gold standard” test or against
clinical findings. The “gold standard” test for any virus test is viral culture.
12.5. Each laboratory must calibrate their own testing and if there is a change in any
component of testing from chemicals, enzymes, protocols or machines, then
recalibration should be carried out. Results of calibration in one laboratory cannot be
used as evidence for the accuracy of testing in another laboratory.
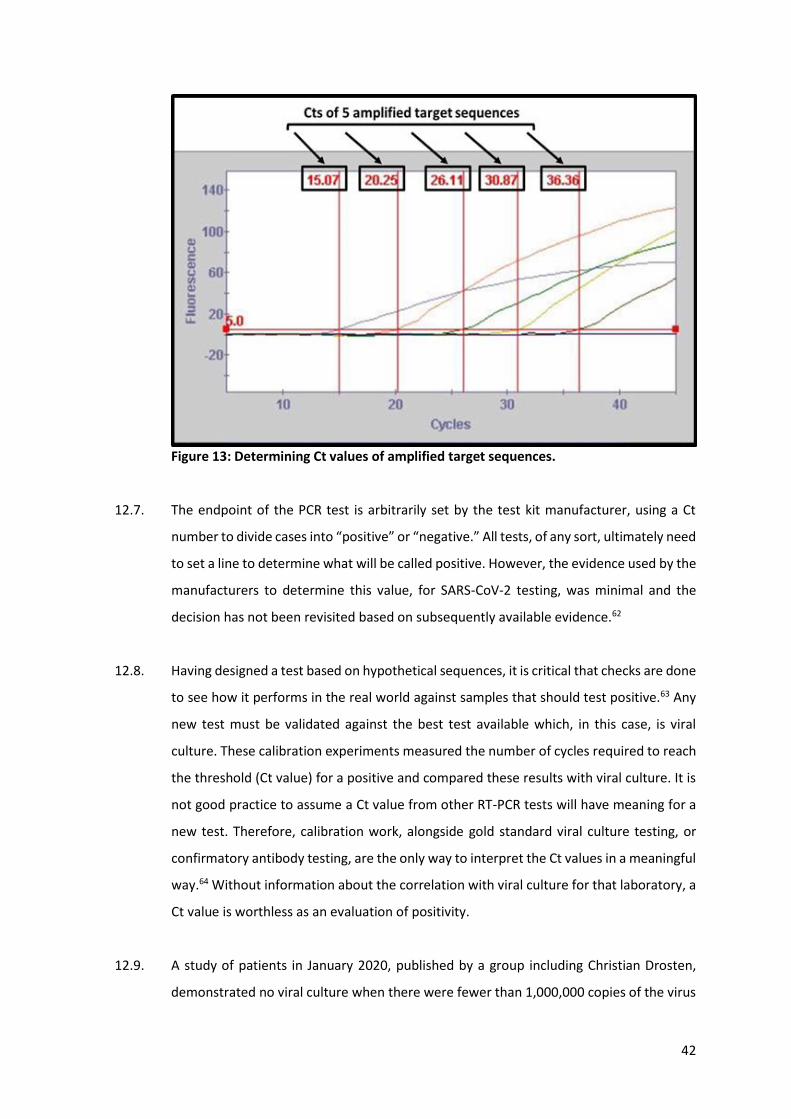
12.6. Ct values of amplified target sequences (Figure 13). The Ct is the cycle where the
fluorescence generated by the amplification of the target sequence crosses the
designated fluorescence threshold (set at 5). Different doses of a virus were intravenously
administered into mice. The results show that the different Ct values of the target
sequence detected in the DNA isolated from the livers of treated animals, reflect the
different doses administered to the mice. When there is plenty of virus present, fewer
doublings are needed to reach sufficient positivity to cross the threshold and the Ct value
is lowest. The smaller the Ct value of a sample, the higher the initial amount of
DNA/RNA in the test sample. In the case of a viral test, this correlates with the amount
of virus present in the sample, referred to as the ‘viral load’.
42
Figure 13: Determining Ct values of amplified target sequences.
12.7. The endpoint of the PCR test is arbitrarily set by the test kit manufacturer, using a Ct
number to divide cases into “positive” or “negative.” All tests, of any sort, ultimately need
to set a line to determine what will be called positive. However, the evidence used by the
manufacturers to determine this value, for SARS-CoV-2 testing, was minimal and the
decision has not been revisited based on subsequently available evidence.62
12.8. Having designed a test based on hypothetical sequences, it is critical that checks are done
to see how it performs in the real world against samples that should test positive.63 Any
new test must be validated against the best test available which, in this case, is viral
culture. These calibration experiments measured the number of cycles required to reach
the threshold (Ct value) for a positive and compared these results with viral culture. It is
not good practice to assume a Ct value from other RT-PCR tests will have meaning for a
new test. Therefore, calibration work, alongside gold standard viral culture testing, or
confirmatory antibody testing, are the only way to interpret the Ct values in a meaningful
way.64 Without information about the correlation with viral culture for that laboratory, a
Ct value is worthless as an evaluation of positivity.
12.9. A study of patients in January 2020, published by a group including Christian Drosten,
demonstrated no viral culture when there were fewer than 1,000,000 copies of the virus
43
(viral load <106 per ml).65 However, the tests are designed to detect approximately 1,000
copies per ml.66 This would mean only 4 copies in a sample of 5µl. For example, this Roche
test claims to be able to detect fewer than 4 copies per sample.58 The PCR test is therefore
declaring as a positive a sample with one thousandth of the concentration required to
contain viable virus and be an infectious patient.
12.10. External quality control assessment has been carried out, using dilute samples, to make
sure the laboratories call a positive in the presence of single digit numbers of copies of
the virus in the sample.67 Emphasizing the minimizing of false negative results will lead to
consequent high false positive results. A summary of international external quality
controls demonstrated this emphasis when they concluded:
“Laboratories that were unable to detect low-concentration samples, or whose
methods showed Cq values greatly different from the provided medians, should strive
to improve the sensitivity of their molecular assays to prevent false-negative results in
respiratory samples with low viral concentrations from SARS-CoV-2-infected patients,
e.g. during the early phase of infection.”
12.11. False positive results can look like true positive results and there will be false positive
results with a low Ct value, otherwise there would be no problem identifying them all as
false positives.
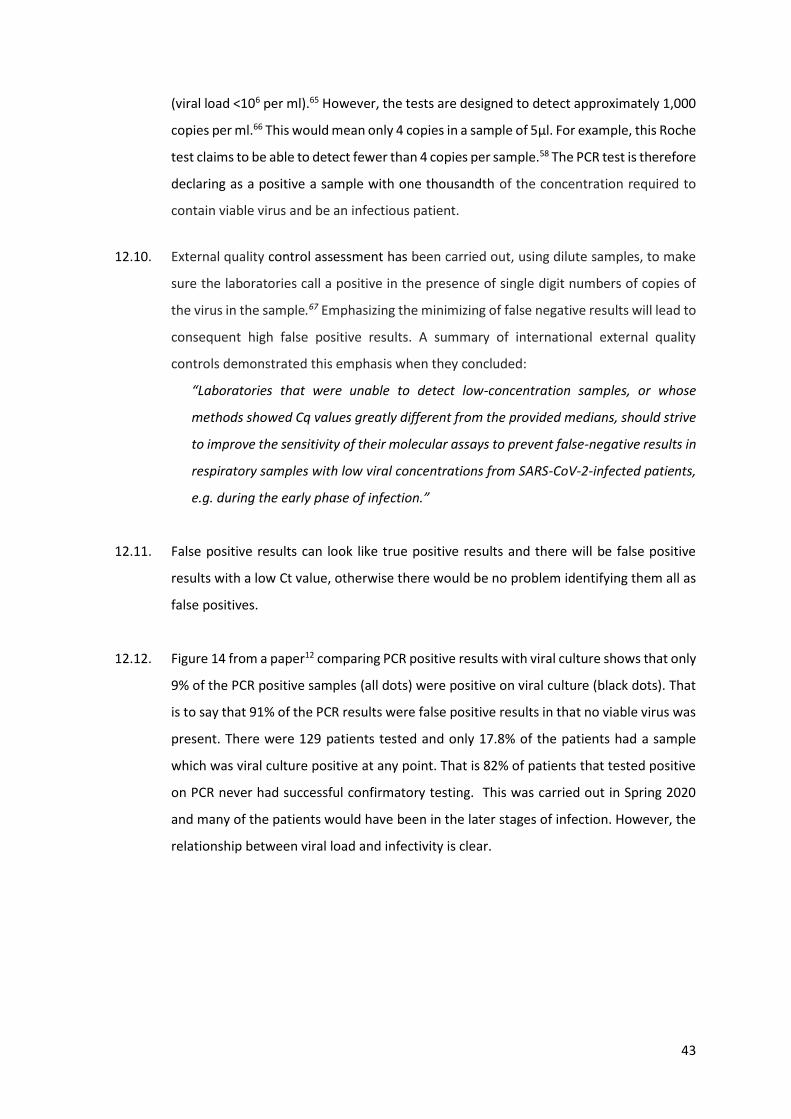
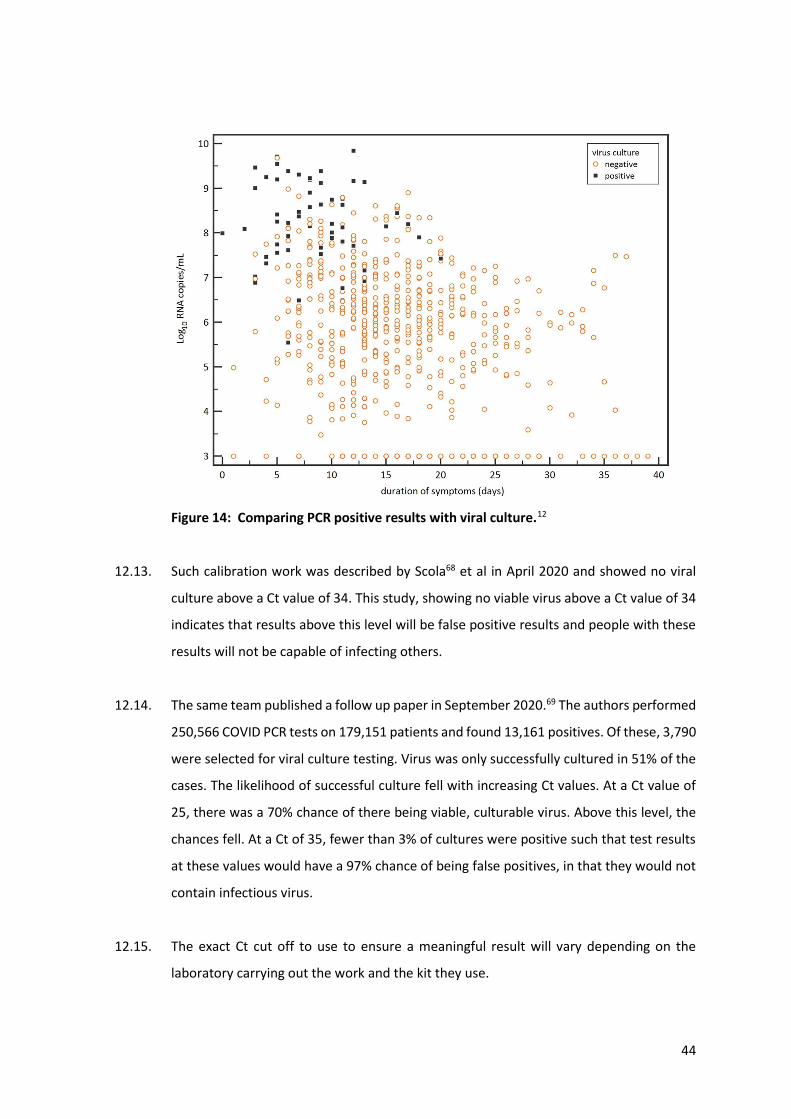
12.12. Figure 14 from a paper12 comparing PCR positive results with viral culture shows that only
9% of the PCR positive samples (all dots) were positive on viral culture (black dots). That
is to say that 91% of the PCR results were false positive results in that no viable virus was
present. There were 129 patients tested and only 17.8% of the patients had a sample
which was viral culture positive at any point. That is 82% of patients that tested positive
on PCR never had successful confirmatory testing. This was carried out in Spring 2020
and many of the patients would have been in the later stages of infection. However, the
relationship between viral load and infectivity is clear.
44
Figure 14: Comparing PCR positive results with viral culture.12
12.13. Such calibration work was described by Scola68 et al in April 2020 and showed no viral
culture above a Ct value of 34. This study, showing no viable virus above a Ct value of 34
indicates that results above this level will be false positive results and people with these
results will not be capable of infecting others.
12.14. The same team published a follow up paper in September 2020.69 The authors performed
250,566 COVID PCR tests on 179,151 patients and found 13,161 positives. Of these, 3,790
were selected for viral culture testing. Virus was only successfully cultured in 51% of the
cases. The likelihood of successful culture fell with increasing Ct values. At a Ct value of
25, there was a 70% chance of there being viable, culturable virus. Above this level, the
chances fell. At a Ct of 35, fewer than 3% of cultures were positive such that test results
at these values would have a 97% chance of being false positives, in that they would not
contain infectious virus.
12.15. The exact Ct cut off to use to ensure a meaningful result will vary depending on the
laboratory carrying out the work and the kit they use.
45
12.16. A retrospective study repeated this work in Manitoba.13 The study was carried out using
samples collected at a time when there was not mass testing, and the overall positivity
rate was high because the people being tested were very likely to have the disease. They
commented
“the testing criteria in Manitoba had sufficient pretest probability to make the
likelihood of a false-positive remote.”
However, of the 90 samples they tested, viral culture only confirmed infection in 29%.
That is 71% of the samples were false positive results, even when the positivity rate per
test done was high.13 Bullard et al also noted for every 1-unit increase in Ct value, the
odds of a positive culture decreased by 32%.
12.17. Bullard et al, as above in Manitoba, demonstrated that a Ct value of 24 or less was
indicative of a sample containing viable virus.13
12.18. A South Korean study found no viable virus where the Ct value was above 28.4.70
12.19. National Centre for Infectious Disease Singapore stated in May 2020:71
“it is important to note that viral RNA detection by PCR does not equate to
infectiousness or viable virus. A surrogate marker of ‘viral load’ with PCR is the cycle
threshold value (Ct). A low Ct value indicates a high viral RNA amount, and vice versa.
As noted above, detection of viral RNA does not necessarily mean the presence of
infectious or viable virus. In a local study from a multicenter cohort of 73 COVID-19
patients, when the Ct value was 30 or higher (i.e. when viral load is low), no viable
virus (based on being able to culture the virus) has been found. In addition, virus could
not be isolated or cultured after day 11 of illness. These data corroborate the
epidemiologic data and indicate that while viral RNA detection may persist in some
patients, such persistent RNA detection represent non-viable virus and such patients
are non-infectious.”
12.20. The Office of National Statistics in the UK has published evidence that people with a Ct
threshold above 25 could not transmit virus within their household, whereas those with
a Ct value below 25 did.72
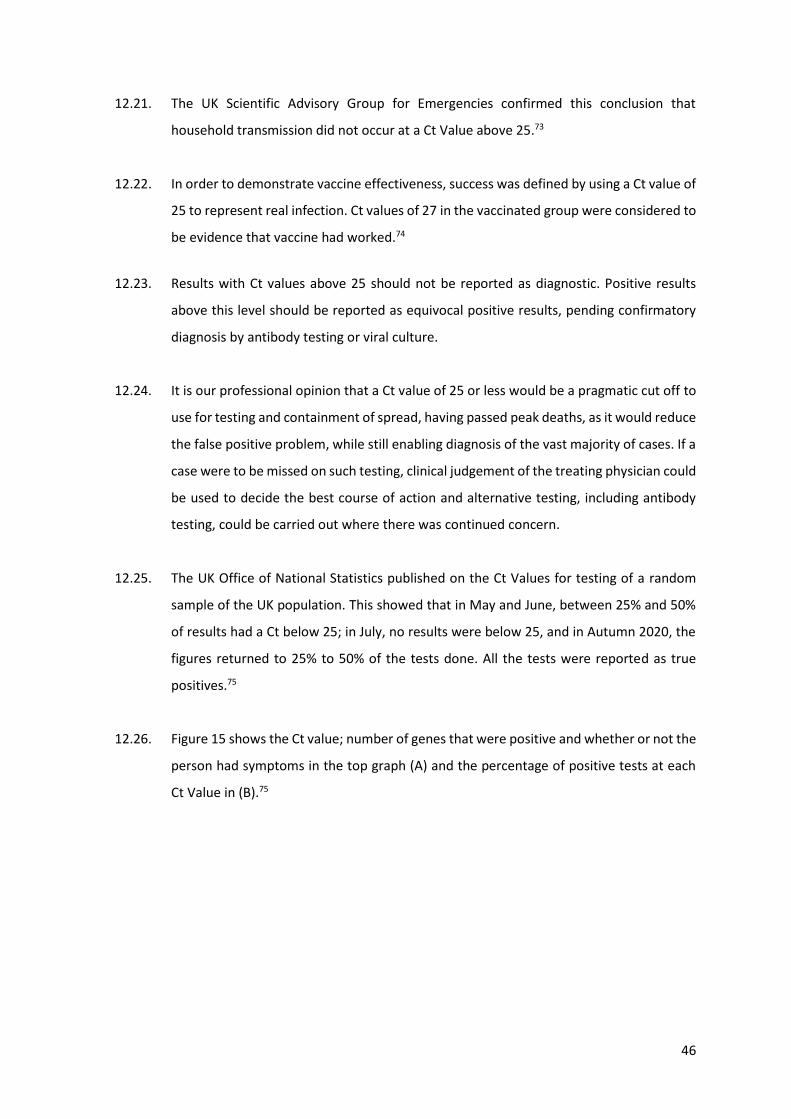
46
12.21. The UK Scientific Advisory Group for Emergencies confirmed this conclusion that
household transmission did not occur at a Ct Value above 25.73
12.22. In order to demonstrate vaccine effectiveness, success was defined by using a Ct value of
25 to represent real infection. Ct values of 27 in the vaccinated group were considered to
be evidence that vaccine had worked.74
12.23. Results with Ct values above 25 should not be reported as diagnostic. Positive results
above this level should be reported as equivocal positive results, pending confirmatory
diagnosis by antibody testing or viral culture.
12.24. It is our professional opinion that a Ct value of 25 or less would be a pragmatic cut off to
use for testing and containment of spread, having passed peak deaths, as it would reduce
the false positive problem, while still enabling diagnosis of the vast majority of cases. If a
case were to be missed on such testing, clinical judgement of the treating physician could
be used to decide the best course of action and alternative testing, including antibody
testing, could be carried out where there was continued concern.
12.25. The UK Office of National Statistics published on the Ct Values for testing of a random
sample of the UK population. This showed that in May and June, between 25% and 50%
of results had a Ct below 25; in July, no results were below 25, and in Autumn 2020, the
figures returned to 25% to 50% of the tests done. All the tests were reported as true
positives.75
12.26. Figure 15 shows the Ct value; number of genes that were positive and whether or not the
person had symptoms in the top graph (A) and the percentage of positive tests at each
Ct Value in (B).75
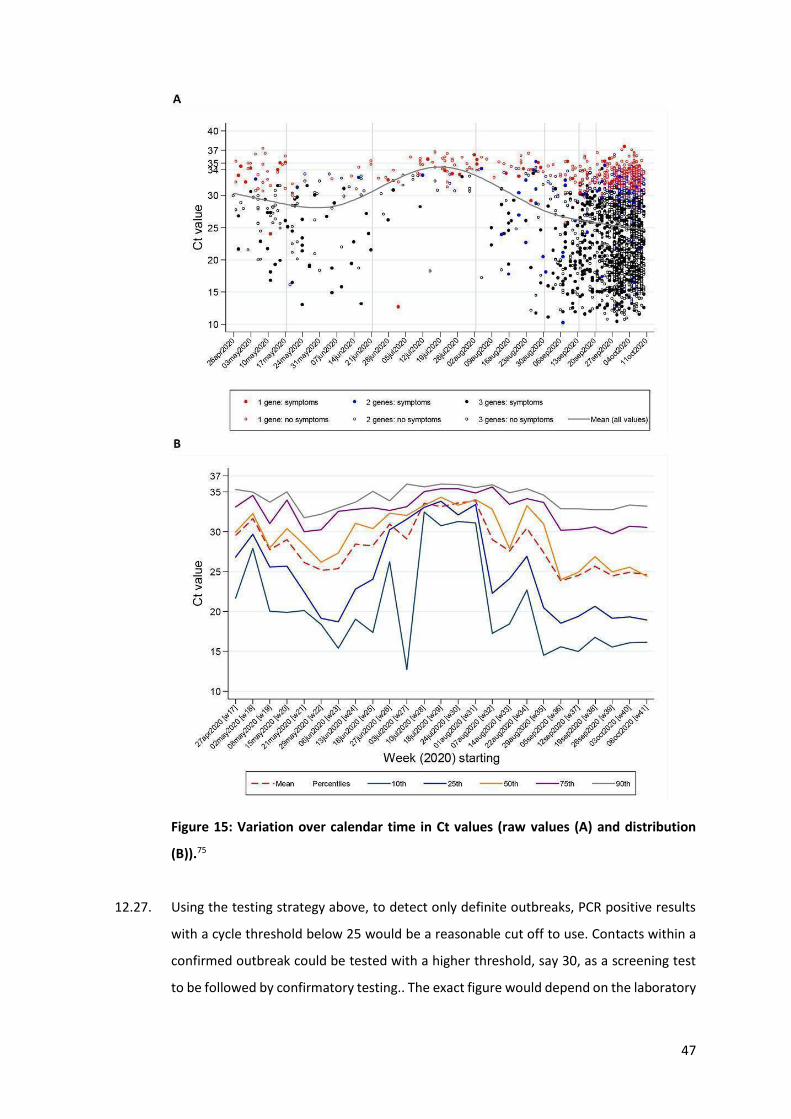
47
Figure 15: Variation over calendar time in Ct values (raw values (A) and distribution
(B)).75
12.27. Using the testing strategy above, to detect only definite outbreaks, PCR positive results
with a cycle threshold below 25 would be a reasonable cut off to use. Contacts within a
confirmed outbreak could be tested with a higher threshold, say 30, as a screening test
to be followed by confirmatory testing.. The exact figure would depend on the laboratory
48
doing the testing and calibration of their Ct values against a gold standard test, e.g. vial
culture or confirmatory antibody testing, would enable a meaningful value to be selected.
12.28. The Quebec Public Health Authorities have chosen a Ct value cut off of equal to or below
37.76 All positives below that level will be reported as real positives. However, the Ct value
is set too high, which means that it brings or even guarantees positive results in situations
where no viable virus could be found. This will invariably result in false positive results
causing inflated case numbers leading to policy decisions based on misleading data of the
extent of disease. On an individual level, people will have been and are being quarantined
on the basis of false positive results. The proportion of results, which were reported at
high Ct values, will have depended on how many true positives there were around at the
time. Only disclosure of the Ct Values of the positive results will reveal the extent of the
problem.
12.29. Public Health Ontario have stated that the cycle threshold has been set, determined not
by calibrating against true positives, but rather to ensure that even a minimal, diluted,
quantity of virus would be called positive. Figure 16 shows that even Ct values of up to
38 are called positive in Canada, with values of 38.1-39.9 reported as indeterminate. They
suggest that patients with such results should have genetic sequencing or a repeat test
with a PCR test which is even more sensitive, that is it will be able to detect even lower
levels of virus.77
Figure 16: Interpretation of Ct values guidance, Public health Ontario.77
49
12.30. The PCR machines are set to run a certain number of cycles e.g. up to 45. This is a different
number to the Ct value. To determine a positive result, a threshold is decided. The output
from each sample is plotted as the degree of positivity over time. The threshold is drawn
as a horizontal line on this graph. To read a result, the output is examined and if it is not
exponential, it is disregarded. For outputs that have an exponential increase in positivity,
they are compared to the threshold. If they cross the threshold, then a line is drawn from
the crossing point to the x-axis to reveal the number of cycles that the sample had passed
through at that point. This is the Ct value. The cycle level of the machine must not be
confused with the Ct value of an individual result. It does not matter if the machines run
at 45 cycles, as long as the results that have high Ct values are ignored.
12.31. The decision about what Ct value is meaningful will depend on the kit and equipment in
use. It is therefore imperative that every laboratory carry out calibration work such that
they know the Ct value beyond which a positive is no longer meaningful in terms of
identifying infectious disease. This work was not done.
12.32. Results of a German External Quality Assessment of the laboratories, in April 2020, found,
that for the same standardized sample (probe 340061) given to 463 laboratories returned
results with Ct values between 15-40 for the E gene; 20-40.7 for the N gene and 19.5-42.8
for the RdRp gene.78 These ranges indicate that material that was detected in one
laboratory was not detected in others until between 1 million and 33 million more copies
were present. This represents an extreme lack of test standardization within the
participating laboratories, indicative of a lack of calibration of testing. Results of a repeat
assessment carried out in June/July 2020 have not been published.
12.33. Dr Anthony Fauci, Chief Medical Advisor in the USA, was aware that PCR is unreliable
when the Ct value is above 35. In a podcast on July 16th 2020 called This week in Virology
he said (4 mins in):79
“What is now evolving into a bit of a standard is that if you get a cycle threshold of 35
or more that the chances of it being replication competent are miniscule… We have
patients, and it is very frustrating for the patients as well as for the physicians…
somebody comes in and they repeat their PCR and it’s like 37 cycle threshold… you can
almost never culture virus from a 37 threshold cycle. So I think if somebody does come
in with 37, 38, even 36, you gotta say, you know, it’s just dead nucleotides, period.”
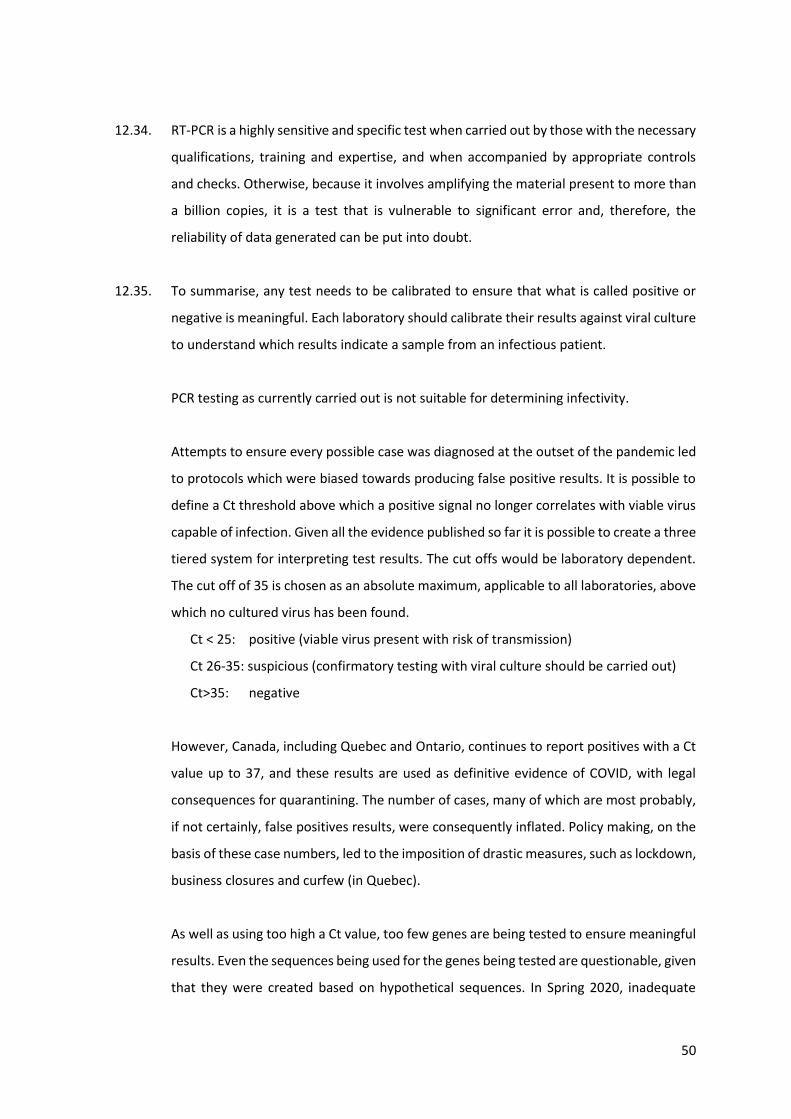
50
12.34. RT-PCR is a highly sensitive and specific test when carried out by those with the necessary
qualifications, training and expertise, and when accompanied by appropriate controls
and checks. Otherwise, because it involves amplifying the material present to more than
a billion copies, it is a test that is vulnerable to significant error and, therefore, the
reliability of data generated can be put into doubt.
12.35. To summarise, any test needs to be calibrated to ensure that what is called positive or
negative is meaningful. Each laboratory should calibrate their results against viral culture
to understand which results indicate a sample from an infectious patient.
PCR testing as currently carried out is not suitable for determining infectivity.
Attempts to ensure every possible case was diagnosed at the outset of the pandemic led
to protocols which were biased towards producing false positive results. It is possible to
define a Ct threshold above which a positive signal no longer correlates with viable virus
capable of infection. Given all the evidence published so far it is possible to create a three
tiered system for interpreting test results. The cut offs would be laboratory dependent.
The cut off of 35 is chosen as an absolute maximum, applicable to all laboratories, above
which no cultured virus has been found.
Ct < 25: positive (viable virus present with risk of transmission)
Ct 26-35: suspicious (confirmatory testing with viral culture should be carried out)
Ct>35: negative
However, Canada, including Quebec and Ontario, continues to report positives with a Ct
value up to 37, and these results are used as definitive evidence of COVID, with legal
consequences for quarantining. The number of cases, many of which are most probably,
if not certainly, false positives results, were consequently inflated. Policy making, on the
basis of these case numbers, led to the imposition of drastic measures, such as lockdown,
business closures and curfew (in Quebec).
As well as using too high a Ct value, too few genes are being tested to ensure meaningful
results. Even the sequences being used for the genes being tested are questionable, given
that they were created based on hypothetical sequences. In Spring 2020, inadequate
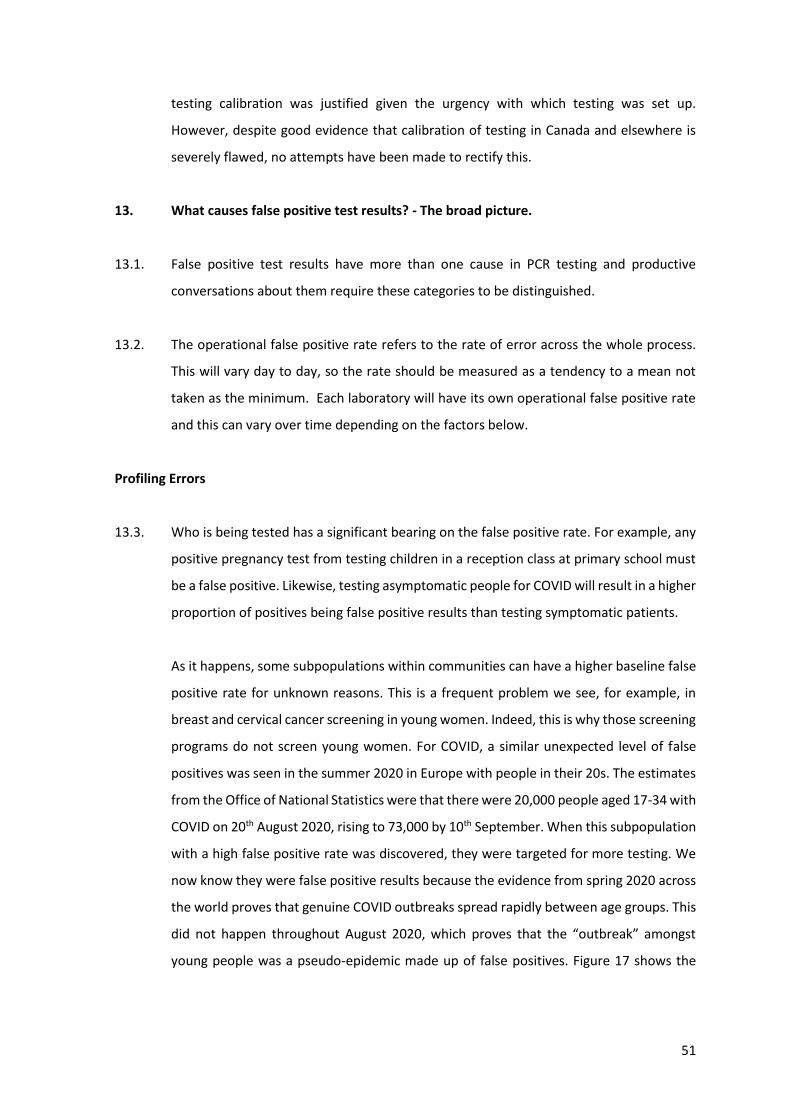
51
testing calibration was justified given the urgency with which testing was set up.
However, despite good evidence that calibration of testing in Canada and elsewhere is
severely flawed, no attempts have been made to rectify this.
13. What causes false positive test results? - The broad picture.
13.1. False positive test results have more than one cause in PCR testing and productive
conversations about them require these categories to be distinguished.
13.2. The operational false positive rate refers to the rate of error across the whole process.
This will vary day to day, so the rate should be measured as a tendency to a mean not
taken as the minimum. Each laboratory will have its own operational false positive rate
and this can vary over time depending on the factors below.
Profiling Errors
13.3. Who is being tested has a significant bearing on the false positive rate. For example, any
positive pregnancy test from testing children in a reception class at primary school must
be a false positive. Likewise, testing asymptomatic people for COVID will result in a higher
proportion of positives being false positive results than testing symptomatic patients.
As it happens, some subpopulations within communities can have a higher baseline false
positive rate for unknown reasons. This is a frequent problem we see, for example, in
breast and cervical cancer screening in young women. Indeed, this is why those screening
programs do not screen young women. For COVID, a similar unexpected level of false
positives was seen in the summer 2020 in Europe with people in their 20s. The estimates
from the Office of National Statistics were that there were 20,000 people aged 17-34 with
COVID on 20th August 2020, rising to 73,000 by 10th September. When this subpopulation
with a high false positive rate was discovered, they were targeted for more testing. We
now know they were false positive results because the evidence from spring 2020 across
the world proves that genuine COVID outbreaks spread rapidly between age groups. This
did not happen throughout August 2020, which proves that the “outbreak” amongst
young people was a pseudo-epidemic made up of false positives. Figure 17 shows the
52
increasing levels of COVID positivity in younger age groups throughout August which did
not spread to other age groups.80
Figure 17: Distribution of COVID positivity in late July - early September 2020, England.80
It is important to target testing to people who have symptoms that provide a high clinical
suspicion of the disease you are testing for. The targeting of a subpopulation, because
they have a high false positive rate, is bad profiling. The more people in this
subpopulation that you target the higher the false positive rate will be driven for testing
as a whole.
13.4. Respiratory viruses can commonly be found at death even when they are not the cause
of death. Testing of deceased over 65 year olds revealed that 7% had a coronavirus
present at death and 47% had a respiratory virus of any type.81 Only 7% had a diagnosis
of a viral infection prior to death. Testing the dead or dying may therefore give a false
impression of active infection and lead to misinterpretation of the cause of death.
53
Mistaken Identity
13.5. The likely underlying cause of the false positives in young people was mistaken identity.
When testing for RNA (the viral equivalent of DNA used for replication), the test should
be able to distinguish between sequences that are unique to COVID and sequences seen
on other viruses or even in human DNA. However, no test is perfect.
13.6. Human DNA has been mistaken for a different coronavirus when doing PCR testing.82 The
human genome comprises three billion letters of code. While none of it may be an exact
match for what the PCR test should be detecting, a near match could result in errors in a
proportion of the tests. This type of mistaken identity could lead to particular
subpopulations being targeted for testing, creating profiling errors.
13.7. A 2003 outbreak of SARS-1 in a care home in British Columbia turned out to be a common
cold causing coronavirus.83 Coronaviruses are a family of viruses and, although the spike
protein of the COVID virus is unique, the rest of the virus has many similar features to
other common colds. These similarities can cause mistakes in PCR testing. Because
coronaviruses are seasonal, this type of mistaken identity can cause a seasonal variation
in the false positive rate.
Contamination of the chain of evidence
13.8. There is a chain of evidence from the sample being taken, through delivery to the
laboratory, checking in of samples and then opening and working on them.
Contamination can happen at any stage. This contamination may come from the
individuals carrying out the work or from other patients’ samples once in the laboratory.
13.9. Claims that PPE would be effective at preventing contamination, from swab takers, etc,
is like claiming that wearing chain mail would prevent you getting sandy on a beach. A
delivery driver who is post-infective and shedding RNA could contaminate the containers
the samples are transported in. Whoever opens those containers could then transfer the
RNA to the contents. If the same gloves are worn when opening numerous patient sample
pots, then the possibility for contamination between samples will be high.
54
13.10. Contamination of swabs has been known to occur in factories. In Germany, a woman who
worked in the swab factory and referred to as the “Phantom of Heilbronn”, contaminated
swabs with her DNA, and was thus linked forensically to 40 crimes, wasting 16,000 hours
of police time.84
13.11. Contamination is an issue largely because of the nature of the test, rather than sloppy
handling. Having turned the RNA into DNA, the second step in testing is to multiply the
DNA by one billion to a trillion times. That means that, even with highly competent
sample handling, the risk of contamination will remain because only the tiniest fragment
of contaminant RNA can create a false positive test result. Reducing the number of times
the DNA is multiplied reduces the chance of these errors but not to zero.
13.12. Prevention of cross contamination requires very competent staff, an environment
designed to minimize cross-contamination and thorough use of testing of control
samples.
Equipment Errors
13.13. The testing equipment itself will have a low and fairly constant false positive rate. This is
of the least significance, but has had the most effort put into understanding it. It is
possible to calculate based on retesting samples with different test kits. There seems to
be a general misunderstanding that this is the only cause of false positive error and that,
because it is a low value, there is no false positive problem.
Burden of Proof
13.14. As well as choosing a reasonable cycle threshold to reduce errors, other variations in the
criteria used to determine positivity will lead to differences in the false positive rate. It is
standard practice to test for more than one gene belonging to the SARS-CoV-2 virus.
However, if positive is defined as the presence of only one gene, rather than more than
one, then the false positive rate will be higher, as this is a lower bar.
13.15. The Operational False Positive rate is made up of five types of false positive error:
Profiling errors; mistaken identity; contamination errors; equipment errors and
differences in the burden of proof. The five types of false positives will vary between
55
laboratories, so investigations as to the rate at one laboratory cannot be extrapolated to
another, and each has its own interaction with underlying community prevalence rates,
so that the overall epidemiological false positive rate will vary by place, time and testing
strategy. Changes in who is targeted, seasonal infections, and laboratory quality
standards can lead to changes in the false positive rate over time.
14. What causes false positive results? - The details.
Profiling errors
14.1. Testing in hospitals and care homes when there are symptomatic outbreaks of a COVID-
like illness is good profiling, where false positive results would be a minor problem.
Testing of children and university students is bad profiling, where false positive results
are likely to be a major problem.
Mistaken Identity
14.2. Similarities between the SARS-CoV-2 sequences being tested for and other viruses or
even bacteria mean that, when mass testing, it is critically important to use more than
one gene target.
14.3. Each gene that is tested, from the point of view of a false positive risk, can be considered
to be a separate test. For example, if the three genes had false positive rates of 6%, 5%
and 3% respectively, then testing 100,000 samples with a requirement that all three
genes be positive would give 9 false positive results. However, if a positive in just the first
gene was acceptable then there would be 6,000 false positive results.
14.4. On 13th January 2020, the WHO published guidance for PCR testing that required
detection of three independent genes.85 On 2nd March 2020, the WHO changed the
requirement to only one:86
“In areas where COVID-19 virus is widely spread a simpler algorithm might be adopted
in which for example screening by rRT-PCR of a single discriminatory target is
considered sufficient.”
Consequently testing for the E gene alone, including in Canada (see 14.5), has been used
even at times of low prevalence.
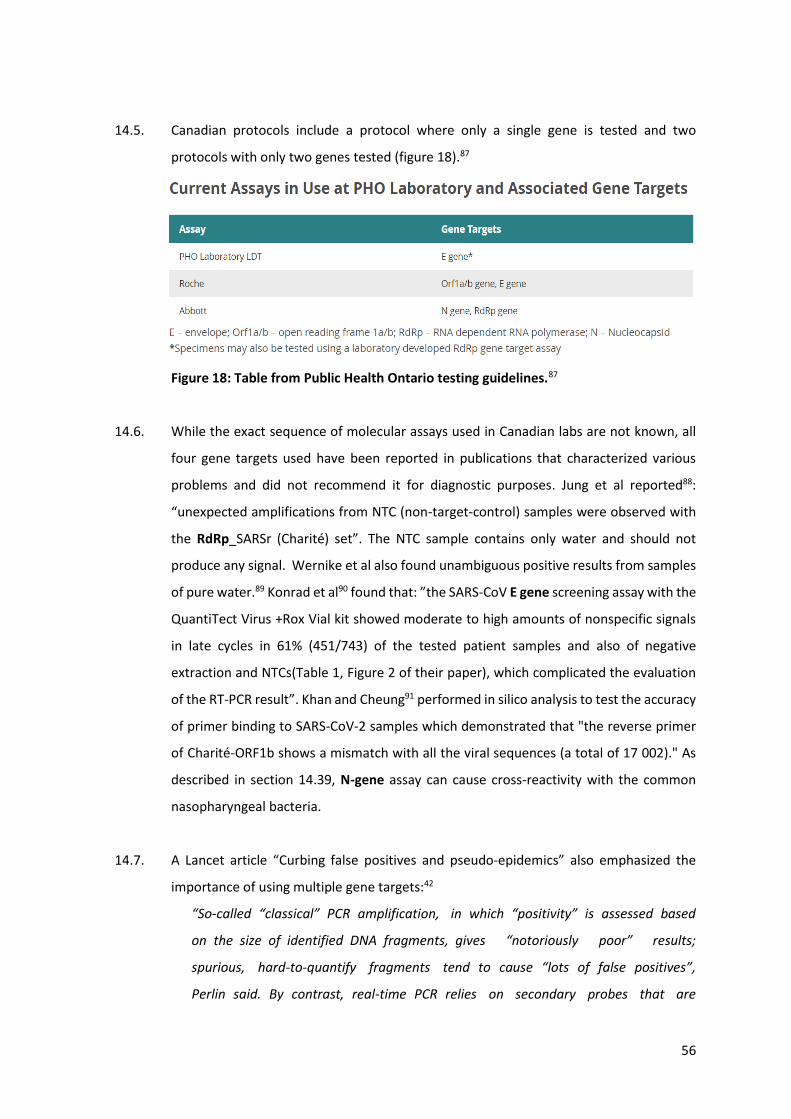
56
14.5. Canadian protocols include a protocol where only a single gene is tested and two
protocols with only two genes tested (figure 18).87
Figure 18: Table from Public Health Ontario testing guidelines.87
14.6. While the exact sequence of molecular assays used in Canadian labs are not known, all
four gene targets used have been reported in publications that characterized various
problems and did not recommend it for diagnostic purposes. Jung et al reported88:
“unexpected amplifications from NTC (non-target-control) samples were observed with
the RdRp_SARSr (Charité) set”. The NTC sample contains only water and should not
produce any signal. Wernike et al also found unambiguous positive results from samples
of pure water.89 Konrad et al90 found that: ”the SARS-CoV E gene screening assay with the
QuantiTect Virus +Rox Vial kit showed moderate to high amounts of nonspecific signals
in late cycles in 61% (451/743) of the tested patient samples and also of negative
extraction and NTCs(Table 1, Figure 2 of their paper), which complicated the evaluation
of the RT-PCR result”. Khan and Cheung91 performed in silico analysis to test the accuracy
of primer binding to SARS-CoV-2 samples which demonstrated that "the reverse primer
of Charité-ORF1b shows a mismatch with all the viral sequences (a total of 17 002)." As
described in section 14.39, N-gene assay can cause cross-reactivity with the common
nasopharyngeal bacteria.
14.7. A Lancet article “Curbing false positives and pseudo-epidemics” also emphasized the
importance of using multiple gene targets:42
“So-called “classical” PCR amplification, in which “positivity” is assessed based
on the size of identified DNA fragments, gives “notoriously poor” results;
spurious, hard-to-quantify fragments tend to cause “lots of false positives”,
Perlin said. By contrast, real-time PCR relies on secondary probes that are
57
sequence-specific, so the rate of false positives is considerably lower. “But the
best way to reduce false positives for pathogens you’re not sure about and that
are difficult to grow, such as Bordetella pertussis, is to use multiple targets”,
Perlin emphasized. “You’re not just amplifying a single fragment, but rather
multiple targets to reduce the probability of error”.”
14.8. SARS-CoV-2 PCR test results are always reported as binary “positive” or “negative”, a
decision which is taken based on the Ct value. It is not unusual for RT-PCR testing to
operate in this binary mode, if the test is utilizing a well defined volume of biological
fluids, such as blood. However, the amount of RNA present in a sample sent for SARS-
CoV-2 testing can vary considerably due to sampling error.92 This is because these tests
utilize nasopharyngeal swabs, and the volume of material collected is dependent on
sampling technique. The amount of virus present will depend on how much material was
sampled. By comparing how much virus there is per human cell, it is possible to
understand how much virus is in the person, rather than just in the sample. The only way
to overcome this limitation is by including an internal control. The internal control
measures one of the human genes to give a baseline for how much material is present.
Valid interpretation of the test result requires a knowledge of the Ct value in the context
of the ratio of virus to human material. There are several well characterized regions in
the human genome that can be used to measure this. One such target is a gene encoding
human RNase P, recommended by the CDC and included in the SARS-CoV-2 diagnostic
panel.54
14.9. However, there are numerous examples of countries that use a PCR assay for SARS-CoV-
2 lacking such a control. Many European countries are using the Corman-Drosten panel93
which lacks an internal control94. The same is true for the TaqPathCOVID-19_CE-IVD_RT-
PCR Kit utilized for majority of the community testing in England95 . Based on publicly
available information we conclude that no human internal control is used in SARS-CoV-2
testing in Canada.
14.10. The WHO’s assessment of PCR for Zika virus testing recommended two gene targets
because of discrepant results between separate targets when tested individually.96
“Various real-time and conventional RT–PCR assays specific for Zika virus have been
described. Lanciotti at al described a combination of two real-time PCR assays and this
58
approach is the most commonly used for direct diagnosis of Zika virus. Two gene
targets were described and equivocal positive results were mentioned that could be
related to false positives; of 157 samples tested, 10 were positive for only one target
while 17 were positive for both. It was not mentioned whether this was randomly
observed with both assays. However, discrepant results were observed between the
two targets in the French and Dutch reference laboratories as well (authors’ own
unpublished observations).”
Contamination errors
14.11. In April 2020, test kits produced by the CDC were contaminated with SARS-CoV-2.97 This
resulted in a 33% error rate. The source of contamination was apparently minor however:
“CDC and HHS officials disagree with Stenzel's characterization of the lab. One former
CDC official who was there when he arrived said the issues were small. "It was beakers
on a counter that were empty and washed within 7 feet of a negative pressure hood.
He called that dirty. Was that protocol? No. But it wasn't a dirty lab.”
14.12. Reports of localized problems with false positive results include 77 professional football
players who tested positive when all of them were false positives attributed to cross-
contamination.98
14.13. 90 out of 140 people (63%) tested false positive in July in Connecticut. This was reported
as being due to a “widely-used laboratory testing platform” that the state laboratory
started using on 15th June 2020.99
14.14. The FDA issued a warning about the Becton-Dickinson test kit after that manufacturer
found a 3% false positive rate. That is 3% of tests done would be false positives. If 5 out
of 100 tests were positive, then 3 of those would be false positives, with only 2 being true
positives. That would mean 60% (3/5) of the positive test results would be false positive
results.100
14.15. A further warning was issued by the FDA because inadequate centrifuging was leading to
false positive results using the ThermoFisher Thermo Fisher Scientific TaqPath COVID-19
Combo Kit.101
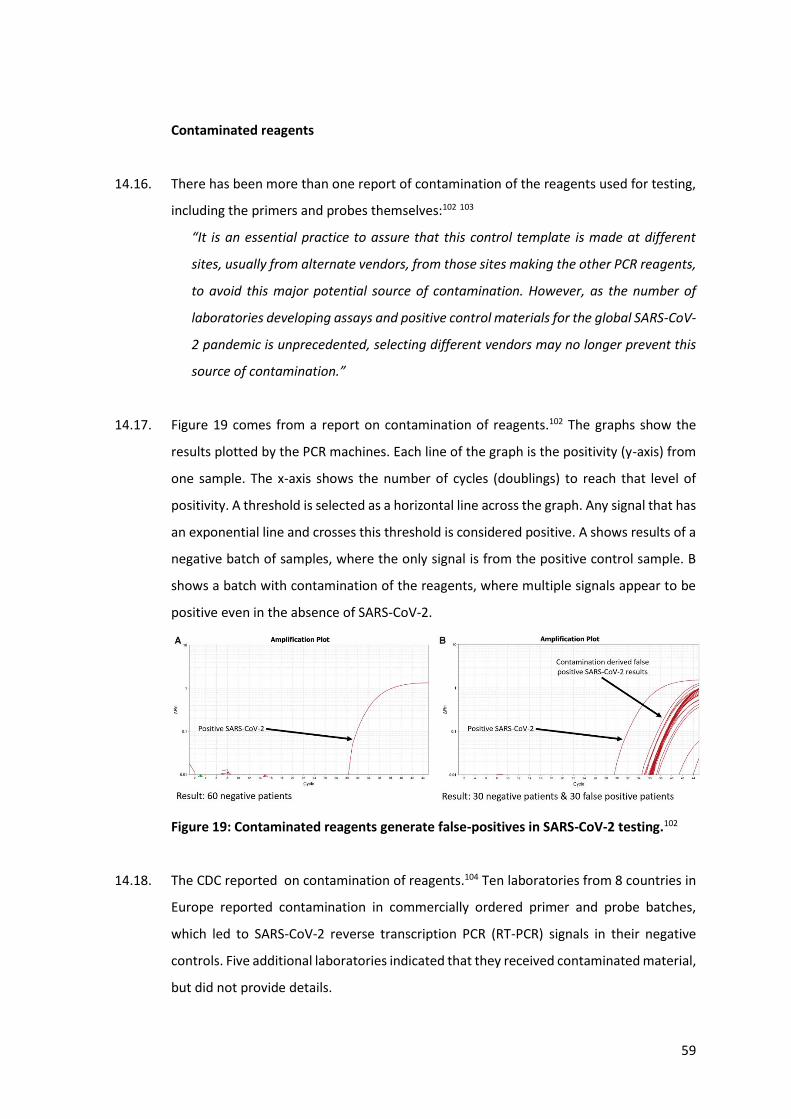
59
Contaminated reagents
14.16. There has been more than one report of contamination of the reagents used for testing,
including the primers and probes themselves:102 103
“It is an essential practice to assure that this control template is made at different
sites, usually from alternate vendors, from those sites making the other PCR reagents,
to avoid this major potential source of contamination. However, as the number of
laboratories developing assays and positive control materials for the global SARS-CoV-
2 pandemic is unprecedented, selecting different vendors may no longer prevent this
source of contamination.”
14.17. Figure 19 comes from a report on contamination of reagents.102 The graphs show the
results plotted by the PCR machines. Each line of the graph is the positivity (y-axis) from
one sample. The x-axis shows the number of cycles (doublings) to reach that level of
positivity. A threshold is selected as a horizontal line across the graph. Any signal that has
an exponential line and crosses this threshold is considered positive. A shows results of a
negative batch of samples, where the only signal is from the positive control sample. B
shows a batch with contamination of the reagents, where multiple signals appear to be
positive even in the absence of SARS-CoV-2.
Figure 19: Contaminated reagents generate false-positives in SARS-CoV-2 testing.102
14.18. The CDC reported on contamination of reagents.104 Ten laboratories from 8 countries in
Europe reported contamination in commercially ordered primer and probe batches,
which led to SARS-CoV-2 reverse transcription PCR (RT-PCR) signals in their negative
controls. Five additional laboratories indicated that they received contaminated material,
but did not provide details.
60
14.19. False positive results, for SARS-CoV-2, have been reported due to contamination of the
nasal swabs themselves.105 106 If such swabs were contaminated with viable virus, the
testing itself could have spread the disease.
Cross contamination
14.20. The BBC Panorama programme exposed how PCR testing was being carried out in
extremely contamination prone environments with untrained personnel under time
pressure in England.107 The laboratories said in their defense that their results were
comparable with all other laboratories in the country. The laboratories used in the
comparison have similar issues.
14.21. The significant risk of false positive results comes from aerosols within the laboratory
resulting in cross contamination of negative samples with genetic material from positive
samples or the positive control. The CDC warns about that saying:108
“The most common cause of false-positive results is contamination with previously
amplified DNA. The use of real-time RT-PCR helps mitigate this problem by operating
as a contained system. A more difficult problem is the cross-contamination that can
occur between specimens during collection, shipping, and aliquoting in the laboratory.
Liberal use of negative control samples in each assay and a well-designed plan for
confirmatory testing can help ensure that laboratory contamination is detected and
that specimens are not inappropriately labeled as SARS-CoV positive.
In the absence of SARS-CoV transmission worldwide, the probability that a positive test
result will be a “false positive” is high. To decrease the possibility of a false-positive result,
testing should be limited to patients with a high index of suspicion for having SARS-CoV
disease. For information on the indications for SARS-CoV testing, see Clinical Guidance on
the Identification and Evaluation of Possible SARS-CoV Disease among Persons Presenting
with Community-Acquired Illness.
In addition, any positive specimen should be retested in a reference laboratory to confirm
that the specimen is positive. To be confident that a positive PCR specimen indicates that
the patient is infected with SARS-CoV, a second specimen should also be confirmed
61
positive. Finally, all laboratory results should be interpreted in the context of the clinical
and epidemiologic information available for the patient.”
Equipment errors
14.22. The specific RT-PCR methodology published by Drosten for SARS-CoV-2 testing and
similar protocols used throughout the world contain numerous suboptimal design
characteristics in the following six areas which are summarized then explained below:
14.22.1. Poor primer design - the primers specified in the Drosten paper contained
unspecified parts of the sequence (uncertain or “wobbly” positions) that could result in
64 different sequence combinations, some of which do not recognise SARS-CoV-2 at all.109
This risks primers binding to non-COVID DNA resulting in both false negative and false
positive results. The primers chosen can also bind to each other risking false positive or
false negative results.
14.22.2. Inadequate directions - every step of the protocol has flaws in that will
maximise false positive results.
14.22.3. Poor choice of genes for testing - the genes chosen also maximise the risk of
false positive results. Examples relevant to Canadian labs are examined in section 14.6.
14.22.4. Failure to thoroughly check the test will work in the real world - to ensure
testing would detect infectious cases it needed to be checked against tests that show
viable virus.
14.22.5. Poor recommendations for controls to mitigate against mistakes.110
14.22.6. Lack of advice on interpretation of the results.
14.23. Each amplification steps risk errors in both replication and binding which can result in
false positives.
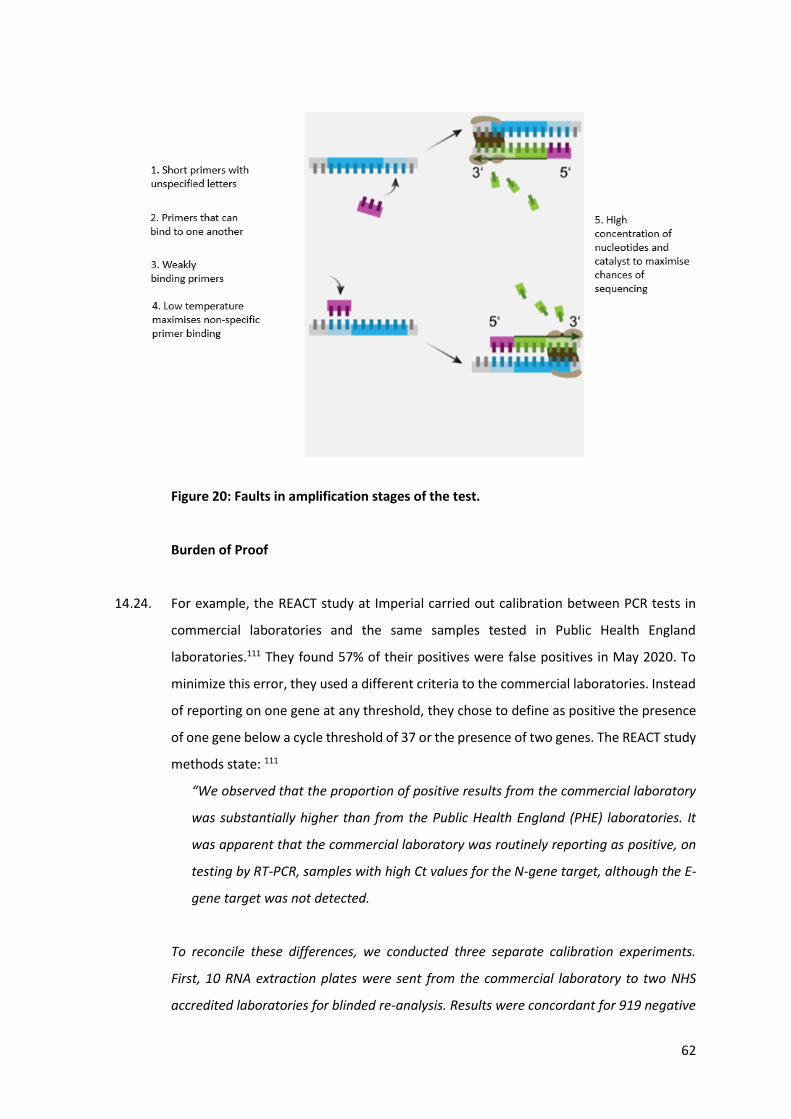
62
Figure 20: Faults in amplification stages of the test.
Burden of Proof
14.24. For example, the REACT study at Imperial carried out calibration between PCR tests in
commercial laboratories and the same samples tested in Public Health England
laboratories.111 They found 57% of their positives were false positives in May 2020. To
minimize this error, they used a different criteria to the commercial laboratories. Instead
of reporting on one gene at any threshold, they chose to define as positive the presence
of one gene below a cycle threshold of 37 or the presence of two genes. The REACT study
methods state: 111
“We observed that the proportion of positive results from the commercial laboratory
was substantially higher than from the Public Health England (PHE) laboratories. It
was apparent that the commercial laboratory was routinely reporting as positive, on
testing by RT-PCR, samples with high Ct values for the N-gene target, although the E-
gene target was not detected.
To reconcile these differences, we conducted three separate calibration experiments.
First, 10 RNA extraction plates were sent from the commercial laboratory to two NHS
accredited laboratories for blinded re-analysis. Results were concordant for 919 negative
63
samples and all 40 controls. We detected viral RNA in 11 of the 19 samples reported
positive by the commercial laboratory (N-gene Ct-value range 16.5 to 40.7); 10 of these
11 samples had an N-gene Ct value < 37. Second, the commercial laboratory conducted a
serial dilution experiment of known positive samples with high viral load to assess Ct
thresholds at the limit of detection. Third, a further 40 unblinded positive samples (on 19
plates) with Ct values (N-gene) > 35 (range 35.7 to 46.8) and without a signal for the E-
gene were selectively re-analyzed in a PHE reference laboratory; SARS CoV-2 RNA was
detected in 15/40 (38%) (2/4 with N-gene Ct value < 37). As a result of these calibration
experiments, we report swab-positivity for positive samples reported by the commercial
laboratory where N-gene Ct values < 37 or where virus was detected by both N-gene and
E-gene targets.”
Interpretation of the results / Cycle threshold (Ct) interpretation
14.25. Interpretation of the results of the type of PCR carried out for COVID (RT-PCR) requires
skill. The result of the testing is a trajectory showing how the signal developed with each
cycle of DNA amplification. A positive test will demonstrate an exponential increase and
will reach a threshold that defines positivity.
14.26. If the test is intended to identify infectious individuals, samples that only test positive
once 35 cycles of doubling have taken place will be entirely false positives (in the sense
that live, replicable virus is unlikely to be present) (see section 12). After 45 cycles, there
will be tens of trillions of copies of the original sequence. Protocols could be adequate if
combined with advice to not consider tests turning positive only after 35 cycles to be
considered a positive result. Results positive after 25 cycles should not be considered
diagnostic of the fact that a person has been infected with SARS-CoV-2, has COVID and is
capable of infecting others. Where there is a strong clinical suspicion, with pneumonia or
clotting abnormalities, then a positive result after 25 cycles should necessitate
confirmatory testing, ideally with a different test. However, this has not been done.
14.27. The choice of threshold is critical to determining the correct result. A judgement must be
made each time RT-PCR is run as to where this threshold lies. The decision is based on
the degree of positivity of the positive and negative controls, but inevitably, the shape of
graphs from the test results will also influence where a reasonable threshold may be set.
64
14.28. Finally, results that become positive only after minimal cycles, only after numerous
cycles, or after a linear increase should be flagged, and those samples retested as
unreliable results.
14.29. The decision about where the threshold is put for each test run would, in the past, be
taken by a skilled scientist. The positioning of the threshold determines which cases will
be considered positive and at what Ct value (see figure 16). As well as considering the
signal from the positive and negative control for that run, it is also important to consider
the results from the samples in that run. If there are samples with a convincing
exponential rise in positivity, then the threshold will be set to ensure such samples will
test positive.
14.30. However, for COVID, rather than using skilled scientists, a software is being used with
artificial intelligence to determine the positioning of the threshold. UgenTec won a
contract with the UK government to provide software to carry out this interpretation.
Canada is also using the same software112. The choice of threshold and the credibility of
the test result graphs is, therefore, not being determined by skilled operators and it is not
clear how much manual auditing of results by skilled operators has taken place.
14.31. Medical regulators have criteria that a machine being used for diagnosis would need to
pass to be approved. Clinical validation, where the device can be tested against real
world clinical cases to judge its accuracy is carried out. The assumption is that the
machine will remain constant and that results will be reproducible over time.
14.32. Rather than apply for approval of the software itself, UgenTec have passed the
responsibility on to laboratories, such that approval must be sought for each assay using
their software113.
14.33. It is not clear whether this software includes artificial intelligence with active learning.
This is where artificial intelligence continually adapts to adjust its conclusions based on a
continuing supply of new information. This may result in drift of the criteria for a positive
over time. It is also unclear how much manual auditing of results has taken place.
65
14.34. Diagnostics.ai successfully sued the UK Government for £2m because UgenTec testing
had a high false negative rate.114 If the decision tool places the threshold too high,
resulting in false negatives, similar errors in decision making could result in placing it too
low resulting in false positives.
Checking against controls
14.35. Control samples are required to calibrate the testing when using it in the laboratory for
the first time and on an ongoing basis to ensure errors have not developed over time.
Positive controls
14.36. Positive controls are used to measure the false negative rate. A positive control should
be a real patient sample to represent the full complexity of real samples, with their
complex genetic makeup of human and bacterial genetic material. Synthetic RNA controls
have been used for SARS-CoV-2.
14.37. Where synthetic controls are used, it is possible to draw conclusions about what Ct Value
is of relevance for interpretation of the results of these controls. However, these results
cannot be extrapolated to real world samples. These have much greater complexity in
terms of what the sample contains, which means that they are at a higher risk of testing
errors.
Negative controls
14.38. To measure the false positive rate, controls are needed, which should test negative. A
negative control also needs to be a real patient sample and need to contain other viral or
bacterial, as well as human DNA, to ensure that cross-reactivity (where one infective
agent can be mistaken for another) is not occurring. The test was approved after checking
against a handful of each type of bacteria or virus provides good evidence that cross-
reactivity is not guaranteed to happen. However, a particular sample type may give a
false positive result at a rate of 10% or fewer of samples tested. In order to identify such
a problem, more than a handful of samples of this type would need to be tested. A study
66
of 100s to 1000s of such samples would be needed to be statistically valid. Such a study
has not been carried out.
14.39. Marketing material from the TaqPath115 COVID-19 CE IVD RT-PCR Kit, approved by WHO
for emergency use, is reported by the manufacturer as containing elements that show
homology to Neisseria elongata,116 a very common nasopharyngeal bacteria. In the N-
gene assay, the forward primer showed ≥80% homology, while the reverse primer and
probe showed 36% homology.
15. The use of confirmatory testing to validate PCR
15.1. The risk of false positives from mass testing is well understood and can be minimized by
using confirmatory testing.117
15.2. All cancer screening programs require confirmatory testing and this can be multilayered.
For example, first line cervical cancer screening is carried using validated PCR testing kits
manufactured to strict standards.118 This testing has a false positive rate of between 7
and 10%.119 The true positive rate for cervical cancer is only 9 in 100,000 i.e. 0.009%.120
That is between 1 in 14 and 1 in 10 women being screened have a false positive PCR
result. Rather than declaring 1 in 10 women being screened as being pre-cancerous based
on a false positive result, further steps are taken. The women have a cervical smear
performed and a colposcopy examination (where the cervix is examined directly by an
experienced gynecologist), and most also have a lesion confirmed by biopsy before a
diagnosis is made. The treating doctors do not use a single test to make a diagnosis.
Rather, the diagnosis is a weighing up of the probability of there being a precancerous
lesion. This evidence is evaluated against the probability of a false positive result. There
are particular clinical scenarios where overcalling happens more frequently, and these
will each be considered before a diagnosis is rendered.
Confirmatory testing recommendations
15.3. Confirmatory testing must be carried out on all cases in order to minimize false positive
results. A basic principle of mass testing is that the first test is a screening test and, for
those found positive on screening, a subsequent positive confirmatory test is required to
67
make the diagnosis.121 Subsequent testing carried out on only a subset of the positive
results is not confirmatory testing, but external quality assurance.
15.4. The WHO set out these guidelines for confirmatory testing on 19th March 2020:122
“Laboratory confirmation of cases by NAAT in areas with no known COVID-19 virus
circulation. To consider a case as laboratory-confirmed by NAAT in an area with no
COVID-19 virus circulation, one of the following conditions need to be met: A positive
NAAT result for at least two different targets on the COVID-19 virus genome, of which
at least one target is preferably specific for COVID-19 virus using a validated assay (as
at present no other SARS-like coronaviruses are circulating in the human population it
can be debated whether it must be COVID-19 or SARS-like coronavirus specific);
OR One positive NAAT result for the presence of betacoronavirus, and COVID-19 virus
further identified by sequencing partial or whole genome of the virus as long as the
sequence target is larger or different from the amplicon probed in the NAAT assay
used. When there are discordant results, the patient should be resampled and, if
appropriate, sequencing of the virus from the original specimen or of an amplicon
generated from an appropriate NAAT assay, different from the NAAT assay initially
used, should be obtained to provide a reliable test result. Laboratories are urged to
seek confirmation of any surprising results in an international reference laboratory.“
15.5. Canada uses whole genome sequencing to confirm a proportion of the PCR positive test
results. Whole genome sequencing requires a high volume of good quality DNA in the
sample, so this confirmatory testing does not act as quality control for the testing as a
whole, but only for the extreme cases of samples most likely to be positive.
15.6. The Canadian Consortium CanCOGen is responsible for whole genome sequencing of
SARS-CoV-2 samples in Canada. By December 2020, they had sequenced 25,197
genomes, which represents only 4.5% of the positive samples reported in Canada.123
15.7. The 22 scientists who called for the retraction of the Corman-Drosten Paper explained
how confirmatory testing is usually carried out for PCR testing:124
68
“To determine whether the amplified products are indeed SARS-CoV-2 genes,
biomolecular validation of amplified PCR products is essential. For a diagnostic test,
this validation is an absolute must.
Validation of PCR products should be performed by either running the PCR product in a
1% agarose-EtBr gel together with a size indicator (DNA ruler or DNA ladder) so that the
size of the product can be estimated. The size must correspond to the calculated size of
the amplification product. But it is even better to sequence the amplification product. The
latter will give 100% certainty about the identity of the amplification product. Without
molecular validation one cannot be sure about the identity of the amplified PCR
products…”
16. False positive errors in COVID PCR testing – overview and examples
16.1. A BMJ analysis in May 202041 assessed the quality of PCR testing. Their estimate for false
negative rates was between 2% and 29%. We concur with their following statement:
“No test gives a 100% accurate result; tests need to be evaluated to determine their
sensitivity and specificity, ideally by comparison with a “gold standard.” The lack of
such a clear-cut “gold-standard” for covid-19 testing makes evaluation of test
accuracy challenging.”
No evidence could be referenced for the false positive rate provided, so they used an
illustrative estimate of 5%.
16.2. The German External Quality Assessment carried out in April 2020 noted false positive
results. Several were due to mistaking one sample for another. However, there were
other false positive results and they commented (at bottom of page 20):78
(translated from German): “In addition, in some cases the tests with the SARS-CoV-2
negative control samples show 340060, 340062 and 340065 indicate specificity
problems that are independent of interchanges. It is to be clarified whether these false
positive results are due to a specificity problem of the tests used or to a cross-
contamination of SARS-CoV-2 during testing in the laboratories concerned.”
69
16.3. We concur with the authors of a Lancet publication, who said:16
“In our view, current PCR testing is therefore not the appropriate gold standard for
evaluating a SARS-CoV-2 public health test.”
“Once SARS-CoV-2 replication has been controlled by the immune system, RNA levels
detectable by PCR on respiratory secretions fall to very low levels when individuals
are much less likely to infect others. The remaining RNA copies can take weeks, or
occasionally months, to clear, during which time PCR remains positive.”
16.4. The CDC instruction manual for its 2019 Novel Coronavirus Real Time RT-PCR Diagnostic
Panel includes these statements,125 with which we agree:
“Detection of viral RNA may not indicate the presence of infectious virus or that 2019
nCoV is the causative agent for clinical symptoms.
This test cannot rule out diseases caused by other bacterial or viral pathogens.”
16.5. Examples of false positive problems from PCR testing include:
16.5.1. a quality control study for MERS126 testing carried out 2 years after
the outbreak: 8% of laboratories had false positive results (the overall rate was not
clear);
16.5.2. an outbreak of the coronavirus83 HCoV-OC43 in a care facility was
mistaken for SARS1 in 2003, thanks to false positive PCR and antibody testing
results;
16.5.3. PCR testing for the HCoV‐NL63 coronavirus82 produced false positive
results, when there was cross-reactivity with human X-chromosome DNA.
16.6. The more genes that are tested for, the better the test will be at identifying real COVID
and not mistaking other DNA or RNA for COVID. There are likely numerous coronaviruses
capable of infecting humans. As these are usually mild infections, there has been little
incentive to characterize them all and only seven have a known sequence. As these are
related to COVID, and will therefore have similar genetic sequences, it is critical to
properly evaluate the COVID RT-PCR test against these related viruses.
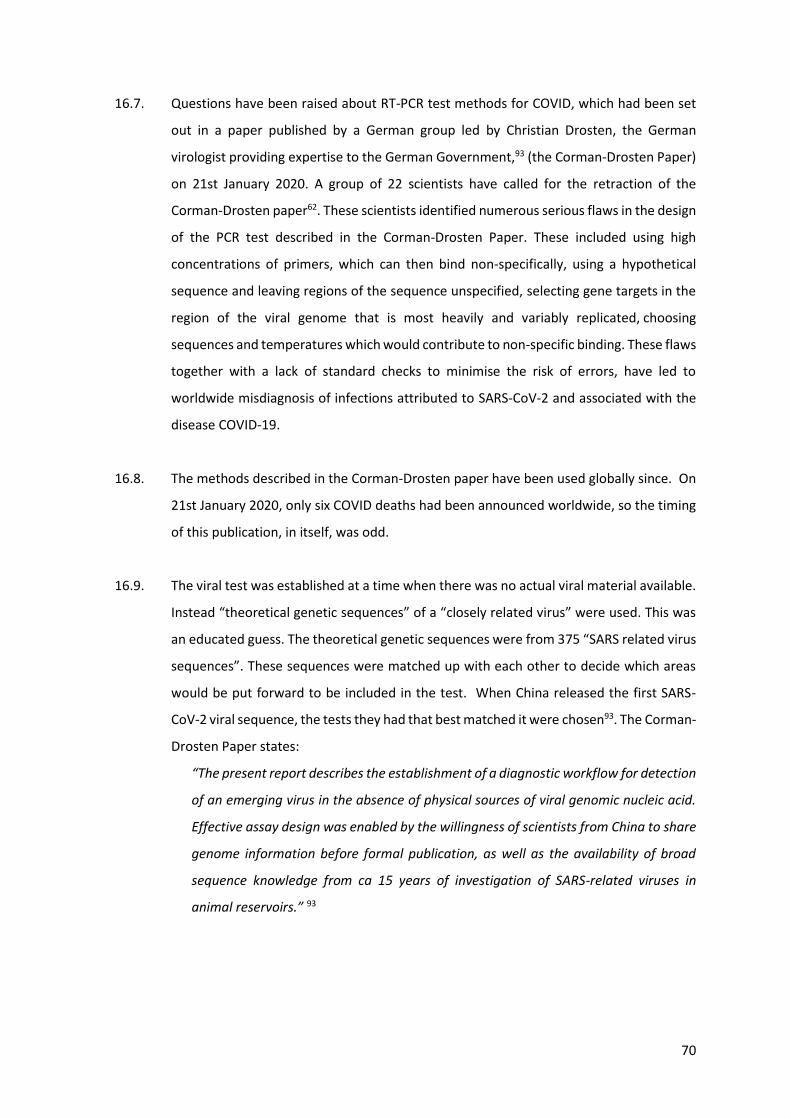
70
16.7. Questions have been raised about RT-PCR test methods for COVID, which had been set
out in a paper published by a German group led by Christian Drosten, the German
virologist providing expertise to the German Government,93 (the Corman-Drosten Paper)
on 21st January 2020. A group of 22 scientists have called for the retraction of the
Corman-Drosten paper62. These scientists identified numerous serious flaws in the design
of the PCR test described in the Corman-Drosten Paper. These included using high
concentrations of primers, which can then bind non-specifically, using a hypothetical
sequence and leaving regions of the sequence unspecified, selecting gene targets in the
region of the viral genome that is most heavily and variably replicated, choosing
sequences and temperatures which would contribute to non-specific binding. These flaws
together with a lack of standard checks to minimise the risk of errors, have led to
worldwide misdiagnosis of infections attributed to SARS-CoV-2 and associated with the
disease COVID-19.
16.8. The methods described in the Corman-Drosten paper have been used globally since. On
21st January 2020, only six COVID deaths had been announced worldwide, so the timing
of this publication, in itself, was odd.
16.9. The viral test was established at a time when there was no actual viral material available.
Instead “theoretical genetic sequences” of a “closely related virus” were used. This was
an educated guess. The theoretical genetic sequences were from 375 “SARS related virus
sequences”. These sequences were matched up with each other to decide which areas
would be put forward to be included in the test. When China released the first SARS-
CoV-2 viral sequence, the tests they had that best matched it were chosen93. The Corman-
Drosten Paper states:
“The present report describes the establishment of a diagnostic workflow for detection
of an emerging virus in the absence of physical sources of viral genomic nucleic acid.
Effective assay design was enabled by the willingness of scientists from China to share
genome information before formal publication, as well as the availability of broad
sequence knowledge from ca 15 years of investigation of SARS-related viruses in
animal reservoirs.” 93
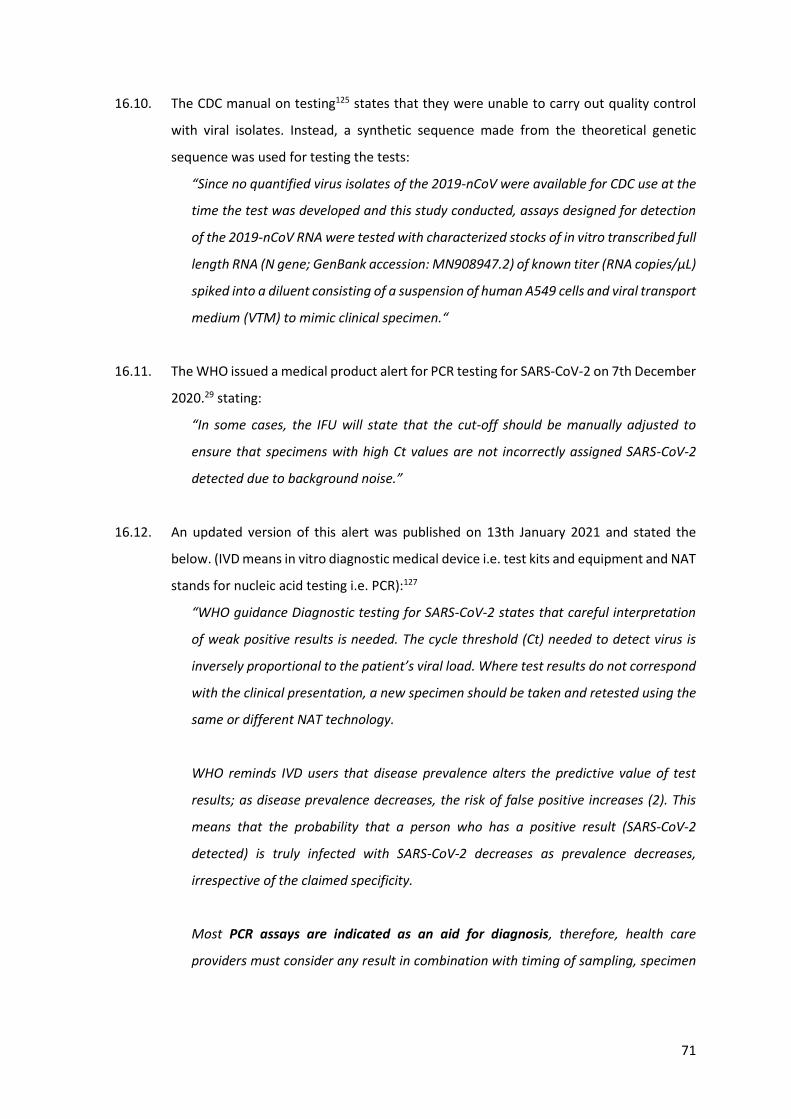
71
16.10. The CDC manual on testing125 states that they were unable to carry out quality control
with viral isolates. Instead, a synthetic sequence made from the theoretical genetic
sequence was used for testing the tests:
“Since no quantified virus isolates of the 2019-nCoV were available for CDC use at the
time the test was developed and this study conducted, assays designed for detection
of the 2019-nCoV RNA were tested with characterized stocks of in vitro transcribed full
length RNA (N gene; GenBank accession: MN908947.2) of known titer (RNA copies/µL)
spiked into a diluent consisting of a suspension of human A549 cells and viral transport
medium (VTM) to mimic clinical specimen.“
16.11. The WHO issued a medical product alert for PCR testing for SARS-CoV-2 on 7th December
2020.29 stating:
“In some cases, the IFU will state that the cut-off should be manually adjusted to
ensure that specimens with high Ct values are not incorrectly assigned SARS-CoV-2
detected due to background noise.”
16.12. An updated version of this alert was published on 13th January 2021 and stated the
below. (IVD means in vitro diagnostic medical device i.e. test kits and equipment and NAT
stands for nucleic acid testing i.e. PCR):127
“WHO guidance Diagnostic testing for SARS-CoV-2 states that careful interpretation
of weak positive results is needed. The cycle threshold (Ct) needed to detect virus is
inversely proportional to the patient’s viral load. Where test results do not correspond
with the clinical presentation, a new specimen should be taken and retested using the
same or different NAT technology.
WHO reminds IVD users that disease prevalence alters the predictive value of test
results; as disease prevalence decreases, the risk of false positive increases (2). This
means that the probability that a person who has a positive result (SARS-CoV-2
detected) is truly infected with SARS-CoV-2 decreases as prevalence decreases,
irrespective of the claimed specificity.
Most PCR assays are indicated as an aid for diagnosis, therefore, health care
providers must consider any result in combination with timing of sampling, specimen
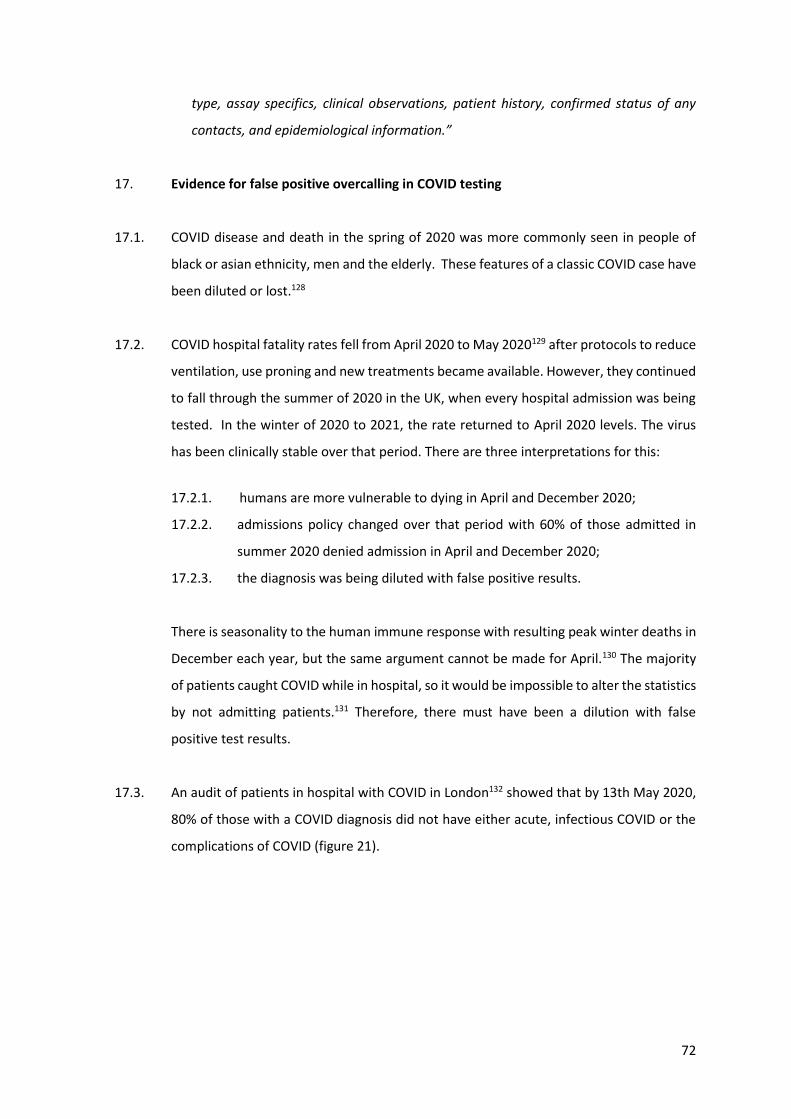
72
type, assay specifics, clinical observations, patient history, confirmed status of any
contacts, and epidemiological information.”
17. Evidence for false positive overcalling in COVID testing
17.1. COVID disease and death in the spring of 2020 was more commonly seen in people of
black or asian ethnicity, men and the elderly. These features of a classic COVID case have
been diluted or lost.128
17.2. COVID hospital fatality rates fell from April 2020 to May 2020129 after protocols to reduce
ventilation, use proning and new treatments became available. However, they continued
to fall through the summer of 2020 in the UK, when every hospital admission was being
tested. In the winter of 2020 to 2021, the rate returned to April 2020 levels. The virus
has been clinically stable over that period. There are three interpretations for this:
17.2.1. humans are more vulnerable to dying in April and December 2020;
17.2.2. admissions policy changed over that period with 60% of those admitted in
summer 2020 denied admission in April and December 2020;
17.2.3. the diagnosis was being diluted with false positive results.
There is seasonality to the human immune response with resulting peak winter deaths in
December each year, but the same argument cannot be made for April.130 The majority
of patients caught COVID while in hospital, so it would be impossible to alter the statistics
by not admitting patients.131 Therefore, there must have been a dilution with false
positive test results.
17.3. An audit of patients in hospital with COVID in London132 showed that by 13th May 2020,
80% of those with a COVID diagnosis did not have either acute, infectious COVID or the
complications of COVID (figure 21).
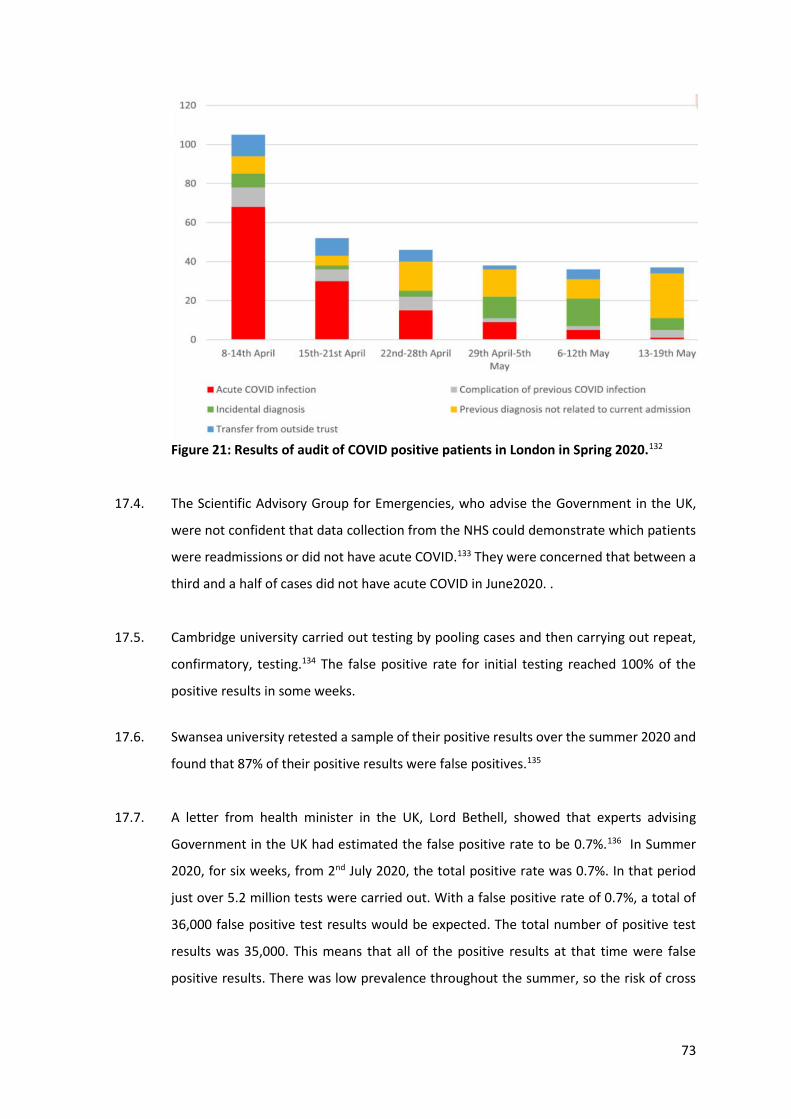
73
Figure 21: Results of audit of COVID positive patients in London in Spring 2020.132
17.4. The Scientific Advisory Group for Emergencies, who advise the Government in the UK,
were not confident that data collection from the NHS could demonstrate which patients
were readmissions or did not have acute COVID.133 They were concerned that between a
third and a half of cases did not have acute COVID in June2020. .
17.5. Cambridge university carried out testing by pooling cases and then carrying out repeat,
confirmatory, testing.134 The false positive rate for initial testing reached 100% of the
positive results in some weeks.
17.6. Swansea university retested a sample of their positive results over the summer 2020 and
found that 87% of their positive results were false positives.135
17.7. A letter from health minister in the UK, Lord Bethell, showed that experts advising
Government in the UK had estimated the false positive rate to be 0.7%.136 In Summer
2020, for six weeks, from 2nd July 2020, the total positive rate was 0.7%. In that period
just over 5.2 million tests were carried out. With a false positive rate of 0.7%, a total of
36,000 false positive test results would be expected. The total number of positive test
results was 35,000. This means that all of the positive results at that time were false
positive results. There was low prevalence throughout the summer, so the risk of cross
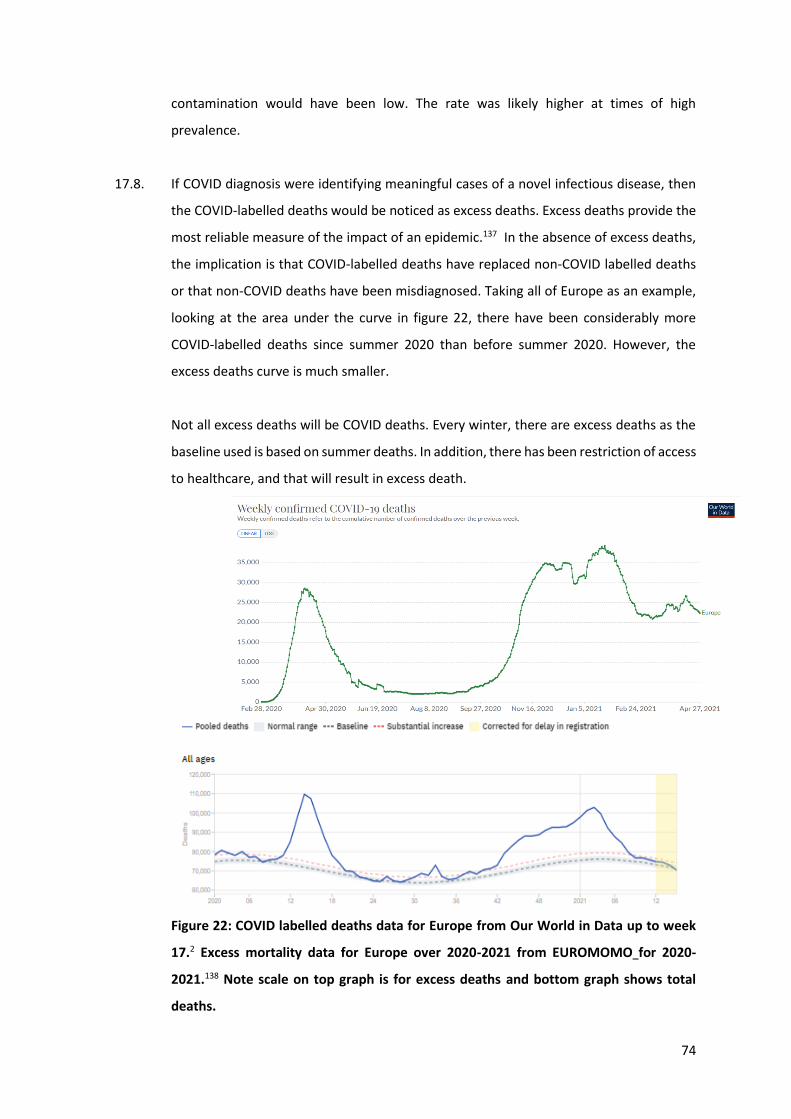
74
contamination would have been low. The rate was likely higher at times of high
prevalence.
17.8. If COVID diagnosis were identifying meaningful cases of a novel infectious disease, then
the COVID-labelled deaths would be noticed as excess deaths. Excess deaths provide the
most reliable measure of the impact of an epidemic.137 In the absence of excess deaths,
the implication is that COVID-labelled deaths have replaced non-COVID labelled deaths
or that non-COVID deaths have been misdiagnosed. Taking all of Europe as an example,
looking at the area under the curve in figure 22, there have been considerably more
COVID-labelled deaths since summer 2020 than before summer 2020. However, the
excess deaths curve is much smaller.
Not all excess deaths will be COVID deaths. Every winter, there are excess deaths as the
baseline used is based on summer deaths. In addition, there has been restriction of access
to healthcare, and that will result in excess death.
Figure 22: COVID labelled deaths data for Europe from Our World in Data up to week
17.2 Excess mortality data for Europe over 2020-2021 from EUROMOMO for 2020-
2021.138 Note scale on top graph is for excess deaths and bottom graph shows total
deaths.
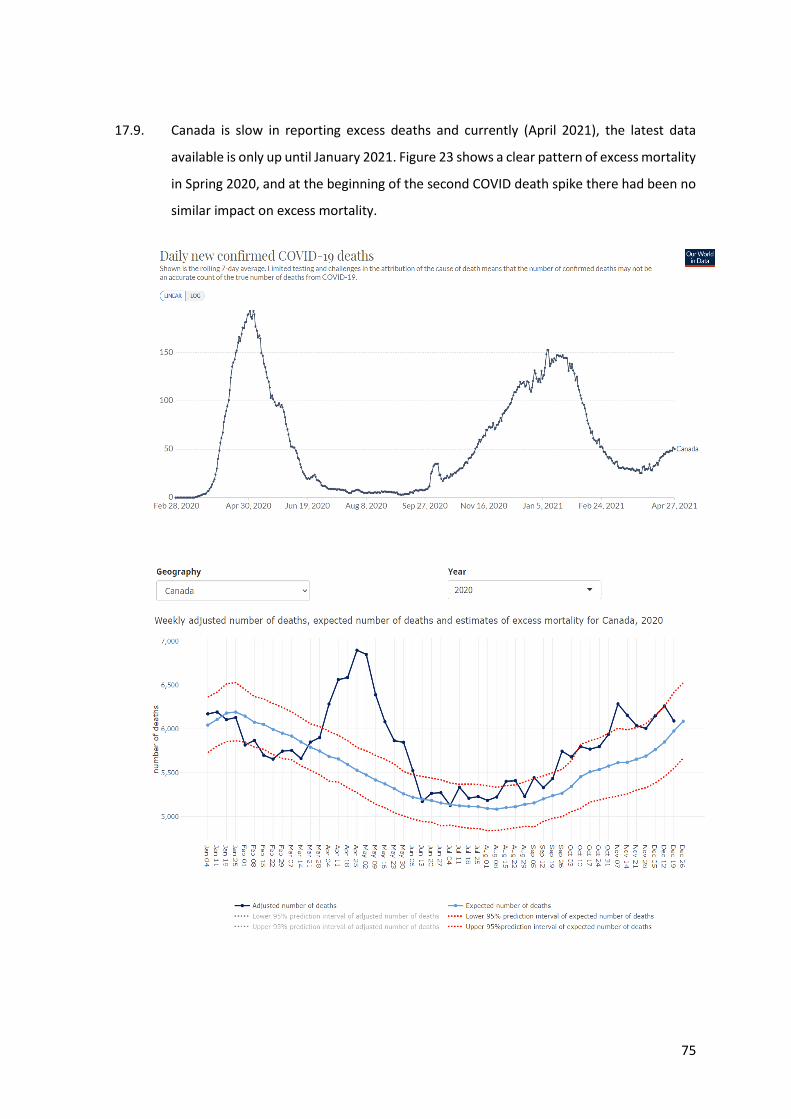
75
17.9. Canada is slow in reporting excess deaths and currently (April 2021), the latest data
available is only up until January 2021. Figure 23 shows a clear pattern of excess mortality
in Spring 2020, and at the beginning of the second COVID death spike there had been no
similar impact on excess mortality.
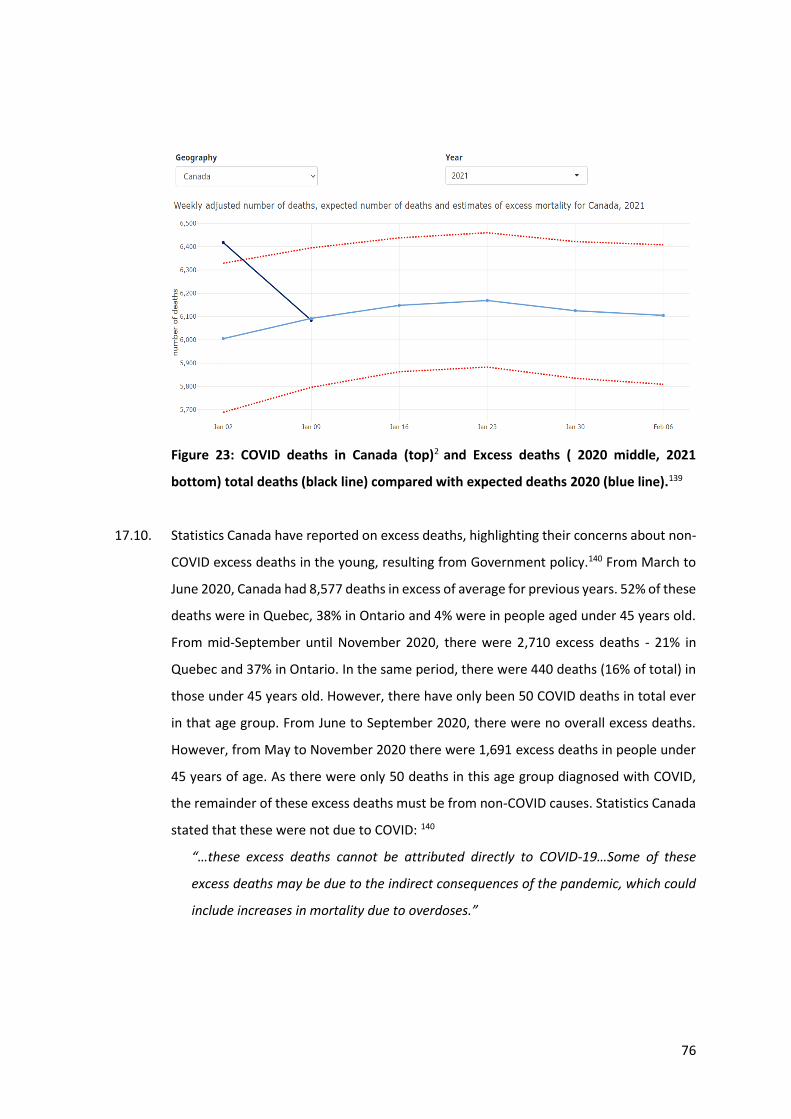
76
Figure 23: COVID deaths in Canada (top)2 and Excess deaths ( 2020 middle, 2021
bottom) total deaths (black line) compared with expected deaths 2020 (blue line).139
17.10. Statistics Canada have reported on excess deaths, highlighting their concerns about non-
COVID excess deaths in the young, resulting from Government policy.140 From March to
June 2020, Canada had 8,577 deaths in excess of average for previous years. 52% of these
deaths were in Quebec, 38% in Ontario and 4% were in people aged under 45 years old.
From mid-September until November 2020, there were 2,710 excess deaths - 21% in
Quebec and 37% in Ontario. In the same period, there were 440 deaths (16% of total) in
those under 45 years old. However, there have only been 50 COVID deaths in total ever
in that age group. From June to September 2020, there were no overall excess deaths.
However, from May to November 2020 there were 1,691 excess deaths in people under
45 years of age. As there were only 50 deaths in this age group diagnosed with COVID,
the remainder of these excess deaths must be from non-COVID causes. Statistics Canada
stated that these were not due to COVID: 140
“…these excess deaths cannot be attributed directly to COVID-19…Some of these
excess deaths may be due to the indirect consequences of the pandemic, which could
include increases in mortality due to overdoses.”
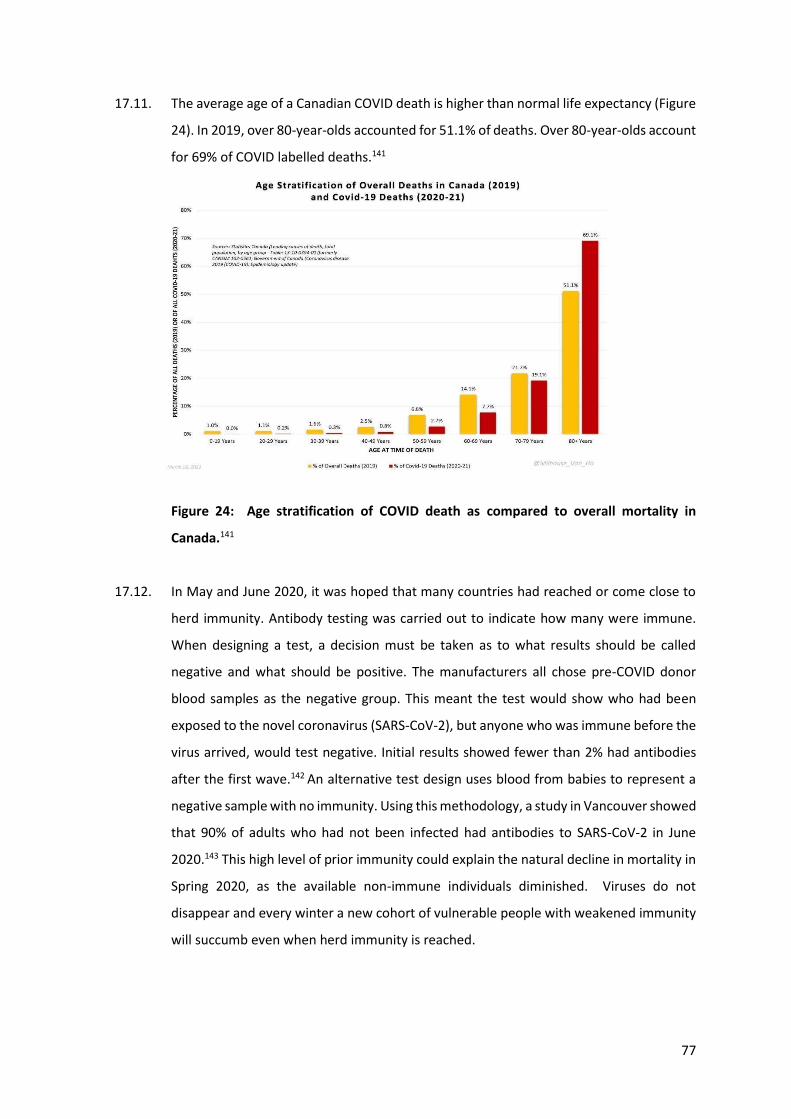
77
17.11. The average age of a Canadian COVID death is higher than normal life expectancy (Figure
24). In 2019, over 80-year-olds accounted for 51.1% of deaths. Over 80-year-olds account
for 69% of COVID labelled deaths.141
Figure 24: Age stratification of COVID death as compared to overall mortality in
Canada.141
17.12. In May and June 2020, it was hoped that many countries had reached or come close to
herd immunity. Antibody testing was carried out to indicate how many were immune.
When designing a test, a decision must be taken as to what results should be called
negative and what should be positive. The manufacturers all chose pre-COVID donor
blood samples as the negative group. This meant the test would show who had been
exposed to the novel coronavirus (SARS-CoV-2), but anyone who was immune before the
virus arrived, would test negative. Initial results showed fewer than 2% had antibodies
after the first wave.142 An alternative test design uses blood from babies to represent a
negative sample with no immunity. Using this methodology, a study in Vancouver showed
that 90% of adults who had not been infected had antibodies to SARS-CoV-2 in June
2020.143 This high level of prior immunity could explain the natural decline in mortality in
Spring 2020, as the available non-immune individuals diminished. Viruses do not
disappear and every winter a new cohort of vulnerable people with weakened immunity
will succumb even when herd immunity is reached.
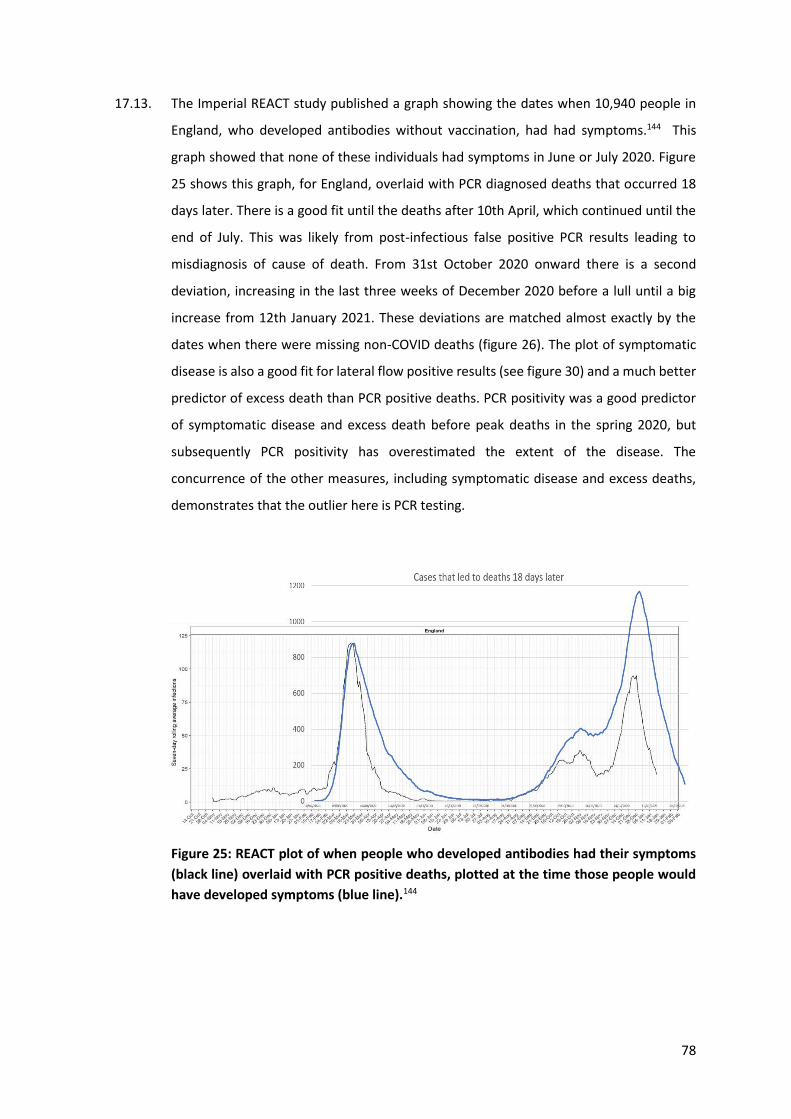
78
17.13. The Imperial REACT study published a graph showing the dates when 10,940 people in
England, who developed antibodies without vaccination, had had symptoms.144 This
graph showed that none of these individuals had symptoms in June or July 2020. Figure
25 shows this graph, for England, overlaid with PCR diagnosed deaths that occurred 18
days later. There is a good fit until the deaths after 10th April, which continued until the
end of July. This was likely from post-infectious false positive PCR results leading to
misdiagnosis of cause of death. From 31st October 2020 onward there is a second
deviation, increasing in the last three weeks of December 2020 before a lull until a big
increase from 12th January 2021. These deviations are matched almost exactly by the
dates when there were missing non-COVID deaths (figure 26). The plot of symptomatic
disease is also a good fit for lateral flow positive results (see figure 30) and a much better
predictor of excess death than PCR positive deaths. PCR positivity was a good predictor
of symptomatic disease and excess death before peak deaths in the spring 2020, but
subsequently PCR positivity has overestimated the extent of the disease. The
concurrence of the other measures, including symptomatic disease and excess deaths,
demonstrates that the outlier here is PCR testing.
Figure 25: REACT plot of when people who developed antibodies had their symptoms
(black line) overlaid with PCR positive deaths, plotted at the time those people would
have developed symptoms (blue line).144
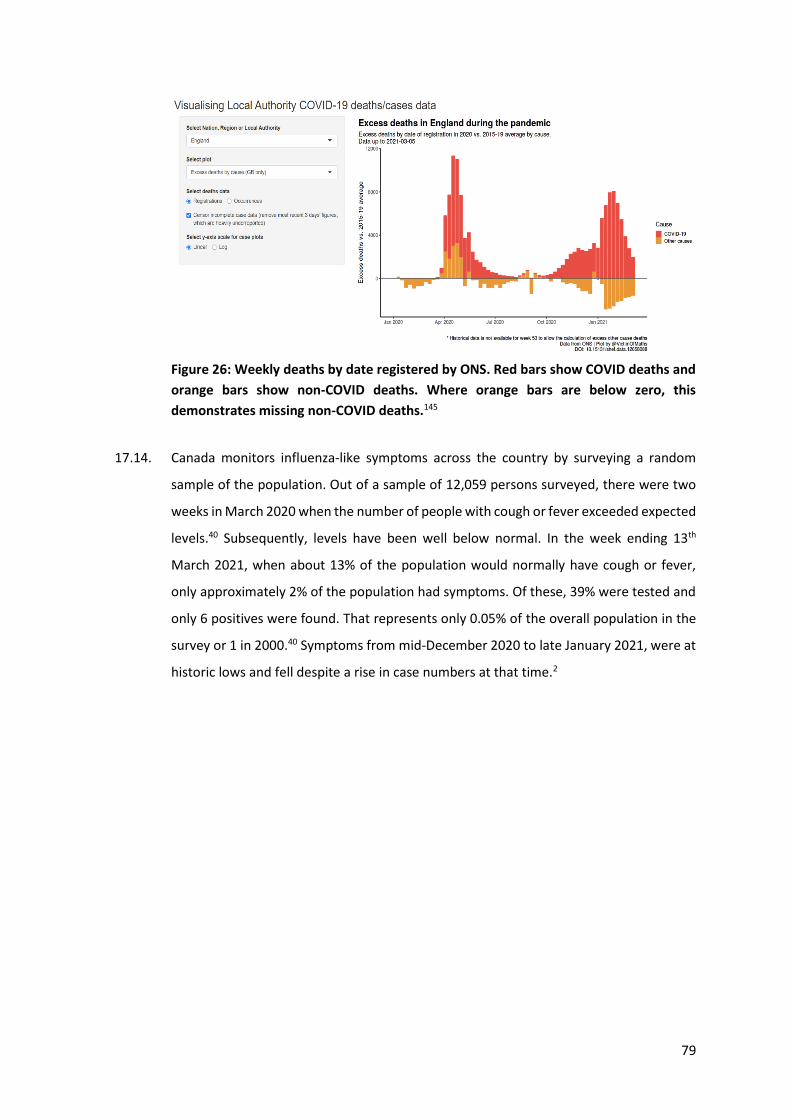
79
Figure 26: Weekly deaths by date registered by ONS. Red bars show COVID deaths and
orange bars show non-COVID deaths. Where orange bars are below zero, this
demonstrates missing non-COVID deaths.145
17.14. Canada monitors influenza-like symptoms across the country by surveying a random
sample of the population. Out of a sample of 12,059 persons surveyed, there were two
weeks in March 2020 when the number of people with cough or fever exceeded expected
levels.40 Subsequently, levels have been well below normal. In the week ending 13th
March 2021, when about 13% of the population would normally have cough or fever,
only approximately 2% of the population had symptoms. Of these, 39% were tested and
only 6 positives were found. That represents only 0.05% of the overall population in the
survey or 1 in 2000.40 Symptoms from mid-December 2020 to late January 2021, were at
historic lows and fell despite a rise in case numbers at that time.2
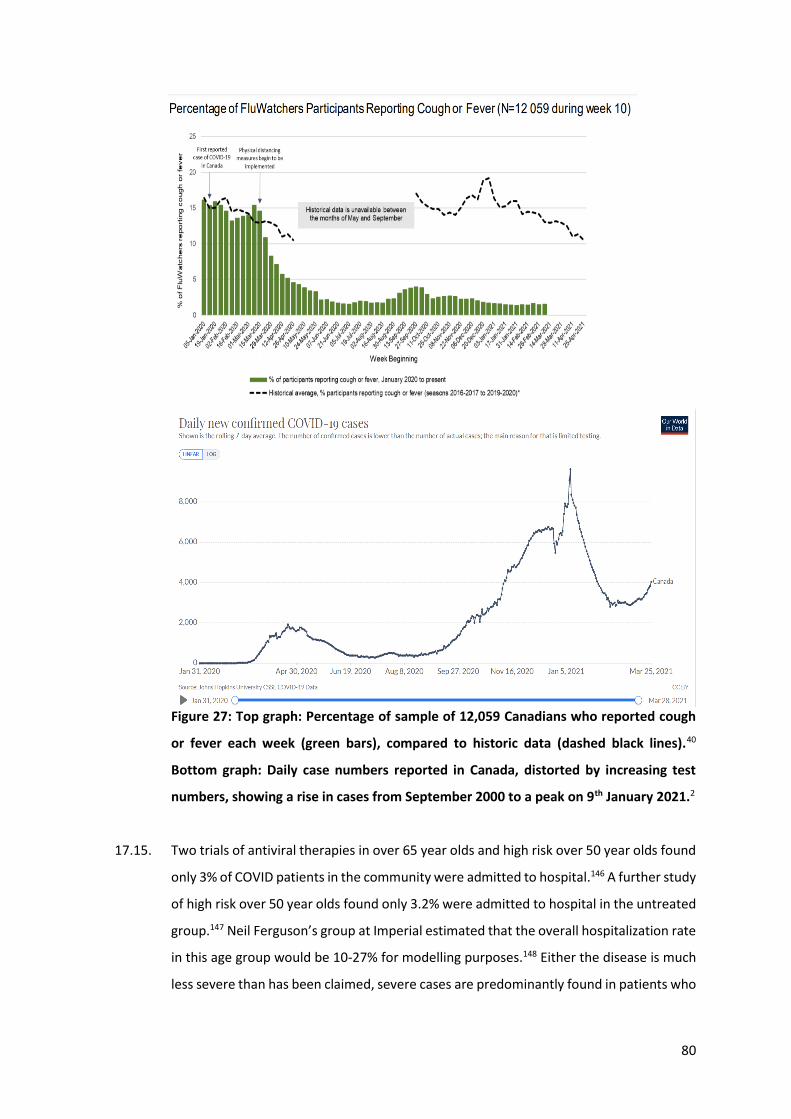
80
Figure 27: Top graph: Percentage of sample of 12,059 Canadians who reported cough
or fever each week (green bars), compared to historic data (dashed black lines).40
Bottom graph: Daily case numbers reported in Canada, distorted by increasing test
numbers, showing a rise in cases from September 2000 to a peak on 9th January 2021.2
17.15. Two trials of antiviral therapies in over 65 year olds and high risk over 50 year olds found
only 3% of COVID patients in the community were admitted to hospital.146 A further study
of high risk over 50 year olds found only 3.2% were admitted to hospital in the untreated
group.147 Neil Ferguson’s group at Imperial estimated that the overall hospitalization rate
in this age group would be 10-27% for modelling purposes.148 Either the disease is much
less severe than has been claimed, severe cases are predominantly found in patients who
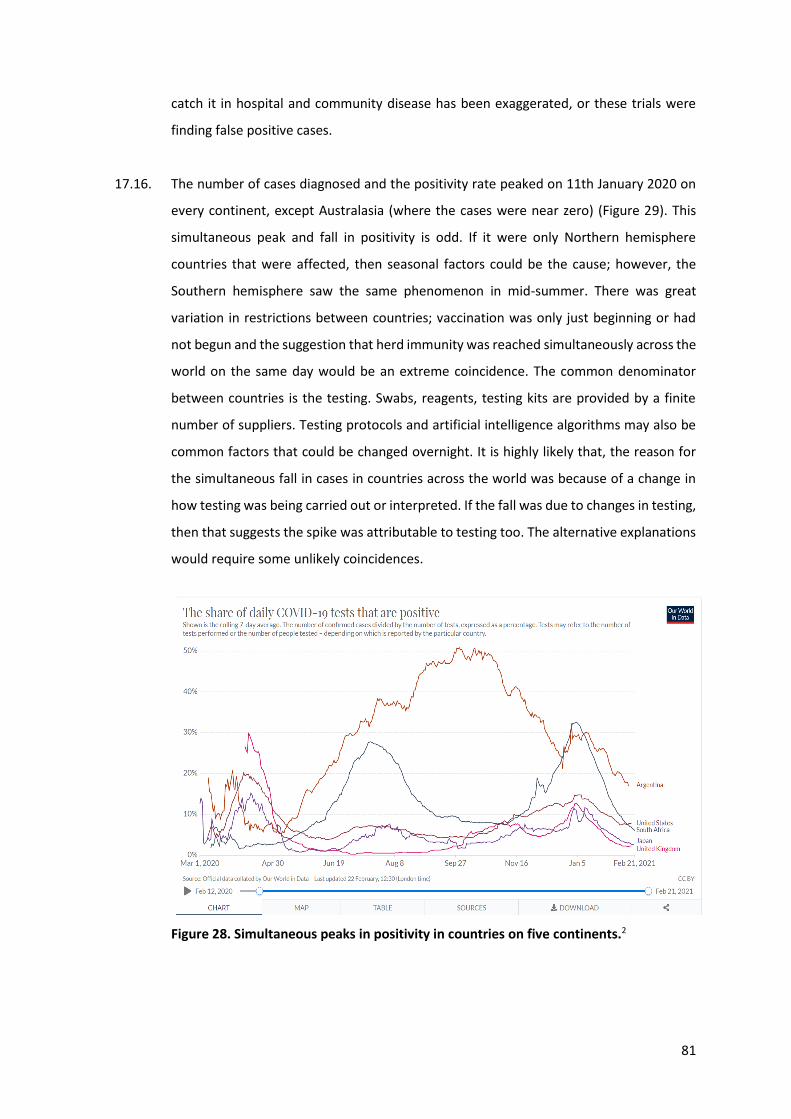
81
catch it in hospital and community disease has been exaggerated, or these trials were
finding false positive cases.
17.16. The number of cases diagnosed and the positivity rate peaked on 11th January 2020 on
every continent, except Australasia (where the cases were near zero) (Figure 29). This
simultaneous peak and fall in positivity is odd. If it were only Northern hemisphere
countries that were affected, then seasonal factors could be the cause; however, the
Southern hemisphere saw the same phenomenon in mid-summer. There was great
variation in restrictions between countries; vaccination was only just beginning or had
not begun and the suggestion that herd immunity was reached simultaneously across the
world on the same day would be an extreme coincidence. The common denominator
between countries is the testing. Swabs, reagents, testing kits are provided by a finite
number of suppliers. Testing protocols and artificial intelligence algorithms may also be
common factors that could be changed overnight. It is highly likely that, the reason for
the simultaneous fall in cases in countries across the world was because of a change in
how testing was being carried out or interpreted. If the fall was due to changes in testing,
then that suggests the spike was attributable to testing too. The alternative explanations
would require some unlikely coincidences.
Figure 28. Simultaneous peaks in positivity in countries on five continents.2
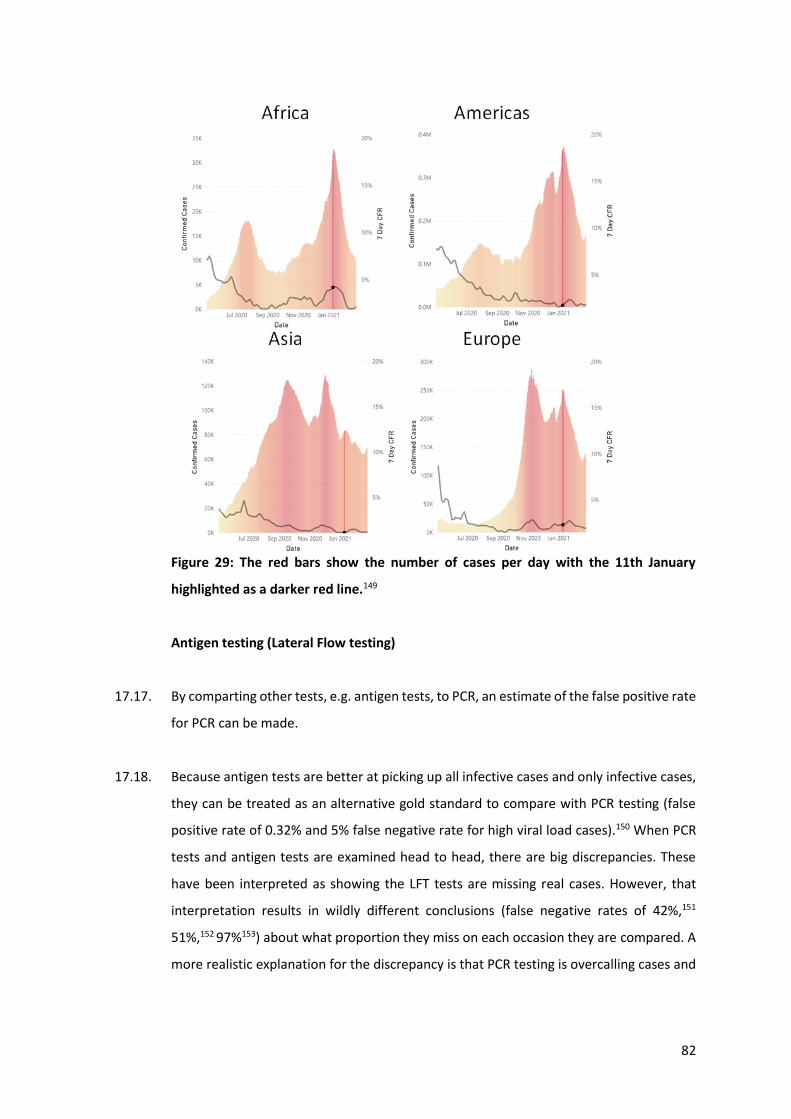
82
Figure 29: The red bars show the number of cases per day with the 11th January
highlighted as a darker red line.149
Antigen testing (Lateral Flow testing)
17.17. By comparting other tests, e.g. antigen tests, to PCR, an estimate of the false positive rate
for PCR can be made.
17.18. Because antigen tests are better at picking up all infective cases and only infective cases,
they can be treated as an alternative gold standard to compare with PCR testing (false
positive rate of 0.32% and 5% false negative rate for high viral load cases).150 When PCR
tests and antigen tests are examined head to head, there are big discrepancies. These
have been interpreted as showing the LFT tests are missing real cases. However, that
interpretation results in wildly different conclusions (false negative rates of 42%,151
51%,152 97%153) about what proportion they miss on each occasion they are compared. A
more realistic explanation for the discrepancy is that PCR testing is overcalling cases and
83
that the supposed false negative percentages from lateral flow testing are actually the
percentage of positive results that were false positives from PCR testing.
17.19. Using viral culture as a gold standard, and based on a population where 11% had the
disease, then a positive antigen test meant a 90% chance of having a real infection,
whereas a PCR positive test meant only a 74% chance of having infection.154 This means
the antigen test has a 10% false negative rate and PCR had a 26% false negative rate.
17.20. A separate study by a team at the CDC, also using viral culture, showed that the false
negative rate for lateral flow testing was 11%.155 Although not stated, from their figure it
can be estimated that almost two thirds of the PCR positive samples were viral culture
negative (including 20 with a Ct<18).
17.21. A comparison of three antigen tests, against viral culture, showed a false positive rate for
lateral flow tests of under 24%:156
“the sensitivity of the examined Ag-RDTs for the SARS-CoV-2 rRT-PCR reactive samples
within the standardized potential infectious range for the ORF1 gene reactive samples
was 76.2% (the Nal von Minden test), with a potential of up to 100% (the Roche and
LumiraDx tests).”
Only 52% of the PCR samples were positive on viral culture.
17.22. A Cochrane review of the literature on lateral flow testing said157:
“In people who did not have COVID‐19, antigen tests correctly ruled out infection in
99.5% of people with symptoms and 98.9% of people without symptoms.”
17.23. Mina et al have reviewed the evidence and commented that the 97% false negative rate
was found based on all cases where:16
“viral loads were very low (Ct ≥29 reflecting around <1000 RNA copies per mL in the
laboratory used)—when LFT should be negative.”
17.24. Lateral flow testing in the UK showed a six week period, in winter, where positivity was
above the baseline false positive rate. However, prior to and after this six week period,
the results indicate that there were no true positives and, therefore, no COVID in the
population being tested. However, PCR positivity continued to show significant positivity.
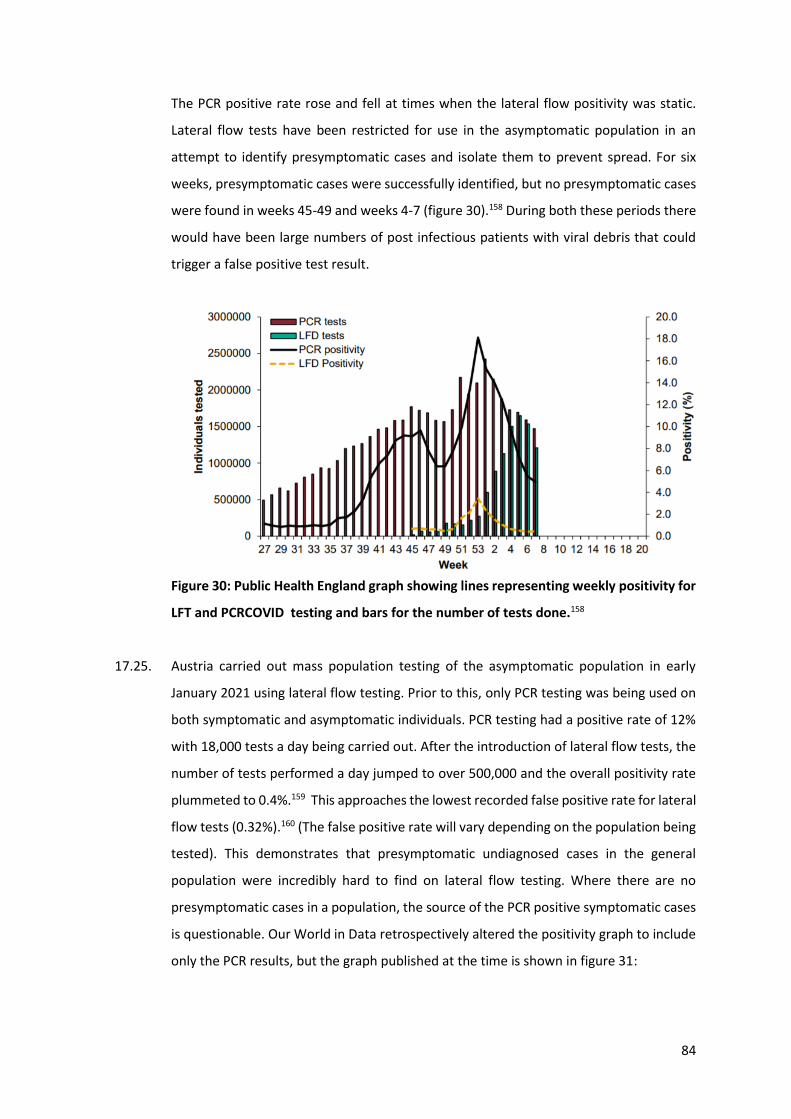
84
The PCR positive rate rose and fell at times when the lateral flow positivity was static.
Lateral flow tests have been restricted for use in the asymptomatic population in an
attempt to identify presymptomatic cases and isolate them to prevent spread. For six
weeks, presymptomatic cases were successfully identified, but no presymptomatic cases
were found in weeks 45-49 and weeks 4-7 (figure 30).158 During both these periods there
would have been large numbers of post infectious patients with viral debris that could
trigger a false positive test result.
Figure 30: Public Health England graph showing lines representing weekly positivity for
LFT and PCRCOVID testing and bars for the number of tests done.158
17.25. Austria carried out mass population testing of the asymptomatic population in early
January 2021 using lateral flow testing. Prior to this, only PCR testing was being used on
both symptomatic and asymptomatic individuals. PCR testing had a positive rate of 12%
with 18,000 tests a day being carried out. After the introduction of lateral flow tests, the
number of tests performed a day jumped to over 500,000 and the overall positivity rate
plummeted to 0.4%.159 This approaches the lowest recorded false positive rate for lateral
flow tests (0.32%).160 (The false positive rate will vary depending on the population being
tested). This demonstrates that presymptomatic undiagnosed cases in the general
population were incredibly hard to find on lateral flow testing. Where there are no
presymptomatic cases in a population, the source of the PCR positive symptomatic cases
is questionable. Our World in Data retrospectively altered the positivity graph to include
only the PCR results, but the graph published at the time is shown in figure 31:
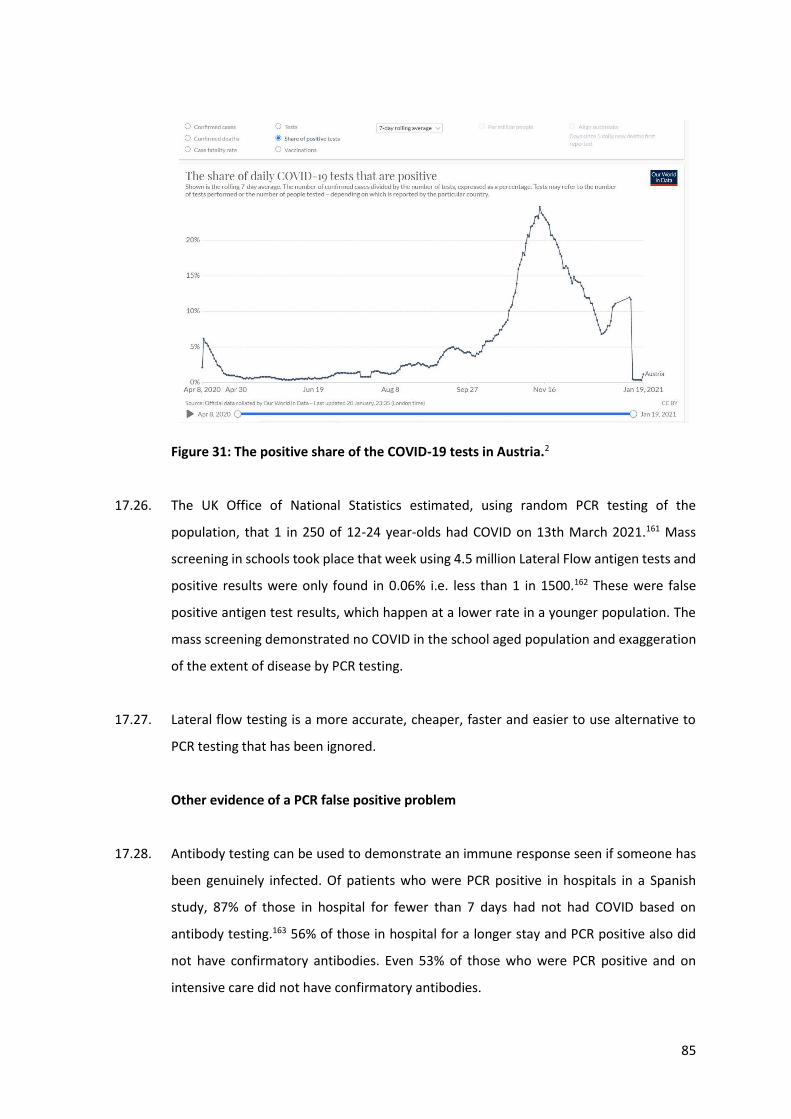
85
Figure 31: The positive share of the COVID-19 tests in Austria.2
17.26. The UK Office of National Statistics estimated, using random PCR testing of the
population, that 1 in 250 of 12-24 year-olds had COVID on 13th March 2021.161 Mass
screening in schools took place that week using 4.5 million Lateral Flow antigen tests and
positive results were only found in 0.06% i.e. less than 1 in 1500.162 These were false
positive antigen test results, which happen at a lower rate in a younger population. The
mass screening demonstrated no COVID in the school aged population and exaggeration
of the extent of disease by PCR testing.
17.27. Lateral flow testing is a more accurate, cheaper, faster and easier to use alternative to
PCR testing that has been ignored.
Other evidence of a PCR false positive problem
17.28. Antibody testing can be used to demonstrate an immune response seen if someone has
been genuinely infected. Of patients who were PCR positive in hospitals in a Spanish
study, 87% of those in hospital for fewer than 7 days had not had COVID based on
antibody testing.163 56% of those in hospital for a longer stay and PCR positive also did
not have confirmatory antibodies. Even 53% of those who were PCR positive and on
intensive care did not have confirmatory antibodies.
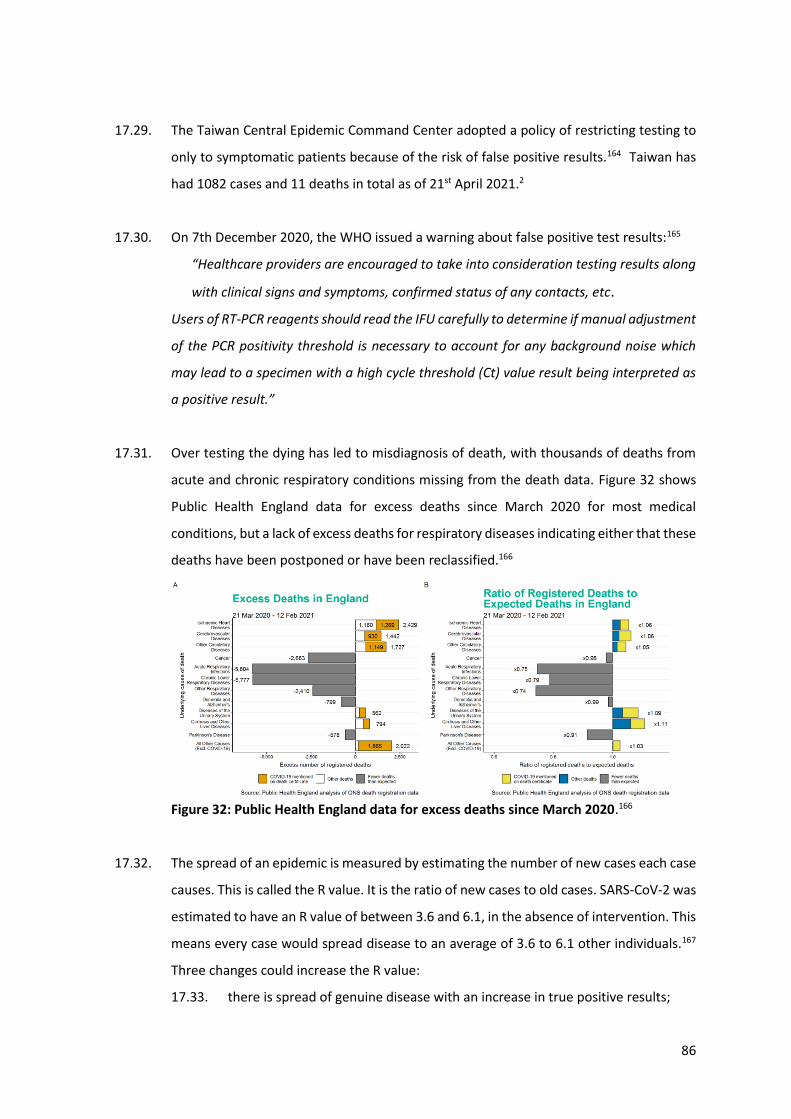
86
17.29. The Taiwan Central Epidemic Command Center adopted a policy of restricting testing to
only to symptomatic patients because of the risk of false positive results.164 Taiwan has
had 1082 cases and 11 deaths in total as of 21st April 2021.2
17.30. On 7th December 2020, the WHO issued a warning about false positive test results:165
“Healthcare providers are encouraged to take into consideration testing results along
with clinical signs and symptoms, confirmed status of any contacts, etc.
Users of RT-PCR reagents should read the IFU carefully to determine if manual adjustment
of the PCR positivity threshold is necessary to account for any background noise which
may lead to a specimen with a high cycle threshold (Ct) value result being interpreted as
a positive result.”
17.31. Over testing the dying has led to misdiagnosis of death, with thousands of deaths from
acute and chronic respiratory conditions missing from the death data. Figure 32 shows
Public Health England data for excess deaths since March 2020 for most medical
conditions, but a lack of excess deaths for respiratory diseases indicating either that these
deaths have been postponed or have been reclassified.166
Figure 32: Public Health England data for excess deaths since March 2020.166
17.32. The spread of an epidemic is measured by estimating the number of new cases each case
causes. This is called the R value. It is the ratio of new cases to old cases. SARS-CoV-2 was
estimated to have an R value of between 3.6 and 6.1, in the absence of intervention. This
means every case would spread disease to an average of 3.6 to 6.1 other individuals.167
Three changes could increase the R value:
17.33. there is spread of genuine disease with an increase in true positive results;
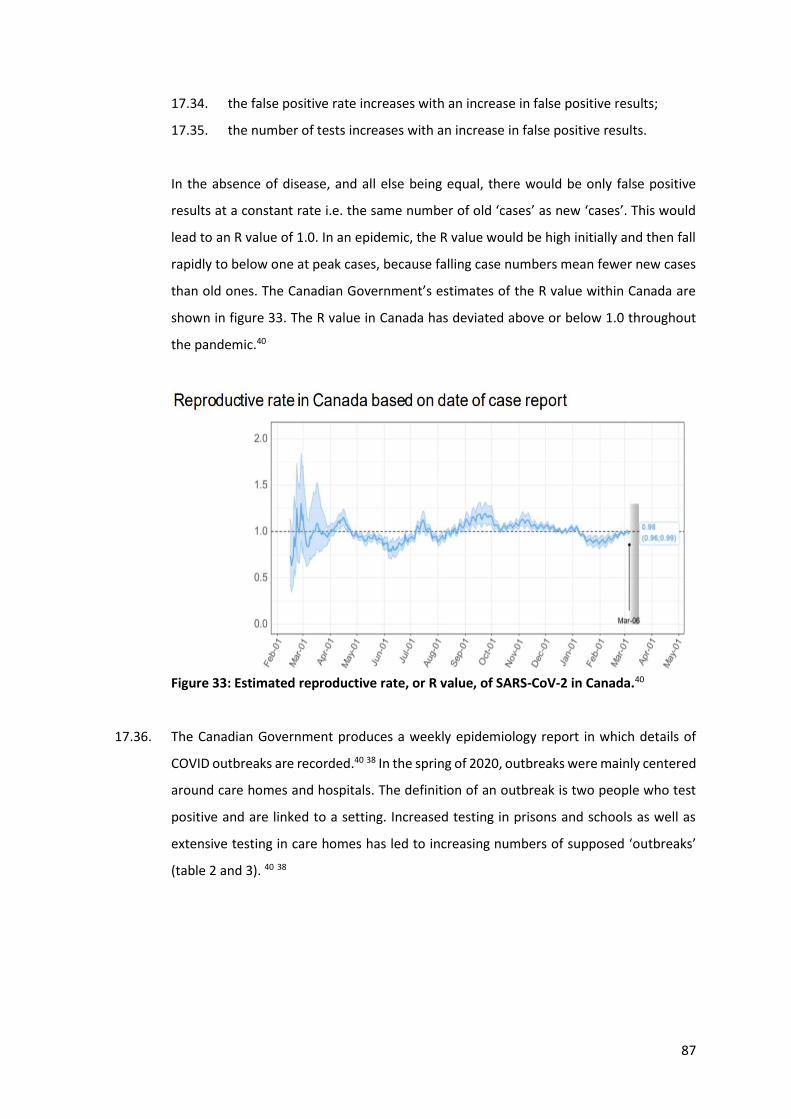
87
17.34. the false positive rate increases with an increase in false positive results;
17.35. the number of tests increases with an increase in false positive results.
In the absence of disease, and all else being equal, there would be only false positive
results at a constant rate i.e. the same number of old ‘cases’ as new ‘cases’. This would
lead to an R value of 1.0. In an epidemic, the R value would be high initially and then fall
rapidly to below one at peak cases, because falling case numbers mean fewer new cases
than old ones. The Canadian Government’s estimates of the R value within Canada are
shown in figure 33. The R value in Canada has deviated above or below 1.0 throughout
the pandemic.40
Figure 33: Estimated reproductive rate, or R value, of SARS-CoV-2 in Canada.40
17.36. The Canadian Government produces a weekly epidemiology report in which details of
COVID outbreaks are recorded.40 38 In the spring of 2020, outbreaks were mainly centered
around care homes and hospitals. The definition of an outbreak is two people who test
positive and are linked to a setting. Increased testing in prisons and schools as well as
extensive testing in care homes has led to increasing numbers of supposed ‘outbreaks’
(table 2 and 3). 40 38
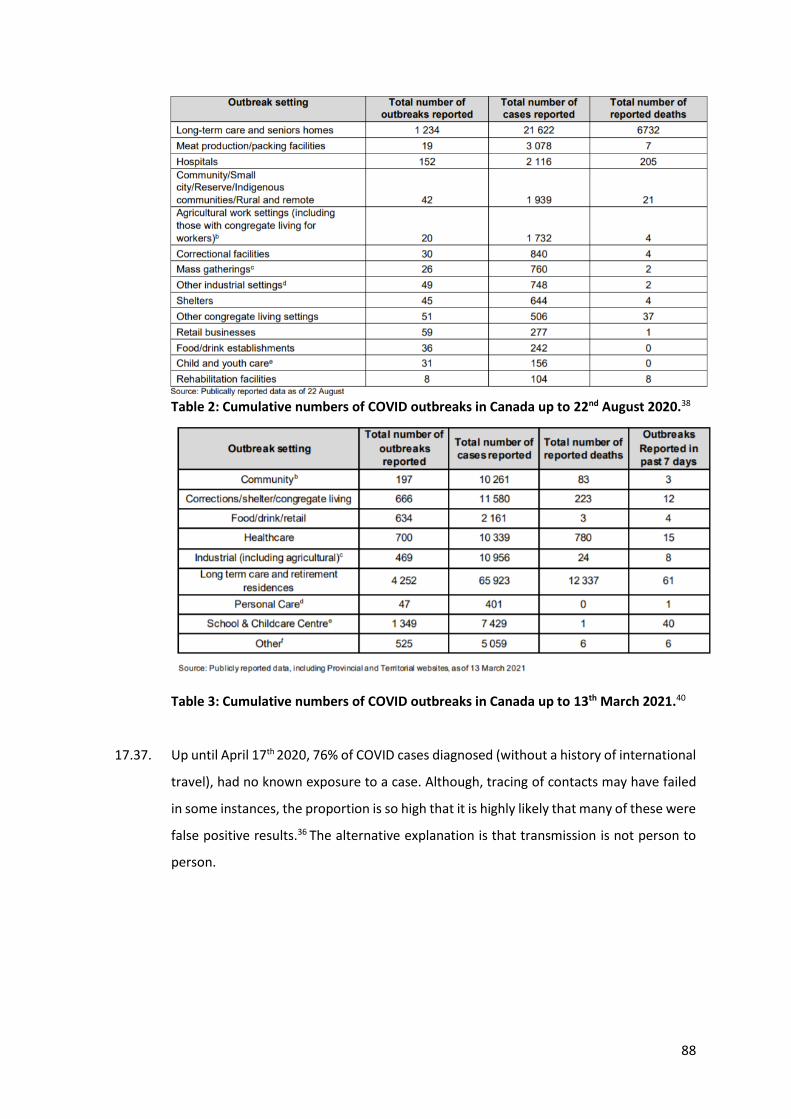
88
Table 2: Cumulative numbers of COVID outbreaks in Canada up to 22nd August 2020.38
Table 3: Cumulative numbers of COVID outbreaks in Canada up to 13th March 2021.40
17.37. Up until April 17th 2020, 76% of COVID cases diagnosed (without a history of international
travel), had no known exposure to a case. Although, tracing of contacts may have failed
in some instances, the proportion is so high that it is highly likely that many of these were
false positive results.36 The alternative explanation is that transmission is not person to
person.
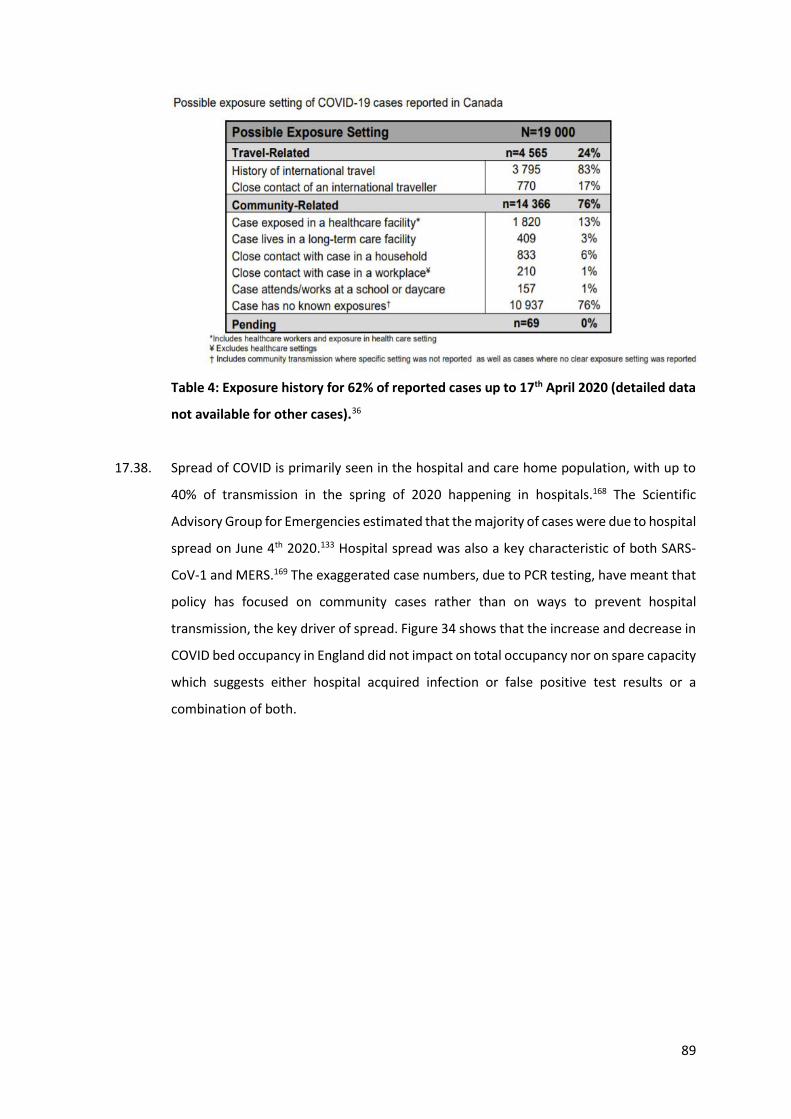
89
Table 4: Exposure history for 62% of reported cases up to 17th April 2020 (detailed data
not available for other cases).36
17.38. Spread of COVID is primarily seen in the hospital and care home population, with up to
40% of transmission in the spring of 2020 happening in hospitals.168 The Scientific
Advisory Group for Emergencies estimated that the majority of cases were due to hospital
spread on June 4th 2020.133 Hospital spread was also a key characteristic of both SARS-
CoV-1 and MERS.169 The exaggerated case numbers, due to PCR testing, have meant that
policy has focused on community cases rather than on ways to prevent hospital
transmission, the key driver of spread. Figure 34 shows that the increase and decrease in
COVID bed occupancy in England did not impact on total occupancy nor on spare capacity
which suggests either hospital acquired infection or false positive test results or a
combination of both.
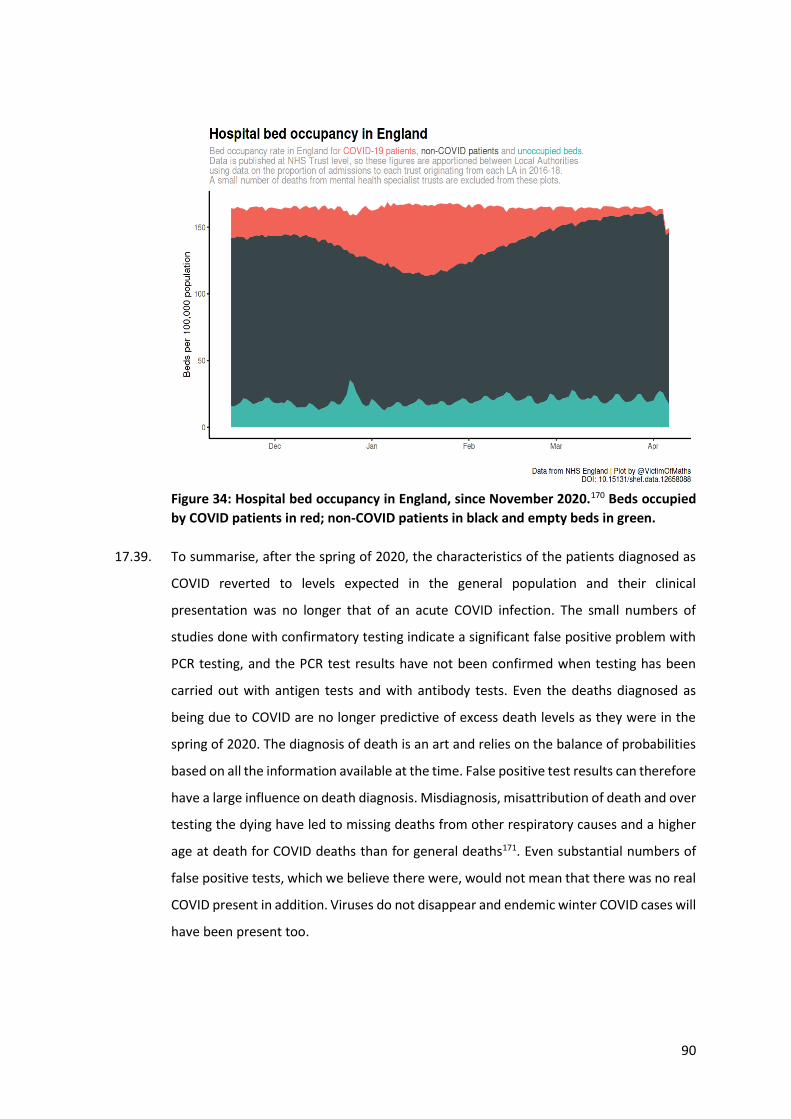
90
Figure 34: Hospital bed occupancy in England, since November 2020.170 Beds occupied
by COVID patients in red; non-COVID patients in black and empty beds in green.
17.39. To summarise, after the spring of 2020, the characteristics of the patients diagnosed as
COVID reverted to levels expected in the general population and their clinical
presentation was no longer that of an acute COVID infection. The small numbers of
studies done with confirmatory testing indicate a significant false positive problem with
PCR testing, and the PCR test results have not been confirmed when testing has been
carried out with antigen tests and with antibody tests. Even the deaths diagnosed as
being due to COVID are no longer predictive of excess death levels as they were in the
spring of 2020. The diagnosis of death is an art and relies on the balance of probabilities
based on all the information available at the time. False positive test results can therefore
have a large influence on death diagnosis. Misdiagnosis, misattribution of death and over
testing the dying have led to missing deaths from other respiratory causes and a higher
age at death for COVID deaths than for general deaths171. Even substantial numbers of
false positive tests, which we believe there were, would not mean that there was no real
COVID present in addition. Viruses do not disappear and endemic winter COVID cases will
have been present too.
91
18. Asymptomatic spread exists as an idea only because of the PCR testing strategy
18.1. The response to COVID has been predicated on the assumption that asymptomatic PCR
positive individuals can spread disease.
18.2. There are three situations where someone can be PCR positive, but asymptomatic.
18.2.1. They are in the incubation period of real disease and are pre-symptomatic.
18.2.2. The test result was a false positive.
18.2.3. They have virus on board, but never develop symptoms.
18.3. The latter category used to be referred to as “immunity”. This is a state where, even if a
virus is inhaled and present in the respiratory tract, the person is oblivious as their
immune system deals with the infection and they never develop a symptom. Rather than
assume immune individuals cannot spread infection, it was worthwhile checking.
18.4. Pre-symptomatic people can spread disease and account for a maximum of 7% of
cases.172
18.5. We concur with Dr Anthony Fauci when he said:
“In all the history of respiratory borne viruses of any type, asymptomatic transmission
has never been the drive of outbreaks. The driver of outbreaks is always a symptomatic
person.”173
18.6. Finding people that test positive, but show no symptoms during an outbreak, is evidence
of immunity, not evidence of transmission.49 This applies to any test including PCR,
antigen testing and even viral culture. Evidence of transmission requires that someone
who is immune was the source of infection for someone who then developed symptoms
and had disease.174
18.7. The proportion of people who test positive, but have no symptoms, ranges from 4%175 to
76%.176 This is because this is a function of how testing has been carried out, not a
function of a true disease (in which case the range would have been much smaller).
92
18.8. Reviewing all the published meta-analyses on asymptomatic transmission reveals that
the same stories have been recycled repeatedly by respectable institutions.177 The
underlying evidence for asymptomatic transmission amounts to 6 individuals who were
alleged to have spread COVID to 7 others.177
18.9. Two of these examples may well have been one patient with the story repeated in
separate publications.178 179 This was a situation where neither person involved in
transmission had any symptoms. It therefore fails as evidence of disease spread, which
requires the presence of symptoms.
18.10. Two further cases were from Vo in Italy where the whole town was tested.180 1% of the
tests were positive in the absence of symptoms. The UK Government’s own estimates for
the percentage of tests that will be false positive is between 0.8-4.0% and, as this was a
new test, a rate of 1% is very respectable. The alleged result of transmission again
resulted in no symptoms. These were false positive PCR test results and assuming chains
of transmission based on the degree of positivity of a test result is bad science.
18.11. The final two examples were both from studies in Brunei.181 The evidence is weakened
by a poor case definition (any symptom of any severity was considered real symptomatic
COVID), and a high probability of false positive results. A 13-year-old girl with no
symptoms was alleged to have spread COVID to an adult who had “a mild cough on one
day”.182 The second was a father who remained asymptomatic, but whose wife briefly
had a runny nose, and whose baby had a mild cough on one day.182 Much of the evidence
of asymptomatic spread is based on modelled data not actual evidence of spread.
Excluding modelled data, reports from China and presymptomatic spread, this is the
totality of the so-called evidence for asymptomatic spread related to COVID as of today.
18.12. It is therefore at least arguable that the asymptomatic diagnoses in Spring 2020 were all
due to false positive test results. No testing system is perfect. Failure to acknowledge this
and misinterpretation of positive results in patients with no symptoms has been hugely
damaging.
18.13. There are three types of evidence for asymptomatic spread: studies showing people test
positive while asymptomatic (the bulk of the work); studies measuring viral load and
93
concluding from it that people with no symptoms can transmit virus; and studies showing
actual transmission. The first two are not proper evidence that spread can occur.
18.14. It is important to carefully distinguish purely asymptomatic (individuals who never
develop any symptoms) from pre-symptomatic transmission (where individuals do
eventually develop symptoms). To the extent that the latter phenomenon, which has in
fact happened only very rarely, is deemed worthy of public health action, appropriate
strategies to manage it (in the absence of significant asymptomatic transmission) would
be entirely different and much less disruptive than those actually adopted. For example,
there would be no need to lockdown the healthy population and quarantine of contacts
of known true positive cases could end after 5 days, unless symptoms developed.
18.15. Many early studies, which purported to demonstrate the phenomenon of asymptomatic
transmission, were from China, yet, the fact that Chinese studies are only published
following Government approval must bring their reliability into question.183 Nevertheless,
the high volume of these studies spawned significant salience of the issue within the
medical community, and an assumption of the likelihood of asymptomatic transmission
being an important contributory factor. There then followed a number of meta-analyses
examining the issue of asymptomatic transmission, which tended to aggregate and give
equal weight to studies, regardless of origin or quality.184 185 186 187 In this way, these meta-
analyses, given undue credibility by their association with reputable universities,
amplified minimal evidence of asymptomatic spread to an importance the data did not
warrant.
18.16. In a review of the literature, the papers most frequently cited in support of the existence
of asymptomatic transmission were examined.177 Despite our criticisms of the sources of
the data above, we did, in fact, find only six case reports of viral transmission by people
who throughout remained asymptomatic, and this was to a total of seven other
individuals. However, all of these were in studies with questionable methodology. These
were: In Italy, two asymptomatic cases allegedly passing the virus to two others, in
Brunei, two asymptomatic cases allegedly passing the virus to three others, and in China,
two asymptomatic cases allegedly passing the virus to two others (see paragraph 18.8).
94
18.17. In all these studies, confirmation of ‘cases’ was solely made via PCR testing, without
regard to the possibility that any of the cases found might be false positives. The case
numbers found are, in any event, extremely small and certainly not sufficient to
conclusively determine that asymptomatic transmission is a major component of spread.
18.18. It is also notable that, in what would seem to represent an abrupt volte face by the
Chinese Communist Party (CCP), a further (presumably Government-approved) study
from China was recently published, which entirely contradicts the earlier conclusions
regarding the phenomenon of asymptomatic transmission, which had been driven by
Chinese data in particular, early in the pandemic.188
18.19. Aside from reported studies of transmission, those leading on the contact tracing
response might have useful experience on the likelihood of transmission. Maria Van
Kerkhove, head of the World Health Organization’s emerging diseases and zoonosis unit,
stated at the beginning of June 2020:189
“Countries doing very detailed contact tracing …[are]…following asymptomatic cases
and following contacts and they’re not finding secondary transmission onwards. It’s
very rare. Much of that is not published in the literature.”
19. Consequences of current policy regarding the PCR test
19.1. The PCR test for COVID is not a reliable test in the way it is being used. It is not a suitable
or reliable test for the detection of infectious SARS-CoV-2 viruses and is a bad measure
of who is an infection risk to others.
19.2. A single positive test result alone should not be used as indicative of a diagnosis of
disease. Diagnosis should only be made either in the presence of a clinical picture of
classic symptoms or after confirmatory testing (see section 6).
19.3. Decisions about interventions were originally based on deaths from COVID. However, as
deaths reduced, the focus changed to cases. The focus is currently shifting to variants of
the virus and to people with post viral symptoms, complaining of symptoms for weeks to
months after COVID infection, known as “long COVID”. The measure of whether there is
a real public health emergency is whether there are excess deaths. The Canadian data on
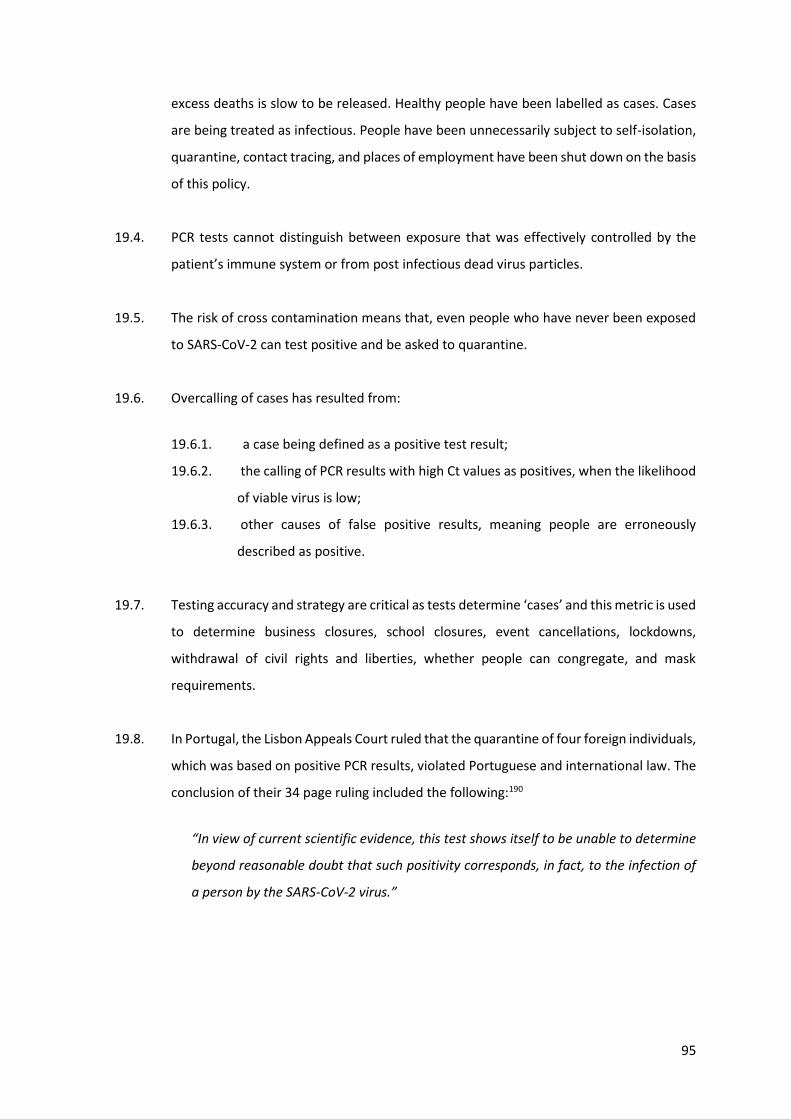
95
excess deaths is slow to be released. Healthy people have been labelled as cases. Cases
are being treated as infectious. People have been unnecessarily subject to self-isolation,
quarantine, contact tracing, and places of employment have been shut down on the basis
of this policy.
19.4. PCR tests cannot distinguish between exposure that was effectively controlled by the
patient’s immune system or from post infectious dead virus particles.
19.5. The risk of cross contamination means that, even people who have never been exposed
to SARS-CoV-2 can test positive and be asked to quarantine.
19.6. Overcalling of cases has resulted from:
19.6.1. a case being defined as a positive test result;
19.6.2. the calling of PCR results with high Ct values as positives, when the likelihood
of viable virus is low;
19.6.3. other causes of false positive results, meaning people are erroneously
described as positive.
19.7. Testing accuracy and strategy are critical as tests determine ‘cases’ and this metric is used
to determine business closures, school closures, event cancellations, lockdowns,
withdrawal of civil rights and liberties, whether people can congregate, and mask
requirements.
19.8. In Portugal, the Lisbon Appeals Court ruled that the quarantine of four foreign individuals,
which was based on positive PCR results, violated Portuguese and international law. The
conclusion of their 34 page ruling included the following:190
“In view of current scientific evidence, this test shows itself to be unable to determine
beyond reasonable doubt that such positivity corresponds, in fact, to the infection of
a person by the SARS-CoV-2 virus.”
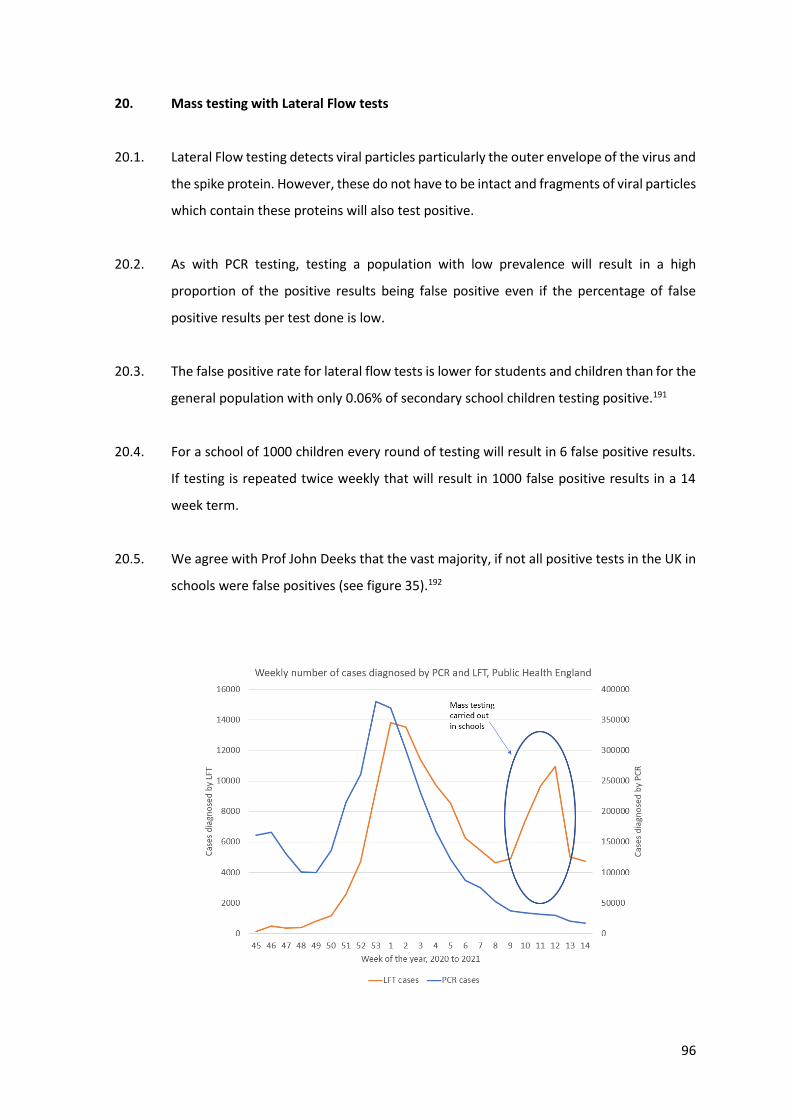
96
20. Mass testing with Lateral Flow tests
20.1. Lateral Flow testing detects viral particles particularly the outer envelope of the virus and
the spike protein. However, these do not have to be intact and fragments of viral particles
which contain these proteins will also test positive.
20.2. As with PCR testing, testing a population with low prevalence will result in a high
proportion of the positive results being false positive even if the percentage of false
positive results per test done is low.
20.3. The false positive rate for lateral flow tests is lower for students and children than for the
general population with only 0.06% of secondary school children testing positive.191
20.4. For a school of 1000 children every round of testing will result in 6 false positive results.
If testing is repeated twice weekly that will result in 1000 false positive results in a 14
week term.
20.5. We agree with Prof John Deeks that the vast majority, if not all positive tests in the UK in
schools were false positives (see figure 35).192
97
Figure 35: Top graph, number of cases diagnosed by PCR and LFT showing clear spike
on school return. Bottom graph, percentage of tests done that were positive showing
that the spike was induced by increased numbers of tests not an increase in positivity
(Public Health England data).193
20.6. The problems with mass testing were illustrated by a Cochrane review:157
“In people with no symptoms of COVID‐19 the number of confirmed cases is expected
to be much lower than in people with symptoms. Using summary results for SD
Biosensor STANDARD Q in a bigger population of 10,000 people with no symptoms,
where 50 (0.5%) of them really had COVID‐19:
‐ 125 people would test positive for COVID‐19. Of these, 90 people (72%) would not
have COVID‐19 (false positive result).
‐ 9,875 people would test negative for COVID‐19. Of these, 15 people (0.2%) would
actually have COVID‐19 (false negative result).”
20.7. The same Cochrane review of antigen testing concluded:157
“At 5% prevalence using data for the most sensitive assays in symptomatic people (SD
Biosensor STANDARD Q and Abbott Panbio), positive predictive values (PPVs) of 84%
to 90% mean that between 1 in 10 and 1 in 6 positive results will be a false positive,
and between 1 in 4 and 1 in 8 cases will be missed. At 0.5% prevalence applying the
same tests in asymptomatic people would result in PPVs of 11% to 28% meaning that
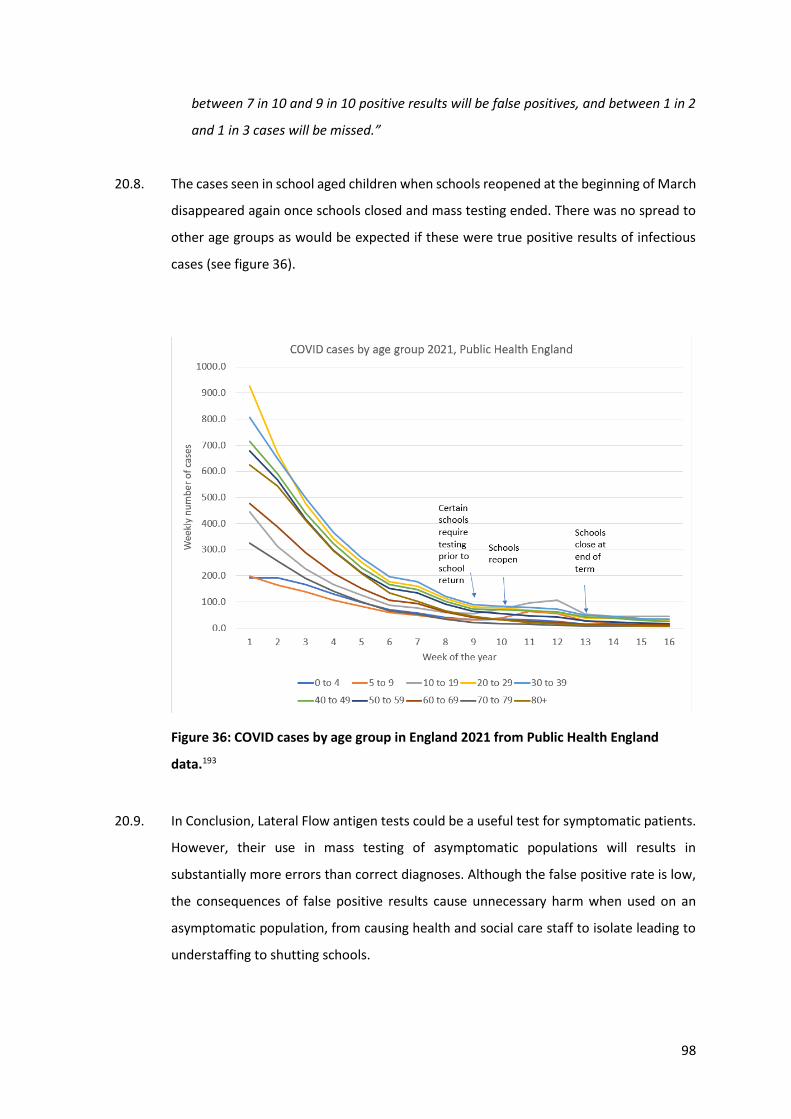
98
between 7 in 10 and 9 in 10 positive results will be false positives, and between 1 in 2
and 1 in 3 cases will be missed.”
20.8. The cases seen in school aged children when schools reopened at the beginning of March
disappeared again once schools closed and mass testing ended. There was no spread to
other age groups as would be expected if these were true positive results of infectious
cases (see figure 36).
Figure 36: COVID cases by age group in England 2021 from Public Health England
data.193
20.9. In Conclusion, Lateral Flow antigen tests could be a useful test for symptomatic patients.
However, their use in mass testing of asymptomatic populations will results in
substantially more errors than correct diagnoses. Although the false positive rate is low,
the consequences of false positive results cause unnecessary harm when used on an
asymptomatic population, from causing health and social care staff to isolate leading to
understaffing to shutting schools.
99
21. Effects of Variants on PCR testing
21.1. Viruses mutate all the time and are under constant evolutionary pressure. Common cold
coronaviruses are thought to have crossed from animal hosts to humans, starting a
pandemic e.g. the Russian Flu of 1889, before evolving to become relatively trivial
common colds.194
21.2. The word ‘variant’ means a mutation that is of no clinical significance195 i.e. it has not
been shown to be more transmissible or more deadly.196 Were either to be shown then
it would be named a new ‘strain’. These terms and their meaning are currently being
conflated.
21.3. There is evidence that results of tests from patients with new variant COVID, B.1.1.7, in
the UK, have a lower Ct value.197 From this, it was concluded that there was more virus in
the sample. People have then extrapolated from that finding to say it is more
transmissible, thinking that more virus in the airway should lead to more infections in
people around them. Another valid interpretation is that, in order to reach the same level
of symptoms in order to get tested in hospital, more virus is needed i.e. it is less disease
inducing. Test results have led to confusion here as high Ct value results, interpreted as
having a low viral load, may have been false positives. Although it seems intuitive, animal
studies on other respiratory viruses,198 have shown no correlation between viral load and
transmissibility and showed that repeated exposure to low viral doses can cause
disease.199 Viral replication results in exponential growth, so even a small initial dose can
rapidly result in significant numbers of viruses.200 This means viral load works best as a
measure of the course of infection.
21.4. There is no evidence of the new, B.1.1.7 variant being more deadly.201 202 A Nature paper
that was much reported in the media, claimed there was an increased mortality.
However, they did not control for comorbidities, a significant risk factor for deaths.203
21.5. Over time viruses mutate and dominant variants will change. The dominant variant
changed in Summer 2020, shown in studies on the prevalence of the new variant and its
transmissibility.204 Cases were falling or remained low at the time.
100
21.6. Variants are identified by genomic sequencing allowing comparison of the sequence to
the original sequence provided by Chinese Scientists. There is a relationship between how
much sequencing a country carries out and the likelihood of finding a variant in that
country.
21.7. The 'UK' variant, B.1.1.7, was first identified in the UK at the end of October 2020. By the
last week of November or first week of December, it had been identified in almost every
country internationally.205
21.8. By 30th July 2020, there had been over 5000 variants identified out of 46,723 viruses
sequenced in one study.206 A separate study demonstrated over 350,000 variants in
under 49,000 samples.207
“All major clades [families of variants] in the global diversity of SARS-CoV-2 are
represented in various regions of the world, and the genomic diversity of SARS-CoV-2
in circulation in different continents is fairly uniform.”
21.9. The current variants have 23 base pair mutations out of approximately 30,000 base pairs,
so 0.08% of the base pairs are different from the original Wuhan sequence.208 If there
was a significant change in shape, then protein would fail functionally and the virus would
die. Small changes in shape should not affect immunity, as each individual’s immune
system recognises numerous areas on each protein. The immune system does not
recognise sequences but, instead, recognises the shape of the proteins that the
sequences code for. Immune individuals recognised around 17 different sites on the
SARS-CoV-2 virus with the population as a whole recognising over 100.209
21.10. The UK variant had mutations in the S-gene which codes for the spike protein. The
mutation happened to be in the region of the primers or probes such that the S-gene of
the TaqPath test used in some British laboratories failed. However, the other two genes
tested for continued to work and no alteration was made to the testing, as the variant
was still detectable. In fact, the manufacturers used the fact that the absence of the S
gene could identify the variant as a selling point.210 Canadian laboratories did not include
the S gene as part of their testing (see 14.5). Therefore, PCR testing did not need to
change to detect COVID, but whole genome sequencing is needed to distinguish the
presence of a variant.
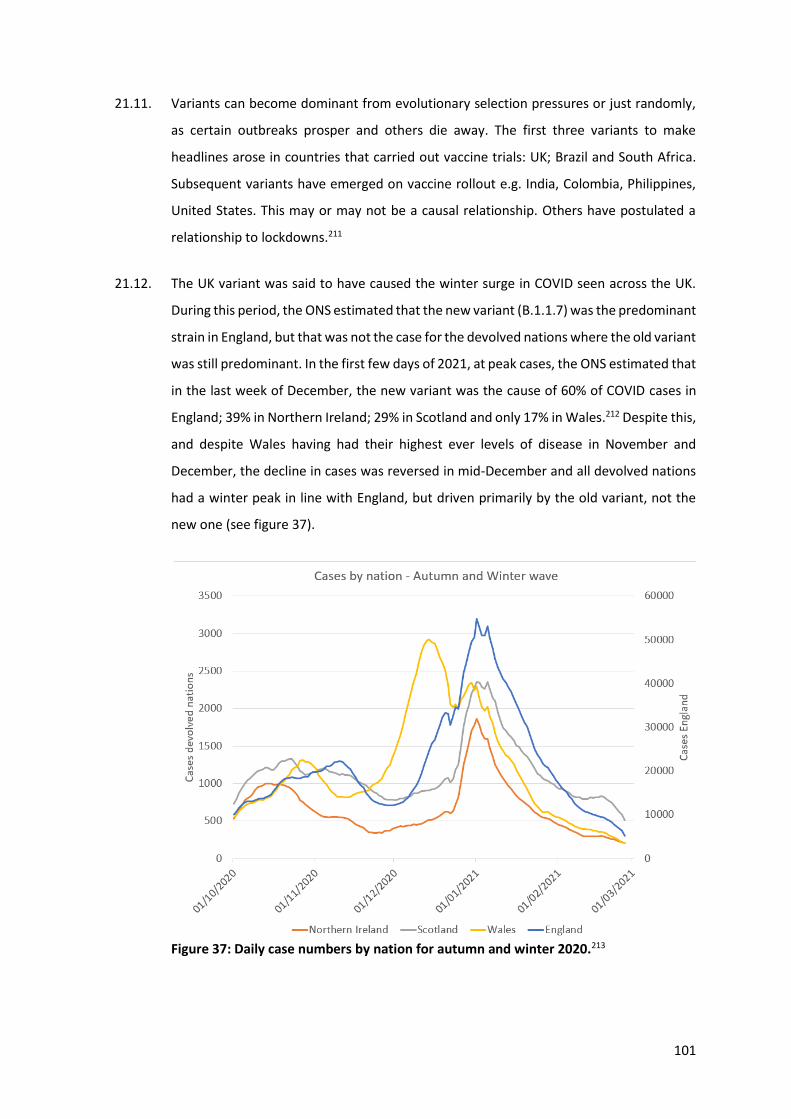
101
21.11. Variants can become dominant from evolutionary selection pressures or just randomly,
as certain outbreaks prosper and others die away. The first three variants to make
headlines arose in countries that carried out vaccine trials: UK; Brazil and South Africa.
Subsequent variants have emerged on vaccine rollout e.g. India, Colombia, Philippines,
United States. This may or may not be a causal relationship. Others have postulated a
relationship to lockdowns.211
21.12. The UK variant was said to have caused the winter surge in COVID seen across the UK.
During this period, the ONS estimated that the new variant (B.1.1.7) was the predominant
strain in England, but that was not the case for the devolved nations where the old variant
was still predominant. In the first few days of 2021, at peak cases, the ONS estimated that
in the last week of December, the new variant was the cause of 60% of COVID cases in
England; 39% in Northern Ireland; 29% in Scotland and only 17% in Wales.212 Despite this,
and despite Wales having had their highest ever levels of disease in November and
December, the decline in cases was reversed in mid-December and all devolved nations
had a winter peak in line with England, but driven primarily by the old variant, not the
new one (see figure 37).
Figure 37: Daily case numbers by nation for autumn and winter 2020.213
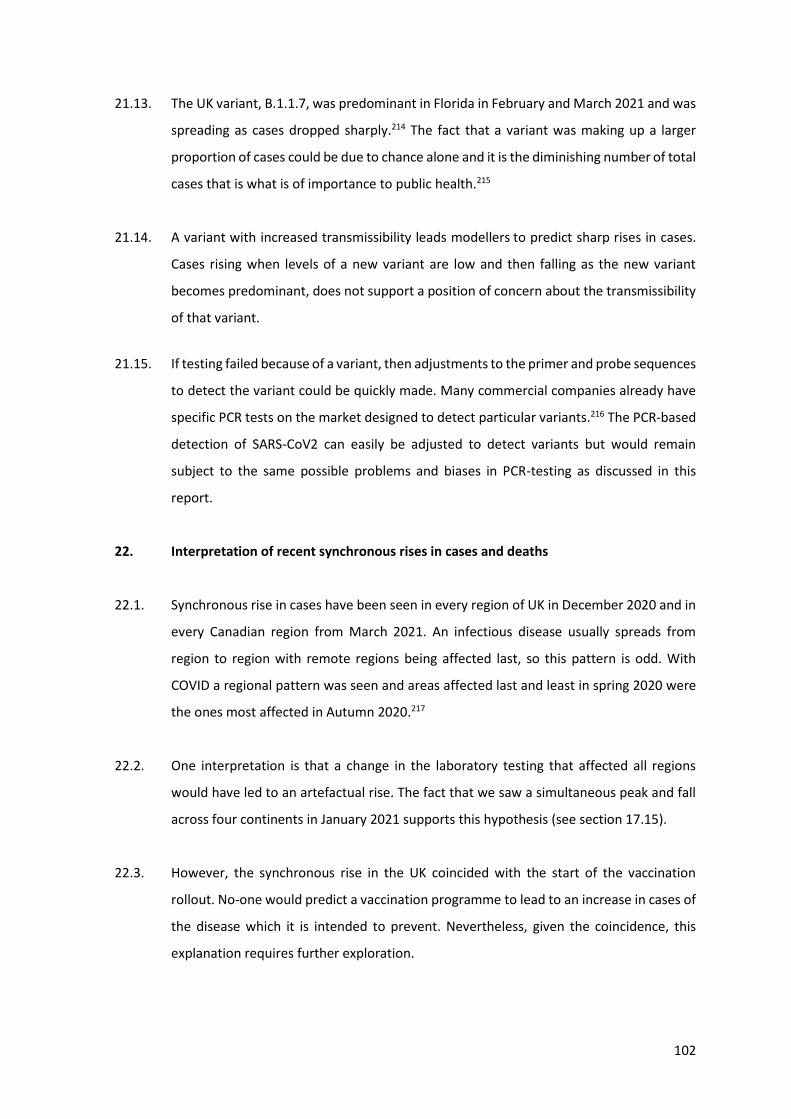
102
21.13. The UK variant, B.1.1.7, was predominant in Florida in February and March 2021 and was
spreading as cases dropped sharply.214 The fact that a variant was making up a larger
proportion of cases could be due to chance alone and it is the diminishing number of total
cases that is what is of importance to public health.215
21.14. A variant with increased transmissibility leads modellers to predict sharp rises in cases.
Cases rising when levels of a new variant are low and then falling as the new variant
becomes predominant, does not support a position of concern about the transmissibility
of that variant.
21.15. If testing failed because of a variant, then adjustments to the primer and probe sequences
to detect the variant could be quickly made. Many commercial companies already have
specific PCR tests on the market designed to detect particular variants.216 The PCR-based
detection of SARS-CoV2 can easily be adjusted to detect variants but would remain
subject to the same possible problems and biases in PCR-testing as discussed in this
report.
22. Interpretation of recent synchronous rises in cases and deaths
22.1. Synchronous rise in cases have been seen in every region of UK in December 2020 and in
every Canadian region from March 2021. An infectious disease usually spreads from
region to region with remote regions being affected last, so this pattern is odd. With
COVID a regional pattern was seen and areas affected last and least in spring 2020 were
the ones most affected in Autumn 2020.217
22.2. One interpretation is that a change in the laboratory testing that affected all regions
would have led to an artefactual rise. The fact that we saw a simultaneous peak and fall
across four continents in January 2021 supports this hypothesis (see section 17.15).
22.3. However, the synchronous rise in the UK coincided with the start of the vaccination
rollout. No-one would predict a vaccination programme to lead to an increase in cases of
the disease which it is intended to prevent. Nevertheless, given the coincidence, this
explanation requires further exploration.
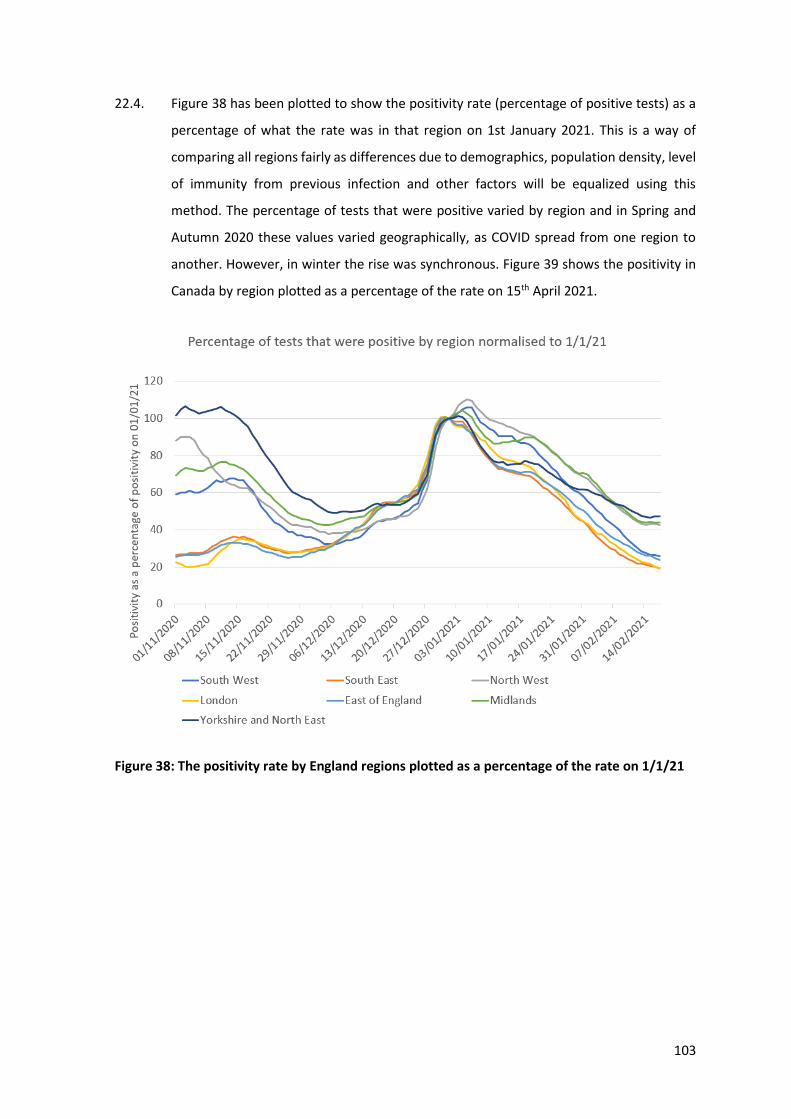
103
22.4. Figure 38 has been plotted to show the positivity rate (percentage of positive tests) as a
percentage of what the rate was in that region on 1st January 2021. This is a way of
comparing all regions fairly as differences due to demographics, population density, level
of immunity from previous infection and other factors will be equalized using this
method. The percentage of tests that were positive varied by region and in Spring and
Autumn 2020 these values varied geographically, as COVID spread from one region to
another. However, in winter the rise was synchronous. Figure 39 shows the positivity in
Canada by region plotted as a percentage of the rate on 15th April 2021.
Figure 38: The positivity rate by England regions plotted as a percentage of the rate on 1/1/21
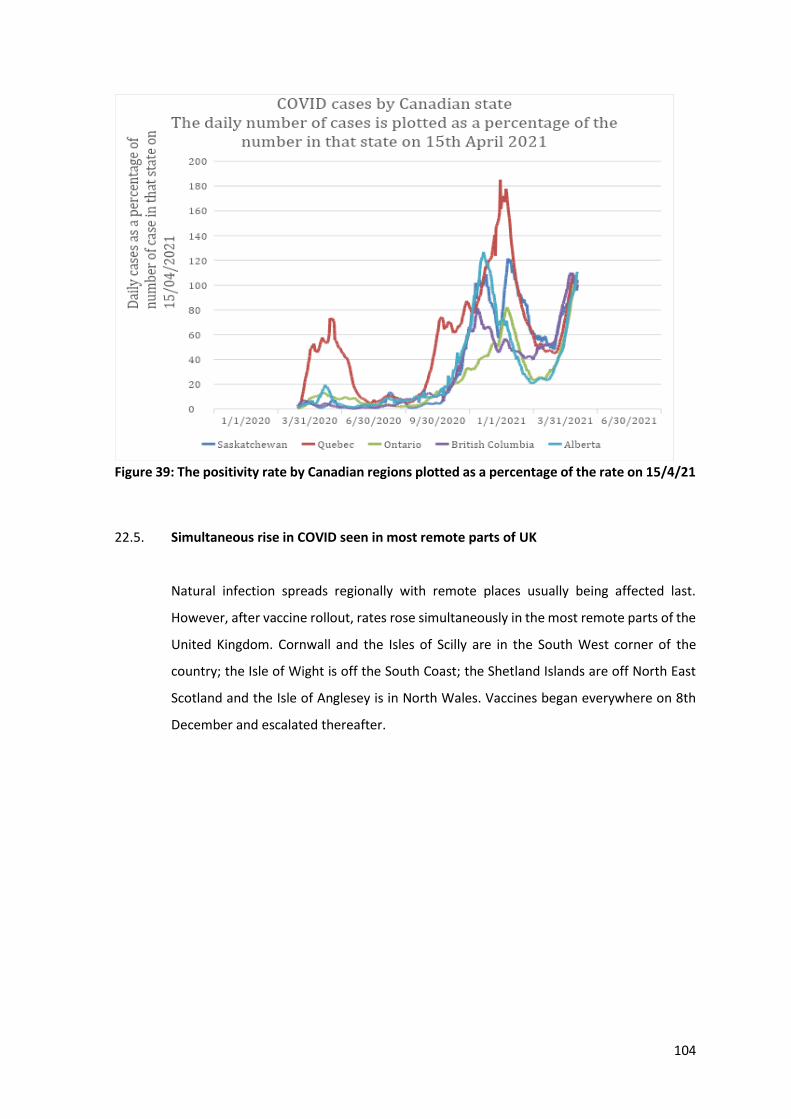
104
Figure 39: The positivity rate by Canadian regions plotted as a percentage of the rate on 15/4/21
22.5. Simultaneous rise in COVID seen in most remote parts of UK
Natural infection spreads regionally with remote places usually being affected last.
However, after vaccine rollout, rates rose simultaneously in the most remote parts of the
United Kingdom. Cornwall and the Isles of Scilly are in the South West corner of the
country; the Isle of Wight is off the South Coast; the Shetland Islands are off North East
Scotland and the Isle of Anglesey is in North Wales. Vaccines began everywhere on 8th
December and escalated thereafter.
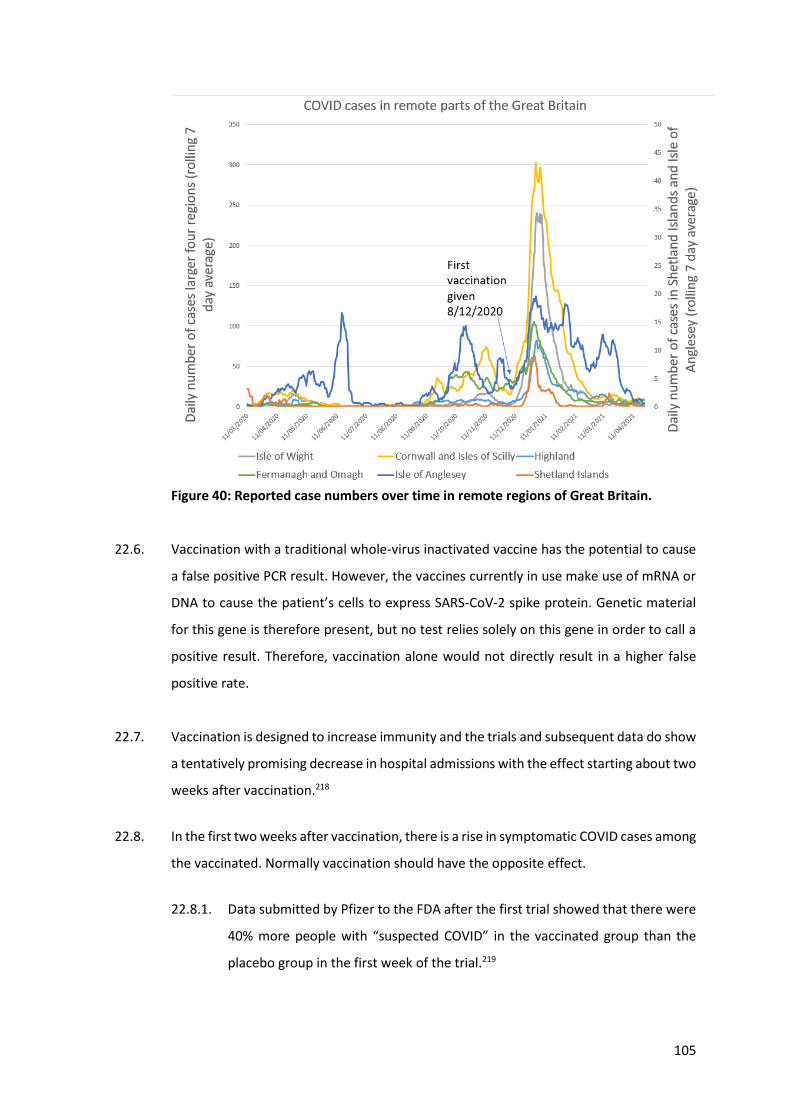
105
Figure 40: Reported case numbers over time in remote regions of Great Britain.
22.6. Vaccination with a traditional whole-virus inactivated vaccine has the potential to cause
a false positive PCR result. However, the vaccines currently in use make use of mRNA or
DNA to cause the patient’s cells to express SARS-CoV-2 spike protein. Genetic material
for this gene is therefore present, but no test relies solely on this gene in order to call a
positive result. Therefore, vaccination alone would not directly result in a higher false
positive rate.
22.7. Vaccination is designed to increase immunity and the trials and subsequent data do show
a tentatively promising decrease in hospital admissions with the effect starting about two
weeks after vaccination.218
22.8. In the first two weeks after vaccination, there is a rise in symptomatic COVID cases among
the vaccinated. Normally vaccination should have the opposite effect.
22.8.1. Data submitted by Pfizer to the FDA after the first trial showed that there were
40% more people with “suspected COVID” in the vaccinated group than the
placebo group in the first week of the trial.219
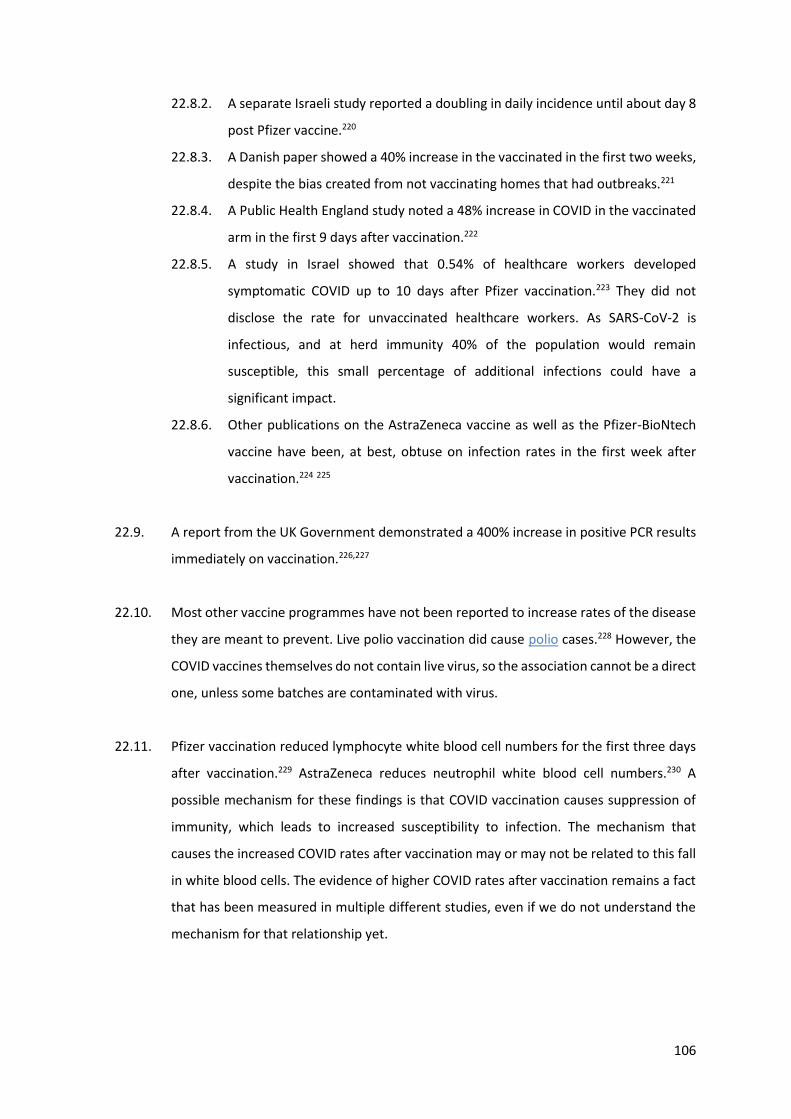
106
22.8.2. A separate Israeli study reported a doubling in daily incidence until about day 8
post Pfizer vaccine.220
22.8.3. A Danish paper showed a 40% increase in the vaccinated in the first two weeks,
despite the bias created from not vaccinating homes that had outbreaks.221
22.8.4. A Public Health England study noted a 48% increase in COVID in the vaccinated
arm in the first 9 days after vaccination.222
22.8.5. A study in Israel showed that 0.54% of healthcare workers developed
symptomatic COVID up to 10 days after Pfizer vaccination.223 They did not
disclose the rate for unvaccinated healthcare workers. As SARS-CoV-2 is
infectious, and at herd immunity 40% of the population would remain
susceptible, this small percentage of additional infections could have a
significant impact.
22.8.6. Other publications on the AstraZeneca vaccine as well as the Pfizer-BioNtech
vaccine have been, at best, obtuse on infection rates in the first week after
vaccination.224 225
22.9. A report from the UK Government demonstrated a 400% increase in positive PCR results
immediately on vaccination.226,227
22.10. Most other vaccine programmes have not been reported to increase rates of the disease
they are meant to prevent. Live polio vaccination did cause polio cases.228 However, the
COVID vaccines themselves do not contain live virus, so the association cannot be a direct
one, unless some batches are contaminated with virus.
22.11. Pfizer vaccination reduced lymphocyte white blood cell numbers for the first three days
after vaccination.229 AstraZeneca reduces neutrophil white blood cell numbers.230 A
possible mechanism for these findings is that COVID vaccination causes suppression of
immunity, which leads to increased susceptibility to infection. The mechanism that
causes the increased COVID rates after vaccination may or may not be related to this fall
in white blood cells. The evidence of higher COVID rates after vaccination remains a fact
that has been measured in multiple different studies, even if we do not understand the
mechanism for that relationship yet.
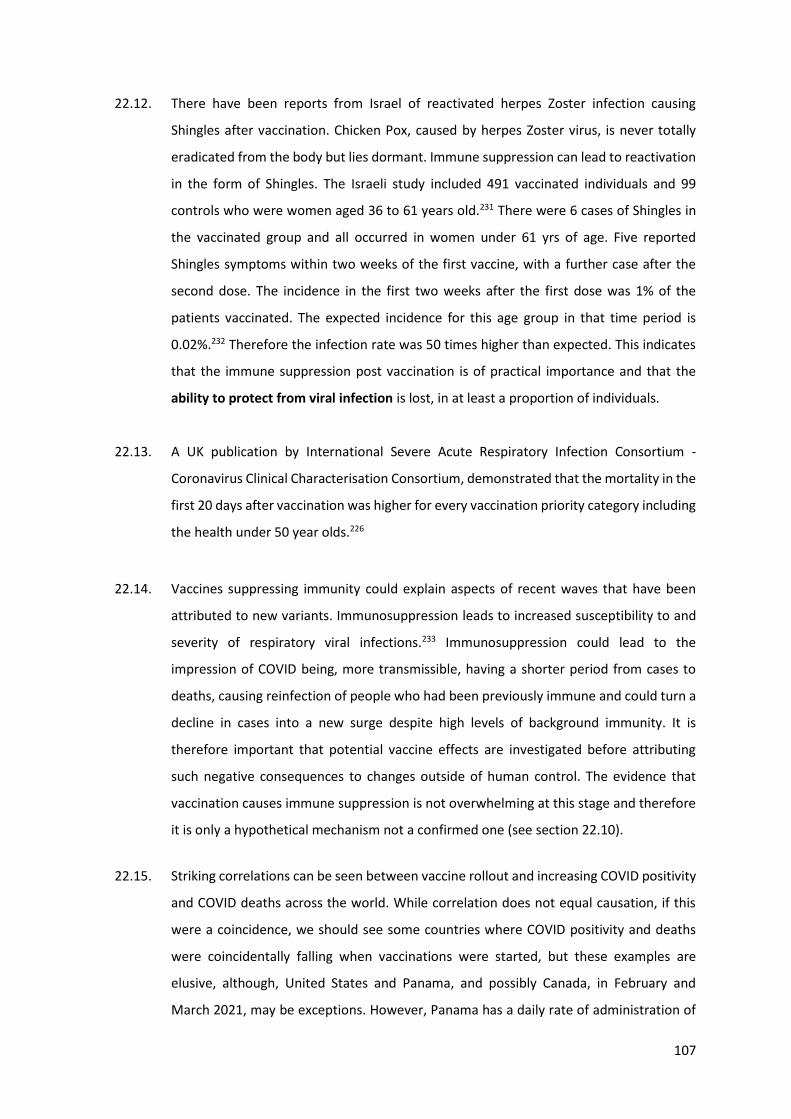
107
22.12. There have been reports from Israel of reactivated herpes Zoster infection causing
Shingles after vaccination. Chicken Pox, caused by herpes Zoster virus, is never totally
eradicated from the body but lies dormant. Immune suppression can lead to reactivation
in the form of Shingles. The Israeli study included 491 vaccinated individuals and 99
controls who were women aged 36 to 61 years old.231 There were 6 cases of Shingles in
the vaccinated group and all occurred in women under 61 yrs of age. Five reported
Shingles symptoms within two weeks of the first vaccine, with a further case after the
second dose. The incidence in the first two weeks after the first dose was 1% of the
patients vaccinated. The expected incidence for this age group in that time period is
0.02%.232 Therefore the infection rate was 50 times higher than expected. This indicates
that the immune suppression post vaccination is of practical importance and that the
ability to protect from viral infection is lost, in at least a proportion of individuals.
22.13. A UK publication by International Severe Acute Respiratory Infection Consortium -
Coronavirus Clinical Characterisation Consortium, demonstrated that the mortality in the
first 20 days after vaccination was higher for every vaccination priority category including
the health under 50 year olds.226
22.14. Vaccines suppressing immunity could explain aspects of recent waves that have been
attributed to new variants. Immunosuppression leads to increased susceptibility to and
severity of respiratory viral infections.233 Immunosuppression could lead to the
impression of COVID being, more transmissible, having a shorter period from cases to
deaths, causing reinfection of people who had been previously immune and could turn a
decline in cases into a new surge despite high levels of background immunity. It is
therefore important that potential vaccine effects are investigated before attributing
such negative consequences to changes outside of human control. The evidence that
vaccination causes immune suppression is not overwhelming at this stage and therefore
it is only a hypothetical mechanism not a confirmed one (see section 22.10).
22.15. Striking correlations can be seen between vaccine rollout and increasing COVID positivity
and COVID deaths across the world. While correlation does not equal causation, if this
were a coincidence, we should see some countries where COVID positivity and deaths
were coincidentally falling when vaccinations were started, but these examples are
elusive, although, United States and Panama, and possibly Canada, in February and
March 2021, may be exceptions. However, Panama has a daily rate of administration of
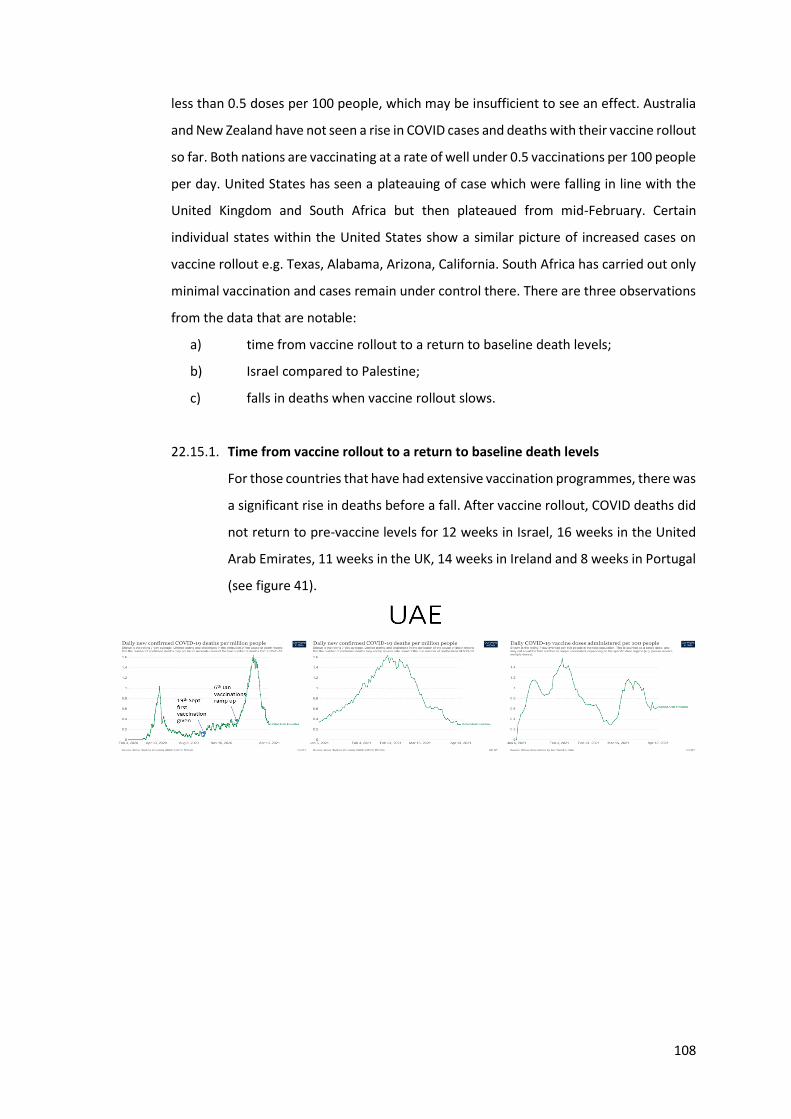
108
less than 0.5 doses per 100 people, which may be insufficient to see an effect. Australia
and New Zealand have not seen a rise in COVID cases and deaths with their vaccine rollout
so far. Both nations are vaccinating at a rate of well under 0.5 vaccinations per 100 people
per day. United States has seen a plateauing of case which were falling in line with the
United Kingdom and South Africa but then plateaued from mid-February. Certain
individual states within the United States show a similar picture of increased cases on
vaccine rollout e.g. Texas, Alabama, Arizona, California. South Africa has carried out only
minimal vaccination and cases remain under control there. There are three observations
from the data that are notable:
a) time from vaccine rollout to a return to baseline death levels;
b) Israel compared to Palestine;
c) falls in deaths when vaccine rollout slows.
22.15.1. Time from vaccine rollout to a return to baseline death levels
For those countries that have had extensive vaccination programmes, there was
a significant rise in deaths before a fall. After vaccine rollout, COVID deaths did
not return to pre-vaccine levels for 12 weeks in Israel, 16 weeks in the United
Arab Emirates, 11 weeks in the UK, 14 weeks in Ireland and 8 weeks in Portugal
(see figure 41).
109
Figure 41: Data for five countries that have passed peak deaths since vaccine rollout: Israel; United
Arab Emirates; United Kingdom; Ireland and Portugal. Sets of three graphs showing on left, all
COVID deaths per million people since Spring 2020; in centre COVID deaths since vaccine rollout and
on right, vaccine doses given per 100 people.2
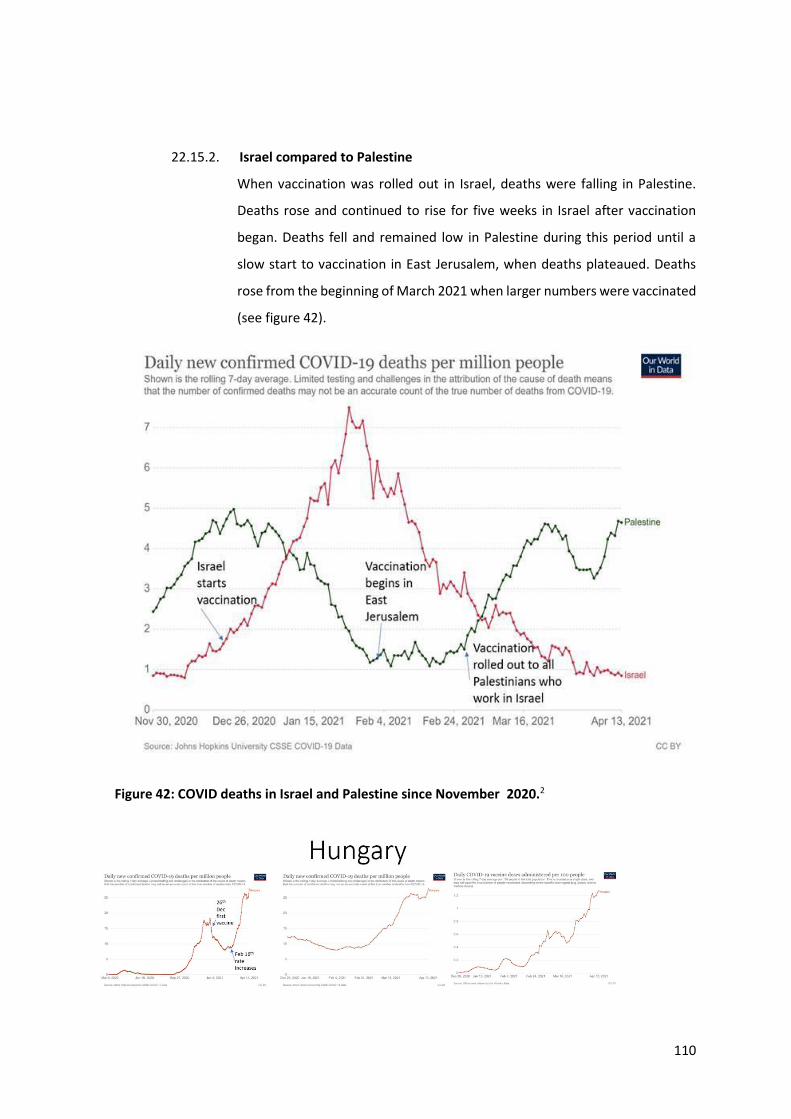
110
22.15.2. Israel compared to Palestine
When vaccination was rolled out in Israel, deaths were falling in Palestine.
Deaths rose and continued to rise for five weeks in Israel after vaccination
began. Deaths fell and remained low in Palestine during this period until a
slow start to vaccination in East Jerusalem, when deaths plateaued. Deaths
rose from the beginning of March 2021 when larger numbers were vaccinated
(see figure 42).
Figure 42: COVID deaths in Israel and Palestine since November 2020.2
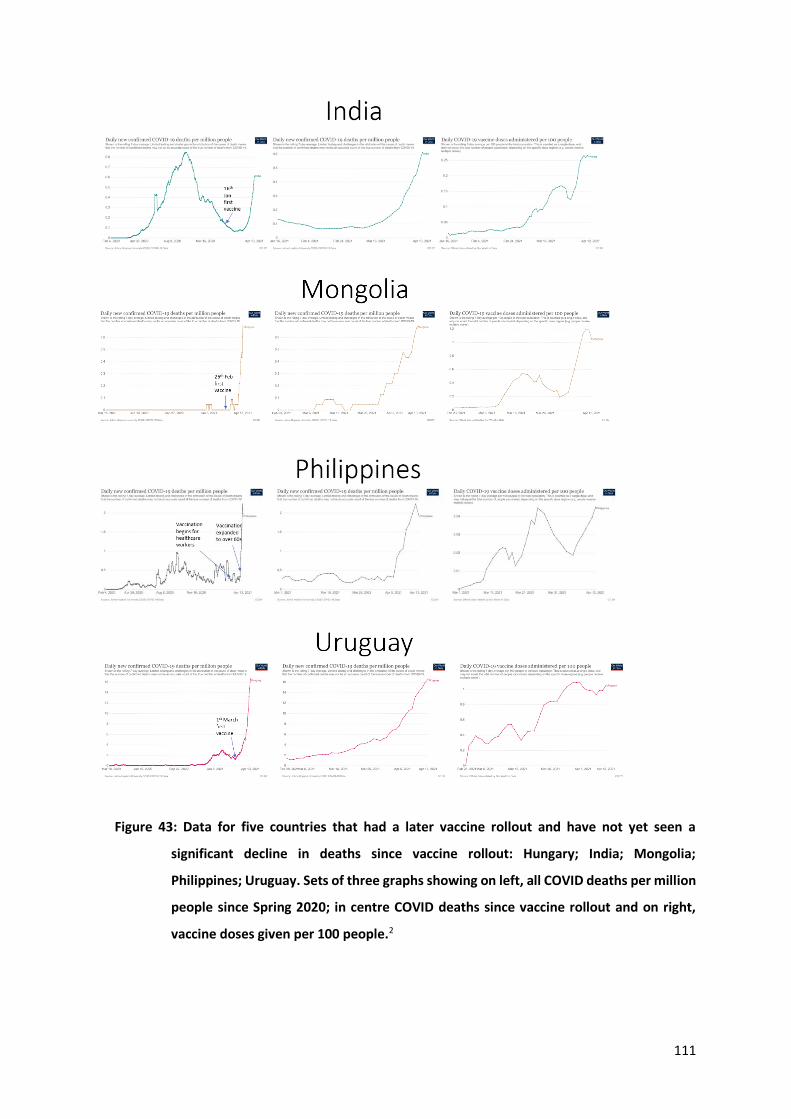
111
Figure 43: Data for five countries that had a later vaccine rollout and have not yet seen a
significant decline in deaths since vaccine rollout: Hungary; India; Mongolia;
Philippines; Uruguay. Sets of three graphs showing on left, all COVID deaths per million
people since Spring 2020; in centre COVID deaths since vaccine rollout and on right,
vaccine doses given per 100 people.2
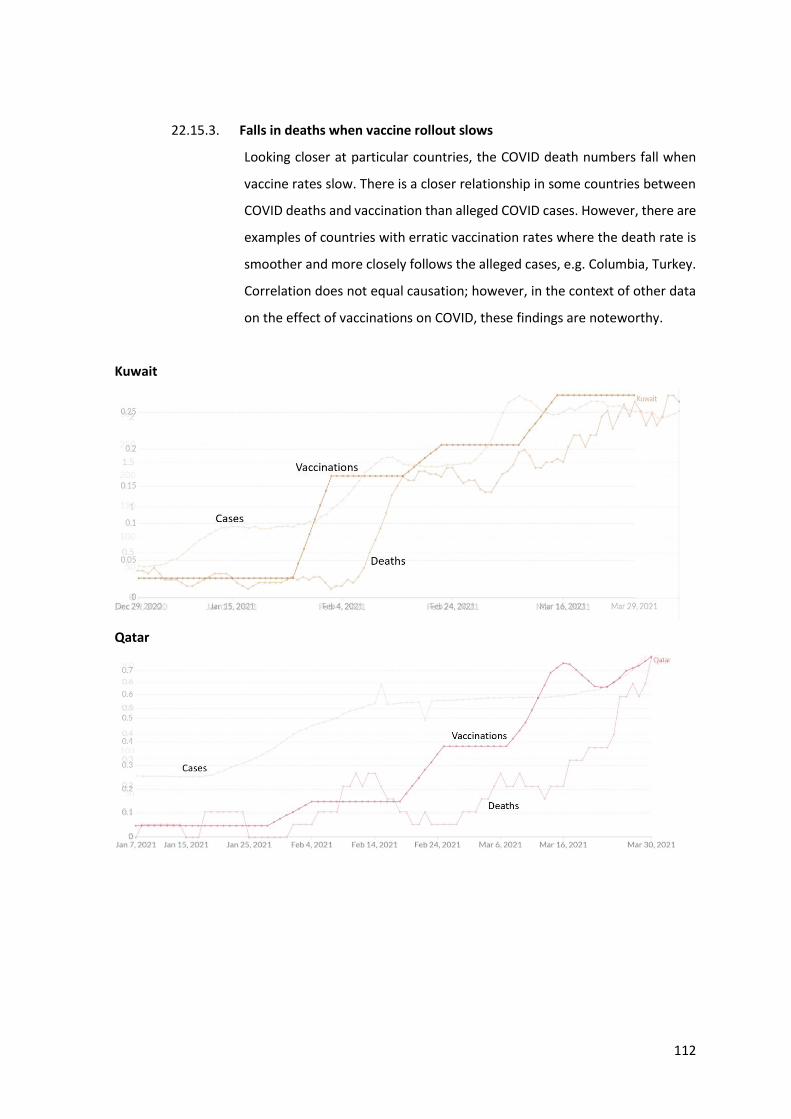
112
22.15.3. Falls in deaths when vaccine rollout slows
Looking closer at particular countries, the COVID death numbers fall when
vaccine rates slow. There is a closer relationship in some countries between
COVID deaths and vaccination than alleged COVID cases. However, there are
examples of countries with erratic vaccination rates where the death rate is
smoother and more closely follows the alleged cases, e.g. Columbia, Turkey.
Correlation does not equal causation; however, in the context of other data
on the effect of vaccinations on COVID, these findings are noteworthy.
Kuwait
Qatar
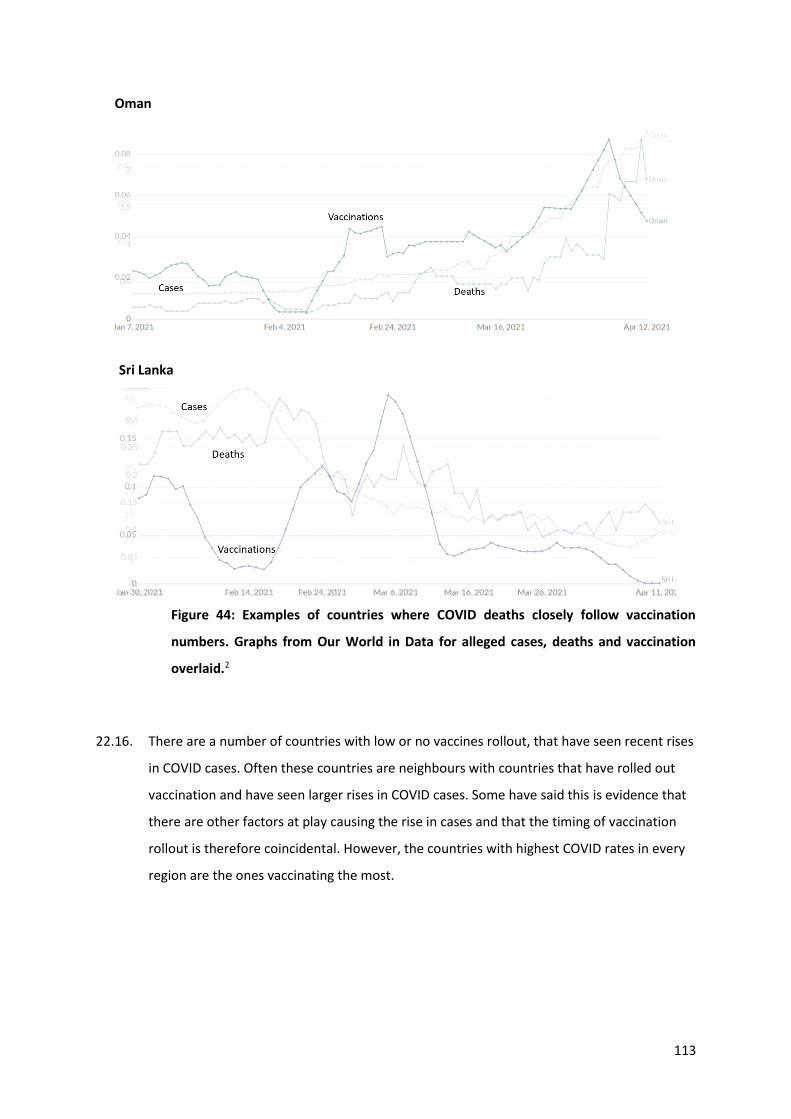
113
Oman
Sri Lanka
Figure 44: Examples of countries where COVID deaths closely follow vaccination
numbers. Graphs from Our World in Data for alleged cases, deaths and vaccination
overlaid.2
22.16. There are a number of countries with low or no vaccines rollout, that have seen recent rises
in COVID cases. Often these countries are neighbours with countries that have rolled out
vaccination and have seen larger rises in COVID cases. Some have said this is evidence that
there are other factors at play causing the rise in cases and that the timing of vaccination
rollout is therefore coincidental. However, the countries with highest COVID rates in every
region are the ones vaccinating the most.
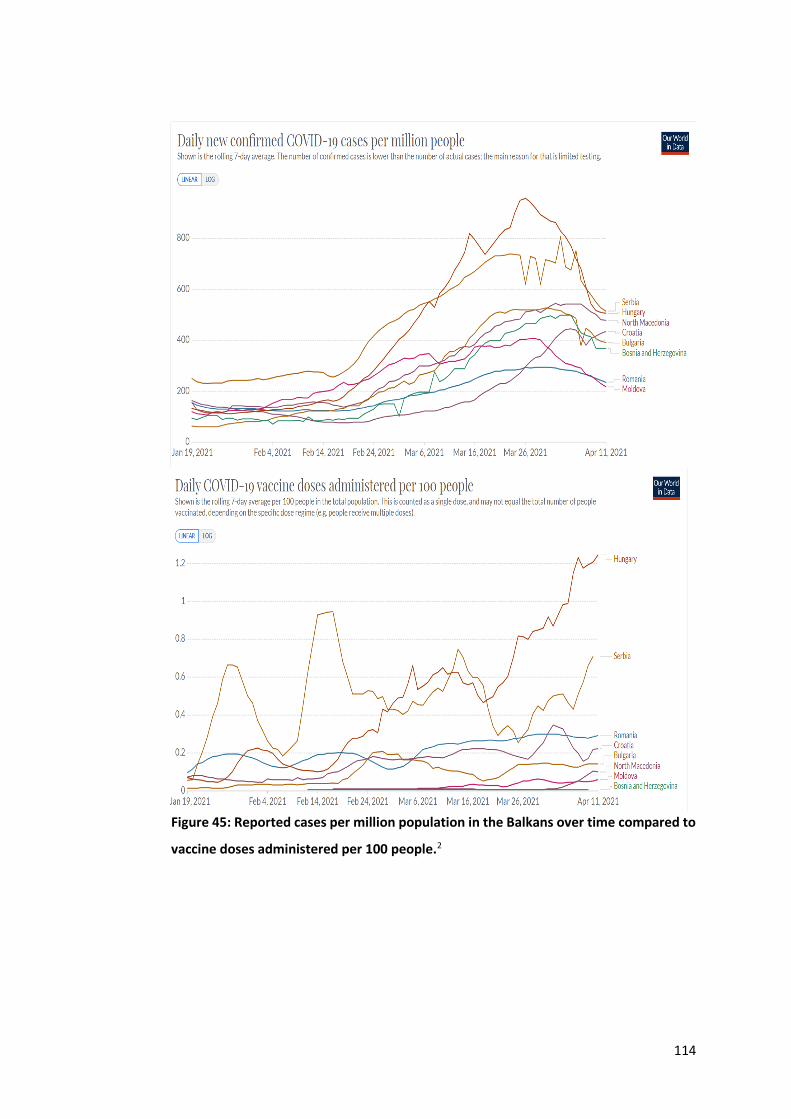
114
Figure 45: Reported cases per million population in the Balkans over time compared to
vaccine doses administered per 100 people.2
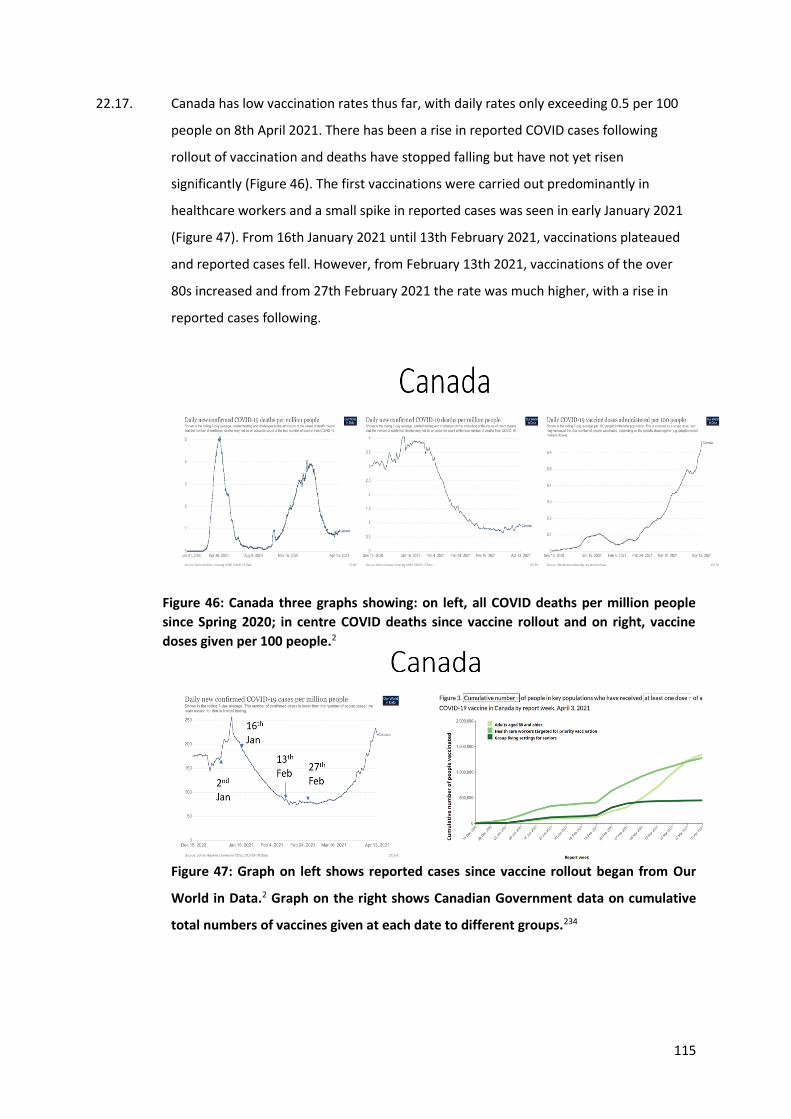
115
22.17. Canada has low vaccination rates thus far, with daily rates only exceeding 0.5 per 100
people on 8th April 2021. There has been a rise in reported COVID cases following
rollout of vaccination and deaths have stopped falling but have not yet risen
significantly (Figure 46). The first vaccinations were carried out predominantly in
healthcare workers and a small spike in reported cases was seen in early January 2021
(Figure 47). From 16th January 2021 until 13th February 2021, vaccinations plateaued
and reported cases fell. However, from February 13th 2021, vaccinations of the over
80s increased and from 27th February 2021 the rate was much higher, with a rise in
reported cases following.
Figure 46: Canada three graphs showing: on left, all COVID deaths per million people
since Spring 2020; in centre COVID deaths since vaccine rollout and on right, vaccine
doses given per 100 people.2
Figure 47: Graph on left shows reported cases since vaccine rollout began from Our
World in Data.2 Graph on the right shows Canadian Government data on cumulative
total numbers of vaccines given at each date to different groups.234
116
22.18. There may have been a rise in genuine COVID in Canada on vaccine rollout. However,
with both the current poor case definition and the lack of calibration of and confirmation
of testing, it is not possible to assess what proportion of COVID ‘cases’ in Spring 2021
have been genuine and what proportion have been due to false positive results. Even in
the presence of genuine COVID the false positive problem remains and risks of cross
contamination between samples will be at their highest.
23. Summary
23.12. COVID is a real disease caused by the virus SARS-CoV-2. It causes deaths, but the death
rate is much lower than generally perceived, particularly in the young and those with no
other health problems. The disease itself has been defined by the test results instead of
the other way around. The result of this has been an ever expanding case definition, with
increasing numbers and variety of symptoms, and the inclusion of asymptomatic ‘cases’.
23.13. There is no perfect diagnostic test, as every test must compromise between finding every
possible case and only finding definite cases. A choice must be made as to which of these
strategies to prioritise, and that choice must change over the course of an epidemic. A
testing system designed to find every possible case will result in positive results for people
who have no disease and cannot be infectious, known as false positive results.
23.14. Infected patients can shed viable virus from two days before having symptoms to up to 8
days afterwards. However, after the infectious period, people can continue to shed viral
debris, including viral RNA that can result in a positive PCR test for up to 3 months, even
though they are not infectious and are perfectly healthy. These post infective false
positive results are a significant problem and have been thoroughly studied now.
However, they are not the only cause of false positive results, the causes of which are
myriad.
23.15. False positive results are inevitable with any testing and will occur at a steady low
percentage of tests carried out. When designed carefully and carried out by experts, PCR
testing has a low rate of false positive results. Even in these circumstances, when there is
117
minimal real disease present, false positives can be a significant problem. The less disease
around, the higher the proportion of the positives that will be false positives. When there
is no disease, all the positives, by definition, are false positives.
23.16. Although a strategy and test designed to find every possible case is justifiable at the
outset of an epidemic, once peak deaths have been passed, the strategy and test design
must be changed. A failure to institute such a change will result in a false positive
problem. At an extreme, there have been situations of false positive results accounting
for 100% of positive results in false positive pseudo-epidemics. Viruses do not disappear
(with the important exception of SARS1) and a novel virus will become endemic, attacking
the vulnerable in the winter, when immunity wanes. The lack of excess deaths indicates
that at least the majority of ‘deaths’ diagnosed in winter were false positive test results.
Other evidence presented here indicates that the vast majority of ‘cases’ diagnosed as
COVID were false positive test results. In the absence of a change to the testing it is
reasonable to assume the problem has continued and remains.
23.17. PCR testing is carried out by amplifying the material present before testing. Therefore,
the tiniest fragments of material can trigger a positive test. This is true for all PCR, but the
design of the test for SARS-CoV-2 PCR includes numerous other ways which predispose
to false positive results.
23.18. To avoid errors, including false positives, tests need to be calibrated against a gold
standard, in this case viral culture. Every laboratory carrying out the testing for SARS-CoV-
2 with the PCR test should have carried out such calibration work which does not seem
to be the case in Canada, including in Quebec and Ontario. Such work has only been
carried out by a handful of laboratories and, every time, they have exposed significant
problems with false positive results.
23.19. The majority of false positive results could be avoided by using a lower cut off e.g. a Ct
Value of 25 or less, for calling a positive test. In Canada, including in Quebec and in
Ontario, laboratories continue to use a high cut off, despite evidence that no viable virus
can be found at these high levels and there is no risk of viral transmission. Further, false
positive results could be avoided by ensuring that several SARS-CoV-2 genes test positive.
The more genes included in the test, the less likely a false positive result would be
118
reported. Laboratories in Canada, are still using protocols in which only one or two genes
are tested for.87
23.20. Further, false positive results could be avoided by the judicious use of internal controls.
These should include using negative swabs, preferably containing human DNA and DNA
from non-COVID respiratory viruses, and passing them through the whole testing
process, from specimen reception onwards, to ensure there is no cross contamination.
External quality assurance checks should use similar procedures.
The false positive problem is evidenced by the following. After the spring of 2020, the
characteristics of the patients diagnosed as COVID reverted to levels expected in the
general population, and their clinical presentation was no longer that of an acute COVID
infection. The small numbers of studies done with confirmatory testing indicate a
significant false positive problem with PCR testing and the PCR test results have not been
confirmed when testing has been carried out with antigen tests and with antibody tests.
Even the deaths diagnosed as being due to COVID are no longer predictive of excess death
levels as they were in the spring of 2020. The diagnosis of death is an art and relies on
the balance of probabilities based on all the information available at the time. False
positive test results can therefore have a large influence on death diagnosis.
Misdiagnosis, misattribution of death and over testing the dying have led to missing
deaths from other respiratory causes and a higher age at death for COVID deaths than
for general deaths. The presence of occasional real cases of COVID does not mean that
the majority of ‘cases’ were not, in fact, false positive results.
23.21. Patients that have been labelled as having asymptomatic COVID are largely people with
false positive test results. There is essentially no evidence of asymptomatic transmission
leading to a severe acute respiratory syndrome, a pneumonia or anyone needing to seek
medical attention of any kind. The evidence of transmission by asymptomatic people is,
at best, extremely weak, with only six such people worldwide said to have transmitted
infection and only two individuals developing symptomatic disease as a result of contact
with someone labelled as having asymptomatic COVID. The symptoms they had were
incredibly minor and common, with a runny nose in one patient, and a mild cough for
one day in the other. Other papers that purport to show asymptomatic transmission have
been based either on a summary of these handful of ‘cases’ or on modelled data.
119
23.22. The PCR test is not capable of accurately identifying people with COVID disease, nor
people capable of infecting others with SARS-CoV-2. Overdiagnosis by PCR test has led to
exaggeration of case numbers and deaths, which, in turn, has led to immense harm,
including quarantining, lockdowns and business closures.
23.23. PCR test results have been used to introduce extreme policies that restrict people’s
freedoms and liberties. PCR testing was the right test to use at the outset of the epidemic,
but since peak deaths have been passed, the strategy and technique for using it needed
to be changed and has not. Other testing methods, which in conjunction with clinical
diagnosis are more accurate, are available and have been underused on symptomatic
patients. A body of evidence demonstrates that PCR testing has been used in ways that
do not identify infectious cases and yet, people testing positive have been falsely treated
as infectious.
23.24. PCR testing has resulted in inflated case numbers and misdiagnosis of deaths, which has
created the illusion of a serious COVID epidemic. Concerns about PCR testing creating
such false positive epidemics have been raised in the past, but the lessons have not been
heeded.
London, 4th May 2021
____________________________________________
Dr Clare Craig BM BCh FRCPath, Diagnostic Pathologist
____________________________________________
Dr Tanya (Tetyana) Klymenko PhD FHEA FIBMS, Senior Lecturer, Sheffield Hallam
University

120
References
1. Illa with a contribution from Prof. Ulrike Kämmerer. The PCR Disaster: Genesis and Evolution of the
Drosten Test. (Thomas Kubo, 2020). https://drive.google.com/file/d/10upa0ua7tKta86rJduq1-LDz-
w4knO1Y/view?usp=sharing
2. International COVID data from Our World in Data. https://ourworldindata.org/coronavirus
3. Public Health Ontario. Enhanced Epidemiological Summary COVID-19 Case Fatality, Case Identification,
and Attack Rates in Ontario. https://www.publichealthontario.ca/-
/media/documents/ncov/epi/2020/06/covid19-epi-case-identification-age-only-template.pdf?la=en.
4. Ioannidis, J. P. A. Reconciling estimates of global spread and infection fatality rates of COVID-19: An
overview of systematic evaluations. Eur. J. Clin. Invest. 51, e13554 (2021).
https://onlinelibrary.wiley.com/doi/10.1111/eci.13554
5. Ghisolfi, S. et al. Predicted COVID-19 fatality rates based on age, sex, comorbidities and health system
capacity. BMJ Glob Health 5, (2020). https://gh.bmj.com/content/5/9/e003094
6. Grand View Research. Polymerase Chain Reaction Market Size, Share & Trends Analysis Report By Type,
By Product (Instruments, Consumables & Reagents, Software & Services), By Application, By Region, And
Segment Forecasts, 2020 - 2027. https://www.grandviewresearch.com/industry-analysis/polymerase-
chain-reaction-market
7. Cheng, H.-Y. et al. Contact Tracing Assessment of COVID-19 Transmission Dynamics in Taiwan and Risk at
Different Exposure Periods Before and After Symptom Onset. JAMA Intern. Med. 180, 1156–1163 (2020).
https://jamanetwork.com/journals/jamainternalmedicine/fullarticle/2765641
8. Cevik, M. et al. SARS-CoV-2, SARS-CoV, and MERS-CoV viral load dynamics, duration of viral shedding, and
infectiousness: a systematic review and meta-analysis. Lancet Microbe 2, e13–e22 (2021).
https://www.thelancet.com/action/showPdf?pii=S2666-5247%2820%2930172-5
9. Chiara, M. et al. Next generation sequencing of SARS-CoV-2 genomes: challenges, applications and
opportunities. Brief. Bioinform. (2020) doi:10.1093/bib/bbaa297.
https://www.ncbi.nlm.nih.gov/pmc/articles/PMC7799330/pdf/bbaa297.pdf
10. UK Scientific Advisory Group of Experts. SARS-COV-2 TRANSMISSION ROUTES AND ENVIRONMENTS SAGE
121
– 22 OCTOBER 2020.
https://assets.publishing.service.gov.uk/government/uploads/system/uploads/attachment_data/file/933
225/S0824_SARS-CoV-2_Transmission_routes_and_environments.pdf.
11. Agarwal, V. et al. Long-term SARS-CoV-2 RNA shedding and its temporal association to IgG seropositivity.
Cell Death Discov 6, 138 (2020). https://www.nature.com/articles/s41420-020-00375-y.pdf
12. van Kampen, J. J. A. et al. Duration and key determinants of infectious virus shedding in hospitalized
patients with coronavirus disease-2019 (COVID-19). Nat. Commun. 12, 267 (2021).
https://www.nature.com/articles/s41467-020-20568-4
13. Bullard, J. et al. Predicting infectious SARS-CoV-2 from diagnostic samples. Clin. Infect. Dis. (2020)
doi:10.1093/cid/ciaa638. https://academic.oup.com/cid/article/71/10/2663/5842165
14. CDC. Duration of isolation and precautions for adults with COVID-19.
https://www.cdc.gov/coronavirus/2019-ncov/hcp/duration-isolation.html (2020).
15. Public Health England. COVID-19: management of staff and exposed patients or residents in health and
social care settings. https://www.gov.uk/government/publications/covid-19-management-of-exposed-
healthcare-workers-and-patients-in-hospital-settings/covid-19-management-of-exposed-healthcare-
workers-and-patients-in-hospital-settings.
16. Mina, M. J., Peto, T. E., García-Fiñana, M., Semple, M. G. & Buchan, I. E. Clarifying the evidence on SARS-
CoV-2 antigen rapid tests in public health responses to COVID-19. Lancet (2021) doi:10.1016/S0140-
6736(21)00425-6. https://www.thelancet.com/journals/lancet/article/PIIS0140-6736(21)00425-6/fulltext
17. Definition of Asymptomatic.
https://groups.molbiosci.northwestern.edu/holmgren/Glossary/Definitions/Def-A/asymptomatic.html.
18. Definition of DISEASE. https://www.merriam-webster.com/dictionary/disease?src=search-dict-box.
19. White, J. PubMed 2.0. Med. Ref. Serv. Q. 39, 382–387 (2020).
https://pubmed.ncbi.nlm.nih.gov/?term=respiratory+virus+asymptomatic
20. Diagnostic test studies: assessment and critical appraisal.
https://bestpractice.bmj.com/info/toolkit/learn-ebm/diagnostic-test-studies-assessment-and-critical-
appraisal/.
21. Mammograms: Facts on ‘false positives’. URMC Newsroom
https://www.urmc.rochester.edu/news/publications/health-matters/mammograms-facts-on-false-
122
positives (2015).
22. Scheck, A. Special Report: Overtesting and Overdiagnosis: A Problem Masquerading as a Solution.
Emergency Medicine News 35, 16 (2013). https://journals.lww.com/em-
news/fulltext/2013/01000/special_report__overtesting_and_overdiagnosis__a.1.aspx
23. Mayor, S. New way to define disease is needed to reduce overdiagnosis, experts agree. BMJ 354, i5082
(2016). https://www.bmj.com/content/354/bmj.i5082.full
24. CDC. Healthcare Workers. https://www.cdc.gov/coronavirus/2019-ncov/hcp/clinical-guidance-
management-patients.html (2021).
25. COVID-19 signs, symptoms and severity of disease: A clinician guide.
https://www.canada.ca/en/public-health/services/diseases/2019-novel-coronavirus-
infection/guidance-documents/signs-symptoms-severity.html.
26. Public Health Agency of Canada. National case definition: Coronavirus disease (COVID-19).
https://www.canada.ca/en/public-health/services/diseases/2019-novel-coronavirus-infection/health-
professionals/national-case-definition.html (2021).
27. Public Health Agency of Canada. Interim national case definition: Novel Coronavirus (2019-nCoV).
https://web.archive.org/web/20200211164225/https:/www.canada.ca/en/public-
health/services/diseases/2019-novel-coronavirus-infection/health-professionals/national-case-
definition.html (2020).
28. du Quebec, G. DÉFINITION DE CAS DE COVID-19 - QUÉBEC. (2020).
https://msss.gouv.qc.ca/professionnels/documents/coronavirus-2019-ncov/definition-
nosologique-COVID-19_2020-12-17.pdf
29. WHO Information Notice for IVD Users.
https://web.archive.org/web/20201220014018/https://www.who.int/news/item/14-12-2020-who-
information-notice-for-ivd-users.
30. European Centre for Disease Prevention and Control. The 2009 A(H1N1) pandemic in Europe A review of
the experience. (2010).
https://www.ecdc.europa.eu/sites/portal/files/media/en/publications/Publications/101108_SPR_pande
mic_experience.pdf
123
31. Pan Canadian Public Health Network. CANADIAN PANDEMIC INFLUENZA PREPAREDNESS: Planning
Guidance for the Health Sector. https://www.canada.ca/content/dam/phac-aspc/migration/phac-
aspc/cpip-pclcpi/assets/pdf/report-rapport-02-2018-eng.pdf.
32. Surkova, E., Nikolayevskyy, V. & Drobniewski, F. False-positive COVID-19 results: hidden problems and
costs. Lancet Respir Med 8, 1167–1168 (2020).
https://www.thelancet.com/journals/lanres/article/PIIS2213-2600(20)30453-7/fulltext
33. Covid-19 testing, low prevalence and the impact of false positive results. (2021).
https://www.bmj.com/content/369/bmj.m1808/rr-22
34. Ismail, A. A. When laboratory tests can mislead even when they appear plausible. Clin. Med. 17, 329–332
(2017). https://www.ncbi.nlm.nih.gov/pmc/articles/PMC6297641/
35. WHO. The use of PCR in the surveillance and diagnosis of influenza Report of the 5th meeting of the WHO
Working Group on Polymerase Chain Reaction Protocols for Detecting Subtype Influenza A Viruses
Geneva, Switzerland 26–27 June 2012.
https://www.who.int/influenza/gisrs_laboratory/report_2012pcrwg5thmeeting.pdf
36. Canadian Government. Coronavirus Disease 2019 (COVID-19) DAILY EPIDEMIOLOGY UPDATE Updated:
April 17, 2020.
https://web.archive.org/web/20200418141816if_/https:/www.canada.ca/content/dam/phac-
aspc/documents/services/diseases/2019-novel-coronavirus-infection/surv-covid19-epi-update-eng.pdf
37. Canadian Government. CORONAVIRUS DISEASE 2019 (COVID-19) DAILY EPIDEMIOLOGY UPDATE Updated:
4 June 2020. https://web.archive.org/web/20200604224015/https:/www.canada.ca/content/dam/phac-
aspc/documents/services/diseases/2019-novel-coronavirus-infection/surv-covid19-epi-update-eng.pdf
38. Canadian Government. CANADA COVID-19 WEEKLY EPIDEMIOLOGY REPORT (16 AUGUST TO 22 AUGUST
2020). https://web.archive.org/web/20200901213653/https:/www.canada.ca/content/dam/phac-
aspc/documents/services/diseases/2019-novel-coronavirus-infection/surv-covid19-weekly-epi-update-
20200828-eng.pdf
39. Canadian Government. CANADA COVID-19 WEEKLY EPIDEMIOLOGY REPORT (15 NOVEMBER TO 21
NOVEMBER, 2020).
https://web.archive.org/web/20201130211817/https:/www.canada.ca/content/dam/phac-
aspc/documents/services/diseases/2019-novel-coronavirus-infection/surv-covid19-weekly-epi-update-
124
20201127-eng.pdf
40. Canadian Government. CANADA COVID-19 WEEKLY EPIDEMIOLOGY REPORT 07 MARCH TO 13 MARCH
2021 (WEEK 10).
https://web.archive.org/web/20210319231010/https://www.canada.ca/content/dam/phac-
aspc/documents/services/diseases/2019-novel-coronavirus-infection/surv-covid19-weekly-epi-update-
20210319-en.pdf
41. Watson, J., Whiting, P. F. & Brush, J. E. Interpreting a covid-19 test result. BMJ 369, m1808 (2020).
https://www.bmj.com/content/369/bmj.m1808
42. Larkin, M. Curbing false positives and pseudo-epidemics. Lancet Infect. Dis. 7, 186 (2007).
https://www.thelancet.com/journals/laninf/article/PIIS1473-3099(07)70044-0/fulltext
43. Herbert, J. T., Feorino, P. & Caldwell, G. G. False-positive epidemic infectious mononucleosis. Am. Fam.
Physician 15, 119–121 (1977). https://pubmed.ncbi.nlm.nih.gov/835452/
44. Kolata, G. Faith in Quick Test Leads to Epidemic That Wasn’t. The New York Times (2007).
https://www.nytimes.com/2007/01/22/health/22whoop.html
45. Mandal, S. et al. Pertussis Pseudo-outbreak linked to specimens contaminated by Bordetella pertussis
DNA From clinic surfaces. Pediatrics 129, e424–30 (2012). https://pubmed.ncbi.nlm.nih.gov/22250029/
46. CDC H1N1 flu. https://www.cdc.gov/h1n1flu/reportingqa.htm.
47. WHO Declares Official End to H1N1 ‘Swine Flu’ Pandemic.
https://www.sciencemag.org/news/2010/08/who-declares-official-end-h1n1-swine-flu-pandemic (2014).
48. WHO. Global circulation of influenza viruses Number of specimens positives for influenza by subtypes
From week No 17 (2009) to 32 (2010) (19 April 2009 to 14 August 2010).
https://www.who.int/csr/disease/swineflu/Virologicaldataglobal2010_08_27.pdf?ua=1.
49. Kutter, S. Wie hoch ist die Gefahr einer Ausbreitung der Seuche Mers. Wirtschaftswoche
https://www.wiwo.de/technologie/forschung/virologe-drosten-im-gespraech-2014-der-koerper-
wirdstaendig-von-viren-angegriffen/9903228-all.html (2014).
50. UK Government. Impact of false-positives and false-negatives in the UK’s COVID-19 RT-PCR testing
programme.
https://assets.publishing.service.gov.uk/government/uploads/system/uploads/attachment_data/file/895
843/S0519_Impact_of_false_positives_and_negatives.pdf.
125
51. What Kary Mullis says about PCR testing.
https://www.youtube.com/watch?v=iWOJKuSKw5c&t=86s&ab_channel=WouterDeHeij.
52. Vägledning om kriterier för bedömning av smittfrihet vid covid-19.
https://www.folkhalsomyndigheten.se/publicerat-material/publikationsarkiv/v/vagledning-om-kriterier-
for-bedomning-av-smittfrihet-vid-covid-19/.
53. Bustin, S. A. et al. The MIQE guidelines: minimum information for publication of quantitative real-time
PCR experiments. Clin. Chem. 55, 611–622 (2009).
https://academic.oup.com/clinchem/article/55/4/611/5631762
54. CDC. CDC’s Diagnostic Test for COVID-19 Only and Supplies. https://www.cdc.gov/coronavirus/2019-
ncov/lab/virus-requests.html (2020).
55. Health Canada. Applications for medical devices under the Interim Order for use in relation to COVID-19:
Guidance document. https://www.canada.ca/en/health-canada/services/drugs-health-products/drug-
products/announcements/interim-order-importation-sale-medical-devices-covid-19/guidance-medical-
device-applications.html (2020).
56. Holloway, K., Miller, F. A., Rousseau, F., Gutierrez, A. & Hogarth, S. Health Canada needs to act on
laboratory-developed diagnostics. CMAJ 191, E1067–E1069 (2019).
https://academic.oup.com/clinchem/article/55/4/611/5631762
57. Covid-19 - TIB MOLBIOL. https://www.tib-molbiol.de/covid-19.
58. MolBiol, T. LightMix® Modular Wuhan CoV RdRP-gene. https://www.roche-as.es/lm_pdf/MDx_53-
0777_96_Wuhan-R-gene_V200204_09155376001%20%282%29.pdf
59. SARS-CoV-2 / COVID-19 Diagnosis and Confirmation Solutions. https://www.bio-
rad.com/featured/en/sars-cov-2-covid-19-testing-solutions.html.
60. SARS-CoV-2 Coronavirus Multiplex RT-qPCR Kit (CD019RT). https://www.creative-
diagnostics.com/pdf/cd019Rt.pdf
61. Public Health Agency of Canada. Pathogen Safety Data Sheets: Infectious substances – human
Parainfluenza virus. https://www.canada.ca/en/public-health/services/laboratory-biosafety-
biosecurity/pathogen-safety-data-sheets-risk-assessment/human-parainfluenza-virus.html (2011).
62. Borger, P. CORMAN-DROSTEN REVIEW REPORT CURATED BY AN INTERNATIONAL CONSORTIUM OF
SCIENTISTS IN LIFE SCIENCES (ICSLS). https://cormandrostenreview.com/retraction-request-letter-to-
126
eurosurveillance-editorial-board/.
63. Kosack, C. S., Page, A.-L. & Klatser, P. R. A guide to aid the selection of diagnostic tests. Bull. World Health
Organ. 95, 639–645 (2017). https://www.who.int/bulletin/volumes/95/9/16-187468/en/
64. Schnurr, D. Diagnosis of Viral Infections by Viral Isolation and Identification or by Direct Detection. in
Congenital and Perinatal Infections: A Concise Guide to Diagnosis (ed. Hutto, C.) 23–35 (Humana Press,
2006). https://link.springer.com/chapter/10.1385/1-59259-965-6:023
65. Wölfel, R. et al. Virological assessment of hospitalized patients with COVID-2019. Nature 581, 465–469
(2020). https://www.nature.com/articles/s41586-020-2196-x
66. Arnaout, R. et al. SARS-CoV2 Testing: The Limit of Detection Matters. bioRxiv (2020)
doi:10.1101/2020.06.02.131144. https://www.ncbi.nlm.nih.gov/pmc/articles/PMC7302192/
67. Matheeussen, V. et al. International external quality assessment for SARS-CoV-2 molecular detection and
survey on clinical laboratory preparedness during the COVID-19 pandemic, April/May 2020. Euro Surveill.
25, (2020). https://www.ncbi.nlm.nih.gov/pmc/articles/PMC7364759/
68. La Scola, B. et al. Viral RNA load as determined by cell culture as a management tool for discharge of
SARS-CoV-2 patients from infectious disease wards. Eur. J. Clin. Microbiol. Infect. Dis. 39, 1059–1061
(2020). https://www.ncbi.nlm.nih.gov/pmc/articles/PMC7185831/
69. Jaafar, R. et al. Correlation between 3790 qPCR positives samples and positive cell cultures including 1941
SARS-CoV-2 isolates. Clin. Infect. Dis. (2020) doi:10.1093/cid/ciaa1491.
https://academic.oup.com/cid/advance-article/doi/10.1093/cid/ciaa1491/5912603
70. Kim, M.-C. et al. Duration of Culturable SARS-CoV-2 in Hospitalized Patients with Covid-19. N. Engl. J. Med.
384, 671–673 (2021). https://www.nejm.org/doi/full/10.1056/NEJMc2027040
71. National Centre for Infectious Diseases Singapore. Position Statement from the National Centre for
Infectious Diseases and the Chapter of Infectious Disease Physicians, Academy of Medicine, Singapore.
(2020). https://www.ncid.sg/Documents/Period%20of%20Infectivity%20Position%20Statementv2.pdf
72. Coronavirus (COVID-19) Infection Survey: cycle threshold and household transmission analysis.
https://www.ons.gov.uk/peoplepopulationandcommunity/healthandsocialcare/conditionsanddiseases/a
dhocs/12683coronaviruscovid19infectionsurveycyclethresholdandhouseholdtransmissionanalysis.
73. Patrick Vallance (GCSA), Chris Whitty (CMO), Angela McLean (MoD CSA),Cath Noakes (Leeds), Charlotte
Watts (FCDO CSA), Calum Semple (Liverpool), Fliss Bennee (Wales), Graham Medley (LSHTM), Ian Boyd (St
127
Andrews), Ian Diamond (ONS), Iain Bell (ONS), Ian Young (NI), Jeremy Farrar (Wellcome), Jim McMenamin
(Health Protection Scotland), John Edmunds (LSHTM), Julia Gog (Cambridge), Kamlesh Khunti (Leicester),
Maria Zambon (PHE), Mark Walport (UKRI), Mark Wilcox (NHS), Michael Parker (Oxford), Peter Horby
(Oxford), Stephen Powis (NHS England), Wendy Barclay (Imperial), Nicola Steedman (Scotland), Harry
Rutter (Bath), Rob Orford (Wales, Health CSA), Sheila Rowan (Scotland CSA), Sharon Peacock (PHE), Susan
Hopkins (PHE/NHST&T), Jeanelle de Gruchy (ADPH), Andrew Morris (HDR UK), Lucy Yardley
(Bristol/Southampton), Russell Viner (RCPCH), Susan Michie (UCL), Wei Shen Lim (Nottingham), Vittal
Katikireddi (Glasgow). Seventy-third SAGE meeting on COVID-19, 17th December 2020 Held via Video
Teleconference.
https://assets.publishing.service.gov.uk/government/uploads/system/uploads/attachment_data/file/952
613/s0989-covid-19-sage-73-minutes-171220.pdf (2020).
74. Levine-Tiefenbrun, M. et al. Initial report of decreased SARS-CoV-2 viral load after inoculation with the
BNT162b2 vaccine. Nat. Med. (2021) doi:10.1038/s41591-021-01316-7.
https://www.nature.com/articles/s41591-021-01316-7
75. Walker, A. S. et al. Viral load in community SARS-CoV-2 cases varies widely and temporally. bioRxiv (2020)
doi:10.1101/2020.10.25.20219048.
https://www.medrxiv.org/content/10.1101/2020.10.25.20219048v1.full.pdf
76. Désautels, L. Recherche du SARS-CoV-2 par RT-PCR avec détection en temps réel.
https://www.inspq.qc.ca/sites/default/files/demandes_acces/pr-bm-131_0.pdf.
77. Public Health Ontario. An Overview of Cycle Threshold Values and their Role in SARS-CoV-2 Real-Time PCR
Test Interpretation. (2020). https://www.publichealthontario.ca/-
/media/documents/ncov/main/2020/09/cycle-threshold-values-sars-cov2-pcr.pdf?la=en
78. Deutsche Vereinigung zur Bekämpfung der Viruskrankheiten e. V. (DVV) Gesellschaft für Virologie e. V.
(GfV) Deutsche Gesellschaft für Hygiene und Mikrobiologie e. V. (DGHM). Kommentar zum Extra
Ringversuch Gruppe 340 Virusgenom-Nachweis - SARS-CoV-2. (2020). https://corona-ausschuss.de/wp-
content/uploads/2020/07/Instand-Ringversuch-Virusgenom-Nachweis-SARS-CoV-2.pdf
79. COVID-19 with Dr. Anthony Fauci This Week in Virology. https://podcasts.apple.com/gb/podcast/covid-
19-with-dr-anthony-fauci/id300973784?i=1000485246168.
80. Office of National Statistics UK. Coronavirus (COVID-19) Infection Survey pilot: England and Wales, 18
128
September 2020. (2020).
https://www.ons.gov.uk/peoplepopulationandcommunity/healthandsocialcare/conditionsanddiseases/b
ulletins/coronaviruscovid19infectionsurveypilot/englandandwales18september2020
81. Navascués, A. et al. Detection of Respiratory Viruses in Deceased Persons, Spain, 2017. Emerg. Infect. Dis.
24, 1331–1334 (2018). https://www.ncbi.nlm.nih.gov/pmc/articles/PMC6038767/
82. Koetz, A., Nilsson, P., Lindén, M., van der Hoek, L. & Ripa, T. Detection of human coronavirus NL63,
human metapneumovirus and respiratory syncytial virus in children with respiratory tract infections in
south-west Sweden. Clin. Microbiol. Infect. 12, 1089–1096 (2006).
https://www.ncbi.nlm.nih.gov/pmc/articles/PMC7128111/
83. Patrick, D. M. et al. An Outbreak of Human Coronavirus OC43 Infection and Serological Cross-reactivity
with SARS Coronavirus. Can. J. Infect. Dis. Med. Microbiol. 17, 330–336 (2006).
https://www.ncbi.nlm.nih.gov/pmc/articles/PMC2095096/
84. Gasiorowski-Denis, E. The mystery of the Phantom of Heilbronn.
https://www.iso.org/news/2016/07/Ref2094.html (2016).
85. Victor Corman, Olfert Landt, Marion Koopmans, Maria Zambon. Diagnostic detection of Wuhan
coronavirus 2019 by real-time RTPCR. WHO (2020). https://www.who.int/docs/default-
source/coronaviruse/wuhan-virus-assay-v1991527e5122341d99287a1b17c111902.pdf
86. WHO. Laboratory testing for coronavirus disease 2019 (COVID-19) in suspected human cases. (2020).
http://apps.who.int/iris/bitstream/handle/10665/331329/WHO-COVID-19-laboratory-2020.4-eng.pdf
87. Public Health Ontario. Coronavirus Disease 2019 (COVID-19) – PCR.
https://www.publichealthontario.ca/en/laboratory-services/test-information-index/covid-19.
88. Jung, Y. et al. Comparative Analysis of Primer-Probe Sets for RT-qPCR of COVID-19 Causative Virus (SARS-
CoV-2). ACS Infect Dis 6, 2513–2523 (2020). https://pubs.acs.org/doi/10.1021/acsinfecdis.0c00464
89. Wernike, K. et al. Pitfalls in SARS-CoV-2 PCR diagnostics. Transbound. Emerg. Dis. (2020)
doi:10.1111/tbed.13684. https://onlinelibrary.wiley.com/doi/full/10.1111/tbed.13684
90. Konrad, R. et al. Rapid establishment of laboratory diagnostics for the novel coronavirus SARS-CoV-2 in
Bavaria, Germany, February 2020. Euro Surveill. 25, (2020).
https://www.eurosurveillance.org/content/10.2807/1560-7917.ES.2020.25.9.2000173
91. Khan, K. A. & Cheung, P. Presence of mismatches between diagnostic PCR assays and coronavirus SARS-
129
CoV-2 genome. R Soc Open Sci 7, 200636 (2020).
https://royalsocietypublishing.org/doi/10.1098/rsos.200636
92. Dahdouh, E., Lázaro-Perona, F., Romero-Gómez, M. P., Mingorance, J. & García-Rodriguez, J. Ct values
from SARS-CoV-2 diagnostic PCR assays should not be used as direct estimates of viral load. J. Infect.
(2020) doi:10.1016/j.jinf.2020.10.017.
https://www.ncbi.nlm.nih.gov/pmc/articles/PMC7585367/?report=reader
93. Corman, V. M. et al. Detection of 2019 novel coronavirus (2019-nCoV) by real-time RT-PCR. Euro Surveill.
25, (2020). https://www.eurosurveillance.org/content/10.2807/1560-7917.ES.2020.25.3.2000045
94. Addendum: Peer reviewed literature and preprints covering wet-lab experiments, in silico analysis of the
Corman Drosten protocol-design, meta-data analysis on EuroSurveillance.org and further discussion –
CORMAN-DROSTEN REVIEW REPORT. https://cormandrostenreview.com/addendum/.
95. TaqPathTM COVID‑19 CE‑IVD RT‑PCR Kit INSTRUCTIONS FOR USE. https://assets.thermofisher.com/TFS-
Assets/LSG/manuals/MAN0019215_TaqPathCOVID-19_CE-IVD_RT-PCR%20Kit_IFU.pdf
96. de Lamballerie Marion Koopmans & Chantal Reusken, R. N. C. I. L.-G. S. P. X. Background review for
diagnostic test development for Zika virus infection. Bull. World Health Organ. (2016)
doi:10.2471/BLT.16.171207. https://www.who.int/bulletin/volumes/94/8/16-171207/en/
97. Temple-Raston, D. CDC Report: Officials Knew Coronavirus Test Was Flawed But Released It Anyway. NPR
(2020). https://www.npr.org/2020/11/06/929078678/cdc-report-officials-knew-coronavirus-test-was-
flawed-but-released-it-anyway?t=1610882685290
98. Patra, K. All 77 false-positive COVID-19 tests come back negative upon reruns. NFL
https://www.nfl.com/news/all-77-false-positive-covid-19-tests-come-back-negative-upon-reruns (2020).
99. Fonrouge, G. Connecticut lab finds 90 positive COVID-19 tests were false: report. New York post (2020).
https://nypost.com/2020/07/21/connecticut-testing-lab-botches-dozens-of-coronavirus-tests
100. Center for Devices & Radiological Health. False positive results with BD SARS-CoV-2 Reagents for BD Max
System. https://www.fda.gov/medical-devices/letters-health-care-providers/false-positive-results-bd-
sars-cov-2-reagents-bd-max-system-letter-clinical-laboratory-staff-and (2020).
https://www.fda.gov/medical-devices/letters-health-care-providers/false-positive-results-bd-sars-cov-2-
reagents-bd-max-system-letter-clinical-laboratory-staff-and
101. Center for Devices & Radiological Health. Risk of inaccurate results with Thermo Fisher Scientific TaqPath
130
kit. https://www.fda.gov/medical-devices/letters-health-care-providers/risk-inaccurate-results-thermo-
fisher-scientific-taqpath-covid-19-combo-kit-letter-clinical?utm_campaign=2020-08-
17%20Risk%20of%20Inaccurate%20Results%20with%20Thermo%20Fisher%20Scientific%20TaqPath&utm
_medium=email&utm_source=Eloqua (2020).
102. Huggett, J. F. et al. Cautionary Note on Contamination of Reagents Used for Molecular Detection of SARS-
CoV-2. Clin. Chem. 66, 1369–1372 (2020).
https://academic.oup.com/clinchem/article/66/11/1369/5902447
103. Kerstin Wernike, Markus Keller, Franz J. Conraths, Thomas C. Mettenleiter, Martin H. Groschup, Martin
Beer. Pitfalls in SARS-CoV-2 PCR diagnostics. PrePrint.
https://www.biorxiv.org/content/10.1101/2020.06.03.132357v1.full.pdf
104. Mögling, R. et al. Delayed Laboratory Response to COVID-19 Caused by Molecular Diagnostic
Contamination. Emerg. Infect. Dis. 26, 1944–1946 (2020). https://wwwnc.cdc.gov/eid/article/26/8/20-
1843_article
105. Lewis, A. Faulty Covid swabs ‘may have affected the accuracy of a small proportion of test results leading
to false positives’. https://www.walesonline.co.uk/news/wales-news/covid-swabs-false-positives-
accuracy-19659722 (2021).
106. Boyd, C. Half a million Covid testing kits from Randox recalled ‘after checks revealed they were not
sterile’. https://www.dailymail.co.uk/news/article-8532929/Half-million-Covid-testing-kits-Randox-
recalled-checks-revealed-not-sterile.html (2020).
107. BBC Panorama | The PCR TEST FRAUD. https://www.youtube.com/watch?v=Uk1VK1reNtE (2021).
108. III. Diagnostic Assays: Supplement F: Laboratory Guidance: Public Health Guidance for Community-Level
Preparedness and Response to Severe Acute Respiratory Syndrome (SARS) SARS.
https://www.cdc.gov/sars/guidance/f-lab/assays.html (2019).
109. Borger, P., Malhotra, R. K., Yeadon, M., Craig, C. & Kämmerer, U. External peer review of the RTPCR test
to detect SARS-CoV-2 reveals 10 major scientific flaws at the molecular and methodological level:
consequences for false positive results. (2020) doi:10.5281/zenodo.4298004.
https://www.researchgate.net/publication/346483715
110. Andrew N. Cohen, B. K. False positives in reverse transcription PCR testing for SARS-CoV-2. PrePrint.
https://www.medrxiv.org/content/10.1101/2020.04.26.20080911v1.full.pdf
131
111. Steven Riley, Kylie E. C. Ainslie, Oliver Eales, Benjamin Jeffrey, Caroline E. Walters, Christina Atchison,
Peter J. Diggle, Deborah Ashby, Christl A. Donnelly, Graham Cooke, Wendy Barclay, Helen Ward, Graham
Taylor, Ara Darzi, Paul Elliott. Community prevalence of SARS-CoV-2 virus in England during May 2020:
REACT study. PrePrint (2020).
https://www.medrxiv.org/content/10.1101/2020.07.10.20150524v1.full.pdf
112. Van Vooren, S. UgenTec and DMark announce Canada distributor agreement for FastFinder.
https://www.ugentec.com/blog/ugentec_dmark_distributor_agreement_canada.
113. UgenTec. Quality and Regulatory compliance with FastFinder.
https://cdn2.hubspot.net/hubfs/2387197/Benefits%202-pager%20-%20Regulatory.pdf.
114. Josephs, J. Government to pay £2m to settle coronavirus testing case. BBC (2020).
https://www.bbc.co.uk/news/business-54455666
115. WHO Emergency Use Assessment Coronavirus disease (COVID-19) IVDs PUBLIC REPORT.
https://www.who.int/diagnostics_laboratory/eual/200921_final_pqpr_eul_0525_156_00_taqpath_covid
19_ce_ivd_rt_pcr_kit.pdf?ua=1
116. S. J. Barrett and P. H. A. Sneath. A numerical phenotypic taxonomic study of the genus Neisseria Free.
Microbiology 140, (1994).
https://www.microbiologyresearch.org/docserver/fulltext/micro/140/10/mic-140-10-2867.pdf
117. Criteria for appraising the viability, effectiveness and appropriateness of a screening programme.
https://www.gov.uk/government/publications/evidence-review-criteria-national-screening-
programmes/criteria-for-appraising-the-viability-effectiveness-and-appropriateness-of-a-screening-
programme.
118. Cervical screening: acceptable HPV tests. https://www.gov.uk/government/publications/cervical-
screening-acceptable-hpv-tests/cervical-screening-acceptable-hpv-tests.
119. Melnikow, J. et al. Screening for Cervical Cancer With High-Risk Human Papillomavirus Testing: Updated
Evidence Report and Systematic Review for the US Preventive Services Task Force. JAMA 320, 687–705
(2018). https://www.microbiologyresearch.org/docserver/fulltext/micro/140/10/mic-140-10-
2867.pdf?expires=1612372491&id=id&accname=guest&checksum=0FB5D672125F6532EDFEC55F9C6A0D
88
120. Cervical cancer incidence statistics. https://www.cancerresearchuk.org/health-professional/cancer-
132
statistics/statistics-by-cancer-type/cervical-cancer/incidence (2015).
121. Criteria for appraising the viability, effectiveness and appropriateness of a screening programme.
https://www.gov.uk/government/publications/evidence-review-criteria-national-screening-
programmes/criteria-for-appraising-the-viability-effectiveness-and-appropriateness-of-a-screening-
programme.
122. Laboratory testing for 2019 novel coronavirus (2019-nCoV) in suspected human cases.
https://www.who.int/publications/i/item/10665-331501.
123. CanCOGeN Briefing - December 2020. https://mailchi.mp/19b6589dac13/cancogen-briefing-december-
2020-note-dinformation-sur-rcangco-decembre-6930354.
124. CORMAN-DROSTEN REVIEW REPORT. https://cormandrostenreview.com/report/.
125. Centers for Disease Control and Prevention. CDC 2019-Novel Coronavirus (2019-nCoV) Real-Time RT-PCR
Diagnostic Panel. https://www.fda.gov/media/134922/download.
126. Pas, S. D. et al. First international external quality assessment of molecular diagnostics for Mers-CoV. J.
Clin. Virol. 69, 81–85 (2015). https://www.sciencedirect.com/science/article/pii/S1386653215001675
127. WHO Information Notice for IVD Users 2020/05. https://www.who.int/news/item/20-01-2021-who-
information-notice-for-ivd-users-2020-05.
128. Assistant, C. B. Covid is killing fewer healthy and under-60s in England than in first wave.
https://www.dailymail.co.uk/news/article-9137511/Covid-killing-fewer-healthy-60s-England-wave.html
(2021).
129. Declining death rate from COVID-19 in hospitals in England - The Centre for Evidence-Based Medicine.
https://www.cebm.net/covid-19/declining-death-rate-from-covid-19-in-hospitals-in-england/ (2020).
130. Dopico, X. C. et al. Widespread seasonal gene expression reveals annual differences in human immunity
and physiology. Nat. Commun. 6, 7000 (2015). https://www.nature.com/articles/ncomms8000
131. McKeigue, P. M. et al. Relation of severe COVID-19 to polypharmacy and prescribing of psychotropic
drugs: the REACT-SCOT case-control study. BMC Med. 19, 51 (2021).
https://www.medrxiv.org/content/10.1101/2021.03.02.21252734v1
132. Barnacle, J. R. et al. Changes in the hospital admission profile of COVID-19 positive patients at a central
London trust. The Journal of infection vol. 82 159–198 (2021).
https://www.ncbi.nlm.nih.gov/pmc/articles/PMC7377982/
133
133. Fortieth SAGE meeting on COVID-19. (2020).
https://assets.publishing.service.gov.uk/government/uploads/system/uploads/attachment_data/file/895
864/S0537_Fortieth_SAGE_meeting_on_Covid-19.pdf
134. Ben Warne, D. UoC Asymptomatic COVID-19 Screening Programme: Week 9 (30th November – 6 th
December 2020).
https://www.cam.ac.uk/sites/www.cam.ac.uk/files/documents/pooled_testing_report_30nov-6dec.pdf
135. Healy, B., Khan, A., Metezai, H., Blyth, I. & Asad, H. The impact of false positive COVID-19 results in an
area of low prevalence. Clin. Med. 21, e54–e56 (2021). https://pubmed.ncbi.nlm.nih.gov/33243836/
136. Bethell, Lord. Letter from Lord Bethell. (2021). Part One Part Two
137. Collins, S. D. The Influenza Epidemic of 1928-1929 with Comparative Data for 1918-1919. Am. J. Public
Health Nations. Health (1930). https://ajph.aphapublications.org/doi/pdf/10.2105/AJPH.20.2.119
138. Excess deaths. https://www.euromomo.eu/graphs-and-maps/.
139. Government of Canada, Statistics Canada. Weekly adjusted number of deaths, expected number of
deaths and estimates of excess mortality: Interactive Tool. https://www150.statcan.gc.ca/n1/pub/71-
607-x/71-607-x2020023-eng.htm (2020).
140. Government of Canada, Statistics Canada. Provisional death counts and excess mortality, January to
November 2020. https://www150.statcan.gc.ca/n1/daily-quotidien/210208/dq210208c-eng.htm (2021).
141. Thread by @Milhouse_Van_Ho using data from Canadian Government
https://threadreaderapp.com/thread/1372534042038575104.html
142. Tang, X. et al. COVID Symptoms, Seroprevalence, and Mortality During the First Wave of SARS-CoV-2 in
Canada. (2021) doi:10.2139/ssrn.3752659.
https://www.medrxiv.org/content/10.1101/2021.03.04.21252540v1.full
143. Majdoubi, A. et al. A majority of uninfected adults show pre-existing antibody reactivity against SARS-
CoV-2. JCI Insight (2021) doi:10.1172/jci.insight.146316. https://insight.jci.org/articles/view/146316
144. Ward, H., Professor et al. REACT-2 Round 5: increasing prevalence of SARS-CoV-2 antibodies demonstrate
impact of the second wave and of vaccine roll-out in England. (2021) doi:10.1101/2021.02.26.21252512.
https://www.medrxiv.org/content/10.1101/2021.02.26.21252512v1.full
145. Visualising Local Authority COVID-19 deaths/cases data.
https://victimofmaths.shinyapps.io/COVID_LA_Plots/
134
146. Synairgen announces data from Home Cohort of SG016 Phase II trial of inhaled interferon beta in COVID-
19 patients and encouraging combined data for whole SG016 trial. (2021).
https://investegate.co.uk/synairgen-plc/gnw/synairgen-announces-data-from-home-cohort-of-sg016-
phase-ii-trial-of-inhaled-interferon-beta-in-covid-19-patients-and-encouraging-combined-data-for-whole-
sg016-trial/20210430070000H1818/
147. Phase 3 trial shows REGEN-COVTM (Casirivimab with Imdevimab) antibody cocktail reduced
hospitalization or death by 70% in non-hospitalized COVID-19 patients. TM (2021)
https://investor.regeneron.com/news-releases/news-release-details/phase-3-trial-shows-regen-covtm-
casirivimab-imdevimab-antibody
148. Report 9 - Impact of non-pharmaceutical interventions (NPIs) to reduce COVID-19 mortality and
healthcare demand. https://www.imperial.ac.uk/mrc-global-infectious-disease-analysis/covid-19/report-
9-impact-of-npis-on-covid-19/.
149. PANDA – Pandemics Data and Analytics. World Snapshot.
https://app.powerbi.com/view?r=eyJrIjoiMGVjYjhkMjMtMzhjMy00OWRkLWJlNWItNjM0NzI0NjhiNTlkIiwi
dCI6IjlkZWYwNTBlLTExMDUtNDk1ZC1iNzUzLWRhOGRiZTc5MGVmNyJ9.
150. Department of Health and Social Care. Oxford University and PHE confirm high-sensitivity of lateral flow
tests. GOV.UK https://www.gov.uk/government/news/oxford-university-and-phe-confirm-high-
sensitivity-of-lateral-flow-tests (2020).
151. Deeks, J. J. & Raffle, A. E. Lateral flow tests cannot rule out SARS-CoV-2 infection. BMJ 371, m4787 (2020).
https://www.bmj.com/content/371/bmj.m4787
152. Scientific Advisory Group for Emergencies. Innova Lateral Flow SARS-CoV-2 Antigen test accuracy in
Liverpool Pilot: preliminary data, 26 November 2020.
https://www.gov.uk/government/publications/innova-lateral-flow-sars-cov-2-antigen-test-accuracy-in-
liverpool-pilot-preliminary-data-26-november-2020 (2020).
153. Wilson, C. Test caught just 3 per cent of students with covid-19 at UK university. New Scientist (2020).
https://www.newscientist.com/article/2263746-test-caught-just-3-per-cent-of-students-with-covid-19-at-
uk-university
154. Pekosz, A. et al. Antigen-Based Testing but Not Real-Time Polymerase Chain Reaction Correlates With
Severe Acute Respiratory Syndrome Coronavirus 2 Viral Culture. Clin. Infect. Dis. (2021)
135
doi:10.1093/cid/ciaa1706. https://academic.oup.com/cid/advance-
article/doi/10.1093/cid/ciaa1706/6105729
155. Prince-Guerra, J. L. et al. Evaluation of Abbott BinaxNOW Rapid Antigen Test for SARS-CoV-2 Infection at
Two Community-Based Testing Sites - Pima County, Arizona, November 3-17, 2020. MMWR Morb. Mortal.
Wkly. Rep. 70, 100–105 (2021). https://www.ncbi.nlm.nih.gov/pmc/articles/PMC7821766/
156. Kohmer, N. et al. The Comparative Clinical Performance of Four SARS-CoV-2 Rapid Antigen Tests and Their
Correlation to Infectivity In Vitro. J. Clin. Med. Res. 10, (2021). https://www.mdpi.com/2077-
0383/10/2/328/htm
157. Dinnes, J. et al. Rapid, point‐of‐care antigen and molecular‐based tests for diagnosis of SARS‐CoV‐2
infection. Cochrane Database Syst. Rev.(2021)
https://www.cochranelibrary.com/cdsr/doi/10.1002/14651858.CD013705.pub2/full
158. Public Health England. Weekly national Influenza and COVID-19 surveillance report Week 8 report (up to
week 7 data) 25 February 2021.
https://assets.publishing.service.gov.uk/government/uploads/system/uploads/attachment_data/file/964
754/Weekly_Flu_and_COVID-19_report_w8.pdf
159. pfm. Das PCR Testparadoxon – der drastische Rückgang der positiven Tests.
https://tkp.at/2021/01/21/das-pcr-testparadoxon-der-drastische-rueckgang-der-positiven-tests/ (2021).
160. Joint PHE Porton Down & University of Oxford SARS-CoV-2 LFD test development and validation cell.
Preliminary report from the Joint PHE Porton Down & University of Oxford SARS-CoV-2 test development
and validation cell: Rapid evaluation of Lateral Flow Viral Antigen detection devices (LFDs) for mass
community testing: (2020).
https://www.ox.ac.uk/sites/files/oxford/media_wysiwyg/UK%20evaluation_PHE%20Porton%20Down%20
%20University%20of%20Oxford_final.pdf
161. Kara Steel And. Coronavirus (COVID-19) infection survey, UK - office for national statistics.
https://www.ons.gov.uk/peoplepopulationandcommunity/healthandsocialcare/conditionsanddiseases/b
ulletins/coronaviruscovid19infectionsurveypilot/19march2021 (2021).
162. Only 0.06% of school Covid tests positive last week. https://www.tes.com/news/only-006-school-covid-
tests-positive-last-week (2021).
163. Estudio Nacional de Sero-Epidemiología de la Infeccíon por SARS-CoV-2 en España. (2020)
136
https://portalcne.isciii.es/enecovid19/informes/informe_cuarta_ronda.pdf
164. VIRUS OUTBREAK: Mass testing ‘could swamp the system’ - Taipei Times.
https://taipeitimes.com/News/front/archives/2020/08/23/2003742129 (2020).
165. WHO Information Notice for IVD Users.
https://web.archive.org/web/20201220014018/https://www.who.int/news/item/14-12-2020-who-
information-notice-for-ivd-users.
166. Excess mortality in England, week ending 12 February 2021. https://fingertips.phe.org.uk/static-
reports/mortality-surveillance/excess-mortality-in-england-latest.html.
167. Ke, R., Romero-Severson, E., Sanche, S. & Hengartner, N. Estimating the reproductive number R0 of SARS-
CoV-2 in the United States and eight European countries and implications for vaccination. J. Theor. Biol.
517, 110621 (2021). https://www.sciencedirect.com/science/article/pii/S0022519321000436
168. Scientific Advisory Group for Emergencies. Contribution of nosocomial infections to the first wave.
https://assets.publishing.service.gov.uk/government/uploads/system/uploads/attachment_data/file/961
210/S1056_Contribution_of_nosocomial_infections_to_the_first_wave.pdf
169. Zhou, Q. et al. Nosocomial infections among patients with COVID-19, SARS and MERS: a rapid review and
meta-analysis. Ann Transl Med 8, 629 (2020).
https://www.ncbi.nlm.nih.gov/pmc/articles/PMC7290630/pdf/atm-08-10-629.pdf
170. Visualising Local Authority COVID-19 deaths/cases data.
https://victimofmaths.shinyapps.io/COVID_LA_Plots/.
171. Rose, D. The average age of death from coronavirus is 82.4 years writes DAVID ROSE. Daily mail (2020).
https://www.dailymail.co.uk/debate/article-8821113/The-average-age-death-coronavirus-82-4-years-
writes-DAVID-ROSE.html
172. Wei, W. E. et al. Presymptomatic Transmission of SARS-CoV-2 - Singapore, January 23-March 16, 2020.
MMWR Morb. Mortal. Wkly. Rep. 69, 411–415 (2020).
https://www.cdc.gov/mmwr/volumes/69/wr/mm6914e1.htm
173. Update on the New Coronavirus Outbreak First Identified in Wuhan, China | January 28, 2020.
https://www.youtube.com/watch?v=w6koHkBCoNQ.
174. Jean Maguire van Seventer, N. S. H. Principles of Infectious Diseases: Transmission, Diagnosis, Prevention,
and Control. International Encyclopedia of Public Health 22 (2017).
137
https://www.ncbi.nlm.nih.gov/pmc/articles/PMC7150340/
175. Zhou, X., Li, Y., Li, T. & Zhang, W. Follow-up of asymptomatic patients with SARS-CoV-2 infection. Clin.
Microbiol. Infect. 26, 957–959 (2020). https://www.clinicalmicrobiologyandinfection.com/article/S1198-
743X(20)30169-5/fulltext
176. Petersen, I. & Phillips, A. Three Quarters of People with SARS-CoV-2 Infection are Asymptomatic: Analysis
of English Household Survey Data. Clin. Epidemiol. 12, 1039–1043 (2020).
https://www.dovepress.com/three-quarters-of-people-with-sars-cov-2-infection-are-asymptomatic-an-
peer-reviewed-article-CLEP
177. Covid: The woeful case for asymptomatic transmission. https://www.conservativewoman.co.uk/covid-
the-woeful-case-for-asymptomatic-transmission/ (2020).
178. Luo, L. et al. Modes of contact and risk of transmission in COVID-19 among close contacts. bioRxiv.
https://www.medrxiv.org/content/10.1101/2020.03.24.20042606v1
179. Zhang, W. et al. Secondary Transmission of Coronavirus Disease from Presymptomatic Persons, China.
Emerg. Infect. Dis. 26, 1924–1926 (2020). https://wwwnc.cdc.gov/eid/article/26/8/20-1142_article
180. Lavezzo, E. et al. Suppression of a SARS-CoV-2 outbreak in the Italian municipality of Vo’. Nature 584,
425–429 (2020). https://www.nature.com/articles/s41586-020-2488-1
181. Chaw, L. et al. Analysis of SARS-CoV-2 Transmission in Different Settings, Brunei. Emerg. Infect. Dis. 26,
2598–2606 (2020). https://wwwnc.cdc.gov/eid/article/26/11/20-2263_article
182. Wong, J., Jamaludin, S. A., Alikhan, M. F. & Chaw, L. Asymptomatic transmission of SARS-CoV-2 and
implications for mass gatherings. Influenza and other respiratory viruses vol. 14 596–598 (2020).
https://www.ncbi.nlm.nih.gov/pmc/articles/PMC7300701/pdf/IRV-14-596.pdf
183. Silver, A. & Cyranoski, D. China is tightening its grip on coronavirus research. Nature 580, 439–440 (2020).
https://www.nature.com/articles/d41586-020-01108-y
184. Yanes-Lane, M. et al. Proportion of asymptomatic infection among COVID-19 positive persons and their
transmission potential: A systematic review and meta-analysis. PLoS One 15, e0241536 (2020).
https://www.nature.com/articles/d41586-020-01108-y
185. Buitrago-Garcia, D. et al. Occurrence and transmission potential of asymptomatic and presymptomatic
SARS-CoV-2 infections: A living systematic review and meta-analysis. PLoS Med. 17, e1003346 (2020).
https://pubmed.ncbi.nlm.nih.gov/32960881/
138
186. Koh, W. C. et al. What do we know about SARS-CoV-2 transmission? A systematic review and meta-
analysis of the secondary attack rate and associated risk factors. PLoS One 15, e0240205 (2020).
https://pubmed.ncbi.nlm.nih.gov/33031427/
187. Byambasuren, O. et al. Estimating the Extent of True Asymptomatic COVID-19 and Its Potential for
Community Transmission: Systematic Review and Meta-Analysis. (2020) doi:10.2139/ssrn.3586675.
https://papers.ssrn.com/sol3/papers.cfm?abstract_id=3586675
188. Cao, S. et al. Post-lockdown SARS-CoV-2 nucleic acid screening in nearly ten million residents of Wuhan,
China. Nat. Commun. 11, 5917 (2020). https://www.nature.com/articles/s41467-020-19802-w
189. WHO Says Covid-19 Asymptomatic Transmission Is ‘Very Rare’.
https://www.youtube.com/watch?v=NQTBlbx1Xjs.
190. Legal decision: Portuguese court rules PCR test as unreliable. http://cognitive-liberty.online/portuguese-
court-rules-pcr-test-as-unreliable/ (2020).
191. Only 0.06% of school Covid tests positive last week. https://www.tes.com/news/only-006-school-covid-
tests-positive-last-week (2021).
192. Turner, C. et al. ‘Vast majority’ of positive Covid tests taken in schools likely to be false. The Daily
Telegraph (2021). https://www.telegraph.co.uk/education/2021/03/30/vast-majority-positive-covid-
tests-taken-schools-likely-false/
193. National flu and COVID-19 surveillance reports. https://www.gov.uk/government/statistics/national-flu-
and-covid-19-surveillance-reports.
194. King, A. An uncommon cold. New Sci. 246, 32–35 (2020).
https://www.ncbi.nlm.nih.gov/pmc/articles/PMC7252012/
195. Van Regenmortel, M. H. V. Virus species and virus identification: past and current controversies. Infect.
Genet. Evol. 7, 133–144 (2007).
https://www.sciencedirect.com/science/article/abs/pii/S1567134806000591
196. Expert reaction to the new variant of SARS-CoV-2. https://www.sciencemediacentre.org/expert-reaction-
to-the-new-variant-of-sars-cov-2/.
197. Korber, B. et al. Tracking Changes in SARS-CoV-2 Spike: Evidence that D614G Increases Infectivity of the
COVID-19 Virus. Cell 182, 812–827.e19 (2020). https://www.sciencemediacentre.org/expert-reaction-to-
the-new-variant-of-sars-cov-2/
139
198. Edenborough, K. M., Gilbertson, B. P. & Brown, L. E. A mouse model for the study of contact-dependent
transmission of influenza A virus and the factors that govern transmissibility. J. Virol. 86, 12544–12551
(2012). https://www.ncbi.nlm.nih.gov/pmc/articles/PMC3497676/
199. Song, Y. et al. Repeated Low-Dose Influenza Virus Infection Causes Severe Disease in Mice: a Model for
Vaccine Evaluation. J. Virol. 89, 7841–7851 (2015). https://jvi.asm.org/content/89/15/7841
200. Smith, A. P., Moquin, D. J., Bernhauerova, V. & Smith, A. M. Influenza Virus Infection Model With Density
Dependence Supports Biphasic Viral Decay. Front. Microbiol. 9, 1554 (2018).
https://www.ncbi.nlm.nih.gov/pmc/articles/PMC6048257/
201. Frampton, D. et al. Genomic characteristics and clinical effect of the emergent SARS-CoV-2 B.1.1.7 lineage
in London, UK: a whole-genome sequencing and hospital-based cohort study. Lancet Infect. Dis.
https://www.thelancet.com/journals/laninf/article/PIIS1473-3099(21)00170-5/fulltext
202. UK Government. Investigation of novel SARS-CoV-2 variant Variant of Concern 202012/01. (2020).
https://assets.publishing.service.gov.uk/government/uploads/system/uploads/attachment_data/file/959
361/Technical_Briefing_VOC202012-2_Briefing_2.pdf
203. Davies, N. G. et al. Increased mortality in community-tested cases of SARS-CoV-2 lineage B.1.1.7. Nature
(2021). https://www.nature.com/articles/s41586-021-03426-1
204. Chitguppi, R. SARS-CoV-2 Mutations: Deadlier or Milder? Dental Tribunal Edition India (2020).
205. CoVariants. https://covariants.org/per-country.
206. van Dorp, L. et al. No evidence for increased transmissibility from recurrent mutations in SARS-CoV-2.
Nat. Commun. 11, 5986 (2020). https://www.nature.com/articles/s41467-020-19818-2
207. Mercatelli, D. & Giorgi, F. M. Geographic and Genomic Distribution of SARS-CoV-2 Mutations. Front.
Microbiol. 11, 1800 (2020). https://www.frontiersin.org/articles/10.3389/fmicb.2020.01800/full
208. WHO | SARS-CoV-2 Variants. (2021). https://www.who.int/csr/don/31-december-2020-sars-cov2-
variants/en/
209. Tarke, A. et al. Comprehensive analysis of T cell immunodominance and immunoprevalence of SARS-CoV-
2 epitopes in COVID-19 cases. Cell Rep Med 2, 100204 (2021).
https://www.ncbi.nlm.nih.gov/pmc/articles/PMC7837622/
210. Ask A Scientist Staff. The S gene advantage: TaqPath COVID-19 tests may help early identification of
140
B.1.1.7. https://www.thermofisher.com/blog/ask-a-scientist/the-s-gene-advantage-taqpath-covid-19-
tests-may-help-early-identification-of-b-1-1-7/ (2021).
211. Moran, J. et al. Mutant variations and the danger of lockdowns. https://thecritic.co.uk/mutant-variations-
and-the-danger-of-lockdowns/ (2021).
212. Donnarumma, K. S. A. Coronavirus (COVID-19) infection survey, UK - office for national statistics.
https://www.ons.gov.uk/peoplepopulationandcommunity/healthandsocialcare/conditionsanddiseases/b
ulletins/coronaviruscovid19infectionsurveypilot/8january2021 (2021).
213. Official UK Coronavirus Dashboard. https://coronavirus.data.gov.uk/.
214. CDC. US COVID-19 Cases Caused by Variants. https://www.cdc.gov/coronavirus/2019-
ncov/transmission/variant-cases.html (2021).
215. Expert reaction to the new variant of SARS-CoV-2. https://www.sciencemediacentre.org/expert-reaction-
to-the-new-variant-of-sars-cov-2/.
216. NovaType Kits for Variant Detection. https://eurofinsgenomics.com/en/covid-19/kits/novatype/.
217. Brookes, A. J., Pollock, A. & Dorling, D. Non-congruent SARS-CoV-2 waves in England. bioRxiv (2021)
https://www.medrxiv.org/content/10.1101/2021.01.25.21250440v1
218. Wise, J. Covid-19: Is vaccination roll out reducing cases and deaths in the UK? BMJ 372, n506 (2021).
https://www.bmj.com/content/372/bmj.n506
219. Pfizer, Inc. , on behalf of Pfizer and BioNTech. Emergency Use Authorization (EUA) for an Unapproved
Product Review Memorandum. (2020). https://www.fda.gov/media/144416/download
220. Hunter, P. R. & Brainard, J. Estimating the effectiveness of the Pfizer COVID-19 BNT162b2 vaccine after a
single dose. A reanalysis of a study of ‘real-world’ vaccination outcomes from Israel. bioRxiv (2021).
https://www.medrxiv.org/content/10.1101/2021.02.01.21250957v1.full.pdf
221. Moustsen-Helms, I. R. et al. Vaccine effectiveness after 1st and 2nd dose of the BNT162b2 mRNA Covid-
19 Vaccine in long-term care facility residents and healthcare workers – a Danish cohort study. bioRxiv
(2021). https://www.medrxiv.org/content/10.1101/2021.03.08.21252200v1.full.pdf
222. Lopez Bernal, J. et al. Early effectiveness of COVID-19 vaccination with BNT162b2 mRNA vaccine and
ChAdOx1 adenovirus vector vaccine on symptomatic disease, hospitalisations and mortality in older
adults in England. bioRxiv (2021).
141
https://khub.net/documents/135939561/430986542/Early+effectiveness+of+COVID+vaccines.pdf/ffd716
1c-b255-8e88-c2dc-88979fc2cc1b?t=1614617945615
223. Amit, S. et al. Postvaccination COVID-19 among Healthcare Workers, Israel. Emerg. Infect. Dis. 27, 1220–
1222 (2021). https://pubmed.ncbi.nlm.nih.gov/33522478/
224. Chodick, G. et al. The effectiveness of the first dose of BNT162b2 vaccine in reducing SARS-CoV-2
infection 13-24 days after immunization: real-world evidence. bioRxiv (2021).
https://www.medrxiv.org/content/10.1101/2021.01.27.21250612v1
225. Voysey, M. et al. Safety and efficacy of the ChAdOx1 nCoV-19 vaccine (AZD1222) against SARS-CoV-2: an
interim analysis of four randomised controlled trials in Brazil, South Africa, and the UK. Lancet 397, 99–
111 (2021). https://www.medrxiv.org/content/10.1101/2021.01.27.21250612v1d controlled trials in
Brazil, South Africa, and the UK. Lancet 397, 99–111 (2021)
226. Conor Egan, Stephen Knight, Kenneth Baillie, Ewen Harrison, Annemarie Docherty, Calum Semple.
Hospitalised vaccinated patients during the second wave,. ISARIC4C / CO-CIN (2021).
https://assets.publishing.service.gov.uk/government/uploads/system/uploads/attachment_data/file/973
183/S1143_Hospitalised_vaccinated_patients_during_the_second_wave__2_.pdf
227. Jones, W. Major study finds ‘abundance of patients admitted to hospital with Covid within seven days of
vaccination’ – lockdown sceptics. https://lockdownsceptics.org/2021/05/01/major-study-finds-
abundance-of-patients-admitted-to-hospital-with-covid-within-seven-days-of-vaccination/ (2021).
228. Akst, J. Polio vaccination causes more infections than wild virus. https://www.the-scientist.com/news-
opinion/polio-vaccination-causes-more-infections-than-wild-virus-66778 (2019).
229. Walsh, E. E. et al. Safety and Immunogenicity of Two RNA-Based Covid-19 Vaccine Candidates. N. Engl. J.
Med. 383, 2439–2450 (2020). https://www.nejm.org/doi/full/10.1056/NEJMoa2027906 and
supplementary appendix
https://www.nejm.org/doi/suppl/10.1056/NEJMoa2027906/suppl_file/nejmoa2027906_appendix.pdf
230. Folegatti, P. M. et al. Safety and immunogenicity of the ChAdOx1 nCoV-19 vaccine against SARS-CoV-2: a
preliminary report of a phase 1/2, single-blind, randomised controlled trial. Lancet 396, 467–478 (2020).
https://www.thelancet.com/journals/lancet/article/PIIS0140-6736(20)31604-4/fulltext
231. Furer, V. et al. Herpes zoster following BNT162b2 mRNA Covid-19 vaccination in patients with
142
autoimmune inflammatory rheumatic diseases: a case series. Rheumatology (2021).
https://academic.oup.com/rheumatology/advance-article/doi/10.1093/rheumatology/keab345/6225015
232. Shingles surveillance, trends, deaths. https://www.cdc.gov/shingles/surveillance.html (2021).
233. Couch, R. B., Englund, J. A. & Whimbey, E. Respiratory viral infections in immunocompetent and
immunocompromised persons. Am. J. Med. 102, 2–9; discussion 25–6 (1997).
https://www.amjmed.com/article/S0002-9343(97)00003-X/fulltext
234. Public Health Agency of Canada. COVID-19 vaccination coverage in Canada - Canada.ca. https://health-
infobase.canada.ca/covid-19/vaccination-coverage/ (2021).

© La Fondation DDLP)(F peuple du libertés et droits des défense la pour Titre du rapport :
Auteure du rapport : Klymenko Tanya Dr & pathologist Craig, Clare Dr Tous droits réservés. Tous droits de traduction et d’adaptation réservés; toute production, reproduction ou publication en totalité ou d’un extrait quelconque de ce rapport par quelque procédé que ce soit, et notamment par photocopie ou, sous une forme matérielle ou numérique quelconque sont strictement interdites sans l’autorisation écrite de l’auteur ou de l’éditeur. Il est également interdit d’exécuter, de communiquer ou de présenter l’ouvrage en public sans avoir obtenu au préalable l’approbation de l’auteur ou de l’éditeur.
1re version, Mai 2021, réalisée au Québec
Expert testing VIDCO on Report
Pour [email protected] au écrivez-nous FDDLP, la avec communiquer