Embed Size (px)
Citation preview

WHO/BS/2013.2228
ENGLISH ONLY
EXPERT COMMITTEE ON BIOLOGICAL STANDARDIZATION
Geneva, 21 to 25 October 2013
Collaborative Study to Establish a World Health Organization
International Standard for Hepatitis B e Antigen (HBeAg)
Annette Reissinger, Peter Volkers, Heinrich Scheiblauer, Sigrid Nick
and the Collaborative Study Group*
Paul-Ehrlich-Institut, Paul-Ehrlich-Straße 51-59, D-63225 Langen, Germany
* See Appendix 1
Note:
This document has been prepared for the purpose of inviting comments and suggestions on the
proposals contained therein, which will then be considered by the Expert Committee on
Biological Standardization (ECBS). Comments MUST be received by
4 October 2013 and should be addressed to the World Health Organization, 1211 Geneva 27,
Switzerland, attention: Department of Essential Medicines and Health Products (EMP).
Comments may also be submitted electronically to the Responsible Officer: Dr Ana Padilla at
email: [email protected] with a copy to David Wood at email: [email protected]
© World Health Organization 2013
All rights reserved. Publications of the World Health Organization are available on the WHO web site (www.who.int) or can be
purchased from WHO Press, World Health Organization, 20 Avenue Appia, 1211 Geneva 27, Switzerland (tel: +41 22 791 3264; fax:
+41 22 791 4857; e-mail: [email protected]). Requests for permission to reproduce or translate WHO publications – whether for
sale or for noncommercial distribution – should be addressed to WHO Press through the WHO web site (http://www.who.int/about/
licensing/copyright_form/en/index.html). The designations employed and the presentation of the material in this publication do not
imply the expression of any opinion whatsoever on the part of the World Health Organization concerning the legal status of any
country, territory, city or area or of its authorities, or concerning the delimitation of its frontiers or boundaries. Dotted lines on maps
represent approximate border lines for which there may not yet be full agreement. The mention of specific companies or of certain
manufacturers’ products does not imply that they are endorsed or recommended by the World Health Organization in preference to
others of a similar nature that are not mentioned. Errors and omissions excepted, the names of proprietary products are distinguished by
initial capital letters. All reasonable precautions have been taken by the World Health Organization to verify the information contained
in this publication. However, the published material is being distributed without warranty of any kind, either expressed or implied. The
responsibility for the interpretation and use of the material lies with the reader. In no event shall the World Health Organization be
liable for damages arising from its use. The named authors alone are responsible for the views expressed in this publication.

WHO/BS/2013.2228
Page 2
Index
1 Collaborative Study report
1.1 Summary
1.2 Introduction
1.3 Materials
1.3.1 Sample A1: Candidate HBeAg Material, code 129097/12
1.3.2 Sample A2: PEI HBeAg Standard (HBe-Referenzantigen 82, PEI 82)
1.3.3 Sample A3
1.3.4 Sample A4
1.3.5 Sample AB5
1.4 Design of the collaborative study
1.4.1 Participants
1.4.2 Assay methods
1.4.3 Statistical methods
1.5 Results and Discussion
1.5.1 Data received
1.5.2 Comparison of candidate material A1 (code 129097/12) and sample A2
(PEI 82, 100 U/ml) titers at cut-off
1.5.3 Potency calculations
1.5.4 Correlation of assay analytical sensitivity relative to sample A1 with
recovery of supplemental samples A3, A4 and AB 5
1.5.5 Intra-assay and inter-laboratory variability
1.5.6 Preliminary stability study
1.6 Conclusions and Proposals
1.7 Comments from participants
2. Complementary characterization of the proposed HBeAg standard
2.1. Purpose of the complementary investigation
2.2. Materials and methods
2.2.1. Test kits
2.2.2. Clinical HBV samples
2.3. Results of the complementary study
2.4. Summary and conclusions of the complementary study
3. Acknowledgements
4. References

WHO/BS/2013.2228
Page 3
1. Collaborative Study report
1.1 Summary
A standard for Hepatitis B e antigen (HBeAg) can be used in the standardization and calibration
of quantitative and qualitative diagnostic HBeAg assay kits and for quality control purposes by
manufacturers, control authorities and users. A WHO collaborative study was undertaken to
assess the suitability of a candidate material for HBeAg in diagnostic assays. The candidate
HBeAg International Standard (sample A1, code 129097/12) is a lyophilized preparation of the
current Paul-Ehrlich-Institut (PEI) HBeAg standard (sample A2, HBe-Referenzantigen 82, PEI
82). In the study A1 and A2 were compared and the potency of the candidate International HBeAg
standard was assessed relative to A2. In addition, further HBeAg positive samples from Hepatitis B
virus (HBV) infected carriers were selected and included in the study: (A3) high titer HBeAg
serum sample (high positive for HBsAg), (A4) medium titer HBeAg serum sample (high positive
for HBsAg), and (AB5) low titer HBeAg serum sample (high positive for HBsAg and positive
for anti-HBe).
Nineteen laboratories from 12 countries tested the materials using 14 different HBeAg assays.
The dilution range of the candidate material A1 was selected to cover the dynamic measuring
ranges of the assays. The endpoint titers equivalent to the assays’ cut-offs ranged from 312 to
3160. Since the PEI HBe-Referenzantigen 82 (sample A2, 100 PEI U/ml) is well-characterized
and has been used by many manufacturers for the standardization of HBeAg assays since 1982,
it was used as the source material for the candidate A1 and the potency of the candidate A1 was
expressed relative to the PEI HBe-Referenzantigen 82. The overall potency of the candidate A1
was 95.1 U/ml. Thus, the difference from the source material is approximately 5 U/ml. This
difference lies within the normal intra-assay variation of HBeAg tests and is therefore considered
negligible.
The HBeAg high, medium and low titer samples A3, A4 and AB5, were included in the study to
evaluate commutability of the candidate standard A1. Samples A3 and A4 were detected as
positive by almost all assays, but S/CO ratios differed substantially according to the diverse
measuring ranges of the HBeAg assays. The low positive sample AB5 was detected positive by
nine HBeAg assays, but was missed by five assays. Those kits that failed to detect samples A4
and AB5 as positive or were low positive only had the lowest endpoint titers of the candidate
material A1 and thus the lowest analytical sensitivity. This correlation between sample recovery
and analytical sensitivity of the assays was statistically significant. Samples A1 and A2 had
comparable intra-assay and inter-laboratory variation and it can therefore be assumed that the
material is homogenous.
The accelerated stability study on sample A1 revealed a stable HBeAg recovery at stress
temperatures up to 45°C for one week which may predict long term stability. The long term
stability study at the recommended storage temperature is ongoing.
In summary, the candidate HBeAg material (code 129097/12) is proposed to be established as 1st
International Standard for HBeAg with an assigned potency of 100 IU/ml. The standard is intended
for use in the standardization and calibration of HBeAg assays or for assessment of the analytical
sensitivity of HBeAg assays.
WHO/BS/2013.2228
Page 4
1.2 Introduction
Hepatitis B virus (HBV), a small packaged partially double-stranded DNA virus, represents an
enormous global health care burden. Despite an effective vaccine, HBV is endemic in many
countries and affects two billion people worldwide [1, 2]. The spectrum of HBV disease varies
greatly from asymptomatic infection to clinically manifest liver disease and even fulminant
hepatitis. In general, infection resolves in 90% of immunocompetent individuals while especially
children and immunocompromised persons may develop chronic disease. The chain of HBV
transmission is maintained partly by chronically infected HBV carriers with 350 million people
infected worldwide [1, 3, 4].
The diagnosis of acute Hepatitis B virus (HBV) infection comprises the detection of HBsAg and
anti-HBc and if positive, further markers such as anti-HBc IgM, HBeAg and anti-HBe are
determined. Chronic Hepatitis B is diagnosed using a combination of biochemical, histological
and virological markers including the determination of HBV DNA. Amongst these,
determination of the presence of HBeAg is crucial for deciding whether and when to start and
when to stop antiviral therapy. Recently new diagnostic tests emerged for the quantification of
HBeAg for the assessment of the efficacy of antiviral therapy. Treatment with antiviral
medication is continued until HBeAg seroconversion (and loss of HBeAg reactivity) has been
achieved. This is commonly considered to be favorable for therapeutic success. HBeAg is
associated with HBV replication, indicating high infectivity. HBeAg appears shortly after
HBsAg and is detectable for a few days to several weeks. In chronic HBV infections, elevated
levels of HBeAg may be detected for years. In some patients HBeAg cannot be detected
although the virus replicates persistently. Here, HBeAg seroconversion might evolve into the
selection of precore mutants in some patients and therefore has to be tightly monitored [5, 6].
So far, an International HBeAg standard is not available and many diagnostic test manufacturers
globally as well as authorities have been using the PEI HBeAg standard which was developed in
1982 (HBe-Referenzantigen 82, PEI 82). Thus, the sensitivity of many HBeAg assays is
expressed as PEI Units/ml, a unitage that is traceable to the PEI HBeAg standard. This material
has also been used for the control of the analytical sensitivity of HBeAg assays, for the
calibration of sub-standards to be used in manufacturers' quality control for final product release
testing and for official batch release testing of HBeAg assays by national authorities. Apart from
that, the standard was used to compare and standardize assays (7, 8, 12) and to develop protocols
for the quantitative determination of HBeAg in qualitative assays (9-14).
At the meeting of the Expert Committee for Biological Standardization (ECBS) at the World
Health Organization (WHO) in October 2011, a project proposed by the PEI was endorsed to
establish a WHO International HBeAg Standard. The proposed standard would be formulated
with the same source material used to produce the current PEI HBeAg standard and lyophilized
to ensure its long-term stability. In addition, it was proposed to include further HBeAg positive
materials from HBV infected individuals in the study in order to see whether the results from the
candidate material are commutable with the results from other clinical samples.
The aims of the collaborative study therefore were to (i) establish the 1st International Standard
for HBeAg, (ii) to define its potency in international units (IU) and (iii) to demonstrate similar
performance to other HBeAg positive high, medium and low titer samples.
An international conventional reference measurement procedure for HBeAg currently does not
exist and this measurand is not traceable to International System of Units (SI) of quantity.

WHO/BS/2013.2228
Page 5
1.3 Materials
1.3.1 Sample A1: Candidate HBeAg Material, code 129097/12
The candidate HBeAg material is a freeze-dried preparation of the PEI HBeAg standard material
(HBe-Referenzantigen 82). The material is HBeAg positive serum that was collected in the early
1980s and stored liquid at -70°C. Aliquots of the material were thawed on ice and then pooled to
give a final volume of 1.05 liter. No stabilizers or preservatives were added. Five hundred
microliter aliquots were filled into neutral amber glass ampoules and freeze-dried at Greiner
Diagnostic AG, Switzerland. A total number of 2003 ampoules were obtained. The freeze-dried
material was characterized as follows: high positive for HBsAg, anti-HBc IgG and HBV DNA
(20.000 IU/ml by Cobas TaqMan). The material tested negative for anti-HBs, anti-HBc IgM and
anti-HBe. It was found positive for antibodies to HCV. HCV RNA was tested weak positive (<
30 IU/ml using ABBOTT RealTime HCV assay). HCV core antigen, anti-HIV-1/2 and anti-
HDV were negative. The residual moisture content was 1.3% and the fill coefficient of variation
(CV) 0.9% (wet fill weight). Participants of the collaborative study had been requested to
reconstitute this material in 0.5 ml distilled water.
1.3.2 Sample A2: PEI HBeAg Standard (HBe-Referenzantigen 82, PEI 82)
This serum was collected by PEI in 1982 and was stored liquid at -70°C in glass ampoules in 0.5
ml aliquots. Each ampoule has an assigned unitage of 100 PEI U/ ml (expressed as 100U/ml for
the purpose of this study). The material is high positive for HBV DNA, HBsAg and anti-HBc.
HCV RNA and anti-HCV were tested positive. The material tested negative for markers anti-
HBs, anti-HBc IgM, anti-HBe, HCV core antigen, anti-HIV-1/2 and anti-HDV.
1.3.3 Sample A3:
This material was purchased from Trina Bioreactives (Nänikon, Switzerland) and is HBeAg
positive human plasma obtained from a 45 year-old female Asian donor (draw date 01.02.2009).
Since the material was high positive for HBeAg, it was diluted 1:250 (vol/vol) in anti-HBe free
normal human serum to bring the concentration of HBeAg down to within the linear range of
most assays. The serological profile of the diluted material is high positive for HBeAg and
HBsAg and negative for anti-HBe, anti-HIV 1/2 and anti-HCV. The material is liquid and stored
frozen at -70°C without preservative. Corrigendum: In contrast to the study plan sent out to the
participants, the material does not contain anti-HBe.
1.3.4 Sample A4:
This material was purchased from Trina Bioreactives (Nänikon, Switzerland) and is HBeAg
positive human plasma from a 45 year-old Asian female donor (draw date 13.08.2009, donor not
identical to sample A3). Since the material was high positive for HBeAg, it was diluted 1:1000
(vol/vol) in anti-HBe free normal human serum to bring down the concentration of HBeAg to the
linear range of the assays. The serological profile of the diluted material is HBeAg positive and
HBsAg high positive. The sample is negative for anti-HBe, anti-HIV 1/2 and anti-HCV. The
material is liquid and stored frozen at -70°C without preservative.
1.3.5 Sample AB5:
This material was purchased from Trina Bioreactives (Nänikon, Switzerland) and consists of
undiluted HBeAg positive human serum from a 38 year-old African male donor. The serological
profile of AB5 is low positive for HBeAg, high positive for HBsAg and high positive for anti-

WHO/BS/2013.2228
Page 6
HBe. The sample is negative for anti-HIV 1/2 and anti-HCV. Corrigendum: In contrast to the
study plan sent out to the participants, the material did not consist of plasma.
1.4 Design of the collaborative study
Participants received the samples and an accompanying study plan. They were asked to report
the specifics of the assays performed, and to submit the raw data along with the corresponding
cut-off value and the results for the dilution matrix. The study plan included the following:
− From each of the samples A1 and A2 seven 2-fold dilutions should be prepared and tested in the
range as shown in the result's sheets, i.e. A1 and A2 from 1:50 to 1:6400, which were the
dilution ranges found adequate by a former feasibility study. Samples A1 and A2 were
requested to be tested in each HBeAg assay in triplicate independently on 3 three different days
by using a fresh ampoule on each day. The feasibility study showed that one freeze/thaw cycle
using the reconstituted material was possible without loss of HBeAg, so that some laboratories
chose to analyze the dilutions post thaw (laboratory 1 with kit 1, 9 and 11, and laboratory 19
with kit 14).
− The dilution matrix normally in use in the participant's laboratory should be used. Normal
human serum (NHS) negative for anti-HBe was considered appropriate. If NHS was not
available, fetal calf serum could be used. The dilution matrix should be tested in triplicate as a
control.
− Samples A3-AB5 should be tested neat in triplicates on one single day only.
− All samples should be centrifuged for 10-15 minutes at 3000g prior to testing in the case that
particulate matter appears.
1.4.1 Participants
Twenty laboratories were provided with study material and 19 returned data. The participants
were from 12 countries: Canada (1), Brazil (1), China (1), France (2), Germany (3), Japan (2),
Korea (1), Netherlands (1), Russia (2), Thailand (1), UK (2) and USA (2). Participating
laboratories are listed in Appendix 1 and were assigned a laboratory code number (1-14) in
random order.
1.4.2 Assay methods
Fourteen test kits were used in the laboratories of the participants. The assays used are listed in
Table 1 together with the specific characteristics of the assays and with the code 1-14 used for
the statistical analysis. The HBeAg assays that were used were all sandwich test formats with
different conjugate antibodies. The assays 12 and 14 allowed quantitative determination of
HBeAg concentration with assay 14 referring to PEI 82. All other assays gave qualitative
interpretations. The assays were conducted manually or by automation (assay 10 was conducted
on ETI-Max in laboratory 14 whereas it was conducted manually in laboratories 13 and 15).
Assay 5 is a modification of assay 4 run on a different instrument. The participants returned
signal to cut-off (S/CO) values except for laboratories 14, 15 and 16, where optical density (OD)
values were given. Participant 19 also returned quantitative results in addition to the S/CO
values. S/CO values ≥1.0 were considered reactive, whereas values <1.0 were considered
negative. One exception was kit 2 with borderline results ranging from 0.8 S/CO to 1.20 S/CO
that were then considered equivocal.

WHO/BS/2013.2228
Page 7
1.4.3 Statistical methods
Statistical analysis was performed at PEI based on the raw data provided by the participants. The
detection limits with the diluted materials sample A1 (lyophilized candidate material) and sample
A2 (PEI 82) were calculated by linear interpolation at the intercept of the dilutions series (titers)
with the assay's cut-off.
Geometric mean values (GMV) including their 95% confidence intervals (CI) were used to describe
each assay. The geometric coefficient of variation (GCV = sqrt(exp(SD*SD)-1), where SD is the
standard deviation of the ln-transformed data) was used to describe the intra-assay and inter-
laboratory variation. Only values > 0 were considered in the calculations.
In order to estimate the potency of sample A1 relative to sample A2 two approaches were used:
1. For each assay (within the different laboratories) the potency was estimated by the ratio of the
GMV for this assay.
2. The potency was also estimated by means of a parallel line model, PLA [15], using either ln-
transformed response data or a four parametric logistic function. The assumption of parallelism
was shown for 86% of the assays, linearity was shown for 79% of the assays and both
parallelism and linearity was shown for 64% of the assays.
Spearman’s rank correlation coefficient was used to assess the correlation between analytical
sensitivity and HBeAg recovery in samples A3, A4 and AB5 [16].
1.5 Results and Discussion
1.5.1 Data received
All data received were subjected to analysis. The majority of participants followed the study plan
with the following exceptions: laboratory 11 and 12 tested 1 replicate only for each of the 3 days
using assay 9. For laboratory 14, run 1 had to be deleted from the calculation due to deviating
values leading to a lack of intercept with the cut-off. All laboratories used either serum or plasma
as diluent except for laboratories 14 and 16, which used 0.9% NaCl supplemented with 10% fetal
calf serum (FCS) and phosphate buffered saline (PBS) supplemented with 1% bovine serum
albumin (BSA), respectively.
1.5.2 Comparison of candidate material A1 (code 129097/12) and sample A2 (PEI 82, 100
U/ml) titers at cut-off
The GMV of the endpoint titers for each assay were calculated for the two materials are shown
in Table 2. The confidence intervals for the GMV’s are also shown (Table 2). The dilution
ranges for samples A1 and A2 were in the dynamic measuring range for all assays included in
the study. Titers of A1 varied from 312 to 3160 due to differences in analytical sensitivity of the
HBeAg assays. The majority of HBeAg assays detected the analyte at titers between 400 and
800. Those laboratories investigating the same assay gave very comparable titers except for kit
10 with an outlier value in laboratory 14. This might be explained by the different testing
procedures used (manual vs. automated) and/or different diluents used (serum/plasma vs.
NaCl+FCS). Highest titers were reached by kits 1, 4 and 6. When the titers at cut-off of sample
A1 were plotted against titers of sample A2, comparable dose responses were obtained (Figure
1), i.e. the data points closely lined up along the angle bisector which represents the 100%
identity line. This indicates that lyophilization resulted in no or only little loss of HBeAg of the
candidate material A1 in comparison to PEI 82 (A2).

WHO/BS/2013.2228
Page 8
1.5.3 Potency calculations
All potency calculations of the candidate material A1 were performed relative to sample A2 (PEI
82) since this was the only material available as a reference for potency determinations. The
potency calculation for the candidate material A1 was performed by calculating the ratios of the
geometric mean values (GMV) of the different test runs of sample A1 (candidate material code
129097/12) to the GMV of sample A2 multiplied by 100 (Tables 3a and 3b). Most assays
grouped around the 100 U/ml value with minimum and maximum values of 70.0 for kit 3 and
129.6 for kit 6. Calculating the ratio for all assays by GMV, the overall potency of the candidate
129097/12 was 95.1 U/ml (95%-CI: 90.7 – 99.8). When calculating the potency of the candidate
material A1 for all assays by parallel line assay (PLA), the overall potency was 95.8 U/ml (95%-
CI: 91.9 – 99.8) again with minimum values for kit 3 (85.0) and maximum values for kit 6
(130.3) indicating very similar results for both calculation methods (Table 3a). Nevertheless, the
results from the confidence intervals indicated that the recovery of sample A1 was significantly
lower compared to the reference 100 U/ml in sample A2. The potencies were also presented in a
histogram (Figure 2). Each box represents the laboratory potency for a certain assay with the
boxes individually labeled by laboratory and kit code number. The graph shows a Gaussian
curve-like distribution of all assays around the 100 U/ml value of sample A2 with most assays
located in the 90-100 U/ml sector. The potency comparison in Figure 3 shows that all assays
group along the angle bisector, reflecting a near 100% recovery of the candidate material A1
relative to A2. Minimum and maximum potencies were represented by laboratory 4 with kit 3
and laboratory 6 with kit 6. One out of these outliers was due to lower GMV ratios because of
low single run values in the respective assays (kit 3, run 3; see Table 3b).
1.5.4 Correlation of assay analytical sensitivity relative to sample A1 with recovery of
supplemental samples A3, A4 and AB 5
In this approach, additional HBeAg high, medium and low titer samples were included in the
collaborative study to investigate whether the candidate material A1 performed similar to further
HBeAg positive samples. At first, a qualitative analysis was performed by calculating S/CO ratios
due to the qualitative design of most HBeAg assays of the study. Kits were ranked according to
their analytical sensitivity relative to A1 presented as units in a top-down manner (Table 4) starting
with the most sensitive assay. The high positive sample A3 was detected positive by all assays and
the medium positive sample A4 was detected positive by most assays (12 out of 14). One assay (kit
11) which was performed by 2 laboratories yielded borderline results with one result just above and
one result just below cut-off. One test was negative. The low positive sample AB5 was detected
positive by nine assays, but was missed by five assays. In general, the tests with the borderline and
the negative results on samples A4 and AB5 had the lowest endpoint titers of the candidate material
A1 and clearly showed lowest analytical sensitivity relative to A1. Statistical analysis of the
correlation of S/CO values in the samples A3, A4 and AB5 to analytical sensitivity of the assays
revealed p-values p = 0.0167, p = 0.0014 and p = 0.0407, respectively, and were therefore
significant. Interestingly, kit 9 and kit 12 did not appear to follow the overall close correlation of
dose response and analytical sensitivity.
Since S/CO signal levels of the samples in the different assays differed substantially, the relative
potencies of test samples were determined using the serial dilutions of A1 as a standard curve
assuming a potency of 100 U/mL (Table 4, dark shaded areas). Determination of potencies of the
samples relative to A1 yielded comparable values each for samples A3 and A4 in all assays. Values
for sample A3 ranged from 0.92 U/ml to 1.99 U/ml and for sample A4 from 0.20 U/ml to 0.60
U/ml. Here it should be mentioned that for some assays the relative potency of sample A3 could not
be determined due to values beyond the standard curves (nine laboratories had results above the
upper limit 2 U/ml, denoted > 2). For those assays that detected sample AB5 as positive relative

WHO/BS/2013.2228
Page 9
potencies ranged from 0.11 U/ml to 0.88 U/ml and therefore showed higher variation. This effect
might be due to the low positive nature of the sample and/or the presence of both HBeAg and anti-
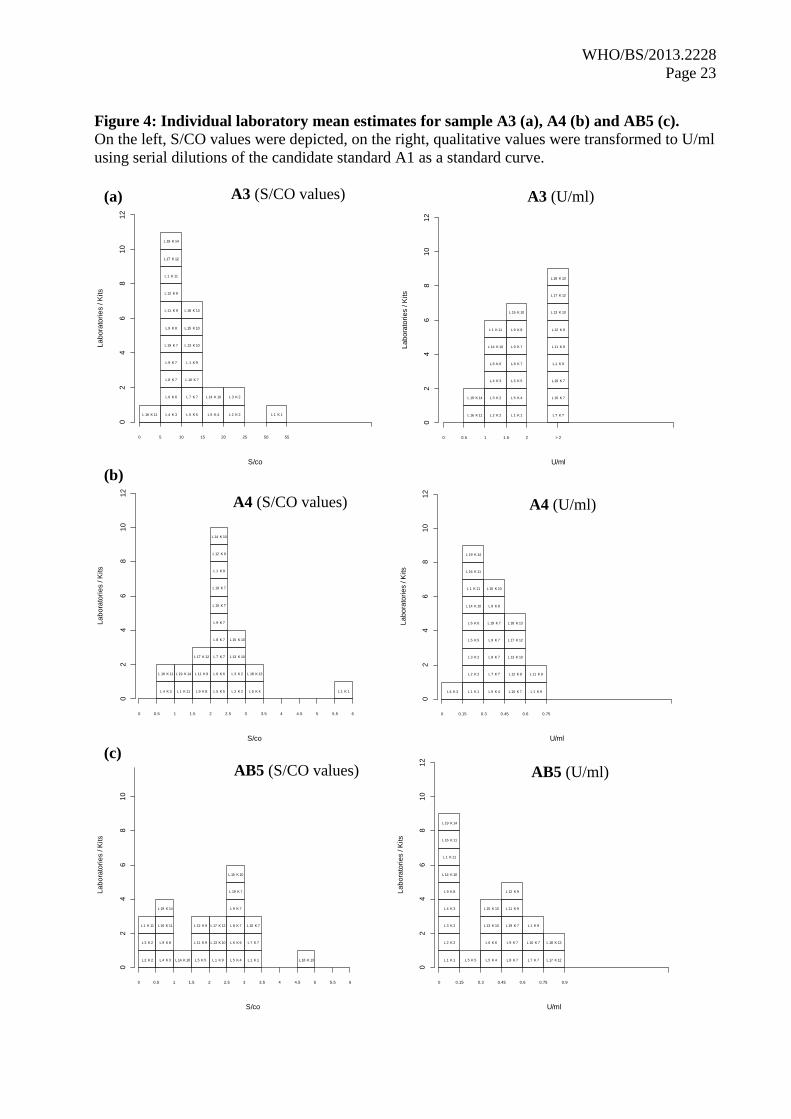
HBe which could lead to complex formation. The potencies of the samples A3, A4 and AB5 were
also presented in a histogram (Figure 4, right). Each box represents the laboratory potency of the
samples relative to A1 with the boxes individually labeled by laboratory and kit code number. These
potency distributions were then compared to the distributions of S/CO values (Figure 4, left). For
all three samples, it could be shown that edge-values grouped closer to the majority of values when
transformed to U/ml (e.g. laboratory L1K1 in sample A3 and A4 and laboratory L18K13 in sample
AB5). For sample A3, nine laboratories that gave values > 2 U/ml could not be grouped and were
therefore shown as one column designated “> 2”, although it is worth noticing that 4 out of these 9
laboratories might display values just beyond 2 U/ml (laboratory L13K10, laboratory L7K7, L10K7
and L19K7, see Table 4). For sample AB5, seven laboratories gave negative values which grouped
together in one column (see histogram “AB5 [U/ml]”). Also, the laboratory value L14K10 was
grouped here which was due to an outlier value (see also section 4.2.1 for more details).
Next, it was investigated whether the relative potencies of the samples using dilutions of A1 as a
standard curve were comparable to relative potencies using dilutions of A2 as a standard curve
(Figure 5). Overall, the samples lined up very closely to the angle bisector (dotted line) in all
assays, indicating no significant difference in the standard curves of A1 relative to the standard
curve of A2. One deviation could be observed in kit 10 which was due to low values for A3 in
laboratory 14 (not shown).
Generally, the results on the additional samples provide some indication that the candidate standard
material A1 behaves similar to further HBeAg positive clinical samples. Ranking of the sample
signals according to the standard potency gave similar results. Since the data on the additional
samples was somewhat limited, further studies were initiated to show comparability of the results of
the candidate HBeAg standard A1 to results from representative patient samples. A range of five
HBeAg tests representative of current serological methods and technologies using HBV
seroconversion and longitudinal panels which include a HBeAg positive phase. These panels are
well-characterized and include negative as well as low and high titer clinical samples. By this the
analytical sensitivity can be correlated to the diagnostic sensitivity in terms of first HBeAg detection
and signal height. The study outcome is summarized and included in Part 2 of the report.
1.5.5 Intra-assay and inter-laboratory variability
Intra-assay and inter-laboratory variation (% GCV) with samples A1 and A2 are shown in Table
5. Sample A1 intra-assay variability at the assay's cut-off was mostly < 16% GCV. Kit 8 gave a
higher CV of 31%, which could be traced back to a run outlier (run 1 was very low). Sample A2
intra-assay variability gave similar results with CV values below 16%. Three laboratories,
however, had higher values with 23% and 22% CV in kit 10 and kit 8, respectively. Inter-
laboratory (between labs using the same assay) variability was investigated for kits 2, 7, 9, 10
and 11. These kits used automated procedures except for kit 10, which was performed both
automated (laboratory 14) and manually (laboratories 13 and 15). Values for A1 were 5.1 for kit
2, 10.5 for kit 7, 15.5 for kit 9 and 21.3 for kit 11. For kit 10, inter-laboratory variability was
67.9%. The values were in general in an acceptable range. One exception was kit 10, where the
values from laboratory 14 were unexpectedly high. These high values were found for both A1
and A2 and might be explained by the different procedures used by the 3 laboratories (manual
vs. automated kit performance) and/or the different diluents used (serum/plasma vs. NaCl+FCS).
Overall, it appeared that samples A1 and A2 had comparable intra-assay and inter-laboratory
GCV values and it can therefore be assumed that the candidate material is still homogenous after
the lyophilization step.

WHO/BS/2013.2228
Page 10
1.5.6 Preliminary stability study
Ampoules of sample A1 were incubated at PEI from 03/11/2013 to 03/18/2013 each at 4°C,
25°C, 37°C and 45°C. At the end of the respective temperature treatment, each ampoule was
reconstituted immediately and then frozen at -20°C until analysis. The serial dilutions were
tested using kit 7 in 2 replicates for each run. As a baseline, the activity of freshly reconstituted
sample was used. This sample had been continuously stored at -20°C (recommended storage
temperature). The titers at cut-off are presented in Table 6. There was no loss of HBeAg for the
ampoules observed at any of the temperatures and days investigated so far suggesting that the
material might be stable under long-term storage at the recommended temperature (-20°C).
Further stability studies are ongoing.
1.6 Conclusions and Proposals
In the collaborative study sample A1, the HBeAg candidate International Standard (code
129097/12), was assessed relative to sample A2 (HBe-Referenzantigen 82, PEI 82) which has
already been used for assay standardization by manufacturers and has an assigned unitage of 100
PEI units per ml. In addition, PEI 82 was the source material for A1 and served already as a
calibrator for kit 14. The overall potency of the candidate material A1 relative to PEI 82 was
95.1 U/ml as determined by the geometric mean value of all results obtained or 95.8 U/ml when
calculated by parallel line assay. Overall, the deviation of the potency of A1 from that of A2 is
lower than the inter-assay variability of HBeAg tests and within the usual intra-assay variability
of single HBeAg test kits. It is noted that A1 will be the 1st International HBeAg Standard and
not a replacement of a previous standard, hence it is reasonable to assign a unitage of 100 IU/ml
to sample A1.
Intra-assay and inter-laboratory variation for the candidate material A1 showed homogeneity of
the material and thus did not indicate inappropriate sample conditions after lyophilization. The
dilution capacity of the candidate material A1 is high enough to cover the dynamic measuring
ranges of the HBeAg assays of the study indicating that it could serve as a calibrator also for
other HBeAg assays. Suitable stability of the material has been demonstrated in a preliminary
study applying heat stress conditions. The candidate International HBeAg Standard A1 will be
very useful for the standardization of qualitative and quantitative HBeAg tests that gain increasing
importance in HBV therapy and disease monitoring as new therapy options arise, for the
determination of the analytical sensitivity of HBeAg tests and for the calibration of secondary
standards to be used for quality control purposes, e.g. in batch release testing.
To address how the candidate HBeAg standard A1 and clinical HBeAg positive samples compare in
different HBeAg tests, additional samples were included in the study. If values of samples A3, A4
and AB5 were above cut-off and fell in the dilution range of A1 selected for the study, the results
showed that the performance was in general similar to that of sample A1. Therefore, there is
already some indication that the proposed International HBeAg Standard may be commutable.
This assumption is supported by scientific studies relating to sample A2 (PEI 82) which was the
source material (9 to 14).
In summary, sample A1 is proposed to be established as the 1st International Standard for HBeAg
with an assigned unitage of 100 International Units per milliliter. The proposed unitage does not
carry an uncertainty associated with its calibration. The only uncertainty is therefore derived from
the variability of the wet fill weight of the ampoule content which had a coefficient of variation of
0.9%.

WHO/BS/2013.2228
Page 11
1.7 Comments from participants
All participants responded to the request for comments on the report. All comments from the
participants were addressed and, where necessary, respective corrections were made to the
report. Overall, the commutability of the proposed 1st International HBeAg standard was
discussed in depth and therefore, it was decided to add supporting data to the report. This data
would be created by the investigation of follow-up clinical samples from acute and recovered
HBV infection by HBeAg tests in comparison to sample A1. These clinical samples would
include negative as well as low, medium and high titer HBeAg positive specimens and thus are
considered representative of typical clinical samples. Selected HBeAg tests comprise commonly
used current serological methods.

WHO/BS/2013.2228
Page 12
2. Complementary characterization of the proposed HBeAg
standard
2.1. Purpose of the complementary investigation
The outcome of the Collaborative Study and the results of the three additional HBeAg positive
clinical samples suggested that the candidate 1st HBeAg International standard (IS) is
commutable. However, the quantity of data is limited. Therefore, it was decided to further
address commutability of the candidate 1st International HBeAg standard in an additional study
performed at the Paul-Ehrlich-Institut. Currently there is no golden standard method for the
assessment of commutability and approaches taken depend on the nature of the measurand,
availability and features of testing methods and also on the expected use of a reference material
(17, 18). One potential use of the candidate 1st HBeAg IS will be determination of the analytical
sensitivity of HBeAg tests. The approach chosen for this study was therefore to determine the
analytical sensitivities of different HBeAg tests by measuring serial dilutions of the candidate 1st
International HBeAg standard. Analytical sensitivity is defined as the concentration of HBeAg
(in U/ml) that correlates to the cut-off of a HBeAg test. In addition, clinical samples from
different stages of HBV disease were selected and measured in parallel to the dilutions of the
candidate standard to determine clinical sensitivity of the HBeAg tests. Hence the assumption is
that if the analytical and the clinical sensitivity (ability to detect HBeAg in samples from HBV
infection) of the HBeAg tests correlate well, the HBeAg standard is commutable.
2.2. Materials and methods
2.2.1. Test kits
Five HBeAg tests were selected for this additional investigation. Selected HBeAg tests
represented widely used current serological methods. The tests exhibited a qualitative assay
format and different technologies comprising ELISA, microparticle enzyme immunoassays,
chemiluminescence immunoassays and electro-chemiluminescence immunoassays (Table 7).
Test features are described in Table 1 of the Collaborative Study report. A further reason for the
choice of the HBeAg tests was that these tests are routinely used in our laboratory and the
laboratory staff was well-trained and familiar with assay performance.
2.2.2. Clinical HBV samples
Nine commercial HBV seroconversion (SC) and longitudinal (LT) panels were obtained from
either Biomex GmbH (Siemensstraße 38, 69123 Heidelberg Germany) or from ZeptoMetrix
Corporation (872 Main Street Buffalo, NY 14202, USA). SC and LT panels comprise sequential
plasma samples from one individual drawn during a certain time frame. Samples were collected
at acute symptomatic and at asymptomatic or resolved HBV infection and the panels are well-
characterized for further markers of HBV infection (Table 8). The panels enclosed specimens
containing different amounts of HBeAg and are considered representative of typical clinical
samples. The HBV LT panels include 12 sequential panel members each, out of which only
those members were tested comparatively in the five HBeAg assays that most likely represented
the HBeAg positive samples. The selection of the samples for testing was based on the
information provided by the panel vendor and the results of a pre-screening of all samples of the
9 panels using the ADVIA Centaur HBeAg test. The members of the three HBV SC panels
varied from 3 to 20 samples. Again suitable HBeAg containing samples were selected taking into
account the vendor´s data sheets and the ADVIA HBeAg test results. In total, 51 clinical samples
could be investigated comparatively by all five tests.

WHO/BS/2013.2228
Page 13
2.3. Results of the complementary study
Analytical sensitivity was determined using serial dilutions of the candidate WHO 1st
International HBeAg standard (sample A1). To avoid an influence from the choice of the dilution
matrix as far as possible, serial dilutions were prepared in normal human plasma which was the
specimen type of the clinical samples. Mean analytical sensitivities (detection of antigen at
limiting dilutions) of the HBeAg tests were between 0.059 U/ml for the test with the highest
analytical sensitivity (Kit 1) and 0.855 U/ml for the test with the lowest sensitivity (Kit 11). Kit 7
detected 0.376 U/ml as positive, Kit 8 0.412 U/ml and Kit 9 0.553 U/ml. Results are shown in
detail in Table 9 and Figure 6.
When using the clinical samples, Kit 1 showed highest sensitivity and detected 41 samples as
HBeAg positive and 9 samples as HBeAg negative. One sample (SCP-HBV-001 RP-009-01) did
not yield a result. This sample could not be retested due to insufficient volume left. The
outcomes for the four further HBeAg kits were 32 HBeAg positive results and 10 negative
results for Kit 7, 28 HBeAg positive and 21 negative results for Kit 8, 27 HBeAg positive results
and 24 negative results for Kit 9 and 23 HBeAg positive results and 28 negative results for Kit
11. Sample SCP-HBV-001 RP-009-01 was reactive by Kit 8, but excluded from the calculation,
since the result was neither obtained with any other HBeAg test nor was the result “confirmed”
by a positive result of the direct sequential sample or by the vendor´s data. Moreover, the sample
was exhausted and could not be retested. Results of the investigation are found in detail below
(Table 10, Figure 6).
2.4. Summary and conclusions of the complementary study
In the complementary study, analytical sensitivities of five HBeAg tests determined using the
proposed 1st International HBeAg standard were compared to clinical sensitivities of the same
tests determined by investigating samples from different stages of HBV infection and containing
different quantities of HBeAg. Kit 1 showed the highest analytical sensitivity and also the
highest sensitivity using the clinical samples. Kit 11 showed the lowest analytical sensitivity and
also the lowest sensitivity when testing the clinical samples. When ranking the test kits according
to their analytical sensitivity or their clinical sensitivity, they clustered exactly at the same
position (Kit 1 > Kit 7 > Kit > Kit 9 > Kit 11). Thus correlation between the determination of
analytical sensitivity using the proposed HBeAg standard and determination of sensitivity using
clinical samples was very high (Figure 7) suggesting that the proposed 1st International HBeAg
standard is suitable for its purpose and may serve as a standard for the variety of different
samples being assayed.
3. Acknowledgements
We are grateful to Dr. Ana Padilla, WHO Programme Manager, Blood Products and related
Biologicals, and to all collaborators participating in the study for valuable comments and suitable
suggestions on the Collaborative Study report.

WHO/BS/2013.2228
Page 14
4. References
1. Lavanchy D (2004). Hepatitis B virus epidemiology, disease burden, treatment, and current
and emerging prevention and control measures. J Viral Hep 2:97-107.
2. Kane MA (2007). Global status of hepatitis B immunization. Lancet 1996; 348:696.
3. Lai CL, Yuen MF. The natural history of chronic hepatitis B. J Viral Hepat 14 Suppl 1:6-
10.
4. Milich D, Liang TJ (2003). Exploring the biological basis of hepatitis B e antigen in
hepatitis B virus infection. Hepatology 38:1075-1086.
5. Nguyen MH, Keeffe EB (2008). Are hepatitis B e antigen (HBeAg)-positive chronic
hepatitis B and HBeAg-negative chronic hepatitis B distinct diseases? Clin Infect Dis
47(10):1312-1324.
6. Morgan M, Keefe EB (2009). Diagnosis and treatment of chronic hepatitis B: 2009 update.
Minerva Gastroenterol Dietol 55(1):5-22.
7. Zhou B, Liu M, Lv G, Zheng H, Wang Y, Sun J, Hou J (2013). Quantification of hepatitis
B surface antigen and E antigen: correlation between Elecsys and Architect assays. J Viral
Hep 20: 422-429.
8. Heijtink RA, Snobl J, Kruining J, Kerkhof-Los C, de Man RA, Janssen HL, Schalm SW
(1995). Quantitative measurement of HBeAg in chronic hepatitis B: a comparison between
a radioimmunoassay, a fluorescence ELISA and a chemiluminescence ELISA. J Med Virol
47 (3):245-250.
9. Wursthorn K, Zacher BJ, Jaroszewicz J, Darnedde M, Manns M, Wedemeyer H (2011).
Development of a protocol for the quantitative determination of HBeAg using Elecsys®
HBeAg immunoassay. J Viral Hep 18: 179-183.
10. Ma H, Yang RF, Wei L (2010). Quantitative serum HBsAg and HBeAg are strong
predictors of sustained HBeAg seroconversion to pegylated interferon alfa-2b in HBeAg
positive patients. J Gastroen Hepatol 25 (9): 1498-1506.
11. Wursthorn K, Jung M, Suh DJ, Manns M, Wedemeyer H, Lopez P (2009). Etablierung und
Validierung einer neuen Methode zur HBeAg Quantifizierung in HBeAg positiven
Patienten mit chronischer Hepatitis B unter Behandlung mit Telbivudine und Entecavir. Z
Gastroenterol 47: P291.
12. Maylin S, Boyd A, Martinolt-Peignoux M, Delaugerre C, Bagnard G, Lapalus M, Zoulim
F, Lavocat F, Marcellin P, Simon F, Girard PM, Lacombe K (2013). Quantification of
hepatitis B e antigen between Elecsys HBeAg and Architect HBeAg assays among patients
infected with hepatitis B virus. J Clin Virol 56 (4): 306-311.
13. Zhang X, Lin SM, Ye F, Chen TY, Liu M, Chen YR, Zheng SQ, Zhao YR, Zhang SL
(2011). An early decrease in serum HBeAg titre is a strong predictor of virological
response to entecavir in HBeAg-positive patients. J Viral Hepat 18(7): 184-190.
14. Kwon JH, Jang JW, Lee S, Lee J, Chung KW, Lee YS, Choi JY (2012). Pretreatment
HBeAg level and an early decrease in HBeAg level predict virologic response to entecavir
treatment for HBeAg-positive chronic hepatitis B. J Viral Hepat 19(2): 41-47.
15. Finney, D J. Statistical methods in biological assay (3rd Edition), 1978. London: Charles
Griffin.
16. Sachs L.: Angewandte Statistik- 5te Auflage Springer Heidelberg pp 308-312.
17. Vesper HW, Miller WG, Myers GL (2007). Review Article. Reference Materials and
Commutability. Clin Biochem Rev 28: 139-147.
18. Miller WG, Myers GL (2013). Commutability still matters. Clin Chem 59: 1291-1293.
WHO/BS/2013.2228
Page 15
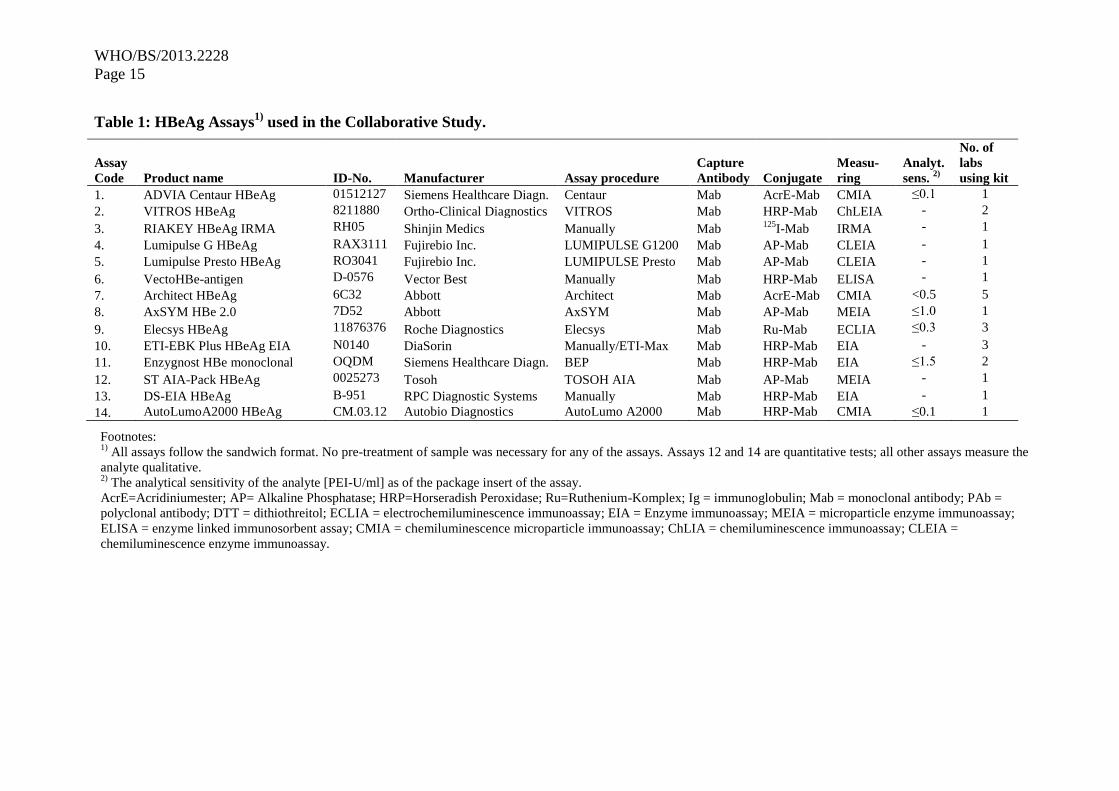
Table 1: HBeAg Assays1)
used in the Collaborative Study.
Assay
Code Product name ID-No. Manufacturer Assay procedure
Capture
Antibody Conjugate
Measu-
ring
Analyt.
sens. 2)
No. of
labs
using kit
1. 1 ADVIA Centaur HBeAg 01512127 Siemens Healthcare Diagn. Centaur Mab AcrE-Mab CMIA ≤0.1 1
2. 5 VITROS HBeAg 8211880 Ortho-Clinical Diagnostics VITROS Mab HRP-Mab ChLEIA - 2
3. 6 RIAKEY HBeAg IRMA RH05 Shinjin Medics Manually Mab 125
I-Mab IRMA - 1
4. 7 Lumipulse G HBeAg RAX3111 Fujirebio Inc. LUMIPULSE G1200 Mab AP-Mab CLEIA - 1
5. 8 Lumipulse Presto HBeAg RO3041 Fujirebio Inc. LUMIPULSE Presto Mab AP-Mab CLEIA - 1
6. 1 VectoHBe-antigen D-0576 Vector Best Manually Mab HRP-Mab ELISA - 1
7. 1 Architect HBeAg 6C32 Abbott Architect Mab AcrE-Mab CMIA <0.5 5
8. 1 AxSYM HBe 2.0 7D52 Abbott AxSYM Mab AP-Mab MEIA ≤1.0 1
9. 1 Elecsys HBeAg 11876376 Roche Diagnostics Elecsys Mab Ru-Mab ECLIA ≤0.3 3
10. 1 ETI-EBK Plus HBeAg EIA N0140 DiaSorin Manually/ETI-Max Mab HRP-Mab EIA - 3
11. 2 Enzygnost HBe monoclonal OQDM Siemens Healthcare Diagn. BEP Mab HRP-Mab EIA ≤1.5 2
12. 1 ST AIA-Pack HBeAg 0025273 Tosoh TOSOH AIA Mab AP-Mab MEIA - 1
13. 1 DS-EIA HBeAg B-951 RPC Diagnostic Systems Manually Mab HRP-Mab EIA - 1
14. 1 AutoLumoA2000 HBeAg CM.03.12 Autobio Diagnostics AutoLumo A2000 Mab HRP-Mab CMIA ≤0.1 1
Footnotes: 1)
All assays follow the sandwich format. No pre-treatment of sample was necessary for any of the assays. Assays 12 and 14 are quantitative tests; all other assays measure the
analyte qualitative. 2)
The analytical sensitivity of the analyte [PEI-U/ml] as of the package insert of the assay.
AcrE=Acridiniumester; AP= Alkaline Phosphatase; HRP=Horseradish Peroxidase; Ru=Ruthenium-Komplex; Ig = immunoglobulin; Mab = monoclonal antibody; PAb =
polyclonal antibody; DTT = dithiothreitol; ECLIA = electrochemiluminescence immunoassay; EIA = Enzyme immunoassay; MEIA = microparticle enzyme immunoassay;
ELISA = enzyme linked immunosorbent assay; CMIA = chemiluminescence microparticle immunoassay; ChLIA = chemiluminescence immunoassay; CLEIA =
chemiluminescence enzyme immunoassay.

WHO/BS/2013.2228
Page 16
Table 2: Mean Endpoint Titers of samples A1 (candidate material) and A2 (PEI 82,
assigned unitage of 100 U/ml).
Sample A1
(candidate material,
code 129097/12)
Sample A2
(PEI 82)
Kit
code
Laboratory
code
Titer
GMV 1)
95%-CI
2)
Titer
GMV 1)
95%-CI
2)
1 1 3160 2557 - 3904 2837 2245 - 3585
2 2 657 536 - 804 756 565 - 1010
2 3 611 508 - 735 696 595 - 814
3 4 434 370 - 508 619 431 - 889
4 5 1092 978 - 1219 1153 1039 - 1281
5 5 896 823 - 976 1005 809 - 1249
6 6 1102 970 - 1252 850 677 - 1068
7 7 614 492 - 767 660 606 - 718
7 8 796 697 - 909 839 664 - 1060
7 9 638 538 - 757 632 610 - 655
7 10 631 498 - 798 626 578 - 677
7 19 654 518 - 826 649 571 - 738
8 9 523 248 - 1104 530 312 - 902
9 1 332 298 - 370 342 329 - 355
9 11 351 311 - 396 363 294 - 448
9 12 443 395 - 498 486 433 - 544
10 13 535 389 - 734 589 334 - 1040
10 14 1689 1051 - 2713 2031 1781 - 2317
10 15 649 575 - 732 736 420 - 1290
11 1 399 270 - 591 419 327 - 536
11 16 537 498 - 579 518 397 - 675
12 17 312 237 - 410 347 292 - 413
13 18 693 663 - 725 667 460 - 968
14 19 618 555 - 687 631 564 - 707
Footnotes: 1) GMV = geometric mean value of titer 2) CI = confidence interval

WHO/BS/2013.2228
Page 17
Figure 1. Titer at cut-off comparison: candidate material A1 against sample A2 (PEI 82,
assigned unitage of 100 U/ml).
Footnotes:
Each code/code represents one laboratory performing the analysis with a specific kit. The first code represents the
laboratory, the second code represents the kit. The angle bisector indicates 100% identity between both materials,
A1 and A2, according to titer at cut-off determination. Please note that the data are presented in logarithmic scale for
identification of single lab results.
500 1000 2000
50
0
10
00
2
000
Titer at cut-off A1
Tite
r a
t cut-
off
A2
1 / 1
2 / 2 3 / 2
4 / 3
5 / 4
5 / 5
6 / 6
7 / 7
8 / 7
9 / 7 10 / 7
19 / 7
9 / 8
1 / 9 11 / 9
12 / 9
13 / 10
14 / 10
15 / 10
1 / 11
16 / 11
17 / 12
18 / 13 19 / 14

WHO/BS/2013.2228
Page 18
Table 3a: Potency estimates of sample A1 (candidate material) relative to sample A2 (PEI
82, assigned unitage of 100 U/ml). Values were depicted as overall potency as calculated from
runs 1, 2 and 3. The potency calculation for the candidate material A1 was performed by setting
the ratio of sample A1 relative to sample A2 multiplied by 100. For potency of individual runs,
see Table 3b.
--------- Potency based on ----------
Labora- -- GMV1) Ratio --- ------ PLA
2) -
Assay tory potency 95%-CI3) Potency 95%-CI
3)
--------
1 1 111.4 77.5 – 160.0 112.9 78.6 – 162.2
2 2 86.9 69.5 - 108.7 84.7 65.1 - 110.1
3 87.8 80.8 - 95.4 86.4 79.8 - 93.7
Total 87.4 82.1 - 93.0 85.6 75.2 - 97.4
3 4 70.0 52.0 - 94.3 85.0 78.7 - 91.7
4 5 94.6 93.0 - 96.4 92.6 90.6 - 94.6
5 5 89.1 77.5 - 102.5 89.2 78.6 - 101.4
6 6 129.6 108.3 - 155.0 130.3 106.4 - 159.5
7 7 93.0 71.4 - 121.2 93.0 71.9 - 120.5
8 94.9 66.0 - 136.5 93.2 65.0 - 132.7
9 101.0 87.9 – 116.1 101.3 92.2 – 111.4
10 100.8 85.8 – 118.4 101.1 86.3 – 118.5
19 100.8 86.3 – 117.7 101.6 85.4 – 120.8
Total 98.0 93.4 – 103.0 98.0 92.5 – 103.8
8 9 98.7 79.5 - 122.4 100.0 93.2 - 107.3
9 1 97.1 89.8 - 105.0 97.5 89.9 - 105.8
11 96.7 78.1 – 119.8 95.5 79.4 – 114.7
12 91.3 78.4 – 106.4 91.8 78.5 – 107.3
Total 95.0 87.2 – 103.5 94.9 87.9 – 102.5
10 13 90.8 69.7 - 118.1 91.6 75.3 - 111.5
14 83.2 45.4 – 152.4 84.3 52.7 – 134.9
15 88.2 54.6 – 142.5 98.0 65.6 – 146.4
Total 87.3 78.2 – 97.5 91.1 75.5 – 109.9
11 1 95.3 82.2 - 110.5 92.5 80.3 - 106.5
16 103.8 82.4 – 130.7 101.1 79.7 – 128.1
Total 99.5 57.9 – 170.8 96.7 55.0 – 169.8
12 17 89.9 75.2 - 107.4 87.9 84.6 – 91.3
13 18 103.9 71.8 - 150.5 99.0 74.4 - 131.6
14 19 97.8 96.9 – 98.8 98.7 97.7 – 99.7
------------
Total 95.1 90.7 – 99.8 95.8 91.9 – 99.8
---------
Footnotes: 1) GMV = geometric mean value
2) PLA = parallel line assay
3) CI = confidence interval

WHO/BS/2013.2228
Page 19
Table 3b: Potency estimates of sample A1 (candidate material) relative to sample A2 (PEI
82, assigned unitage of 100 PEI units/ml). Values were shown itemized into run 1, 2 and 3.
--------- Potency based on ---------
Labora- -- GMV1) Ratio ----- --------- PLA
2) --
Assay tory run 1 run 2 run 3 run 1 run 2 run3
-----------
1 1 118.9 123.3 94.2 114.9 129.4 96.8
2 2 78.4 92.2 90.9 75.1 91.7 88.2
3 90.5 84.7 88.2 89.0 83.5 87.0
3 4 76.2 73.8 61.0 84.4 87.8 82.7
4 5 94.8 93.9 95.2 93.2 92.9 91.6
5 5 89.3 94.2 84.2 89.4 84.7 93.9
6 6 132.7 137.2 119.5 131.6 140.6 119.6
7 7 82.5 101.2 96.4 82.7 100.8 96.6
8 80.2 104.6 102.0 79.2 99.1 103.1
9 96.6 99.2 107.6 99.3 98.9 105.9
10 94.5 100.8 107.6 94.0 103.9 105.9
19 100.4 107.4 94.8 100.9 109.3 95.1
8 9 89.3 103.1 104.4 98.3 103.3 98.4
9 1 100.1 97.3 94.0 101.2 96.5 95.0
11 88.5 97.2 105.1 88.2 96.6 102.1
12 94.5 94.7 85.1 94.2 96.0 85.4
10 13 82.5 101.8 89.0 86.8 100.3 88.4
14 79.3 87.2 81.2 87.5
15 72.6 106.9 88.3 84.0 116.0 96.6
11 1 101.5 94.6 90.2 98.8 89.6 89.5
16 115.4 99.7 97.2 112.8 94.9 96.4
12 17 88.7 84.3 97.1 89.0 88.3 86.4
13 18 123.0 98.3 92.8 112.9 91.3 94.1
14 19 97.8 97.5 98.2 98.3 98.7 99.1
-----------------------------------------------------------------------------------------
Footnotes: 1) GMV = geometric mean value
2) PLA = parallel line assay

WHO/BS/2013.2228
Page 20
Figure 2. Potency of candidate material A1 (GMV ratios relative to A2, PEI-Standard 82,
assigned unitage of 100 PEI units/ml)
Footnotes:
Each box represents the laboratory potency estimate relative to sample A2 for an individual kit.
The boxes are labeled with the laboratory (=L) code number, and a code representing the kit used (= K)
Potency A1= GMV ratios (A1/A2 *100)
Reissinger
Potency (U/ml)
60 70 80 90 100 110 120 130 140 150 160
0
2
4
6
8
10
1
2
L 4 K 3 L 14 K 10
L 2 K 2
L 3 K 2
L 15 K 10
L 5 K 5
L 17 K 12
L 13 K 10
L 12 K 9
L 7 K 7
L 5 K 4
L 8 K 7
L 1 K 11
L 11 K 9
L 1 K 9
L 19 K 14
L 9 K 8
L 19 K 7
L 10 K 7
L 9 K 7
L 16 K 11
L 18 K 13
L 1 K 1 L 6 K 6
Laboratories / Kits

WHO/BS/2013.2228
Page 21
Figure 3. Potency comparison: GMV ratios against PLA ratios
Footnotes:
Each cross represents the laboratory potency estimate for an individual kit. The first code represents the laboratory,
the second code represents the kit used. The angle bisector indicates 100% identity between both potency analyses,
via cut-off and via parallel line assay.
+ + ++
+
++
+++ +++
++++
+++ ++
+
+
70 80 90 100 110 120 130
70
80
90
10
01
10
12
01
30
Reissinger
Potency via Ratio
Po
ten
cy v
ia P
LA
(lin
ea
r)
4/3
15/10
Potency via cut-off

WHO/BS/2013.2228
Page 22
Table 4: Correlation of analytical sensitivity with recovery of samples A3, A4 and AB5.
Analytical Sensitivity1)
A3 A4 AB5 A3 A4 AB5
U/ml
Kit No. Lab No. [S/CO]
[U/ml]
Mean values Lab values
high 0.032 1 1 50.09 5.50 3.31 1.96 0.20 0.11
0.091
6 6 8.28 2.12 2.84 1.20 0.24 0.36
0.092
4 5 14.99 3.30 2.93 1.72 0.34 0.30
0.112
5 5 11.83 2.37 1.57 1.63 0.29 0.19
0.187
10 13 11.79 2.75 2.01 > 2.002)
0.52 0.38
0.119 0.059
10 14 16.86 2.41 1.11 1.37 0.16 0.08
0.154
10 15 13.66 2.58 2.70 1.99 0.32 0.35
0.144
13 18 10.70 3.01 4.55 > 2.00 0.56 0.88
0.163
7 7 11.14 2.30 3.30 > 2.00 0.44 0.65
0.126
7 8 8.81 2.04 2.88 1.71 0.34 0.51
0.151 0.157
7 9 8.42 2.12 2.92 1.77 0.41 0.59
0.159
7 10 11.55 2.43 3.44 > 2.00 0.47 0.71
0.153
7 19 9.31 2.11 2.86 > 2.00 0.40 0.57
0.158
0.152
2 2 20.10 2.63 0.33
1.38 0.30 0.06
0.164
2 3 19.99 2.58 0.19
1.35 0.30 0.05
0.162
14 19 8.35 1.48 0.50
0.94 0.22 0.09
0.191
8 9 7.70 1.86 0.76
1.91 0.41 0.13
0.216
0.251
11 1 6.01 1.20 0.43
1.44 0.30 0.09
0.186
11 16 3.14 0.95 0.66
0.92 0.17 0.08
0.231
3 4 4.96 0.72 0.71
1.12 0.14 0.13
0.301
9 1 10.60 2.23 2.02 > 2.00 0.71 0.64
0.269 0.285
9 11 9.12 1.94 1.75 > 2.00 0.60 0.55
0.226
9 12 9.91 2.26 1.90 > 2.00 0.55 0.45
low
0.321
12 17 8.37 1.63 2.46 > 2.00 0.55 0.83
Total GMV3) 10.56 2.11 1.53 > 1.64 0.34 0.26
Footnotes: 1)
Analytical sensitivity was determined using the candidate standard A1. Light shaded areas represent positive
samples. Dark shaded areas represent quantitative results using serial dilutions of A1 (starting with 2 U/ml) as
standard curve.
2) the OD values were beyond the A1 standard curve
3) GMV= Geometric mean value
WHO/BS/2013.2228
Page 23
Figure 4: Individual laboratory mean estimates for sample A3 (a), A4 (b) and AB5 (c).
On the left, S/CO values were depicted, on the right, qualitative values were transformed to U/ml
using serial dilutions of the candidate standard A1 as a standard curve.
A3 vs. A1
Reissinger
S/co
La
bo
rato
rie
s / K
its
0 5 10 15 20 25 50 55
02
46
81
01
2
L 1 K 1L 2 K 2
L 3 K 2
L 4 K 3 L 5 K 4L 5 K 5
L 6 K 6 L 7 K 7
L 8 K 7
L 9 K 7
L 10 K 7
L 19 K 7
L 9 K 8
L 1 K 9
L 11 K 9
L 12 K 9
L 13 K 10
L 14 K 10
L 15 K 10
L 1 K 11
L 16 K 11
L 17 K 12
L 18 K 13
L 19 K 14
A3 vs. A1
Reissinger
U/ml
La
bo
rato
rie
s / K
its
0 0.5 1 1.5 2 > 2
02
46
81
01
2
L 1 K 1L 2 K 2
L 3 K 2
L 4 K 3
L 5 K 4
L 5 K 5
L 6 K 6
L 7 K 7
L 8 K 7
L 9 K 7
L 10 K 7
L 19 K 7
L 9 K 8
L 1 K 9
L 11 K 9
L 12 K 9
L 13 K 10
L 14 K 10
L 15 K 10
L 1 K 11
L 16 K 11
L 17 K 12
L 18 K 13
L 19 K 14
A4 vs. A1
Reissinger
S/co
La
bo
rato
rie
s / K
its
0 0.5 1 1.5 2 2.5 3 3.5 4 4.5 5 5.5 6
02
46
81
01
2
L 1 K 1L 2 K 2
L 3 K 2
L 4 K 3 L 5 K 4L 5 K 5
L 6 K 6
L 7 K 7
L 8 K 7
L 9 K 7
L 10 K 7
L 19 K 7
L 9 K 8
L 1 K 9
L 11 K 9
L 12 K 9
L 13 K 10
L 14 K 10
L 15 K 10
L 1 K 11
L 16 K 11
L 17 K 12
L 18 K 13L 19 K 14
A4 vs. A1
Reissinger
U/ml
La
bo
rato
rie
s / K
its
0 0.15 0.3 0.45 0.6 0.75
02
46
81
01
2
L 1 K 1
L 2 K 2
L 3 K 2
L 4 K 3 L 5 K 4
L 5 K 5
L 6 K 6
L 7 K 7
L 8 K 7
L 9 K 7
L 10 K 7
L 19 K 7
L 9 K 8
L 1 K 9
L 11 K 9L 12 K 9
L 13 K 10
L 14 K 10
L 15 K 10L 1 K 11
L 16 K 11
L 17 K 12
L 18 K 13
L 19 K 14
AB5 vs. A1
Reissinger
S/co
La
bo
rato
rie
s / K
its
0 0.5 1 1.5 2 2.5 3 3.5 4 4.5 5 5.5 6
02
46
81
01
2
L 1 K 1L 2 K 2
L 3 K 2
L 4 K 3 L 5 K 4L 5 K 5
L 6 K 6 L 7 K 7
L 8 K 7
L 9 K 7
L 10 K 7
L 19 K 7
L 9 K 8
L 1 K 9
L 11 K 9
L 12 K 9
L 13 K 10
L 14 K 10
L 15 K 10
L 1 K 11 L 16 K 11 L 17 K 12
L 18 K 13
L 19 K 14
AB5 vs. A1
Reissinger
U/ml
La
bo
rato
rie
s / K
its
0 0.15 0.3 0.45 0.6 0.75 0.9
02
46
81
01
2
L 1 K 1
L 2 K 2
L 3 K 2
L 4 K 3
L 5 K 4L 5 K 5
L 6 K 6
L 7 K 7L 8 K 7
L 9 K 7 L 10 K 7
L 19 K 7
L 9 K 8
L 1 K 9
L 11 K 9
L 12 K 9
L 13 K 10
L 14 K 10
L 15 K 10
L 1 K 11
L 16 K 11
L 17 K 12
L 18 K 13
L 19 K 14
A3 (S/CO values) A3 (U/ml)
A4 (S/CO values) A4 (U/ml)
(a)
(b)
(c) AB5 (S/CO values) AB5 (U/ml)

WHO/BS/2013.2228
Page 24
Figure 5: Scatterplots for supplemental samples A3, A4 and AB5 in U/ml using candidate
standard A1 relative to A2 (PEI 82).

WHO/BS/2013.2228
Page 25
0.0 0.5 1.0 1.5 2.0 2.5
0.0
0
.5
1.0
1
.5
2.0
2.5
A1 [U/ml]
A2
[U
/ml]
A3
A4 AB5
Kit: 5
y = 0.8557 * x + 0.0083
0.0 0.5 1.0 1.5 2.0 2.5
0.0
0
.5
1.0
1
.5
2.0
2
.5
A1 [U/ml]
A2
[U
/ml]
A3
A4 AB5
Kit: 6
y = 1.0109 * x + 0.0728
0.0 0.5 1.0 1.5 2.0 2.5
0.0
0
.5
1.0
1
.5
2.0
2
.5
A1 [U/ml]
A2
[U
/ml] A3
A4 AB5
Kit: 7
y = 0.9744 * x - 1e-04
0.0 0.5 1.0 1.5 2.0 2.5
0.0
0
.5
1.0
1
.5
2.0
2
.5
A1 [U/ml]
A2
[U
/ml]
A4
AB5
Kit: 8
y = 1.0572 * x - 0.0119

WHO/BS/2013.2228
Page 26
Footnotes:
Where A3 has not been depicted, quantification of A3 was not posible due to values beyond the standard curves
(upper limit of standard curve: 2U/ml). The angle bisector indicates 100% identity between quantification using A1
and quantification using A2.
0.0 0.5 1.0 1.5 2.0 2.5
0.0
0
.5
1.0
1
.5
2.0
2.5
A1 [U/ml]
A2
[U
/ml]
A4 AB5
Kit: 9
y = 0.9596 * x - 0.012
0.0 0.5 1.0 1.5 2.0 2.5
0.0
0
.5
1.0
1
.5
2.0
2
.5
A1 [U/ml]
A2
[U
/ml]
A3
A4 AB5
Kit: 10
y = 0.6507 * x + 0.0785
0.0 0.5 1.0 1.5 2.0 2.5
0.0
0
.5
1.0
1
.5
2.0
2
.5
A1 [U/ml]
A2
[U
/ml]
A3
A4 AB5
Kit: 11
y = 1.0024 * x - 0.0042
0.0 0.5 1.0 1.5 2.0 2.5
0.0
0
.5
1.0
1
.5
2.0
2
.5
A1 [U/ml]
A2
[U
/mll]
A4 AB5
Kit: 12
y = 0.8312 * x + 0.0175
0.0 0.5 1.0 1.5 2.0 2.5
0.0
0
.5
1.0
1
.5
2.0
2
.5
A1 [U/ml]
A2
[U
/ml]
A4 AB5
Kit: 13
y = 0.9349 * x - 0.0421
0.0 0.5 1.0 1.5 2.0 2.5
0.0
0
.5
1.0
1
.5
2.0
2
.5
A1 [U/ml]
A2
[U
/ml]
A3
A4 AB5
Kit: 14
y = 0.9611 * x + 0.0085

WHO/BS/2013.2228
Page 27
Table 5: Intra-assay and inter-laboratory variation of samples A1 (candidate standard)
and A2 (PEI 82) at the assays’ cut-offs.
-----------------------Titer at the assays’ cut-off----------------------
-- A1 - A2 -
Run Geom. Run Geom.
Kit Lab. 1 2 3 mean %GCV Run 1 Run 2 Run 3 mean %GCV
--
1 1 3442 3156 2903 3160 8.5 2895 2560 3081 2837 9.4
2 2 657 713 605 657 8.2 838 773 666 756 11.7
3 662 603 571 611 7.4 731 711 648 696 6.3
Inter-lab 633 5.1 725 5.8
3 4 455 403 444 434 6.4 598 547 727 619 14.6
4 5 1046 1088 1143 1092 4.4 1103 1159 1200 1153 4.2
5 5 914 862 914 896 3.4 1024 914 1086 1005 8.8
6 6 1165 1052 1092 1102 5.2 878 767 913 850 9.2
7 7 562 672 614 614 9.0 681 664 636 660 3.4
8 750 833 808 796 5.4 935 796 792 839 9.4
9 601 629 688 638 6.9 622 635 639 632 1.4
10 570 640 688 631 9.5 603 635 639 626 3.2
19 615 729 624 654 9.4 613 678 658 649 5.2
Inter-lab 664 10.5 677 12.2
8 9 371 603 641 523 30.7 415 585 614 530 21.6
9 1 348 329 319 332 4.3 347 338 340 342 1.5
11 354 333 367 351 4.8 400 343 349 363 8.5
12 467 436 427 443 4.7 494 461 502 486 4.6
Inter-lab 372 15.5 392 19.0
10 13 572 462 579 535 12.8 693 454 651 589 23.2
14 1627 1753 1689 5.3 2052 2010 2031 1.5
15 683 645 621 649 4.8 941 603 702 736 22.9
Inter-lab 837 67.9 958 73.8
11 1 476 379 352 399 15.9 469 400 391 419 10.0
16 528 556 527 537 3.0 458 558 542 518 10.7
Inter-lab 463 21.3 465 15.1
12 17 284 303 352 312 11.0 320 360 363 347 7.0
13 18 691 707 682 693 1.8 561 719 735 667 15.1
14 19 593 646 614 618 4.3 607 663 625 631 4.5
------------------------------------------------------------------------------------------
Footnotes:
GCV= geometric coefficient of variation
Table 6: Preliminary stability study on sample A1 (candidate standard) using kit 7
Titer at the assays’ cut-off
Temperature baseline 2h day 1 day 2 day 4 day 7
-20°C 756
+4°C 678 635 651 647 661
+25°C 666 675 622 680 703
+37°C 685 670 713 678 658
+45°C 702 624 631 659 626

WHO/BS/2013.2228
Page 28
Table 7. HBeAg tests of the complementary study
Product name: Manufacturer Assay Code according toTable1
ADVIA Centaur HBeAg Siemens 1
Architect HBeAg Abbott 7
AxSYM HBeAg Abbott 8
Elecsys HBeAg Roche 9
Enzygnost HBeAg monoclonal Siemens 11
Table 8. HBV seroconversion and longitudinal panels used
Panel
Catalogue-No. Type
Panel
vendor
Bleeds
per panel
HBeAg positive
samples
(vendors´
information)
Samples tested
1 6509
Longitudinal panel (LT)
from acute HBV
infection
ZeptoMetrix 12 6509-01 6509-01 to
6509-03
2 6510 LT from acute HBV
infection to recovery ZeptoMetrix 12
6510-1 to 6510-
05
6510-01 to
6510-05
3 6513
LT from symptomatic
and asymptomatic HBV
infection
ZeptoMetrix 12 6513-02 to
6513-11
6513-01 to
6513-12
4 6529 LT from asymptomatic
HBV infection ZeptoMetrix 12 6529-01
6529-01 to
6529-03
5 6534
LT from symptomatic to
asymptomatic HBV
infection
ZeptoMetrix 12 6534-01 6534-01 to
6534-03
6 6541
LT from symptomatic to
asymptomatic HBV
infection
ZeptoMetrix 12 6534-01 6534-01 to
6534-03
7 SCP-HBV-001
RP-009 Acute HBV infection Biomex 20
RP-009-03 to
RP-009-11
RP-009-01 to
RP-009-14
8 SCP-HBV-007
RP-020 Acute HBV infection Biomex 3
RP-020-01 to
RP-020-03
RP-020-01 to
RP-020-03
9 SCP-HBV-003
RP-028 Acute HBV infection Biomex 9
RP-028-07 and
RP-028-09
RP-028-06 to
RP-028-09
Table 9. Analytical sensitivities of HBeAg assays relative to A1
A1 Candidate HBeAg IS (WHO) Kit 1 Kit 7 Kit 8 Kit 9 Kit 11
Dilution steps U/mL S/CO* S/CO S/CO S/CO S/CO
1:10 10.000 307.84 36.02 24.02 32.05 24.41
1:20 5.000 121.50 16.98 11.69 14.75 10.20
1:50 2.000 41.08 5.96 3.99 5.04 3.08
1:100 1.000 18.11 2.54 2.01 2.08 1.35
1:200 0.500 8.87 1.26 1.23 0.87 0.50
1:400 0.250 4.37 0.74 0.58 0.42 0.25
1:800 0.125 2.05 0.54 0.50 0.24 0.13
1:1600 0.063 1.07 n.d. n.d. n.d. n.d.
1:3200 0.031 0.55 n.d. n.d. n.d. n.d.
Dilution matrix 0.000 0.00 0.39 0.40 0.11 0.01
Analytical sensitivity (U/ml) 0.059 0.376 0.412 0.553 0.855
* Mean of triple determinations.

WHO/BS/2013.2228
Page 29
Table 10. Results using clinical HBeAg positive samples derived from commercial HBV seroconversion and HBV longitudinal panels
HBeAg Assays Kit 1 Kit 7 Kit 8 Kit 9 Kit 11
HBV seroconversion
(SC) and longitudinal
(LT)panels
Panel
member
s tested
Date of
Bleed Day
HBsAg (data
sheets)
Anti-HBc
(data sheets)
Anti-HBe
(ADVIA / or
data sheets*)
HBeAg
(vendors´data
sheets) S/CO S/CO S/CO COI S/CO
SCP-HBV-001 1 18.07.1995 0 positive negative negative negative n.d. 0.63 1.20* 0.40 0.35
RP-009 2 21.07.1995 3 positive negative negative grey zone 0.39 0.64 0.58 0.39 0.11
3 29.07.1995 11 positive negative negative HBeAg pos 1.38 1.36 1.92 1.27 0.09
4 31.07.1995 13 positive negative negative HBeAg pos 2.34 2.07 158.97 1.85 1.16
5 16.08.1995 29 positive positive negative HBeAg pos >1000.0 371.33 180.98 422.10 72.73
6 18.08.1995 31 positive positive negative HBeAg pos >1000.0 578.28 193.02 676.10 72.73
7 23.08.1995 36 positive positive negative HBeAg pos >1000.0 1347.56 191.97 1112.00 72.73
8 30.08.1995 43 positive positive negative HBeAg pos >1000.0 1576.07 189.11 1010.00 72.73
9 12.09.1995 56 positive positive negative HBeAg pos >1000.0 1234.29 110.6 858.60 72.73
10 25.09.1995 69 positive positive negative HBeAg pos >1000.0 394.77 11.44 295.20 72.73
11 07.10.1995 81 positive positive positive HBeAg pos 278.64 27.75 0.57 20.72 6.49
12 14.10.1995 88 positive positive positive grey zone 4.80 0.88 0.40 0.58 0.18
13 24.10.1995 98 positive positive positive negative 1.34 0.61 0.39 0.31 0.11
14 04.11.1995 109 positive positive positive negative 0.42 0.47 n.d.** 0.17 0.09
SCP-HBV-007 1 07.01.1999 0 negative negative negative* negative 0.00 0.37 0.49 0.07 0.13
RP-020 2 17.01.1999 10 positive negative negative* HBeAg pos 3.56 3.57 2.47 2.53 1.16
3 21.02.1999 35 positive negative negative* HBeAg pos 40.92 17.06 10.11 11.99 5.89
SCP-HBV-003 6 07.11.1996 18 positive negative negative* negative 0.55 0.64 0.78 0.38 0.29
RP-028 7 12.11.1996 23 positive negative negative* HBeAg pos 1.80 1.46 1.39 1.27 0.91
8 14.11.1996 25 positive negative negative* grey zone 2.10 1.52 1.73 1.41 0.89
9 20.11.1996 31 positive negative negative* HBeAg pos 13.49 5.72 5.85 6.09 3.86
Longitudinal Panel 1 16.05.2001 0 positive positive positive HBeAg pos 111.19 0.78 1.08 0.77 0.47
6509 2 28.05.2001 12 positive positive positive negative 40.09 0.64 0.32 0.47 0.42
3 13.06.2001 16 positive positive positive negative 40.25 0.65 0.11 0.47 0.49
4 27.06.2001 42 positive positive positive negative 44.49 0.67 0.08 0.45 0.38
5 11.07.2001 56 positive positive positive negative 2.90 0.43 0.45 0.10 0.13
6 25.07.2001 70 positive positive positive negative 0.27 n.d. n.d. n.d. n.d.

WHO/BS/2013.2228
Page 30
Longitudinal Panel 1 22.05.2001 0 positive positive positive HBeAg pos >1000.0 1443.73 185.45 1101.00 72.73
6510 2 05.06.2001 14 positive positive positive HBeAg pos >1000.0 750.63 160.23 701.90 72.73
3 19.06.2001 28 positive positive positive HBeAg pos 128.68 10.93 2.32 8.22 4.71
4 03.07.2001 42 positive positive positive HBeAg pos 72.29 7.32 2.7 4.57 3.53
5 17.07.2001 56 positive positive positive HBeAg pos 78.25 8.76 1.71 4.34 3.53
Longitudinal Panel 1 06.05.2001 0 positive positive positive negative 120.54 1.52 2.1 0.55 0.16
6513 2 19.06.2001 44 positive positive positive HBeAg pos >1000.0 234.29 37.77 156.4 72.73
3 04.07.2001 59 positive positive positive HBeAg pos >1000.0 240.01 47.15 180.7 61.58
4 17.07.2001 72 positive positive positive HBeAg pos >1000.0 86.85 13.38 65.33 22.45
5 31.07.2001 86 positive positive positive HBeAg pos 842.49 52.67 8.13 30.78 11.44
6 14.08.2001 100 positive positive positive HBeAg pos 519.46 27.36 4.05 18.41 6.89
7 28.08.2001 114 positive positive positive HBeAg pos 408.22 18.68 3.18 12.37 5.69
8 11.09.2001 128 positive positive positive HBeAg pos 151.35 16.47 2.26 10.74 4.53
9 25.09.2001 142 positive positive positive HBeAg pos 70.13 1.70 0.42 0.92 0.24
10 09.10.2001 156 positive positive positive HBeAg pos 14.16 1.05 0.99 0.40 0.40
11 23.10.2001 170 positive positive positive HBeAg pos 25.09 1.16 0.55 0.45 0.22
12 06.11.2001 184 positive positive positive negative 0.86 0.36 0.73 0.07 0.15
Longitudinal Panel 1 10.08.2001 0 positive positive positive HBeAg pos 0.71 0.67 0.72 0.45 0.30
6529 2 22.10.2001 -35 negative positive positive negative 0.05 0.43 0.67 0.12 0.14
Longitudinal Panel 1 12.11.2001 0 positive positive positive HBeAg pos 2.14 1.48 0.53 0.84 0.28
6534 2 26.11.2001 14 positive positive positive negative 0.74 0.65 0.47 0.21 0.14
3 11.12.2001 29 negative positive positive negative 0.09 0.38 0.46 0.04 0.35
Longitudinal Panel 1 03.12.2001 0 positive positive positive HBeAg pos 104.73 1.66 1.04 1.41 0.46
6541 2 17.12.2001 14 positive positive positive negative 9.77 0.68 0.52 0.30 0.30
3 31.12.2001 28 positive positive positive negative 1.44 0.50 0.51 0.14 0.12
Grey zone: S/CO ratio > 0.90
* Repetition not possible due to insufficient sample volume
** n.d. not determined

WHO/BS/2013.2228
Page 31
Figure 6: Analytical sensitivities of HBeAg tests and detection of HBeAg clinical samples
Footnotes:
Numbers show clinical sensitivity (columns) and analytical sensitivity (line).
Figure 7. Correlation of analytical sensitivity and detection of HBeAg positive clinical
samples

WHO/BS/2013.2228
Page 32
Appendix 1
Participants of the WHO HBeAg Collaborative Study (in alphabetical order)
Anton Andonov
Head, Molecular and Immunodiagnostics
Bloodborne Pathogens & Hepatitis
Public Health Agency of Canada
National Microbiology Laboratories
Adjunct Professor, Department of Medical Microbiology University of Manitoba
1015 Arlington St., Suite 4800
Winnipeg, MB R3E 3R2
Canada
Zhou Cheng
Hepatitis Virus Vaccines Division
Institute for Biological Product Control
National Institutes for Food and Drug Control (NIFDC)
No.2 Tian Tan Xi Li
Beijing, 100050
P.R. China
Yejin Choi
Scientific officer
Biologics Research Division
National Institute of Food and Drug Safety Evaluation,
Korea Food & Drug Administration,
Osong Health Technology Administration Complex, 187
Osongsaengyeong2(i)-ro, Gangoe-myeon, Cheongwon-gun, Chungcheongbuk-do
Korea, 363-951
Yuri Mikhailovich Gusev
Acting General Director ZAO “Vector-Best”
ZAO “Vector-Best”
630559, Novosibirsk region, AHC, Koltsovo,
Russia
Sachiyuki Hasegawa
Customer Support Center,
Tosoh Corporation
2743-1, Hayakawa, Ayase-shi, Kanagawa 252-1123,
Japan
Saleem Kamili
Chief, Assay Development and Diagnostic Reference Team
Division of Viral Hepatitis, NCHHSTP
Centers for Disease Control and Prevention
1600 Clifton Rd, NE / MailStop A33
Atlanta, GA, 30333
USA

WHO/BS/2013.2228
Page 33
Maarten Koot
Department Virus Diagnostic Services
Sanquin
Plesmanlaan 125
Amsterdam 1066CX,
Netherlands
Ingo Krueger
Roche Diagnostics GmbH,
Nonnenwaldstr. 2,
82377 Penzberg
Germany
Mary C. Kuhns
Director, Global Scientific Affairs
Abbott Diagnostics
100 Abbott Park Road
Dept. 9AA, Bldg. AP20 Abbott Park,
Illinois 60064
USA
Syria Laperche
Responsable de l' Unité d'expertise en virologie
Centre National de Référence des hépatites B et C et du VIH en transfusion
Institut National de la Transfusion Sanguine
6 rue Alexandre CABANEL
75739 PARIS cedex 15
France
Sigrid Nick
Prüflabor für In-Vitro-Diagnostika
Paul-Ehrlich-Institut
Paul-Ehrlich-Str. 51-59
63225 Langen
Germany
Kazu Okuma
Department of Safety Research on Blood and Biological Products
National Institute of Infectious Diseases
4-7-1, Gakuen, Musashimurayama
Tokyo 208-0011
Japan
Márcia Otani
Jefe del Departamento de Control de Calidad- Serología
Hemocentro de Sao Paulo Brasil
Fundação Pró-Sangue/Hemocentro de São Paulo
Avenida Doutor Enéas Carvalho de Aguiar, 155 - Jardim América,
São Paulo, 05403-000,
Brazil
WHO/BS/2013.2228
Page 34
Francis Poisson
Chef de l'Unité Contrôle National de Qualité 2
Agence nationale de sécurité du médicament et des produits de santé
143/147 bld Anatole France
93285 Saint-Denis cedex
France
Matt Rymill
Principal Scientist
Ortho-Clinical Diagnostics, Product Support,
Felindre Meadows,
Pencoed CF35 5PZ,
United Kingdom
Christian G. Schüttler
Institut für Medizinische Virologie
Nationales Referenzzentrum für Hepatitis-B-und -D-Viren
Schubertstr. 81,
35392 Gießen
Germany
Busarawan Sriwanthana
Medical Scientist, Expert Level (Immunology)
Transfusion-transmitted Pathogens Section
National Institute of Health
Department of Medical Sciences
88/7 Soi Bamrasnaradura, Tivanond Rd., Muang, Nonthaburi 11000,
Thailand
Tatiana Ulanova
Scientific Director
RPC Diagnostic Systems
22 Yablonevaya St., 603093, Nizhniy Novgorod,
Russia
Dianna Wilkinson
Division of Virology
National Institute for Biological Standards & Control
Blanche Lane
South Mimms
Potters Bar
Hertfordshire EN6 3QG
United Kingdom

WHO/BS/2013. 2228
Page 35
Appendix 2 Proposed Instructions For Use
See next page

Paul-Ehrlich-Institut Bundesinstitut für Impfstoffe und biomedizinische Arzneimittel Federal Institute for Vaccines and Biomedicines
A WHO Collaborating Centre for Quality Assurance of Blood Products and in vitro Diagnostic Devices
1
st World Health Organization International Standard
for Hepatitis B Virus e Antigen (HBeAg)
PEI code 129097/12
(Version 1.0, dated)
1. INTENDED USE
The 1st World Health Organization (WHO) International
Standard for hepatitis B virus (HBV) e Antigen is intended to be used in the standardization and calibration of quantitative and/or qualitative diagnostic HBeAg assays and for therapeutic and quality control purposes. The establishment of an international standard is an urgent need in the standardization, harmonization and quality control of serological tests and patient management (1). The standard represents a lyophilized preparation of the PEI HBe-Referenzantigen 82, deriving from HBV positive human serum. The material has been lyophilized in 0.5 ml aliquots and stored at -20°C. The material has been evaluated in an international collaborative study involving 19 laboratories performing 14 different HBeAg assays. Further details of the collaborative study are available in the report WHO/BS/2013.xxxx. 2. UNITAGE
This reagent has been assigned a unitage of 100 International Units/ml. 3. CONTENTS
Each vial contains 0.5 ml of lyophilized serum containing infectious HBV. 4. CAUTION THIS PREPARATION IS NOT FOR ADMINISTRATION TO HUMANS.
The preparation contains material of human origin, and contains infectious HBV. It was characterized as follows: high positive for HBV DNA, HBsAg, anti-HBc, anti-HCV, and anti-HAV. HCV RNA was tested positive (<30 IU/ml). The material tested negative for markers anti-HBs, anti-HBc IgM, anti-HBe IgG, HCV core antigen, anti-HIV-1/2 and anti-HDV. This preparation should be regarded as hazardous to health. It should be used and discarded according to your own laboratory's safety procedures. Such safety procedures probably will include the wearing of protective gloves and avoiding the generation of aerosols. Care should be exercised in opening ampoules or vials, to avoid cuts. 5. USE OF MATERIAL
No attempt should be made to weigh out any portion of the freeze-dried material prior to reconstitution. The material is supplied lyophilized and should be stored at or below -20ºC. Each vial should be reconstituted in 0.5 ml sterile ultrapure water. The product should be
reconstituted just prior to use, once reconstituted, multiple freeze thawing of the product is not recommended. If not all the material is used immediately, laboratories may aliquot the remaining material into suitable volumes which should be stored at or below -20ºC.
6. STABILITY
It is the policy of WHO not to assign an expiry date to their international reference materials. They remain valid with the assigned potency and status until withdrawn or amended. The reference materials are held at the PEI within assured, temperature-controlled storage facilities. Reference materials should be stored on receipt as indicated on the label. Once, diluted or aliquoted, users should determine the stability of the material according to their own method of preparation, storage and use. Users who have data supporting any deterioration in the characteristics of any reference preparation are encouraged to contact PEI. 7. REFERENCES
Reissinger A., Volkers P., Scheiblauer H., Nick S. and the Collaborative Study Group.: Collaborative Study to Establish a World Health Organization International Standard for Hepatitis B e Antigen (HBeAg). WHO Report, WHO/BS/2013.xxxx 8. ACKNOWLEDGEMENTS
We thank the participants and laboratories staff for their expertise and contribution. 9. FURTHER INFORMATION
Further information for this material can be obtained as follows: [email protected] or [email protected] WHO Biological Reference Preparations: http://www.who.int/biologicals/en/ 10. CUSTOMER FEEDBACK
Customers are encouraged to provide feedback on the suitability or use of the material provided or other aspects of our service. Please send any comments to [email protected] or [email protected]. 11. CITATION
In any circumstance where the recipient publishes a reference to PEI materials, it is important that the correct name of the preparation, the PEI code number, the name and the address of PEI are cited correctly.

Paul-Ehrlich-Institut Email: [email protected] Paul-Ehrlich-Str. 51-59 Web: http://www.pei.de 63225 Langen, Germany
Page 37 of 37
12. MATERIAL SAFETY SHEET
Physical properties (at room temperature)
Physical appearance: Lyophilized powder
Fire hazard: None
Chemical properties
Stable: Yes Corrosive:No
Hygroscopic: No Oxidising:No
Flammable: No Irritant: No
Other (specify): CONTAINS HUMAN SERUM & INFECTIOUS HEPATITIS B VIRUS (HBV)
Handling: See caution, section 4
Toxicological properties
Effects of inhalation: Avoid – contains infectious HBV
Effects of ingestion: Avoid – contains infectious HBV
Effects of skin absorption: Avoid – contains infectious HBV
Suggested First Aid
Inhalation:Seek medical advice - contains infectious HBV
Ingestion: Seek medical advice - contains infectious HBV
Contact with eyes: Wash thoroughly with water. Seek medical advice – contains infectious HBV
Contact with skin: Wash thoroughly with water. Seek medical advice – contains infectious HBV
Action on Spillage and Method of Disposal
Spillage of vial contents should be taken up with absorbent material wetted with an appropriate disinfectant. Rinse area with an appropriate disinfectant followed by water. Absorbent materials used to treat spillage should be treated as biological waste.
13. LIABILITY AND LOSS
Information provided by the Institute is given after the exercise of all reasonable care and skill in its compilation, preparation and issue, but it is provided without liability to the Recipient in its application and use. It is the responsibility of the Recipient to determine the appropriateness of the materials supplied by the Institute to the Recipient (“the Goods”) for the proposed application and ensure that it has the necessary technical skills to determine that they are appropriate. Results obtained from the Goods are likely to be dependent on conditions of use by the Recipient and the variability of materials beyond the control of the Institute. All warranties are excluded to the fullest extent permitted by law, including without limitation that the Goods are free from infectious agents or that the supply of Goods will not infringe any rights of any third party. The Institute shall not be liable to the Recipient for any economic loss whether direct or indirect, which arise in connection with this agreement. The total liability of the Institute in connection with this agreement, whether for negligence or breach of agreement or otherwise, shall in no event exceed 120% of any price paid or payable by the Recipient for the supply of the Goods. The total liability of the Institute in connection with this agreement, whether for negligence or breach of agreement or otherwise, shall in no event exceed 120%
of any price paid or payable by the Recipient for the supply of the Goods. If any of the Goods supplied by the Institute should prove not to meet their specification when stored and used correctly (and provided that the Recipient has returned the Goods to the Institute together with written notification of such alleged defect within seven days of the time when the Recipient discovers or ought to have discovered the defect), the Institute shall either replace the Goods or, at its sole option, refund the handling charge provided that performance of either one of the above options shall constitute an entire discharge of the Institute’s liability under this Condition.