Embed Size (px)
Citation preview
EPA/600/R-16/124 | June 2016www.epa.gov/homeland-security-research
Experiments with the LECO Pegasus® Gas Chromatograph/ Time-of-Flight Mass Spectrometer Phase 2: 2D Fast GC Separations
Office of Research and Development National Homeland Security Research Center

This page left intentionally blank
i
EPA/600/R-16/124 Ɩ June 2016 www2.epa.gov/homeland-security-research
Experiments with the LECO Pegasus® Gas Chromatograph/
Time-of-Flight Mass Spectrometer Phase 2: 2D Fast GC Separations
Office of Research and Development National Homeland Security Research Center
ii
Disclaimer Neither the United States government nor Lawrence Livermore National Security, LLC, nor any of their employees makes any warranty, expressed or implied, or assumes any legal liability or responsibility for the accuracy, completeness, or usefulness of any information, apparatus, product, or process disclosed, or represents that its use would not infringe privately owned rights. The U.S. Environmental Protection Agency does not endorse the purchase or sale of any commercial products or services. Reference herein to any specific commercial product, process, or service by trade name, trademark, manufacturer, or otherwise does not constitute or imply its endorsement, recommendation, or favoring by the United States government or Lawrence Livermore National Security, LLC. The views and opinions of authors expressed herein do not necessarily state or reflect those of the United States government or Lawrence Livermore National Security, LLC, and shall not be used for advertising or product endorsement purposes. Questions concerning this document or its application should be addressed to:
Romy Campisano U.S. Environmental Protection Agency Office of Research and Development National Homeland Security Research Center (NG16) 26 West Martin Luther King Drive Cincinnati, OH 45268 (513) 569-7016 [email protected]
iii
Acknowledgments The research team wishes to acknowledge the support of all those who helped plan and prepare this report. We thank Chris Retairdes, Eric Boring, Matthew Magnuson, and Eric Graybill for their reviews of this work and their constructive suggestions and comments. The U.S. Environmental Protection Agency, Office of Research and Development, National Homeland Security Research Center (NHSRC) funded this work and Romy Campisano of this organization provided helpful conversations and contributions. We thank Farai Rukunda, Spectrometer Training Specialist, and Scott Pugh, Applications Laboratory Manager, of LECO Corporation for their support in resolving hardware and software issues and for providing many helpful conversations that allowed us to complete this study. This document was prepared as an account of work sponsored by an agency of the United States government. This work performed under the auspices of the U.S. Department of Energy by Lawrence Livermore National Laboratory under Contract DE-AC52-07NA27344. The research team was comprised of Heather Mulcahy, Carolyn Koester, and Roald Leif.
iv
Abbreviations/Acronyms 2D – two-dimensional (chromatography)
CWA – Chemical Warfare Agent, in the context of this report, the CWAs of interest are HD, GB, GD, GF, and VX
DFTPP – Decafluorotriphenylphosphine
EPA – United States Environmental Protection Agency
GB – sarin
GC – Gas Chromatography
GC/MS – Gas Chromatography/Mass Spectrometry. In the context of this report, mass spectrometry is performed with a quadrupole mass spectrometer
GC/TOF-MS – Gas Chromatography coupled with Time-of-Flight Mass Spectrometry
GD – soman
GF – cyclosarin
HD – sulfur mustard
IAG – Interagency Agreement
i.d. – internal diameter (of a gas chromatography column)
IDL – Instrument Detection Limit; this figure of merit provides an indication of the optimal capability of an instrument.
LLNL – Lawrence Livermore National Laboratory
m/z – mass-to-charge ratio for a specified ion produced by fragmentation in a mass spectrometer
NHSRC – National Homeland Security Research Center, Cincinnati, OH
NMR – Nuclear Magnetic Resonance Spectroscopy
PFTBA – Perfluorotributylamine
ppm – parts-per-million
QAPP – Quality Assurance Project Plan
RRF – Relative Response Factor
RSD – Relative Standard Deviation
RT – Retention Time (of a compound eluting from a chromatographic column)
SIM – Selected Ion Monitoring (operating mode of a mass spectrometer)
S:N – Signal-to-Noise ratio
TIC – Total Ion Chromatogram
v
TOC – Total Organic Carbon
TOF-MS – Time-of-Flight Mass Spectrometry
VX – O-ethylS-[2-(diisopropylamino)ethyl] methylphosphonothioate
vi
Executive Summary Conventional analysis by gas chromatography/ quadrupole mass spectrometry (GC/MS)
can be time-consuming (30 – 60 minutes) and prone to interferences. The use of fast gas chromatography coupled with time-of-flight mass spectrometry (GC/TOF-MS) offers the advantages of faster (~10 min) analysis times, improved GC resolution afforded by the use of narrower (0.1– 0.18 mm i.d.) columns, and improved mass resolution and scan speed provided by the TOF-MS. In addition, GC/TOF-MS offers the promise of better instrument detection limits than quadrupole GC/MS, while still providing full mass spectral data. If the GC/TOF-MS can be operated to perform two-dimensional (2D) separations, the ability to resolve peaks of interest from interfering compounds is improved. In 2D chromatography, a second GC column with a different chemical phase than that of the first GC column is used to provide additional separation of analytes as they elute from the first column. Because the chemistry of the second GC column is different from the first, compounds that co-elute from the first column may be easily resolved after a separation on the second GC column (i.e., the peak capacity of the system is increased and the specificity of analyte detection is improved).
In this study, the LECO Pegasus® 4D GC/TOF-MS was used in the 2D mode to detect chemical warfare agents (CWAs) and to compare this instrument’s performance, with regards to speed of analysis, instrument detection limits, and various matrices to conventional quadrupole-based GC/MS. Analytes studied were sulfur mustard (HD), sarin (GB), soman (GD), cyclosarin (GF), and O-ethylS-[2-(diisopropylamino)ethyl] methylphosphonothioate (VX). Instrument detection limits, as determined by 2D GC/TOF-MS, for these CWAs were compound-dependent and ranged from 0.5–5 pg. 2D GC/TOF-MS was shown to provide fast separations and produce lower instrument detection limits by approximately a factor of 10−20, compared to the speed of analysis and instrument detection limits obtained by a quadrupole GC/MS (Agilent 5973 system) operated in the SIM mode. In most cases, lower instrument detection limits, by approximately a factor of 10−20, were obtained than the instrument detection limits obtained by GC/TOF-MS operated with only a single separation.
2D GC/TOF-MS was also investigated for use in identifying factors associated with inconsistent VX quantification. The quantification of VX has been found to be difficult in previous studies in our laboratory. A calibration curve for VX was generated, with standards ranging in concentration from 0.1 to 2 µg/mL, and found to be linear (R2=0.99989). Using this regression, the concentrations of the individual VX standards were determined and compared with their known amounts. In all cases, calculated concentrations were within 5% of their expected values.
Selected problematic matrices (those that consistently showed recoveries of greater than 100% for VX when analyzed by GC/MS) were spiked with VX, extracted, and analyzed using the 2D GC/TOF-MS and quadrupole GC/MS. The matrices studied included samples of spiked wipes, Virginia soil, and drywall. VX concentrations determined by 2D GC/TOF-MS and GC/MS were compared. VX concentrations were consistently higher when measured by GC/MS than when they were measured by 2D GC/TOF-MS (compared by Student’s t-test, at a significance level of α=0.05). 2D GC/TOF-MS was able to detect interferences in soil, drywall, and wipe extracts that were not observable by a single separation with GC/MS. The observation of interferences visualized by 2D GC/TOF-MS provided a partial explanation of why higher VX

vii
concentrations were observed when GC/MS was used.
viii
Table of Contents Disclaimer……………………………………………………………………………...…………ii Acknowledgments………………………………………………………………………….……iii Abbreviations/Acronyms………………………………………………………………………..iv Executive Summary…………………………………………………………………...……...…vi List of Tables…………………………………………………………………………….………ix List of Figures………………………………………………………………………………...…..x 1.0 Introduction and Background ................................................................................................. 1
2.0 Study Objectives ..................................................................................................................... 2
3.0 Experimental Conditions ........................................................................................................ 2
3.1 Standards ............................................................................................................................ 2
3.2 Sample preparation ............................................................................................................ 3
3.3 2D GC/TOF-MS conditions ............................................................................................... 4
3.4 GC/MS conditions (conventional quadrupole) ................................................................. 5
3.5 Quality Assurance (QA) ..................................................................................................... 6
4.0 Results ..................................................................................................................................... 7
4.1 Chromatographic separation ............................................................................................. 7
4.2 Instrument detection limits .............................................................................................. 10
4.3 VX calibration .................................................................................................................. 12
4.4 Measurements of VX in sample extracts ......................................................................... 12
5.0 Conclusions and Recommendations ..................................................................................... 22
Appendix A: Autosampler Method for LECO 2D GC/TOF-MS ................................................ 23
Appendix B: GC Method for LECO 2D GC/TOF-MS ................................................................ 24
ix
List of Tables
Table 1. Average Retention Times (± Standard Deviations) and Average Analyte Responses (± Standard Deviations) for Seven Replicate Injections of 0.2 ng of CWAs into the 2D GC/TOF-MS 10 Table 2. 2D GC/TOF-MS IDLs, Quantification (Quant) and Qualifying (Qual) Ions, and Signal-To-Noise Ratios (S:N) 11 Table 3. Comparative Data for Instrument Detection Limits (pg) Determined by Various GC/MS Configurations 11 Table 4. Measured Amount of VX (µg) (n=3) in Sample Extracts of Drywall Coupons Spiked With 1 µg of VX 21
x
List of Figures
Figure 1. Total ion chromatogram obtained when separating 0.5 ng each agent and 1 ng each surrogate by 1D GC/TOF-MS. 7 Figure 2. Extracted ion chromatogram (m/z 99) obtained when separating 0.2 ng each CWA with 2D GC/TOF-MS. 9
Figure 3. Selected ion chromatogram of m/z 114 (VX quantitation ion) of Virginia soil method blank (blue) and the overlaid chromatogram of m/z 114 for a 1 ppm VX standard (black)……………………………………………………………………………...…….13 Figure 4. 2D chromatogram of extract produced from 0.1 µg VX per gram Virginia soil. 14 Figure 5. 2D chromatogram of unspiked Virginia soil showing ions representing matrix interferences for VX; no m/z 114 (VX quantitation ion) is present. 15 Figure 6. 2D GC contour plots of the TICs of the Virginia soil method blank (top) and VX-spiked Virginia soil (bottom). 16 Figure 7. 2D GC contour plots of m/z 114 (VX quantification ion) of Virginia soil method blank (top) and VX-spiked (0.1 µg/g) Virginia soil (bottom). 17 Figure 8. Magnified view of 2D GC contour plot for m/z 114 of VX-spiked (0.1 µg/g) Virginia soil. 18 Figure 9. 2D GC/TOF-MS contour plot for m/z 114 (quantification ion for VX) from an extract derived from a wipe spiked with 1 µg of VX. 19 Figure 10. 2D GC/TOF-MS contour plot for m/z 114 (quantification ion for VX) from a wipe extract containing 1 µg VX. 19 Figure 11. 2D GC/TOF-MS contour plot of m/z 114 (the VX quantitation ion) for a drywall extract, produced from 1 µg VX on spiked drywall, which was filtered using Whatman Autovial. 21
1
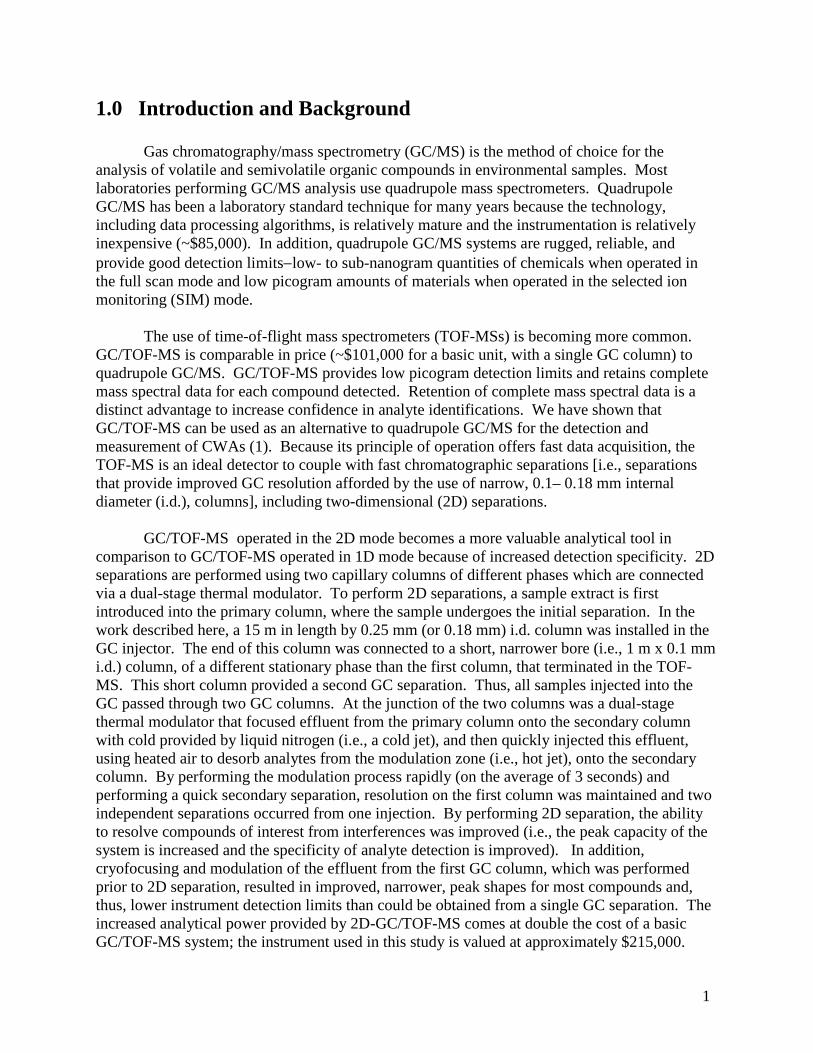
1.0 Introduction and Background
Gas chromatography/mass spectrometry (GC/MS) is the method of choice for the analysis of volatile and semivolatile organic compounds in environmental samples. Most laboratories performing GC/MS analysis use quadrupole mass spectrometers. Quadrupole GC/MS has been a laboratory standard technique for many years because the technology, including data processing algorithms, is relatively mature and the instrumentation is relatively inexpensive (~$85,000). In addition, quadrupole GC/MS systems are rugged, reliable, and provide good detection limits−low- to sub-nanogram quantities of chemicals when operated in the full scan mode and low picogram amounts of materials when operated in the selected ion monitoring (SIM) mode.
The use of time-of-flight mass spectrometers (TOF-MSs) is becoming more common. GC/TOF-MS is comparable in price (~$101,000 for a basic unit, with a single GC column) to quadrupole GC/MS. GC/TOF-MS provides low picogram detection limits and retains complete mass spectral data for each compound detected. Retention of complete mass spectral data is a distinct advantage to increase confidence in analyte identifications. We have shown that GC/TOF-MS can be used as an alternative to quadrupole GC/MS for the detection and measurement of CWAs (1). Because its principle of operation offers fast data acquisition, the TOF-MS is an ideal detector to couple with fast chromatographic separations [i.e., separations that provide improved GC resolution afforded by the use of narrow, 0.1– 0.18 mm internal diameter (i.d.), columns], including two-dimensional (2D) separations.
GC/TOF-MS operated in the 2D mode becomes a more valuable analytical tool in comparison to GC/TOF-MS operated in 1D mode because of increased detection specificity. 2D separations are performed using two capillary columns of different phases which are connected via a dual-stage thermal modulator. To perform 2D separations, a sample extract is first introduced into the primary column, where the sample undergoes the initial separation. In the work described here, a 15 m in length by 0.25 mm (or 0.18 mm) i.d. column was installed in the GC injector. The end of this column was connected to a short, narrower bore (i.e., 1 m x 0.1 mm i.d.) column, of a different stationary phase than the first column, that terminated in the TOF-MS. This short column provided a second GC separation. Thus, all samples injected into the GC passed through two GC columns. At the junction of the two columns was a dual-stage thermal modulator that focused effluent from the primary column onto the secondary column with cold provided by liquid nitrogen (i.e., a cold jet), and then quickly injected this effluent, using heated air to desorb analytes from the modulation zone (i.e., hot jet), onto the secondary column. By performing the modulation process rapidly (on the average of 3 seconds) and performing a quick secondary separation, resolution on the first column was maintained and two independent separations occurred from one injection. By performing 2D separation, the ability to resolve compounds of interest from interferences was improved (i.e., the peak capacity of the system is increased and the specificity of analyte detection is improved). In addition, cryofocusing and modulation of the effluent from the first GC column, which was performed prior to 2D separation, resulted in improved, narrower, peak shapes for most compounds and, thus, lower instrument detection limits than could be obtained from a single GC separation. The increased analytical power provided by 2D-GC/TOF-MS comes at double the cost of a basic GC/TOF-MS system; the instrument used in this study is valued at approximately $215,000.
2
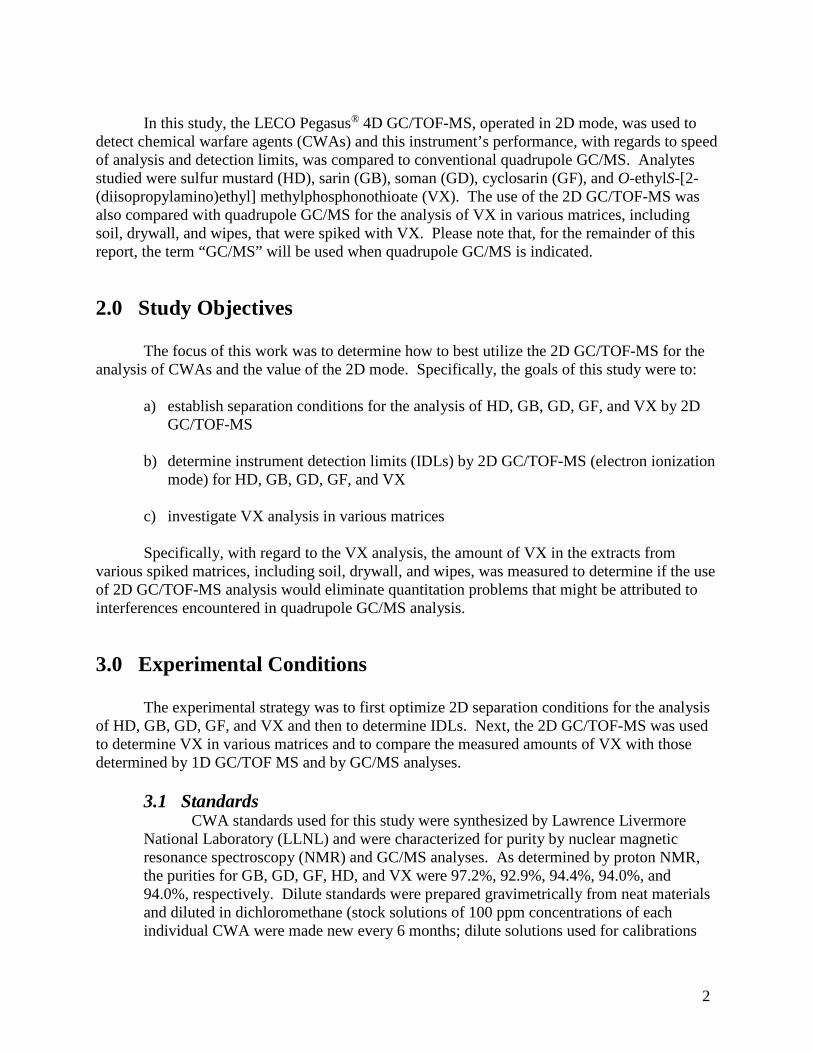
In this study, the LECO Pegasus® 4D GC/TOF-MS, operated in 2D mode, was used to
detect chemical warfare agents (CWAs) and this instrument’s performance, with regards to speed of analysis and detection limits, was compared to conventional quadrupole GC/MS. Analytes studied were sulfur mustard (HD), sarin (GB), soman (GD), cyclosarin (GF), and O-ethylS-[2-(diisopropylamino)ethyl] methylphosphonothioate (VX). The use of the 2D GC/TOF-MS was also compared with quadrupole GC/MS for the analysis of VX in various matrices, including soil, drywall, and wipes, that were spiked with VX. Please note that, for the remainder of this report, the term “GC/MS” will be used when quadrupole GC/MS is indicated.
2.0 Study Objectives
The focus of this work was to determine how to best utilize the 2D GC/TOF-MS for the analysis of CWAs and the value of the 2D mode. Specifically, the goals of this study were to:
a) establish separation conditions for the analysis of HD, GB, GD, GF, and VX by 2D GC/TOF-MS
b) determine instrument detection limits (IDLs) by 2D GC/TOF-MS (electron ionization
mode) for HD, GB, GD, GF, and VX
c) investigate VX analysis in various matrices
Specifically, with regard to the VX analysis, the amount of VX in the extracts from various spiked matrices, including soil, drywall, and wipes, was measured to determine if the use of 2D GC/TOF-MS analysis would eliminate quantitation problems that might be attributed to interferences encountered in quadrupole GC/MS analysis.
3.0 Experimental Conditions The experimental strategy was to first optimize 2D separation conditions for the analysis of HD, GB, GD, GF, and VX and then to determine IDLs. Next, the 2D GC/TOF-MS was used to determine VX in various matrices and to compare the measured amounts of VX with those determined by 1D GC/TOF MS and by GC/MS analyses. 3.1 Standards CWA standards used for this study were synthesized by Lawrence Livermore
National Laboratory (LLNL) and were characterized for purity by nuclear magnetic resonance spectroscopy (NMR) and GC/MS analyses. As determined by proton NMR, the purities for GB, GD, GF, HD, and VX were 97.2%, 92.9%, 94.4%, 94.0%, and 94.0%, respectively. Dilute standards were prepared gravimetrically from neat materials and diluted in dichloromethane (stock solutions of 100 ppm concentrations of each individual CWA were made new every 6 months; dilute solutions used for calibrations
3
were made from the 100 ppm stock solutions as needed, but typically used within two weeks).
Surrogate standards used were those of U.S. EPA Method 8270D and included nitrobenzene-d5 (NB-d5), 2-fluorobiphenyl (FBP), phencyclidine-d5 (PCP-d5), terphenyl-d14 (Ter-d14), and triphenyl phosphate (TPP). Specific solutions purchased for this work included: Base/Neutrals Surrogate Standard, 1000 µg/mL, in dichloromethane (Catalog number ERB-076, Cerilliant, Round Rock, TX), Triphenylphosphate, 5000 µg/mL, in methyl tert-butyl ether (Catalog number ERT-108S, Cerilliant), and PCP-d5 (phencyclidine-d5), 1000 µg/mL, in methanol (Catalog number P-006, Cerilliant). Internal standards used were those of U.S. EPA Method 8270D and included 1,4-dichloro-benzene-d4, naphthalene-d8, acenaphthene-d10, phenanthrene-d10, chrysene-d12, and perylene-d12. These standards were purchased as a Semivolatile Internal Standard Mix, 2000 µg/mL in dichloromethane (Catalog number 861238, Supelco, Bellefonte, PA). Internal standards were spiked into all sample extracts to produce a final concentration of 1 ng/µL for all analyses.
Decafluorotriphenylphosphine (DFTPP) was used to verify that the mass
spectrometer systems were functioning optimally. DFTPP was purchased as a solution with a concentration of 1000 µg/mL in acetone (Catalog number, 47941, Supelco, Bellefonte, PA).
All standards and samples were stored at 4–8 º C.
3.2 Sample preparation All sample preparation procedures were consistent with a draft CWA analytical
protocol currently under development at EPA and the extraction materials and protocols used have been previously described (2). Only VX was investigated in different matrices. Soil samples
Sand, purified, CAS No. 14808-60-7, Part No. 3382-05 (JT Baker, Inc., Phillipsburg, NJ) and Virginia soil, with composition of 64.5% sand, 28% silt, 7.5% clay, and 2.6% Total Organic Carbon (TOC) and pH 4.1 in 1:1 soil:water (obtained from National Exposure Research Laboratory, U.S. EPA, Las Vegas, NV) were used in this study. Briefly, 10-g aliquots of sand and soil were spiked with 500 ng of each surrogate (per Section 3.1), and extracted for one hour by water bath sonication with 25 mL of 25/50/25 (v/v/v) acetone/dichloromethane/ ethyl acetate. The resulting extract was separated from the soil by centrifugation and the supernatant removed. The soils were then extracted for a second time, as described above, with 5% triethylamine (TEA) in ethyl acetate. Extracts from the two extraction procedures were kept separate, reduced in volume to approximately 500 µL [using nitrogen and a Rapid Vap unit, customized to accommodate 40-mL vials (LabConco, Kansas City, MO) and a Pierce Reacti-Therm III, #188 evaporation module (ThermoScientific., Hudson, NH)], reconstituted to 1.00 mL with dichloromethane, and spiked with internal standards (per Section 3.1) prior to
4
analysis. Wipe samples
Wipes (3” x 3”, Kendall-Curity, 12-ply, P/N 1903, available from Tyco Healthcare Group LP, Mansfield, MA) were spiked with 500 ng surrogates (see Section 3.1 above), and extracted by waterbath sonication for 30 minutes, twice, with 15 mL 25/50/25 (v/v/v) acetone/dichloromethane/ethyl acetate. The resulting extracts were combined, evaporated to 1.00 mL (with nitrogen, as previously described), and spiked with internal standards (per Section 3.1) prior to analysis.
Drywall samples Circular coupons (1.5” in diameter and 0.5” thick) of standard drywall (Home
Depot), painted with 1 coat Glidden commercial latex primer and 1 coat Glidden interior eggshell paint, were spiked with 1µg of VX, and were extracted by waterbath sonication for 15 minutes, twice, with 20 mL 50/50 (v/v) dichloromethane/acetone. The resulting extracts were combined, evaporated to 1.00 mL (with nitrogen, as previously described), and spiked with internal standards (per Section 3.1) prior to analysis.
All sample extracts were stored at 4–8 ºC until the time of analysis and each batch of sample extracts was analyzed with corresponding method blanks. 3.3 2D GC/TOF-MS conditions
2D GC/TOF-MS experiments were performed with an Agilent 6890 gas chromatograph (Agilent Technologies, Inc., Santa Clara, CA) coupled with a LECO Pegasus® 4D mass spectrometer (LECO Corp., St. Joseph, MI). Prior to use, the 2D GC/TOF-MS was tuned with the vendor’s standard protocols and perfluorotributylamine (PFTBA) as a calibrant. An injection of 10 ng DFTPP was used to check the performance of the instrument prior to analyzing samples. Experimental data were collected using the exact same instrument conditions, including electron multiplier voltages, as those used to analyze the DFTPP check samples.
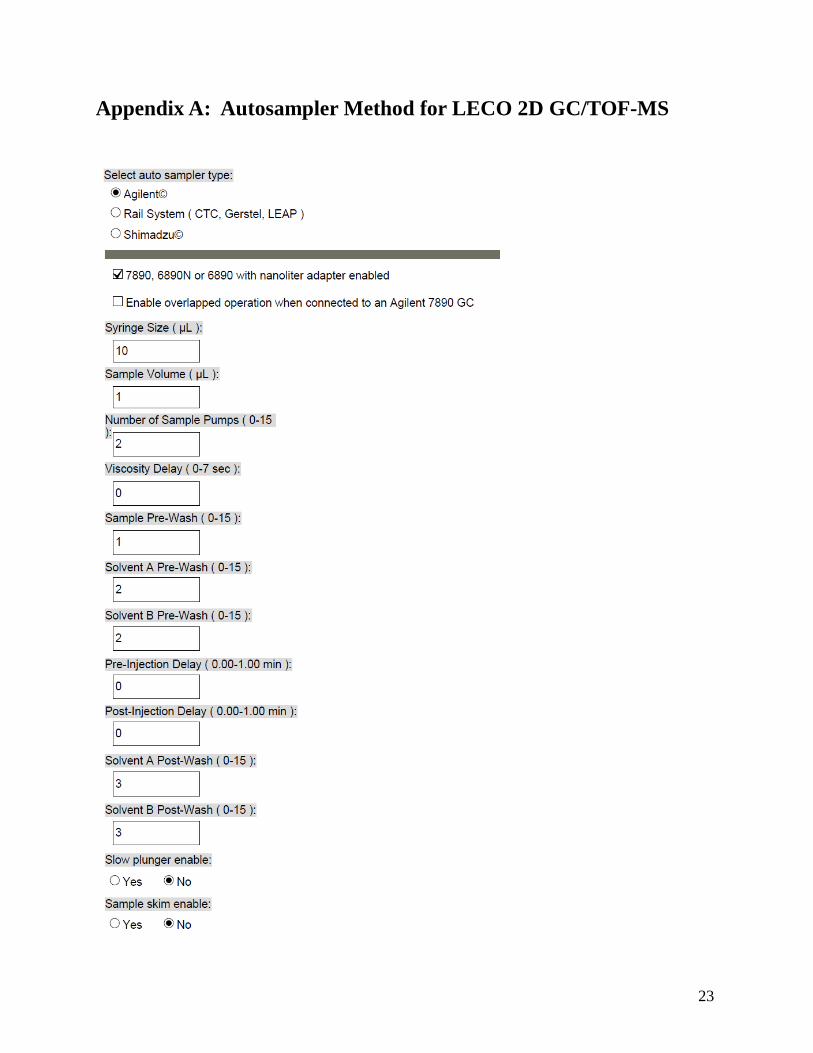
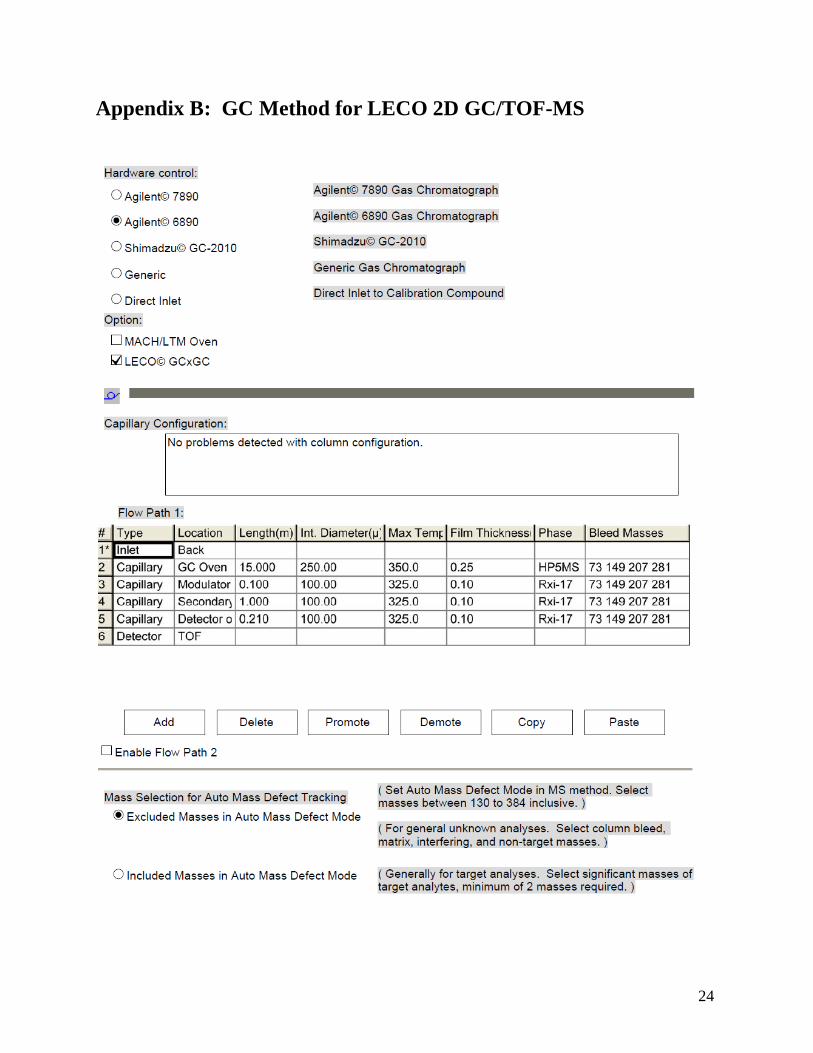
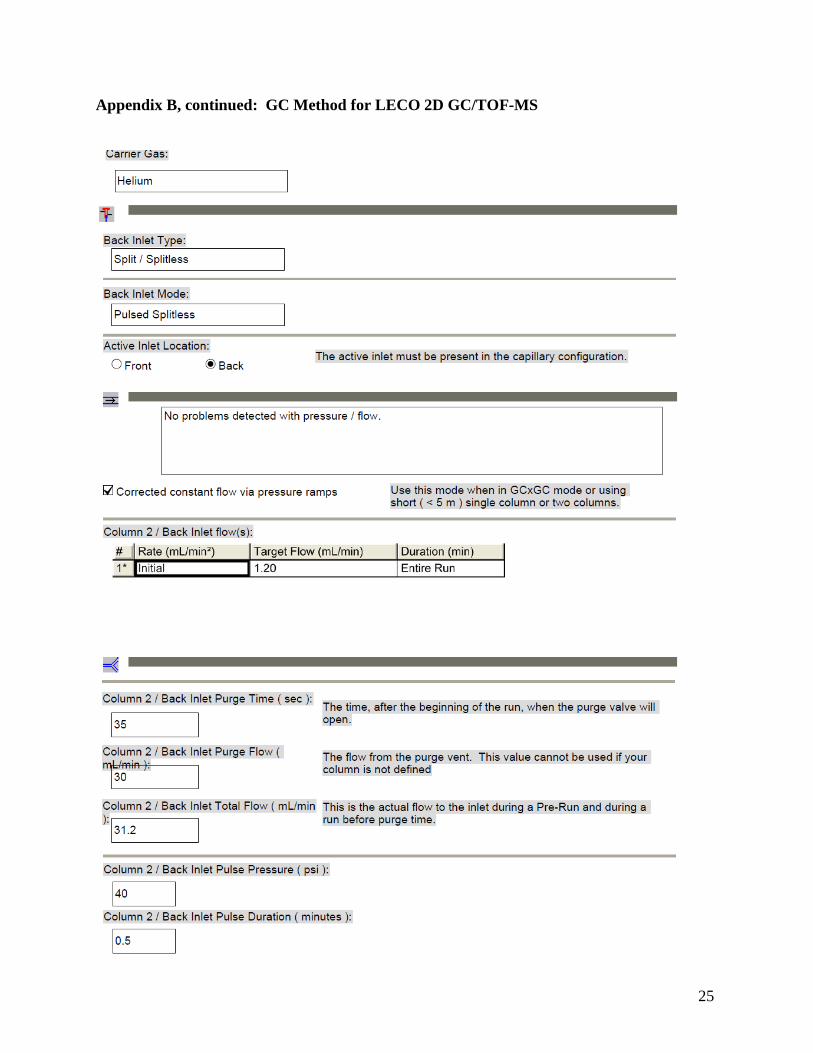
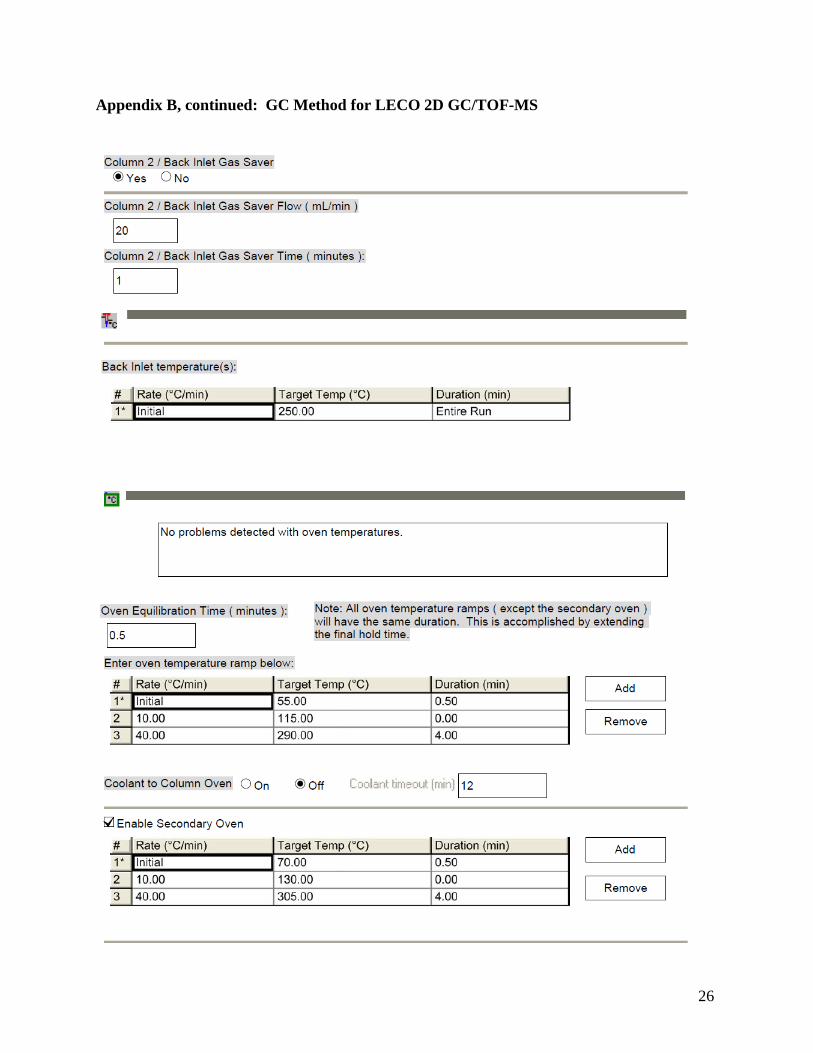
The method parameters routinely used to collect data have been recorded in
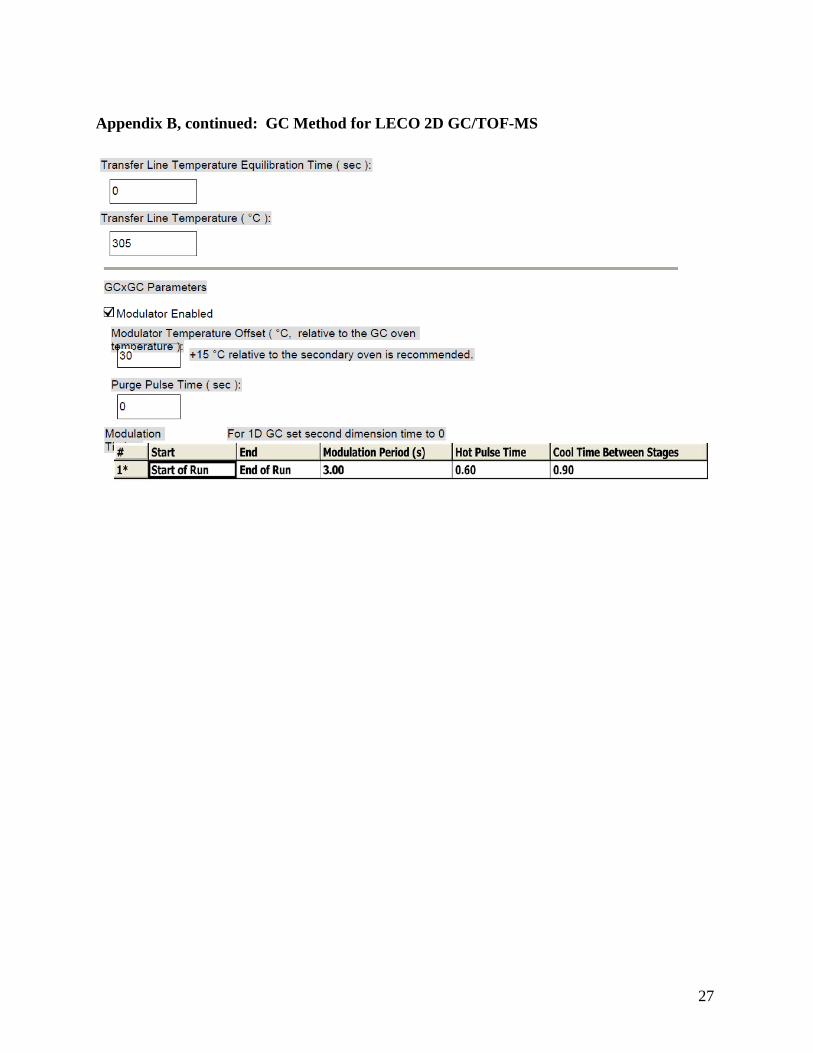
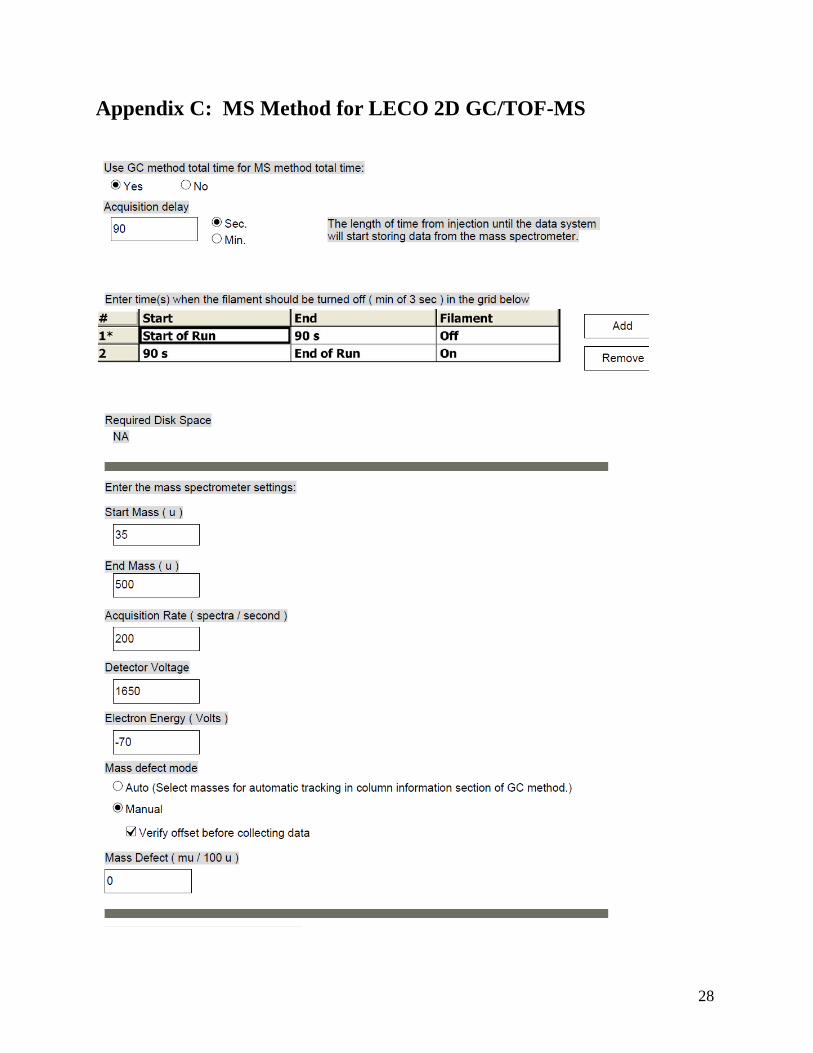
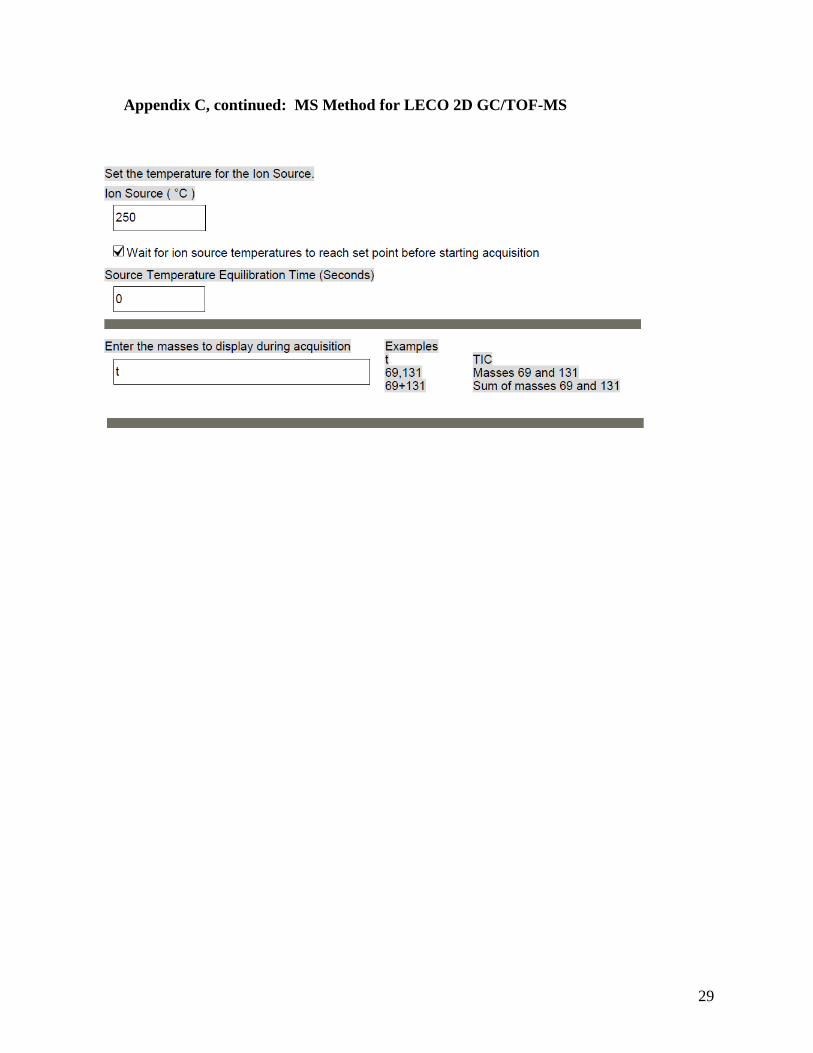
Appendices A, B, and C of this report. Because the values of these parameters that are entered into the LECO software are of great importance, screen capture images of the method setup pages are included so that the conditions of the analyses can easily be replicated.
Briefly, the following conditions were used to achieve 2D GC separations.
Injection size: 1 µL Injection type: Split/splitless (pulsed) Pulse pressure: 40 psi for 0.5 min Purge time: 35 sec at 30 mL/min Carrier gas: He (Ultrahigh purity, Air Products, Allentown, PA) with
constant flow of 1.2 mL/min GC injection port: 250 ºC
5
GC columns: 15 m x 0.25 mm i.d. x 0.25 µm film thickness, HP5-MS UI (Agilent Technologies, Inc, Santa Clara, CA)
1 m x 0.1 mm i.d. x 0.1 µm film, Rxi-17 (Restek, Bellefonte, PA)
GC oven: 55 ºC held for 0.5 min, 10 ºC/min to 115 ºC, 40 ºC/min to 290 ºC, held for 4.00 min
2nd GC oven: 70 ºC held for 0.5 min, 10 ºC/min to 130 ºC, 40 ºC/min to 305 ºC, held for 4.00 min
GC transfer line: 305 ºC Modulation period: 3 sec Hot pulse time: 0.6 sec Cool time: 0.9 sec
The following MS conditions were used for detection.
MS filament delay: 1.5 min MS scan range: 35–500, at a rate of 200 spectra/sec MS source: 250 ºC Electron energy: 70 eV
3.4 GC/MS conditions (conventional quadrupole)
GC/MS analysis was performed with an Agilent 6890 GC coupled with an Agilent 5973 MS (Agilent Technologies, Inc., Santa Clara, CA). Prior to use, the GC/MS was tuned, with the vendor’s standard protocols and PFTBA as a calibrant. An injection of 50 ng DFTPP was used to check the performance of the instrument prior to analyzing samples. Continuing calibration checks were also performed as prescribed by EPA protocols during the course of run sequences.
The standard GC parameters were:
Carrier gas: He (Ultrahigh purity, Air Products, Allentown, PA), at a constant flow of 32 cm/s
Injection mode: splitless for 0.75 min Injector temperature: 250 ºC Sample injection volume: 1 µL GC Column: Agilent HP-5MS UI, (5%-phenyl)methyl
polysiloxane Column dimensions: 30 m x 0.25 mm x 0.25 µm (length x i.d. x film
thickness) GC temperature program: 40 ºC held for 3 min, 10 ºC/min to 150ºC, 25
ºC/min to 280 ºC, held for 10.8 min
The standard MS conditions for full scan analyses performed in electron ionization mode were:
MS transfer line temperature: 280 ºC
6
MS source temperature: 230 ºC MS quadrupole temperature: 150 ºC Solvent delay time: 3 min Scan range: 35-500 m/z Electron energy: 70 eV Scan time: 3.15 scans/sec Ionization polarity: Positive
The standard MS conditions for selected ion monitoring analyses performed in
electron ionization mode were:
MS transfer line temperature: 280 ºC MS source temperature: 230 ºC MS quadrupole temperature: 150 ºC Electron energy: 70 eV Ion dwell time: 100 msec per ion (each analyte was assigned its
own SIM group; depending on the number of ions monitored, cycle times ranged from 1.44 – 2.86 cycles/sec)
Ionization polarity: Positive
3.5 Quality Assurance (QA) Data limitations. The study was performed per the approved quality assurance
project plan (3); Tasks 6 and 7 of that study plan were completed and discussed in this report. The LECO Pegasus® 4D GC/TOF-MS was used to detect CWAs. While data presented in this report are only valid for the specific instrument cited, the applicability of this work to mass spectrometers of other vendors to the analysis of CWA can be inferred. However, instrument and method detection limits will vary and will be instrument-specific.
Deviations from study plan. Analytes studied were HD, GB, GD, GF, and VX. According to the original QAPP, tabun (GA) was also to be studied. When the QAPP was written, it was thought that there was sufficient stock of existing GA of acceptable purity to include in this study. As GA was not available at the time the study was initiated, it was decided to study only the five CWAs being provided to the Environmental Response Laboratory Network (ERLN) laboratories.
The original QAPP called for the use of 2 ng DFTPP to document the good performance of both the GC/TOF-MS and the GC/MS. During this study, 10 ng DFTPP were used to access the performance of the GC/TOF-MS and 50 ng DFTPP were used to access the performance of the GC/MS. This change was made to be consistent with the quality checks used with these instruments for other EPA-sponsored work that was ongoing at the time of this study. The change in concentration did not affect the ability to demonstrate that the mass spectrometers were in working condition prior to commencing analyses.
7
The column configuration used for this study was a primary column of 15 m x 0.25 mm id x 0.25 µm film thickness, HP5-MS UI coupled with a secondary column of 1 m x 0.1 mm id x 0.1 µm film, Rxi-17; this column configuration was used to provide optimal separation of the CWAs studied.
4.0 Results
4.1 Chromatographic separation In order to understand the data produced by 2D GC/TOF-MS, it is important to
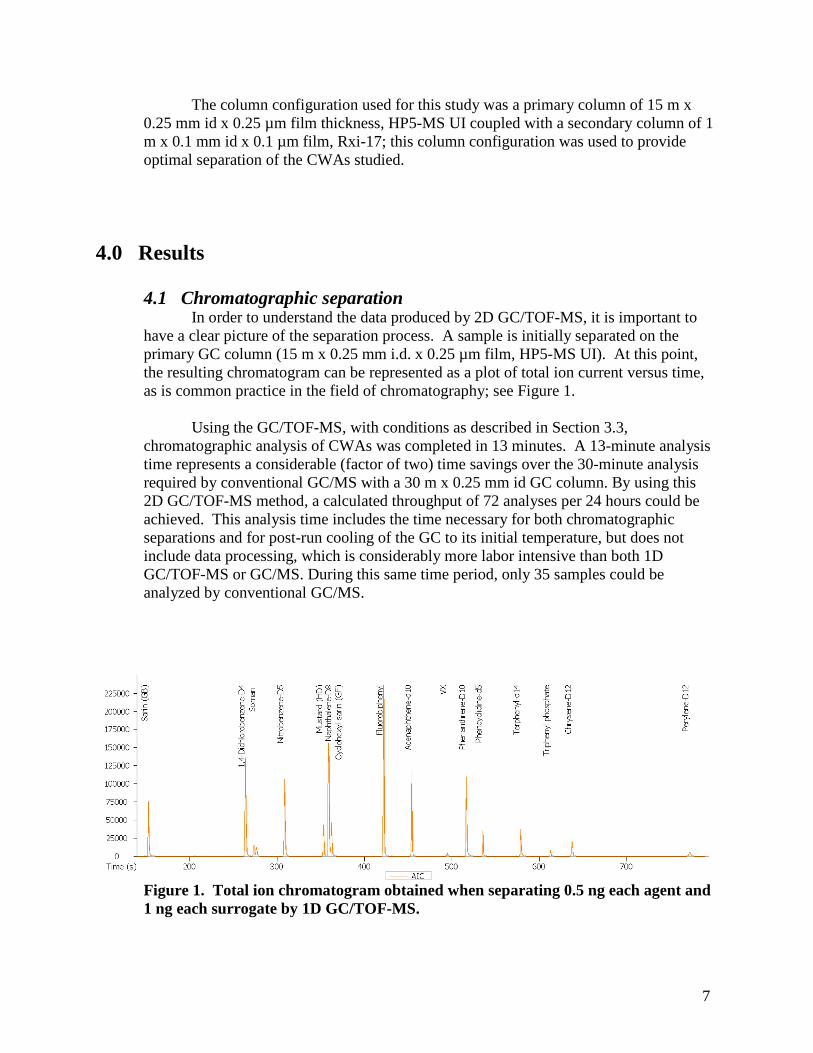
have a clear picture of the separation process. A sample is initially separated on the primary GC column (15 m x 0.25 mm i.d. x 0.25 µm film, HP5-MS UI). At this point, the resulting chromatogram can be represented as a plot of total ion current versus time, as is common practice in the field of chromatography; see Figure 1.
Using the GC/TOF-MS, with conditions as described in Section 3.3, chromatographic analysis of CWAs was completed in 13 minutes. A 13-minute analysis time represents a considerable (factor of two) time savings over the 30-minute analysis required by conventional GC/MS with a 30 m x 0.25 mm id GC column. By using this 2D GC/TOF-MS method, a calculated throughput of 72 analyses per 24 hours could be achieved. This analysis time includes the time necessary for both chromatographic separations and for post-run cooling of the GC to its initial temperature, but does not include data processing, which is considerably more labor intensive than both 1D GC/TOF-MS or GC/MS. During this same time period, only 35 samples could be analyzed by conventional GC/MS.
Figure 1. Total ion chromatogram obtained when separating 0.5 ng each agent and 1 ng each surrogate by 1D GC/TOF-MS.
8
The first step in performing 2D chromatography is to produce the best possible chromatographic separation using the primary GC column (15 m x 0.25 mm i.d. x 0.25 µm film thickness, HP5-MS UI) to ensure optimal separation of the analytes on the second GC column, which is of a different stationary phase (1 m x 0.1 mm i.d. x 0.1 µm film thickness, Rxi-17) than the primary column. After initial separation on the primary column, the effluent from that column enters a dual-stage thermal modulator. The dual-stage thermal modulator of the Pegasus® 4D consists of a series of two cryotraps, which are used to transfer analytes from the primary column to the secondary column. The first cryotrap collects the sample from the primary GC column. Then, the sample is released (using heat) and collected on the second cryotrap. This second cryotrap holds the sample while the first cryotrap cools. When the first cryotrap is cold, the second cryotrap releases the sample onto the second GC column. The second cryotrap then cools so that the first cryotrap can release the next trapped sample portion. The continual process of temperature cycling by which the thermal modulator traps effluent from the primary column and introduces it onto the secondary column (referred to as “modulation”) is done at a frequency that preserves the resolution achieved on the primary column (i.e., typically 3 to 4 samples per first dimension peak width are collected; each of these samples is referred to as a “slice”) and considers the time needed for separation on the secondary column (3 seconds in this method). With such a short separation time, the separation on the secondary GC column is essentially isothermal (i.e., the temperature changes of the primary oven do not significantly impact the higher temperature of the secondary column). By performing the modulation process rapidly and performing a quick secondary separation, resolution on the first column is maintained and two independent separations are obtained from one injection.
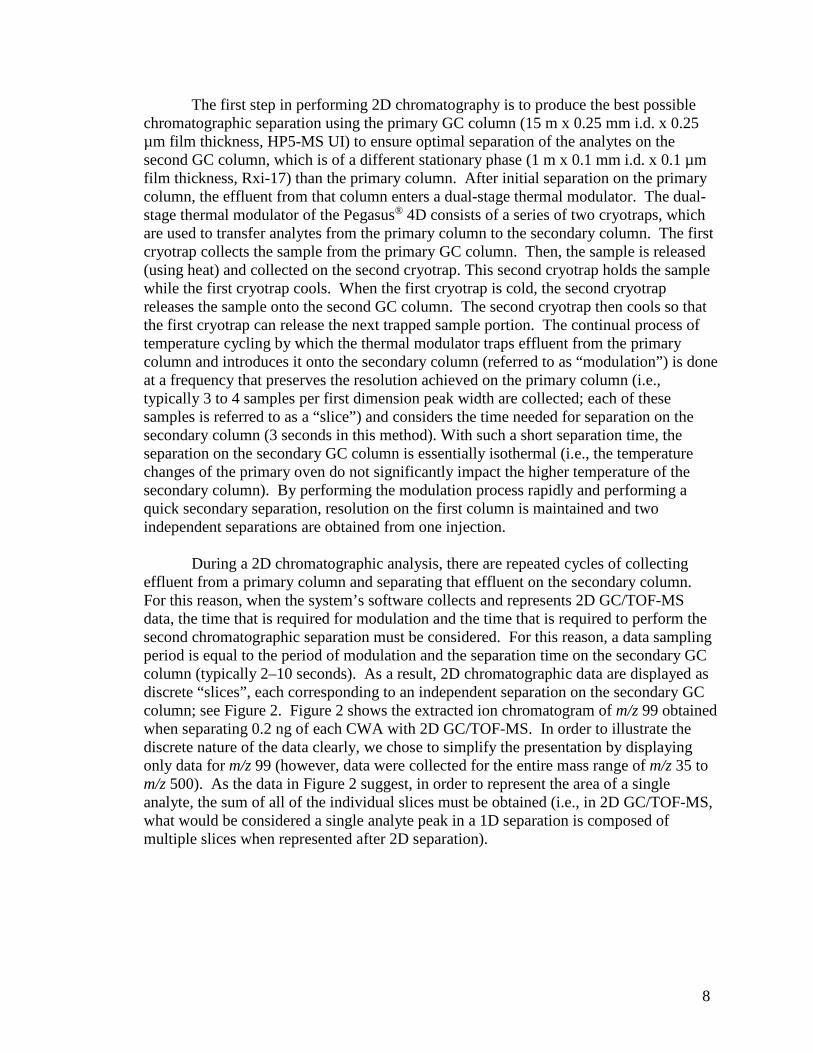
During a 2D chromatographic analysis, there are repeated cycles of collecting effluent from a primary column and separating that effluent on the secondary column. For this reason, when the system’s software collects and represents 2D GC/TOF-MS data, the time that is required for modulation and the time that is required to perform the second chromatographic separation must be considered. For this reason, a data sampling period is equal to the period of modulation and the separation time on the secondary GC column (typically 2–10 seconds). As a result, 2D chromatographic data are displayed as discrete “slices”, each corresponding to an independent separation on the secondary GC column; see Figure 2. Figure 2 shows the extracted ion chromatogram of m/z 99 obtained when separating 0.2 ng of each CWA with 2D GC/TOF-MS. In order to illustrate the discrete nature of the data clearly, we chose to simplify the presentation by displaying only data for m/z 99 (however, data were collected for the entire mass range of m/z 35 to m/z 500). As the data in Figure 2 suggest, in order to represent the area of a single analyte, the sum of all of the individual slices must be obtained (i.e., in 2D GC/TOF-MS, what would be considered a single analyte peak in a 1D separation is composed of multiple slices when represented after 2D separation).
9
Figure 2. Extracted ion chromatogram (m/z 99) obtained when separating 0.2 ng each CWA with 2D GC/TOF-MS.
The chromatographic peaks, or slices, generated by 2D GC separation were typically 100 ms wide. These peaks were much narrower than the approximately 2-second peaks that were produced by the 1D separation. For this reason, care was taken to ensure that a minimum of 20 data points were generated across each chromatographic peak in order to adequately define the peak and to obtain reproducible data. This was the reason that a fast data acquisition speed of 200 spectra per second was needed to successfully implement the GC/TOF-MS method. If too few data points were collected during an analysis, the chromatographic peak would be ill-defined, chromatographic information would be lost, reproducibility would be poor, and LECO’s deconvolution software algorithms would not have been properly implemented.
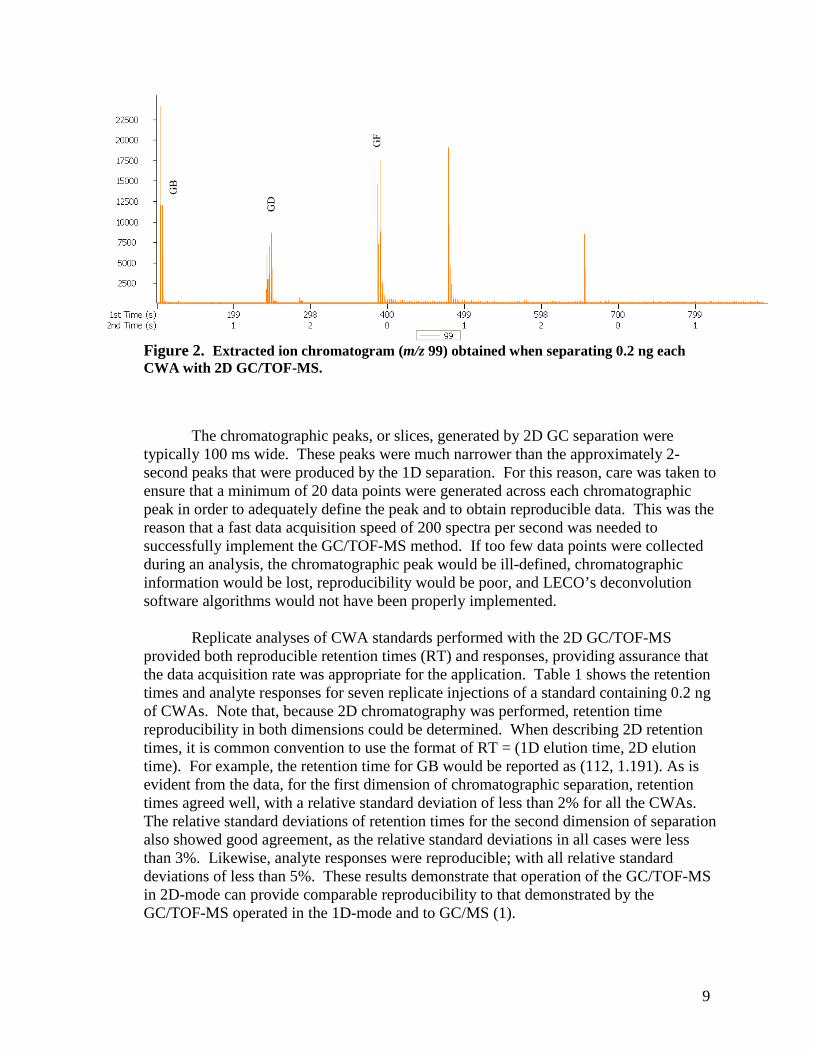
Replicate analyses of CWA standards performed with the 2D GC/TOF-MS provided both reproducible retention times (RT) and responses, providing assurance that the data acquisition rate was appropriate for the application. Table 1 shows the retention times and analyte responses for seven replicate injections of a standard containing 0.2 ng of CWAs. Note that, because 2D chromatography was performed, retention time reproducibility in both dimensions could be determined. When describing 2D retention times, it is common convention to use the format of RT = (1D elution time, 2D elution time). For example, the retention time for GB would be reported as (112, 1.191). As is evident from the data, for the first dimension of chromatographic separation, retention times agreed well, with a relative standard deviation of less than 2% for all the CWAs. The relative standard deviations of retention times for the second dimension of separation also showed good agreement, as the relative standard deviations in all cases were less than 3%. Likewise, analyte responses were reproducible; with all relative standard deviations of less than 5%. These results demonstrate that operation of the GC/TOF-MS in 2D-mode can provide comparable reproducibility to that demonstrated by the GC/TOF-MS operated in the 1D-mode and to GC/MS (1).
10
Table 1. Average Retention Times (± Standard Deviations) and Average Analyte Responses (± Standard Deviations) for Seven Replicate Injections of 0.2 ng of CWAs into the 2D GC/TOF-MS Analyte 1D
Retention Time (sec)
2D Retention Time
(sec)
Analyte Response (peak area in arbitrary units)
GB 112 ± 2.07 1.191 ± 0.013 280555 ± 9979 GD 255 ± 4.14 1.546 ± 0.022 151407 ± 5483 GF 399 ± 2.27 1.821 ± 0.048 259259 ± 10866 HD 379 ± 2.70 1.931 ± 0.024 245416 ± 10404 VX 568 ± 0.00 0.851 ± 0.002 18085 ± 758
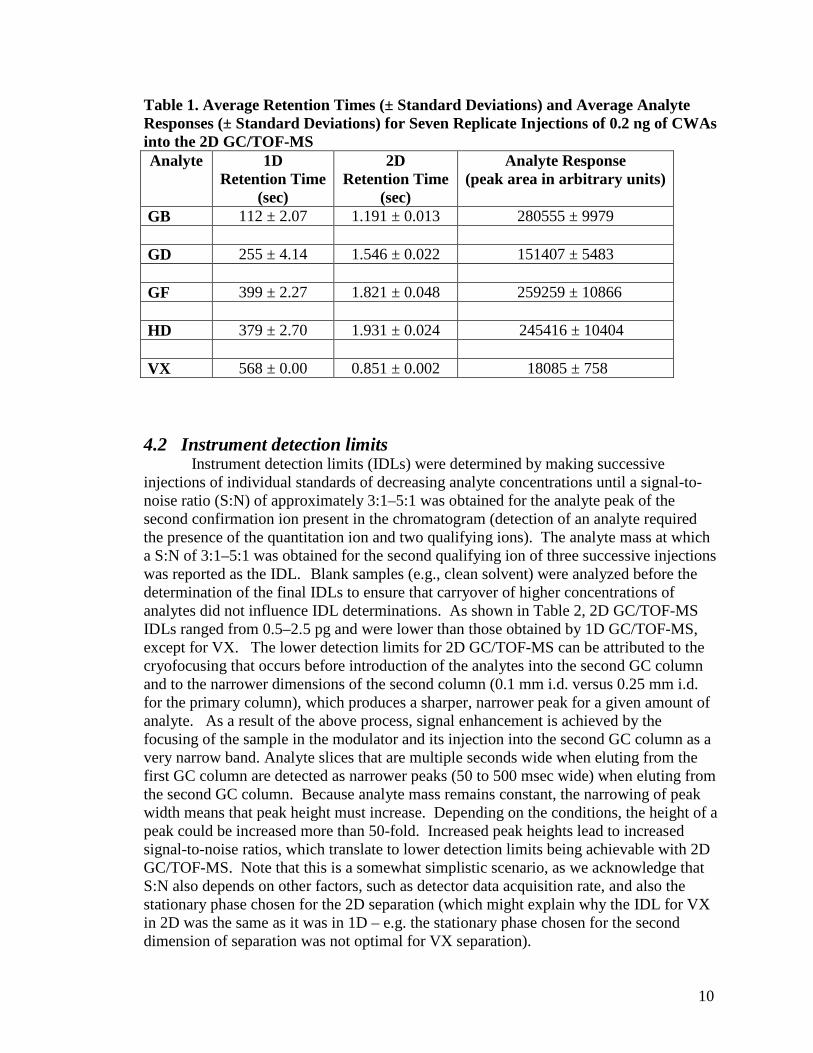
4.2 Instrument detection limits
Instrument detection limits (IDLs) were determined by making successive injections of individual standards of decreasing analyte concentrations until a signal-to-noise ratio (S:N) of approximately 3:1–5:1 was obtained for the analyte peak of the second confirmation ion present in the chromatogram (detection of an analyte required the presence of the quantitation ion and two qualifying ions). The analyte mass at which a S:N of 3:1–5:1 was obtained for the second qualifying ion of three successive injections was reported as the IDL. Blank samples (e.g., clean solvent) were analyzed before the determination of the final IDLs to ensure that carryover of higher concentrations of analytes did not influence IDL determinations. As shown in Table 2, 2D GC/TOF-MS IDLs ranged from 0.5–2.5 pg and were lower than those obtained by 1D GC/TOF-MS, except for VX. The lower detection limits for 2D GC/TOF-MS can be attributed to the cryofocusing that occurs before introduction of the analytes into the second GC column and to the narrower dimensions of the second column (0.1 mm i.d. versus 0.25 mm i.d. for the primary column), which produces a sharper, narrower peak for a given amount of analyte. As a result of the above process, signal enhancement is achieved by the focusing of the sample in the modulator and its injection into the second GC column as a very narrow band. Analyte slices that are multiple seconds wide when eluting from the first GC column are detected as narrower peaks (50 to 500 msec wide) when eluting from the second GC column. Because analyte mass remains constant, the narrowing of peak width means that peak height must increase. Depending on the conditions, the height of a peak could be increased more than 50-fold. Increased peak heights lead to increased signal-to-noise ratios, which translate to lower detection limits being achievable with 2D GC/TOF-MS. Note that this is a somewhat simplistic scenario, as we acknowledge that S:N also depends on other factors, such as detector data acquisition rate, and also the stationary phase chosen for the 2D separation (which might explain why the IDL for VX in 2D was the same as it was in 1D – e.g. the stationary phase chosen for the second dimension of separation was not optimal for VX separation).
11
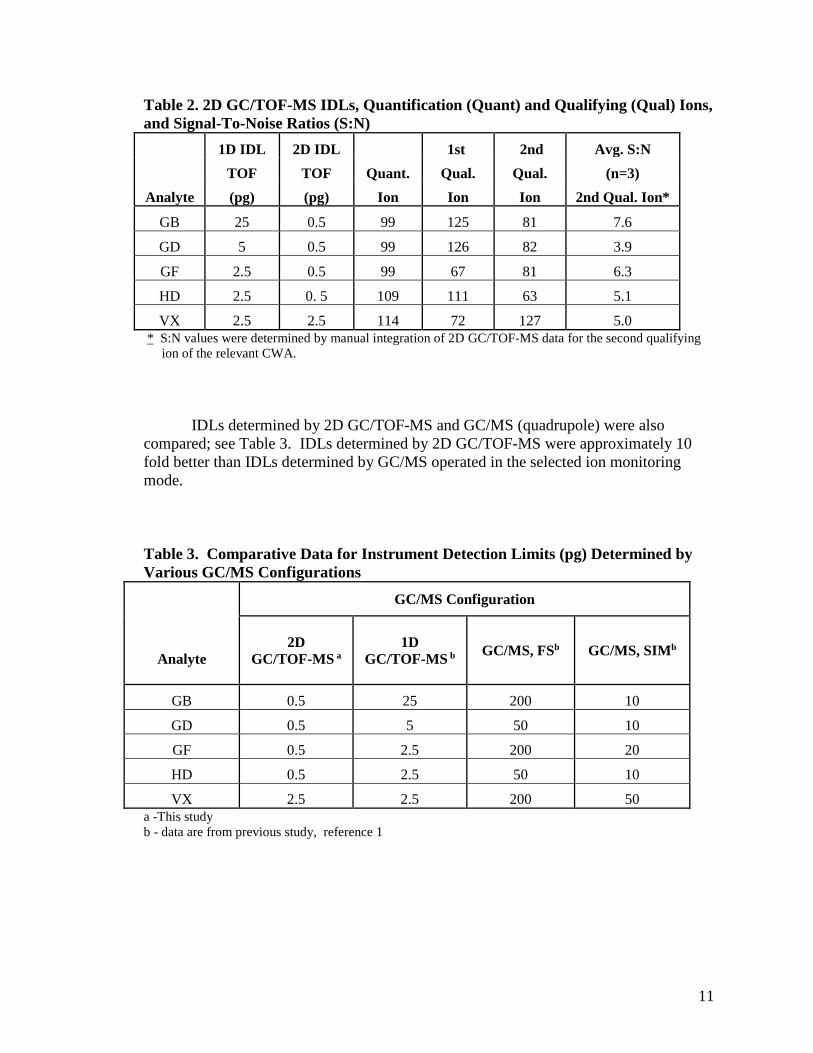
Table 2. 2D GC/TOF-MS IDLs, Quantification (Quant) and Qualifying (Qual) Ions, and Signal-To-Noise Ratios (S:N)
1D IDL 2D IDL 1st 2nd Avg. S:N TOF TOF Quant. Qual. Qual. (n=3)
Analyte (pg) (pg) Ion Ion Ion 2nd Qual. Ion*
GB 25 0.5 99 125 81 7.6
GD 5 0.5 99 126 82 3.9
GF 2.5 0.5 99 67 81 6.3
HD 2.5 0. 5 109 111 63 5.1
VX 2.5 2.5 114 72 127 5.0 * S:N values were determined by manual integration of 2D GC/TOF-MS data for the second qualifying
ion of the relevant CWA.
IDLs determined by 2D GC/TOF-MS and GC/MS (quadrupole) were also compared; see Table 3. IDLs determined by 2D GC/TOF-MS were approximately 10 fold better than IDLs determined by GC/MS operated in the selected ion monitoring mode.
Table 3. Comparative Data for Instrument Detection Limits (pg) Determined by Various GC/MS Configurations
Analyte
GC/MS Configuration
2D GC/TOF-MS a
1D
GC/TOF-MS
b GC/MS, FSb GC/MS, SIMb
GB 0.5 25 200 10
GD 0.5 5 50 10
GF 0.5 2.5 200 20
HD 0.5 2.5 50 10
VX 2.5 2.5 200 50 a -This study b - data are from previous study, reference 1
12
4.3 VX calibration One goal of this study was to determine if 2D GC/TOF-MS would eliminate
problems, such as anomalously high recoveries, encountered when quantifying VX using quadrupole GC/MS. For this reason, 2D GC/TOF-MS studies focused exclusively on the quantification of VX. A calibration curve for VX was established in a manner that was consistent with instructions of the CWA protocol under development and EPA Method 8000 C (4) and used to measure the amount of VX in sample extracts. The concentrations of VX in selected sample extracts were determined by 2D GC/TOF-MS and, then, compared with the concentrations measured, for the same extracts, by quadrupole GC/MS.
The first step in comparative analyses was calibrating the GC/TOF-MS for VX measurement. When performing VX calibration, phenanthrene-d10 was used as an internal standard. The calibration range was 0.1 to 2 µg/mL and five points within this range were used to define the calibration curve. The average of the relative response factors (RRFs) over the calibration range was 0.102 and the percent relative standard deviation (RSD) of the RRFs was 35.3%. Quantification of VX by RRFs could not be used because the calculated RSD was 35.3%, a violation of EPA Method 8000C, Section 9.3.1, which states that “the criteria for linearity of an initial calibration curve based on the average of the response factors is an RSD of <20% for each compound that is included in the calibration.” Instead, linear regression, which provided an R2 value of 0.99989 for five calibration levels, was used. This approach was deemed acceptable as Method 8000C requires R2 > 0.99. Using this regression, the concentrations of the individual VX standards were determined and compared with their known amounts. In all cases, calculated concentrations were within 5% of their expected values (percent differences over the calibration range were 0.02 – 4.7%). It should be noted that the calibration range for VX was chosen to bracket the concentrations of VX expected to be in the sample extracts. Note also that the concentrations of VX selected were sufficiently high so as to be detected by GC/MS.
4.4 Measurements of VX in sample extracts In previous studies, high recoveries of VX (>300%) have been observed when
performing experiments in which VX was spiked on and extracted from different surfaces. It has been speculated that high VX recoveries could be attributed to interfering compounds present in the sample matrices and/or to matrix enhancement effects (e.g., matrix components shielding active sites in the injection port or GC column of the analytical system). Because of its greater chromatographic resolution over a single-column GC separation, the use of 2D GC/TOF-MS offered the opportunity to investigate the possibility of interference(s) that co-eluted with VX during a conventional GC separation.
Selected problematic matrices (identical to those used in previous studies that consistently showed recoveries of greater than 100% for VX) were spiked with VX (from a dichloromethane solution), extracted using procedures described in Section 3.2, and analyzed using the 2D GC/TOF-MS. Sample extracts were also analyzed by quadrupole
13
GC/MS. The matrices studied included samples of spiked wipes, Virginia soil, and drywall. VX concentrations determined by 2D GC/TOF-MS and GC/MS were compared.
The first matrix examined was Virginia soil. Three 10-g aliquots of this soil were
spiked with 1 µg of VX (i.e., 0.1 µg VX per gram of soil), extracted, and analyzed by both 2D GC/TOF-MS and GC/MS. The soil extracts were also analyzed by 1D GC/TOF-MS approximately three weeks after extraction. The VX concentration in soil as determined by 2D GC/TOF-MS was 104 ng ± 4 ng (n=3 replicates) and by GC/MS (SIM) was 147 ng ± 8 ng (n=3 replicates). Using the Student’s t-test, at a significance level of α=0.05, p value=0.11, the hypothesis that the VX concentrations measured by 2D GC/TOF-MS and by GC/MS are equivalent is rejected (i.e., the concentration of VX in Virginia soil measured by GC/MS is higher than that measured by 2D GC/TOF-MS).
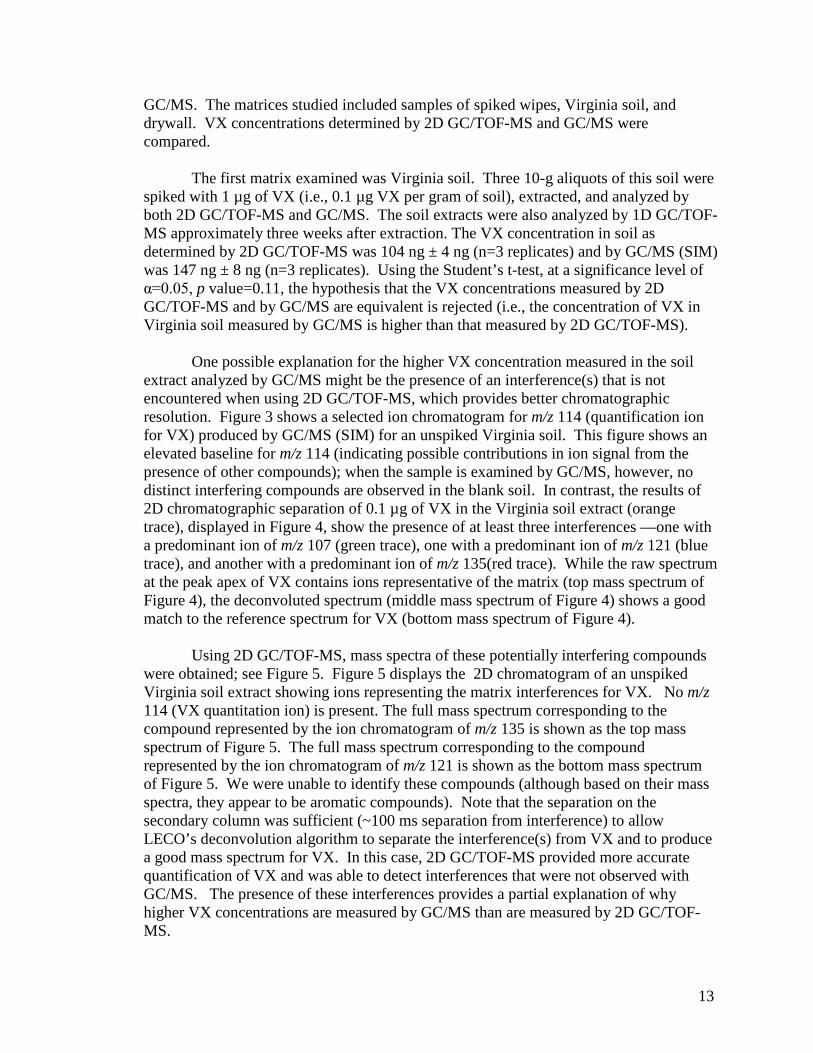
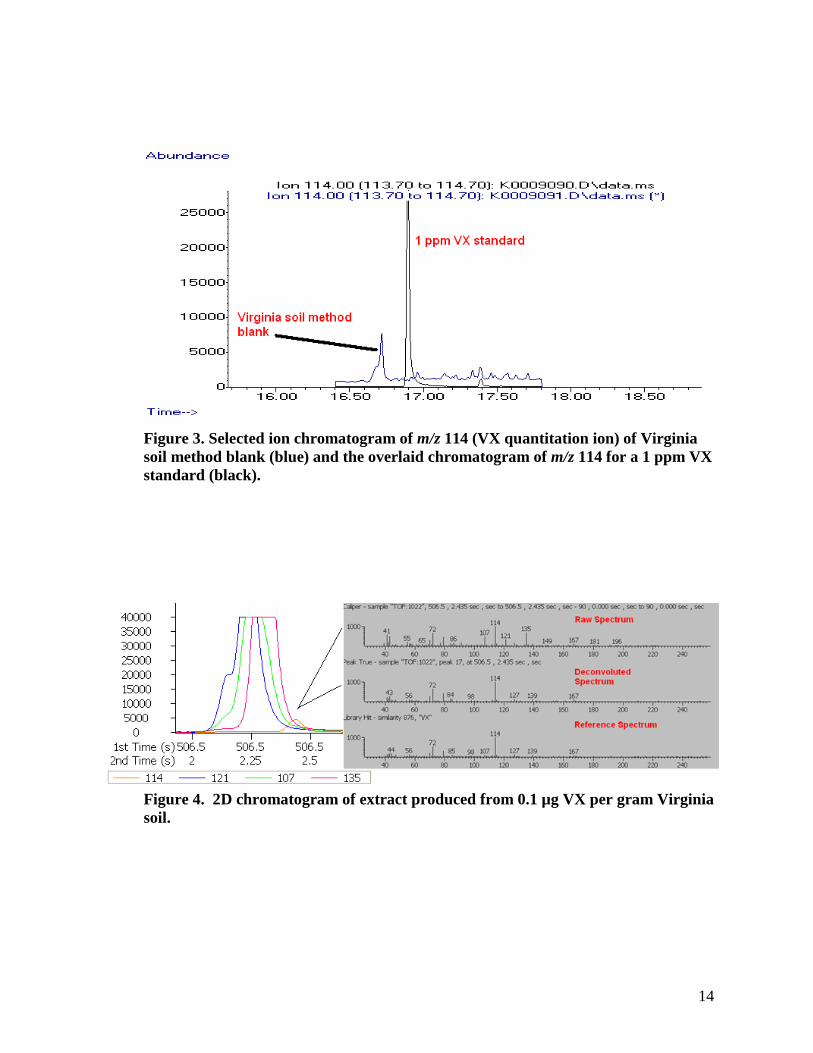
One possible explanation for the higher VX concentration measured in the soil extract analyzed by GC/MS might be the presence of an interference(s) that is not encountered when using 2D GC/TOF-MS, which provides better chromatographic resolution. Figure 3 shows a selected ion chromatogram for m/z 114 (quantification ion for VX) produced by GC/MS (SIM) for an unspiked Virginia soil. This figure shows an elevated baseline for m/z 114 (indicating possible contributions in ion signal from the presence of other compounds); when the sample is examined by GC/MS, however, no distinct interfering compounds are observed in the blank soil. In contrast, the results of 2D chromatographic separation of 0.1 µg of VX in the Virginia soil extract (orange trace), displayed in Figure 4, show the presence of at least three interferences —one with a predominant ion of m/z 107 (green trace), one with a predominant ion of m/z 121 (blue trace), and another with a predominant ion of m/z 135(red trace). While the raw spectrum at the peak apex of VX contains ions representative of the matrix (top mass spectrum of Figure 4), the deconvoluted spectrum (middle mass spectrum of Figure 4) shows a good match to the reference spectrum for VX (bottom mass spectrum of Figure 4).
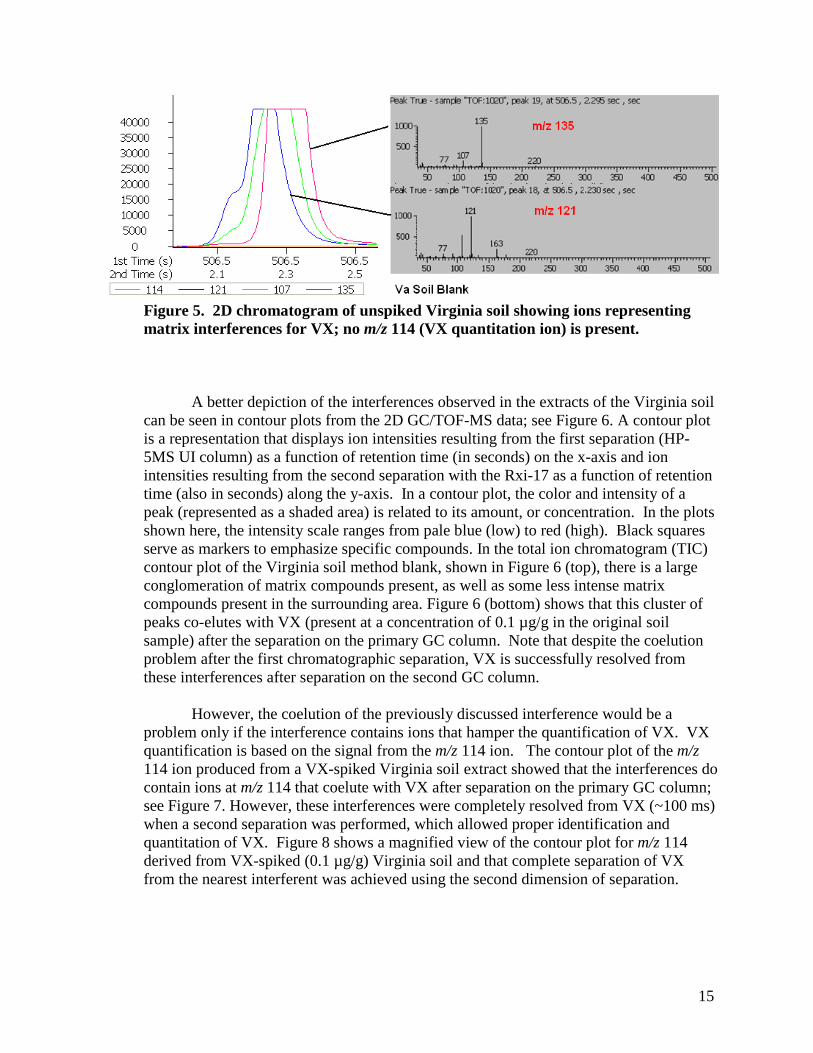
Using 2D GC/TOF-MS, mass spectra of these potentially interfering compounds were obtained; see Figure 5. Figure 5 displays the 2D chromatogram of an unspiked Virginia soil extract showing ions representing the matrix interferences for VX. No m/z 114 (VX quantitation ion) is present. The full mass spectrum corresponding to the compound represented by the ion chromatogram of m/z 135 is shown as the top mass spectrum of Figure 5. The full mass spectrum corresponding to the compound represented by the ion chromatogram of m/z 121 is shown as the bottom mass spectrum of Figure 5. We were unable to identify these compounds (although based on their mass spectra, they appear to be aromatic compounds). Note that the separation on the secondary column was sufficient (~100 ms separation from interference) to allow LECO’s deconvolution algorithm to separate the interference(s) from VX and to produce a good mass spectrum for VX. In this case, 2D GC/TOF-MS provided more accurate quantification of VX and was able to detect interferences that were not observed with GC/MS. The presence of these interferences provides a partial explanation of why higher VX concentrations are measured by GC/MS than are measured by 2D GC/TOF-MS.
14
Figure 3. Selected ion chromatogram of m/z 114 (VX quantitation ion) of Virginia soil method blank (blue) and the overlaid chromatogram of m/z 114 for a 1 ppm VX standard (black).
Figure 4. 2D chromatogram of extract produced from 0.1 µg VX per gram Virginia soil.
15
Figure 5. 2D chromatogram of unspiked Virginia soil showing ions representing matrix interferences for VX; no m/z 114 (VX quantitation ion) is present.
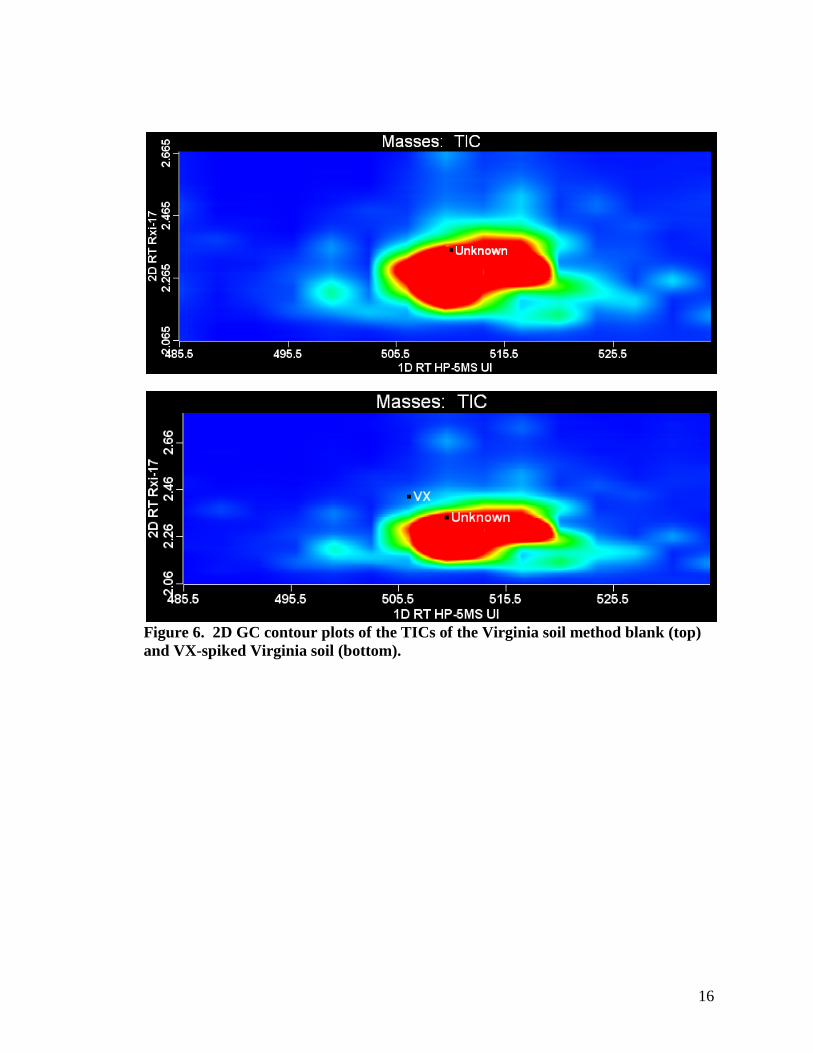
A better depiction of the interferences observed in the extracts of the Virginia soil can be seen in contour plots from the 2D GC/TOF-MS data; see Figure 6. A contour plot is a representation that displays ion intensities resulting from the first separation (HP-5MS UI column) as a function of retention time (in seconds) on the x-axis and ion intensities resulting from the second separation with the Rxi-17 as a function of retention time (also in seconds) along the y-axis. In a contour plot, the color and intensity of a peak (represented as a shaded area) is related to its amount, or concentration. In the plots shown here, the intensity scale ranges from pale blue (low) to red (high). Black squares serve as markers to emphasize specific compounds. In the total ion chromatogram (TIC) contour plot of the Virginia soil method blank, shown in Figure 6 (top), there is a large conglomeration of matrix compounds present, as well as some less intense matrix compounds present in the surrounding area. Figure 6 (bottom) shows that this cluster of peaks co-elutes with VX (present at a concentration of 0.1 µg/g in the original soil sample) after the separation on the primary GC column. Note that despite the coelution problem after the first chromatographic separation, VX is successfully resolved from these interferences after separation on the second GC column.
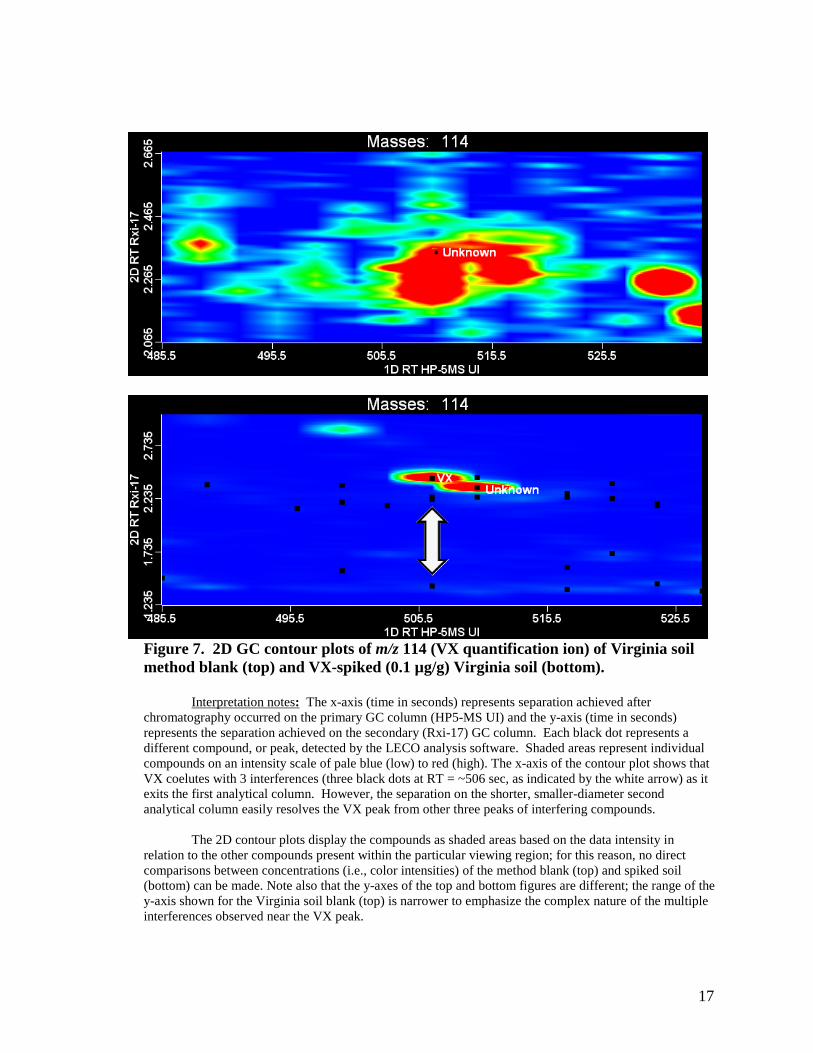
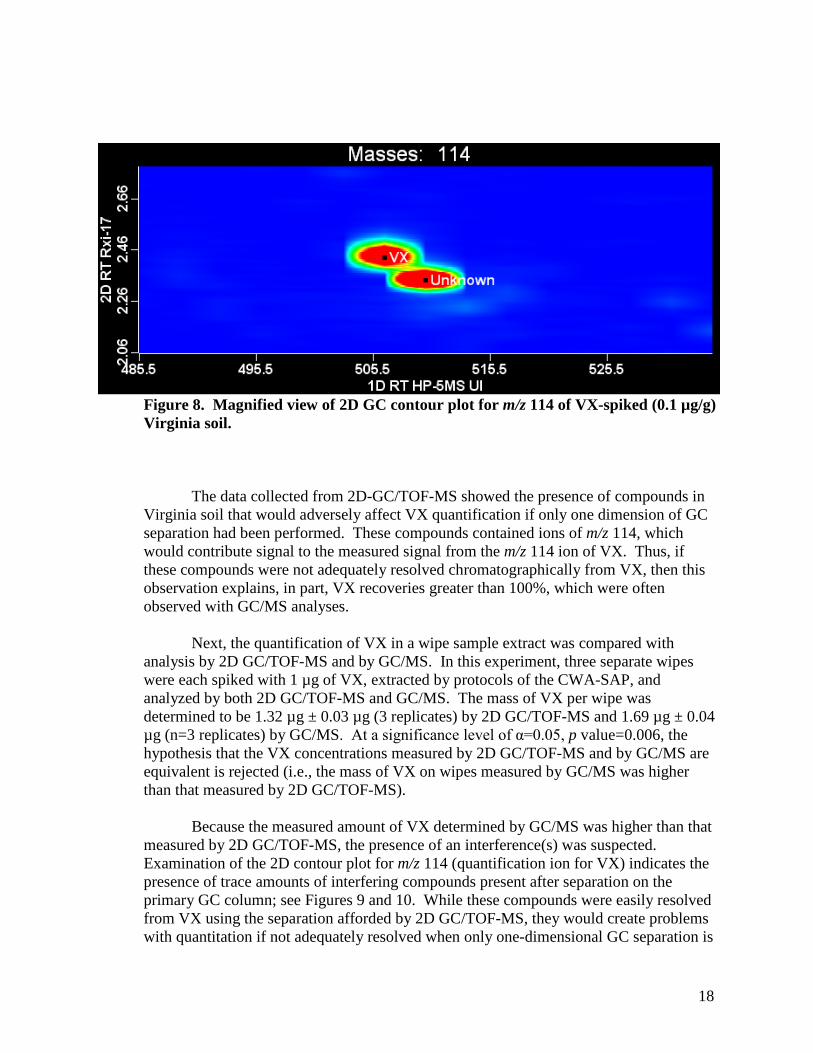
However, the coelution of the previously discussed interference would be a problem only if the interference contains ions that hamper the quantification of VX. VX quantification is based on the signal from the m/z 114 ion. The contour plot of the m/z 114 ion produced from a VX-spiked Virginia soil extract showed that the interferences do contain ions at m/z 114 that coelute with VX after separation on the primary GC column; see Figure 7. However, these interferences were completely resolved from VX (~100 ms) when a second separation was performed, which allowed proper identification and quantitation of VX. Figure 8 shows a magnified view of the contour plot for m/z 114 derived from VX-spiked (0.1 µg/g) Virginia soil and that complete separation of VX from the nearest interferent was achieved using the second dimension of separation.
16
Figure 6. 2D GC contour plots of the TICs of the Virginia soil method blank (top) and VX-spiked Virginia soil (bottom).
17
Figure 7. 2D GC contour plots of m/z 114 (VX quantification ion) of Virginia soil method blank (top) and VX-spiked (0.1 µg/g) Virginia soil (bottom).
Interpretation notes: The x-axis (time in seconds) represents separation achieved after
chromatography occurred on the primary GC column (HP5-MS UI) and the y-axis (time in seconds) represents the separation achieved on the secondary (Rxi-17) GC column. Each black dot represents a different compound, or peak, detected by the LECO analysis software. Shaded areas represent individual compounds on an intensity scale of pale blue (low) to red (high). The x-axis of the contour plot shows that VX coelutes with 3 interferences (three black dots at RT = ~506 sec, as indicated by the white arrow) as it exits the first analytical column. However, the separation on the shorter, smaller-diameter second analytical column easily resolves the VX peak from other three peaks of interfering compounds.
The 2D contour plots display the compounds as shaded areas based on the data intensity in relation to the other compounds present within the particular viewing region; for this reason, no direct comparisons between concentrations (i.e., color intensities) of the method blank (top) and spiked soil (bottom) can be made. Note also that the y-axes of the top and bottom figures are different; the range of the y-axis shown for the Virginia soil blank (top) is narrower to emphasize the complex nature of the multiple interferences observed near the VX peak.
18
Figure 8. Magnified view of 2D GC contour plot for m/z 114 of VX-spiked (0.1 µg/g) Virginia soil.
The data collected from 2D-GC/TOF-MS showed the presence of compounds in Virginia soil that would adversely affect VX quantification if only one dimension of GC separation had been performed. These compounds contained ions of m/z 114, which would contribute signal to the measured signal from the m/z 114 ion of VX. Thus, if these compounds were not adequately resolved chromatographically from VX, then this observation explains, in part, VX recoveries greater than 100%, which were often observed with GC/MS analyses.
Next, the quantification of VX in a wipe sample extract was compared with analysis by 2D GC/TOF-MS and by GC/MS. In this experiment, three separate wipes were each spiked with 1 µg of VX, extracted by protocols of the CWA-SAP, and analyzed by both 2D GC/TOF-MS and GC/MS. The mass of VX per wipe was determined to be 1.32 µg ± 0.03 µg (3 replicates) by 2D GC/TOF-MS and 1.69 µg ± 0.04 µg (n=3 replicates) by GC/MS. At a significance level of α=0.05, p value=0.006, the hypothesis that the VX concentrations measured by 2D GC/TOF-MS and by GC/MS are equivalent is rejected (i.e., the mass of VX on wipes measured by GC/MS was higher than that measured by 2D GC/TOF-MS).
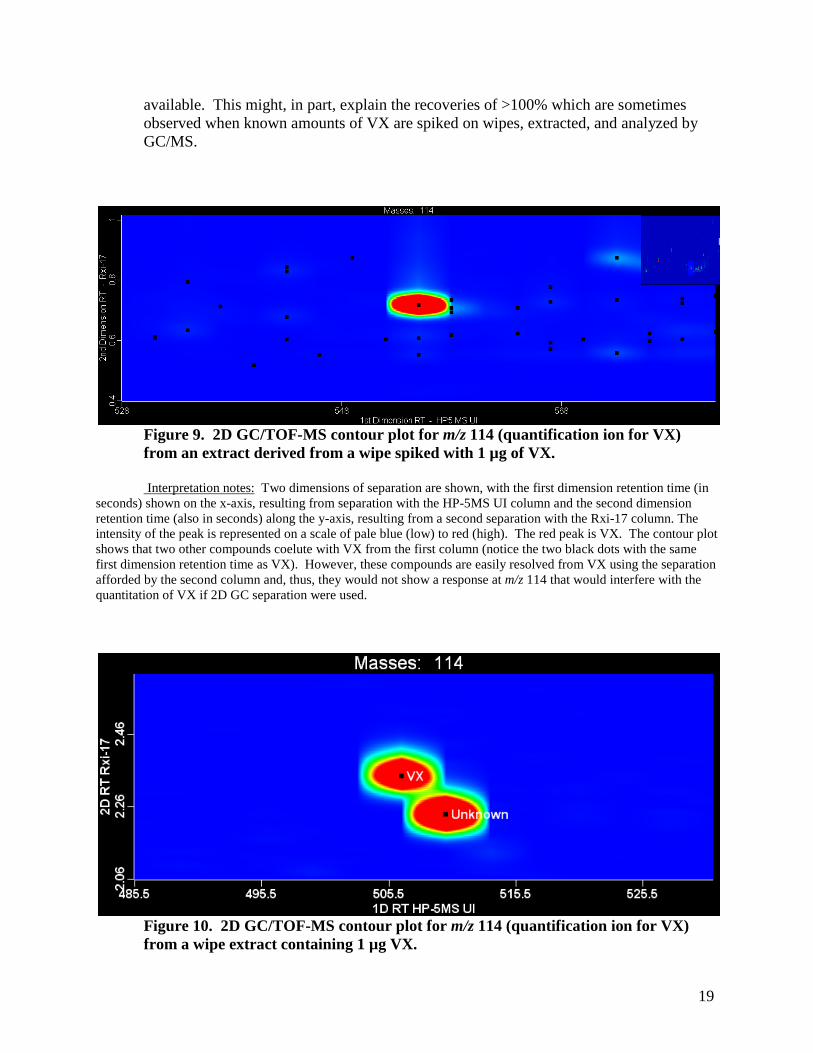
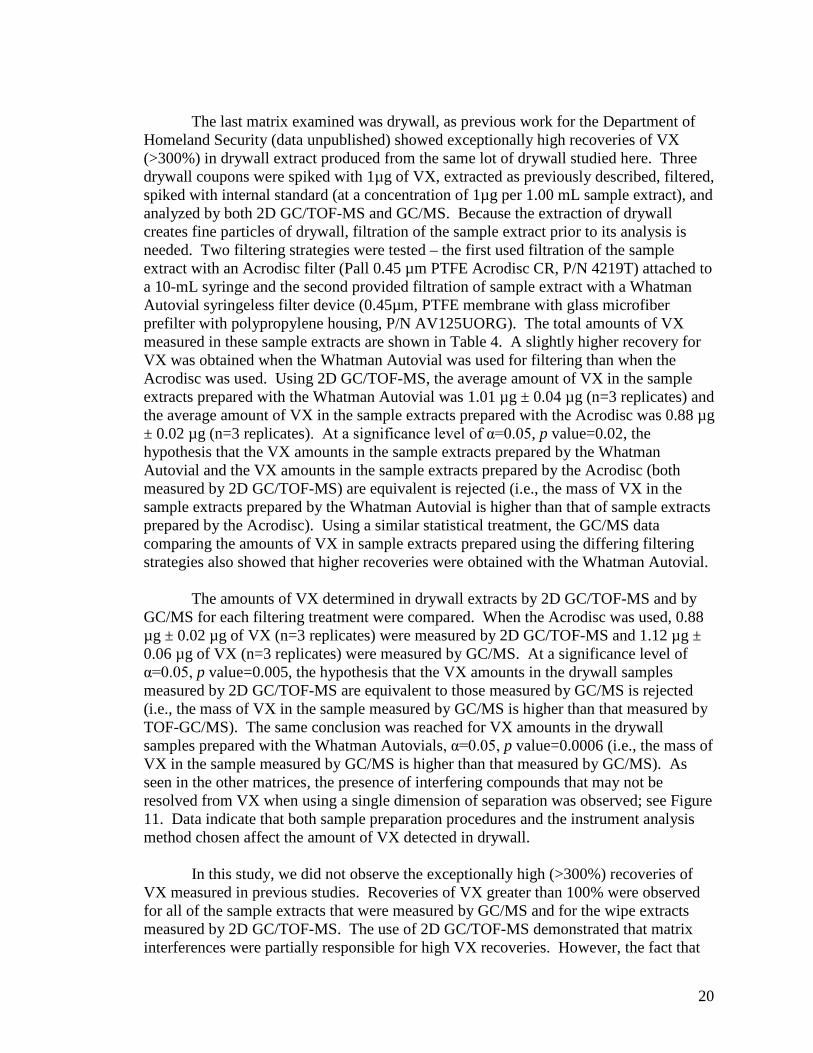
Because the measured amount of VX determined by GC/MS was higher than that measured by 2D GC/TOF-MS, the presence of an interference(s) was suspected. Examination of the 2D contour plot for m/z 114 (quantification ion for VX) indicates the presence of trace amounts of interfering compounds present after separation on the primary GC column; see Figures 9 and 10. While these compounds were easily resolved from VX using the separation afforded by 2D GC/TOF-MS, they would create problems with quantitation if not adequately resolved when only one-dimensional GC separation is
19
available. This might, in part, explain the recoveries of >100% which are sometimes observed when known amounts of VX are spiked on wipes, extracted, and analyzed by GC/MS.
Figure 9. 2D GC/TOF-MS contour plot for m/z 114 (quantification ion for VX) from an extract derived from a wipe spiked with 1 µg of VX.
Interpretation notes: Two dimensions of separation are shown, with the first dimension retention time (in seconds) shown on the x-axis, resulting from separation with the HP-5MS UI column and the second dimension retention time (also in seconds) along the y-axis, resulting from a second separation with the Rxi-17 column. The intensity of the peak is represented on a scale of pale blue (low) to red (high). The red peak is VX. The contour plot shows that two other compounds coelute with VX from the first column (notice the two black dots with the same first dimension retention time as VX). However, these compounds are easily resolved from VX using the separation afforded by the second column and, thus, they would not show a response at m/z 114 that would interfere with the quantitation of VX if 2D GC separation were used.
Figure 10. 2D GC/TOF-MS contour plot for m/z 114 (quantification ion for VX) from a wipe extract containing 1 µg VX.
20
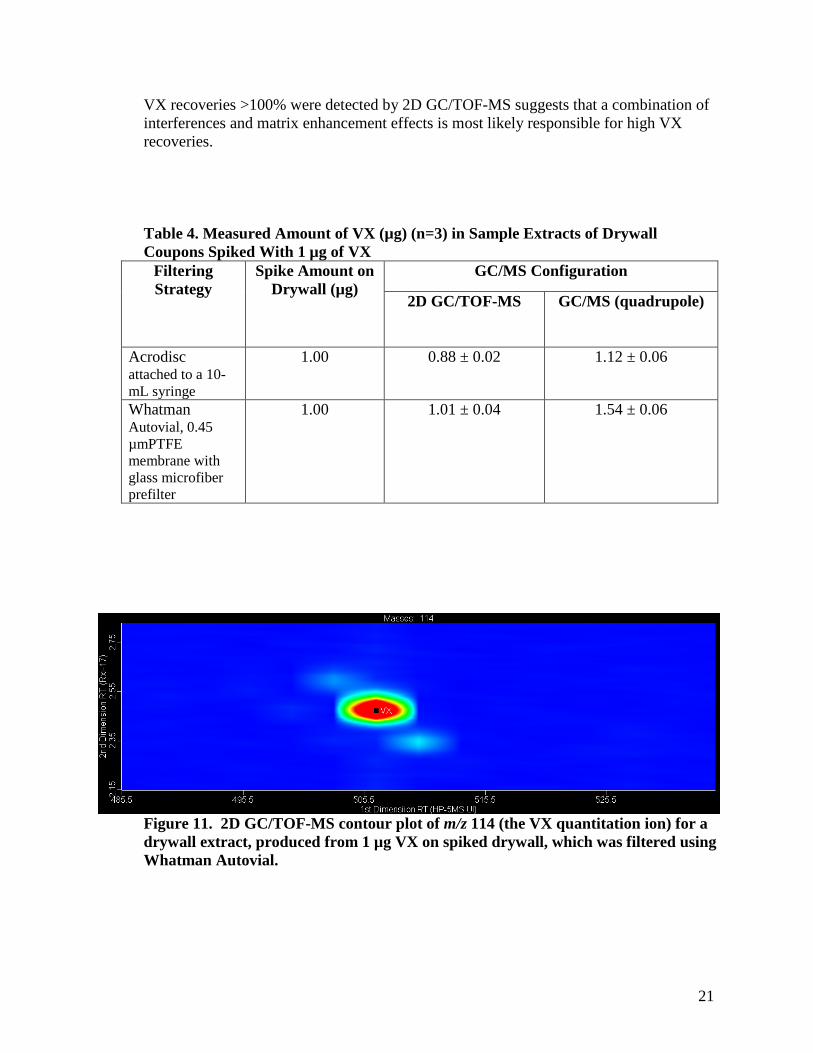
The last matrix examined was drywall, as previous work for the Department of
Homeland Security (data unpublished) showed exceptionally high recoveries of VX (>300%) in drywall extract produced from the same lot of drywall studied here. Three drywall coupons were spiked with 1µg of VX, extracted as previously described, filtered, spiked with internal standard (at a concentration of 1µg per 1.00 mL sample extract), and analyzed by both 2D GC/TOF-MS and GC/MS. Because the extraction of drywall creates fine particles of drywall, filtration of the sample extract prior to its analysis is needed. Two filtering strategies were tested – the first used filtration of the sample extract with an Acrodisc filter (Pall 0.45 µm PTFE Acrodisc CR, P/N 4219T) attached to a 10-mL syringe and the second provided filtration of sample extract with a Whatman Autovial syringeless filter device (0.45µm, PTFE membrane with glass microfiber prefilter with polypropylene housing, P/N AV125UORG). The total amounts of VX measured in these sample extracts are shown in Table 4. A slightly higher recovery for VX was obtained when the Whatman Autovial was used for filtering than when the Acrodisc was used. Using 2D GC/TOF-MS, the average amount of VX in the sample extracts prepared with the Whatman Autovial was 1.01 µg ± 0.04 µg (n=3 replicates) and the average amount of VX in the sample extracts prepared with the Acrodisc was 0.88 µg ± 0.02 µg (n=3 replicates). At a significance level of α=0.05, p value=0.02, the hypothesis that the VX amounts in the sample extracts prepared by the Whatman Autovial and the VX amounts in the sample extracts prepared by the Acrodisc (both measured by 2D GC/TOF-MS) are equivalent is rejected (i.e., the mass of VX in the sample extracts prepared by the Whatman Autovial is higher than that of sample extracts prepared by the Acrodisc). Using a similar statistical treatment, the GC/MS data comparing the amounts of VX in sample extracts prepared using the differing filtering strategies also showed that higher recoveries were obtained with the Whatman Autovial.
The amounts of VX determined in drywall extracts by 2D GC/TOF-MS and by GC/MS for each filtering treatment were compared. When the Acrodisc was used, 0.88 µg ± 0.02 µg of VX (n=3 replicates) were measured by 2D GC/TOF-MS and 1.12 µg ± 0.06 µg of VX (n=3 replicates) were measured by GC/MS. At a significance level of α=0.05, p value=0.005, the hypothesis that the VX amounts in the drywall samples measured by 2D GC/TOF-MS are equivalent to those measured by GC/MS is rejected (i.e., the mass of VX in the sample measured by GC/MS is higher than that measured by TOF-GC/MS). The same conclusion was reached for VX amounts in the drywall samples prepared with the Whatman Autovials, α=0.05, p value=0.0006 (i.e., the mass of VX in the sample measured by GC/MS is higher than that measured by GC/MS). As seen in the other matrices, the presence of interfering compounds that may not be resolved from VX when using a single dimension of separation was observed; see Figure 11. Data indicate that both sample preparation procedures and the instrument analysis method chosen affect the amount of VX detected in drywall.
In this study, we did not observe the exceptionally high (>300%) recoveries of VX measured in previous studies. Recoveries of VX greater than 100% were observed for all of the sample extracts that were measured by GC/MS and for the wipe extracts measured by 2D GC/TOF-MS. The use of 2D GC/TOF-MS demonstrated that matrix interferences were partially responsible for high VX recoveries. However, the fact that
21
VX recoveries >100% were detected by 2D GC/TOF-MS suggests that a combination of interferences and matrix enhancement effects is most likely responsible for high VX recoveries.
Table 4. Measured Amount of VX (µg) (n=3) in Sample Extracts of Drywall Coupons Spiked With 1 µg of VX
Filtering Strategy
Spike Amount on Drywall (µg)
GC/MS Configuration
2D GC/TOF-MS GC/MS (quadrupole)
Acrodisc attached to a 10-mL syringe
1.00 0.88 ± 0.02 1.12 ± 0.06
Whatman Autovial, 0.45 µmPTFE membrane with glass microfiber prefilter
1.00 1.01 ± 0.04 1.54 ± 0.06
Figure 11. 2D GC/TOF-MS contour plot of m/z 114 (the VX quantitation ion) for a drywall extract, produced from 1 µg VX on spiked drywall, which was filtered using Whatman Autovial.
22
5.0 Conclusions and Recommendations
2D GC/TOF-MS was found to be a useful tool for the analysis of CWAs, and VX specifically. Advantages of 2D GC/TOF-MS include low CWA detection limits (0.5 − 5 pg for the CWAs studied) and the retention of complete mass spectral data for each compound detected, which provides greater confidence in analyte identifications. Because of its fast data acquisition rate, a TOF-MS is ideal to couple with two-dimensional GC separations, which offer the opportunity to resolve interferences present in complex matrices from quantitation ions. Potential disadvantages of 2D GC/TOF-MS, as compared to quadrupole GC/MS, include the higher level of training needed for the instrument operator, the more complex instrument hardware (i.e., the modulator and liquid nitrogen needed to provide 2D separations), the less-developed data analysis software, and the greater initial cost of instrumentation ($215,000 versus $85,000).
In this study, the quantification of VX was investigated using 2D GC/TOF-MS. Quantification was found to be reproducible and linear from VX concentrations of 0.1 to 2 µg/mL. 2D GC/TOF-MS consistently measured VX concentrations that were significantly lower than those determined by VX for spiked soil, wipe, and drywall samples. Examination of 2D contour plots for these samples showed the presence of interferences possessing ions of m/z 114, which interfered with accurate VX quantitation (VX has a quantitation ion of m/z 114). VX quantification was affected by interferences when separation on a single HP-5MS UI GC column was performed. However, the use of the Rxi-17 column to provide a second (2D) GC separation was shown to sufficiently resolve VX from these interferences. Thus, the recommendation is that 2D GC/TOF-MS be used to detect and quantify VX whenever interferences are suspected when only a single chromatographic separation is performed. 6.0 References 1. Experiments with the LECO Pegasus® Gas Chromatograph/Time-of-Flight Mass
Spectrometer Phase 1: Fast GC Separations and Comparison of the GC/TOF-MS with Conventional Quadrupole GC/MS and Fast Quadrupole GC/MS, Rev. 1.0, Heather Mulcahy, Carolyn Koester, and Roald Leif, March 11, 2010, LLNL-TR-420785.
2. Verification of Methods for Selected Chemical Warfare Agents (CWAs), Rev. 4, Heather Mulcahy, Roald Leif, and Carolyn Koester, December 18, 2009, LLNL-TR-415101.
3. Quality Assurance Project Plan and Study Plan for Lawrence Livermore National Laboratory’s Experiments with the LECO Pegasus® Gas Chromatograph/Time-of-Flight Mass Spectrometer for EPA under IAG #DW89922616-01-0, Revision 1.5, LLNL-TR-408100, Carolyn Koester, January 23, 2009.
4. Method 8000C: Determinative Chromatographic Separations, Rev. 3, March 2003, U.S.
Environmental Protection Agency.
23
Appendix A: Autosampler Method for LECO 2D GC/TOF-MS
24
Appendix B: GC Method for LECO 2D GC/TOF-MS
25
Appendix B, continued: GC Method for LECO 2D GC/TOF-MS
26
Appendix B, continued: GC Method for LECO 2D GC/TOF-MS
27
Appendix B, continued: GC Method for LECO 2D GC/TOF-MS
28
Appendix C: MS Method for LECO 2D GC/TOF-MS
29
Appendix C, continued: MS Method for LECO 2D GC/TOF-MS

Office of Research and Development (8101R) Washington, DC 20460
Official Business Penalty for Private Use $300
PRESORTED STANDARDPOSTAGE & FEES PAID
EPAPERMIT NO. G-35