Embed Size (px)
Citation preview
Experiments
Testing hypotheses…
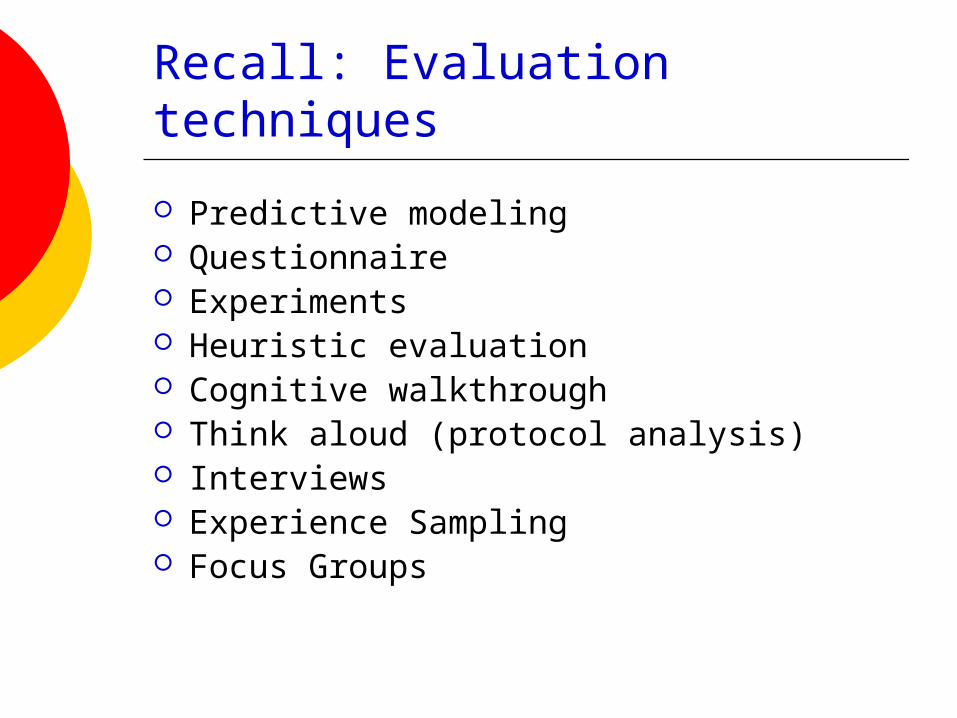
Recall: Evaluation techniques
Predictive modeling Questionnaire Experiments Heuristic evaluation Cognitive walkthrough Think aloud (protocol analysis) Interviews Experience Sampling Focus Groups
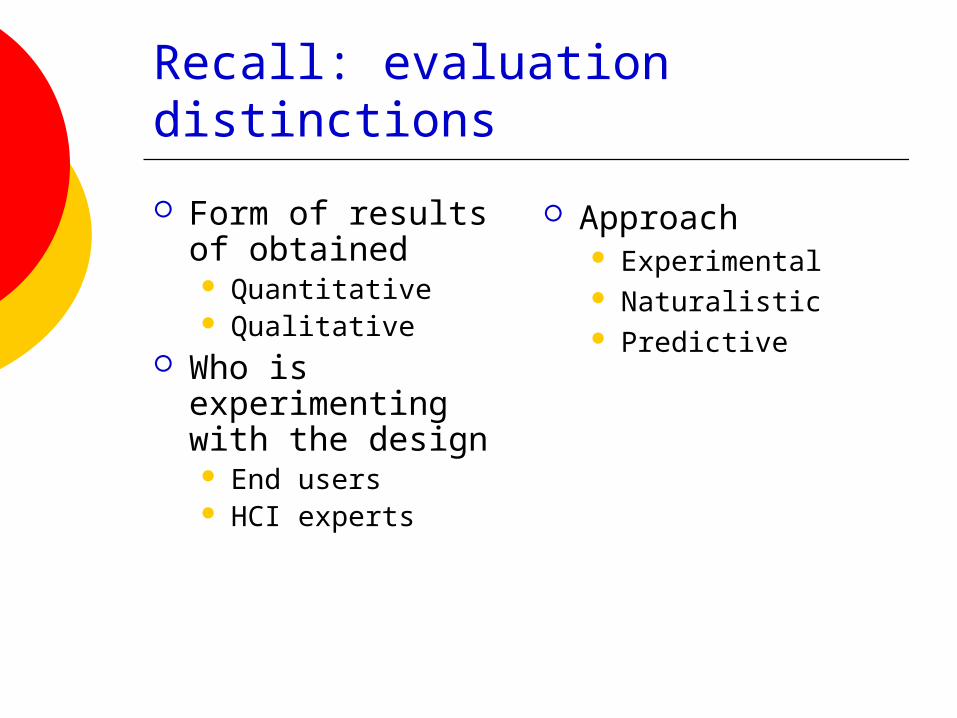
Recall: evaluation distinctions
Form of results of obtained Quantitative Qualitative
Who is experimenting with the design End users HCI experts
Approach Experimental Naturalistic Predictive
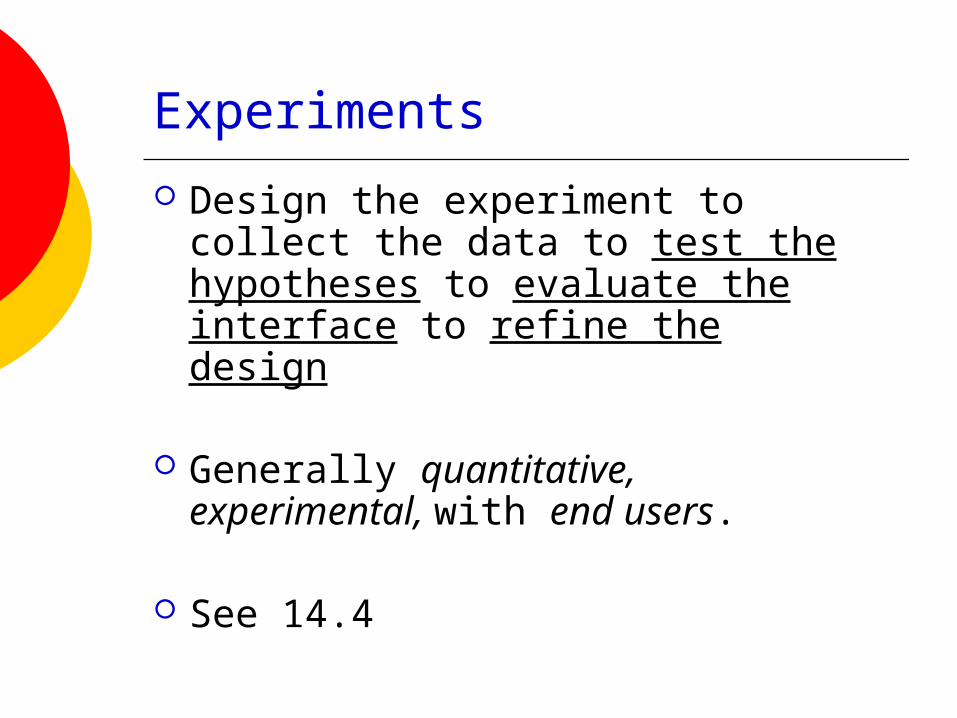
Experiments
Design the experiment to collect the data to test the hypotheses to evaluate the interface to refine the design
Generally quantitative, experimental, with end users.
See 14.4
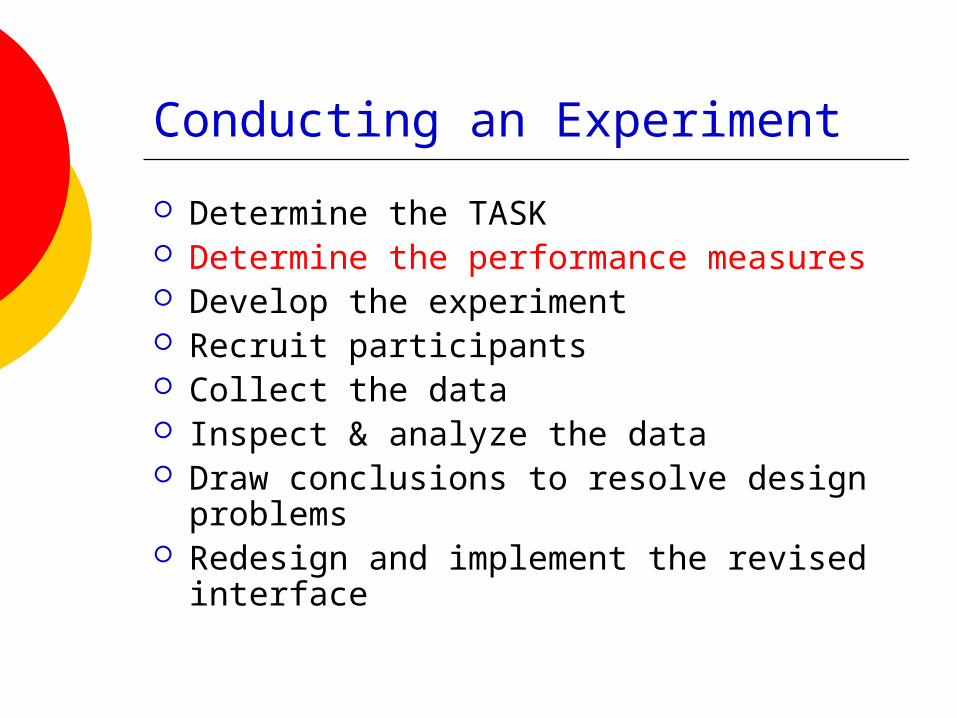
Conducting an Experiment
Determine the TASK Determine the performance measures Develop the experiment Recruit participants Collect the data Inspect & analyze the data Draw conclusions to resolve design
problems Redesign and implement the revised
interface
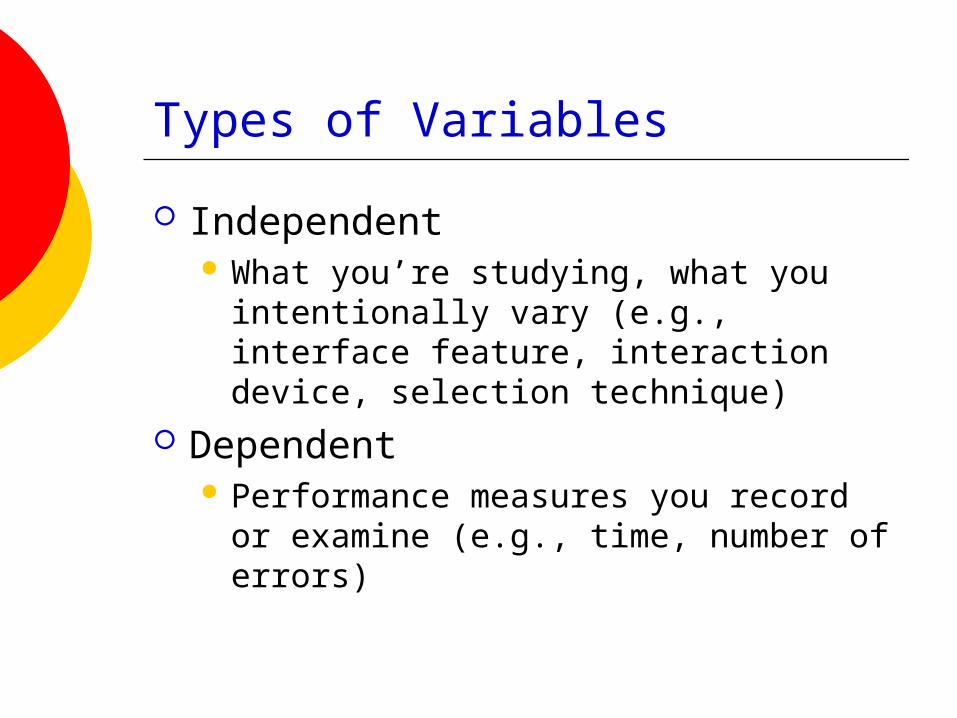
Types of Variables
Independent What you’re studying, what you
intentionally vary (e.g., interface feature, interaction device, selection technique)
Dependent Performance measures you record or
examine (e.g., time, number of errors)
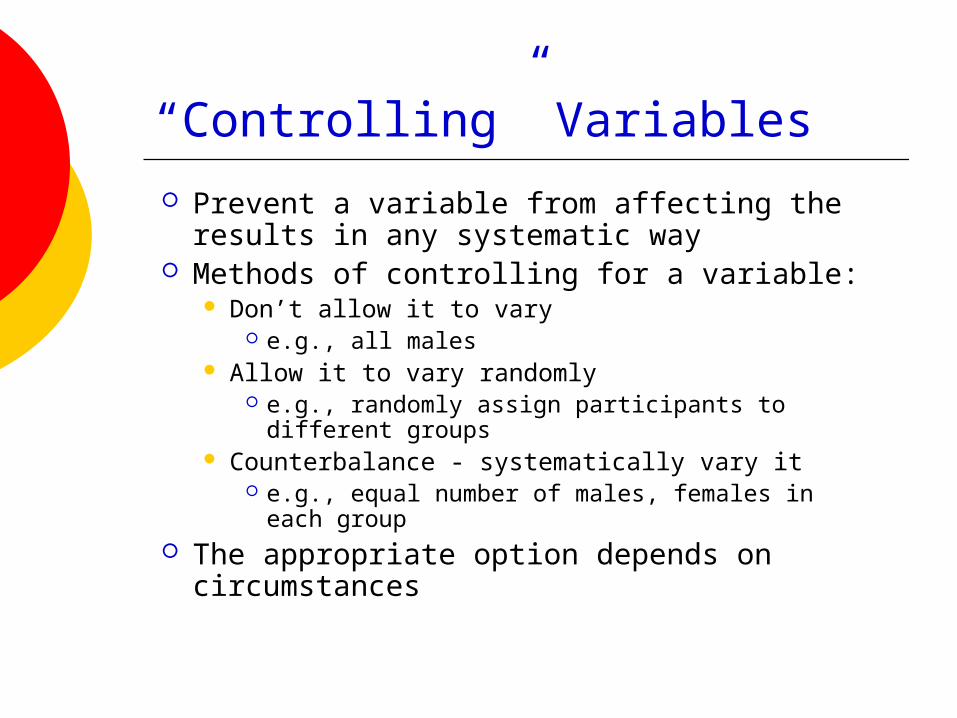
“Controlling” Variables
Prevent a variable from affecting the results in any systematic way
Methods of controlling for a variable: Don’t allow it to vary
e.g., all males Allow it to vary randomly
e.g., randomly assign participants to different groups
Counterbalance - systematically vary it e.g., equal number of males, females in each
group The appropriate option depends on
circumstances
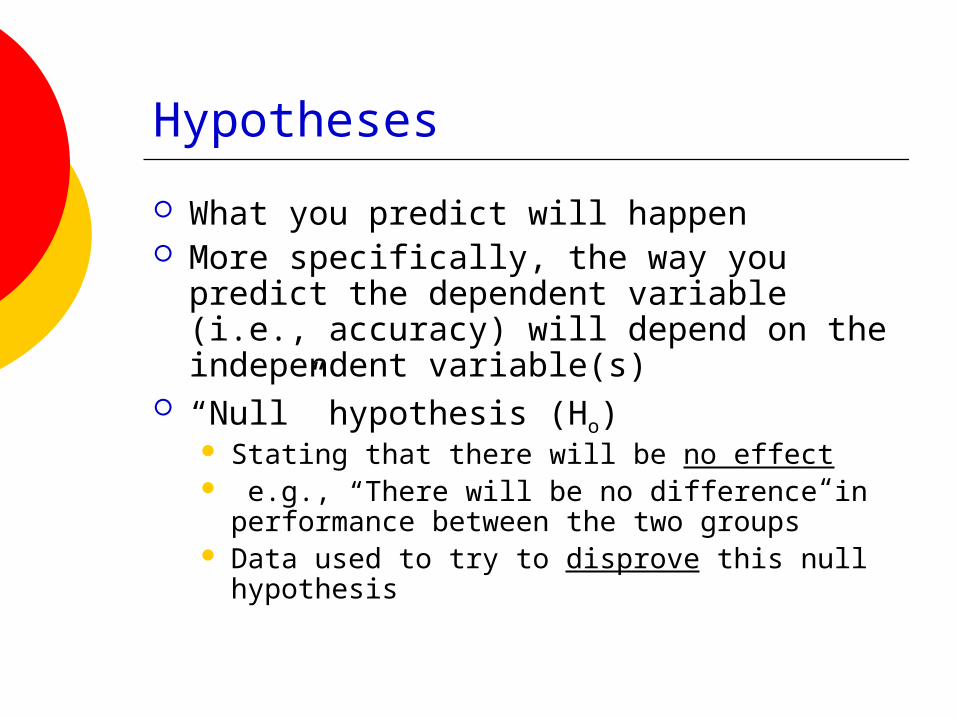
Hypotheses
What you predict will happen More specifically, the way you predict the
dependent variable (i.e., accuracy) will depend on the independent variable(s)
“Null” hypothesis (Ho) Stating that there will be no effect e.g., “There will be no difference in
performance between the two groups” Data used to try to disprove this null
hypothesis
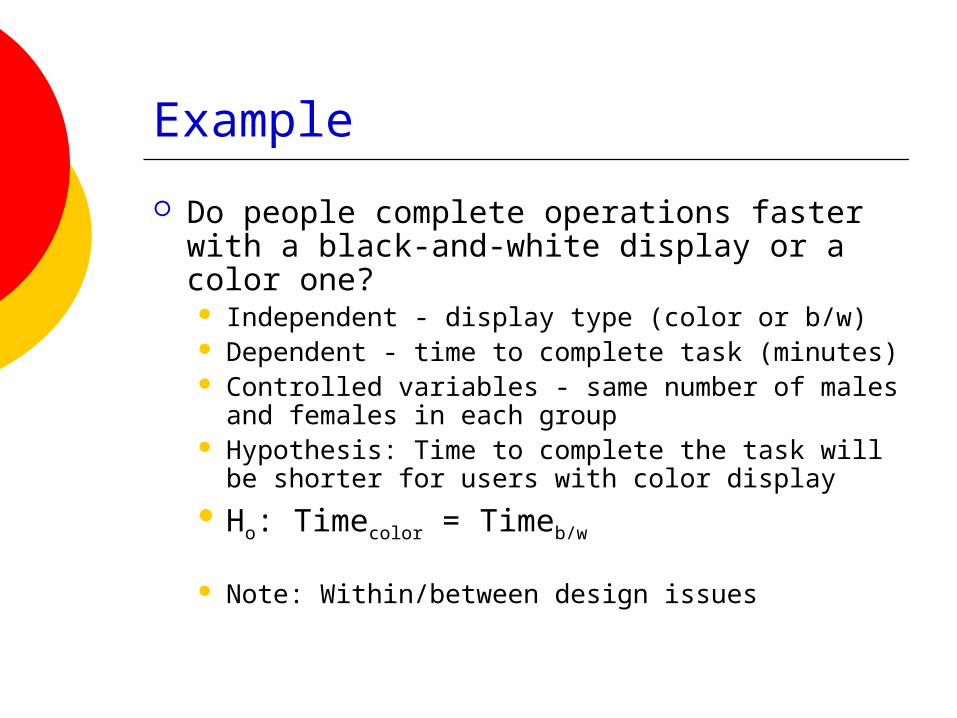
Example
Do people complete operations faster with a black-and-white display or a color one? Independent - display type (color or b/w) Dependent - time to complete task (minutes) Controlled variables - same number of males
and females in each group Hypothesis: Time to complete the task will be
shorter for users with color display Ho: Timecolor = Timeb/w
Note: Within/between design issues
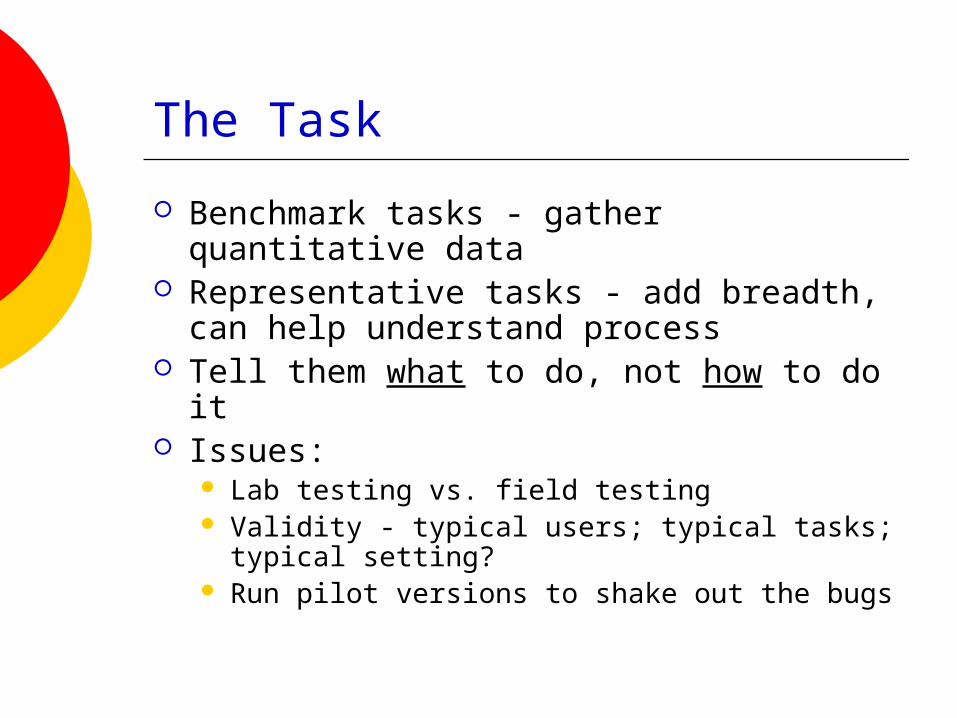
The Task
Benchmark tasks - gather quantitative data
Representative tasks - add breadth, can help understand process
Tell them what to do, not how to do it Issues:
Lab testing vs. field testing Validity - typical users; typical tasks; typical
setting? Run pilot versions to shake out the bugs
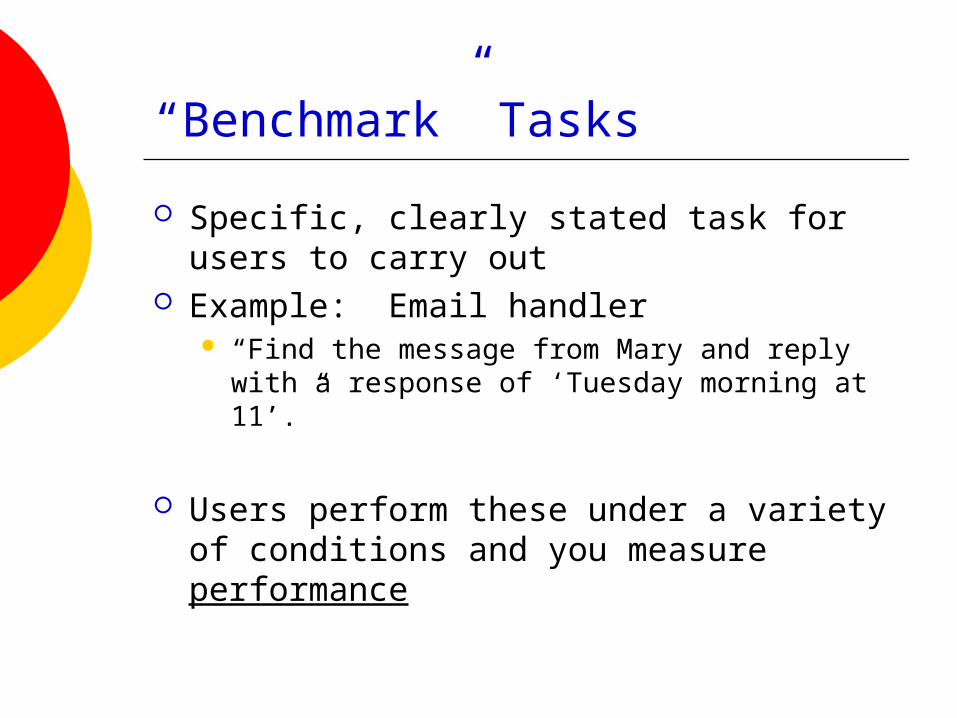
“Benchmark” Tasks
Specific, clearly stated task for users to carry out
Example: Email handler “Find the message from Mary and reply with a
response of ‘Tuesday morning at 11’.”
Users perform these under a variety of conditions and you measure performance
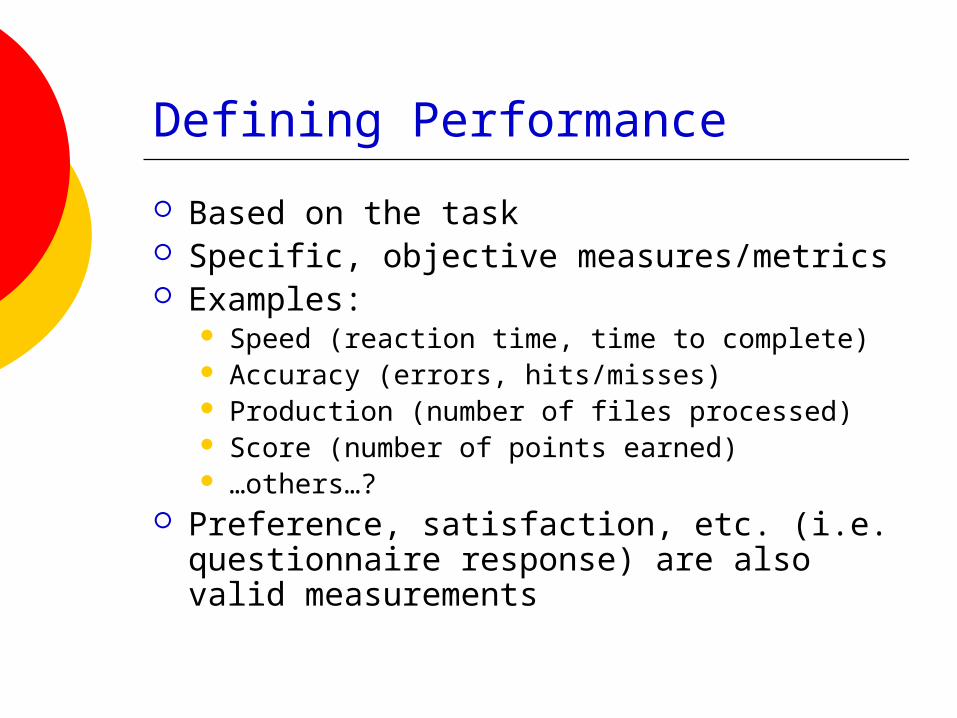
Defining Performance
Based on the task Specific, objective measures/metrics Examples:
Speed (reaction time, time to complete) Accuracy (errors, hits/misses) Production (number of files processed) Score (number of points earned) …others…?
Preference, satisfaction, etc. (i.e. questionnaire response) are also valid measurements
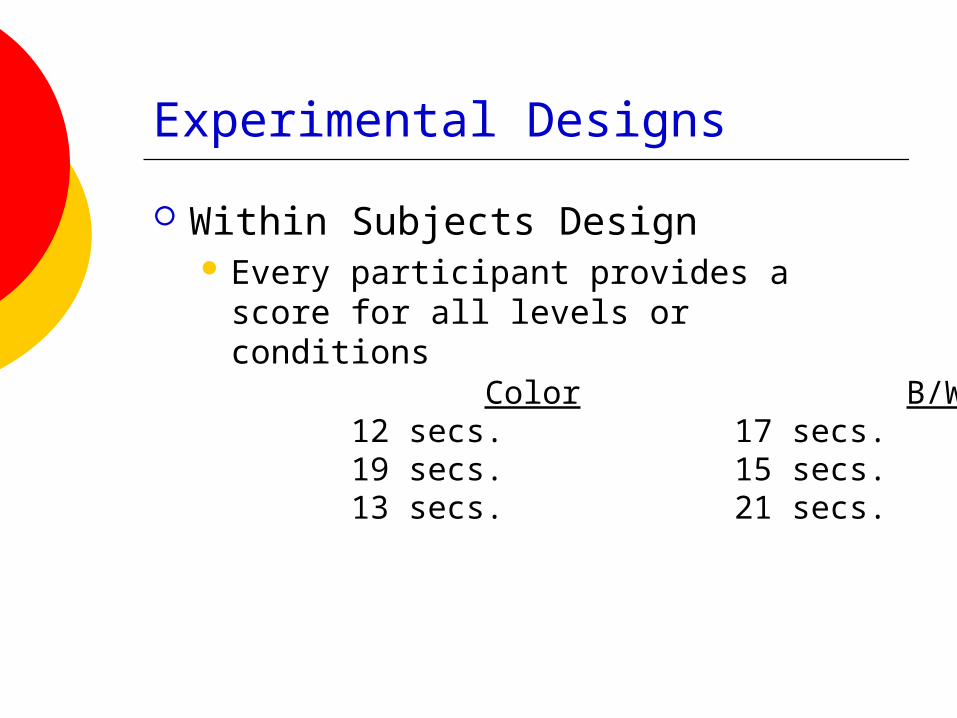
Experimental Designs
Within Subjects Design Every participant provides a score for
all levels or conditions
Color B/WP1 12 secs. 17 secs.P2 19 secs. 15 secs.P3 13 secs. 21 secs....
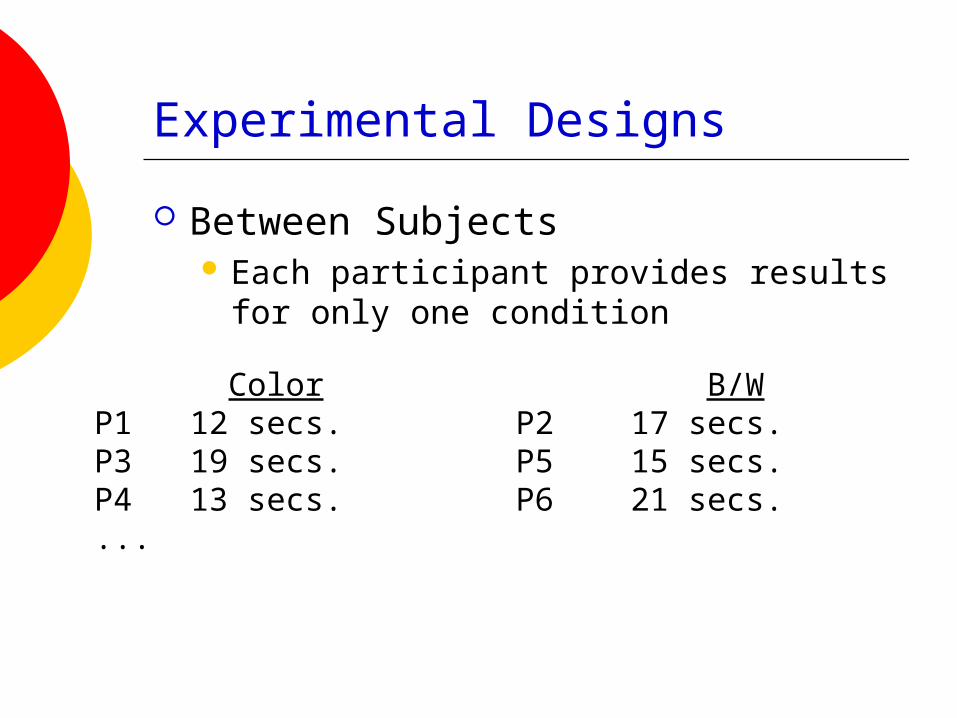
Experimental Designs
Between Subjects Each participant provides results for
only one condition
Color B/WP1 12 secs. P2 17 secs.P3 19 secs. P5 15 secs.P4 13 secs. P6 21 secs....
Within vs. Between
What are the advantages and disadvantages of the two techniques?
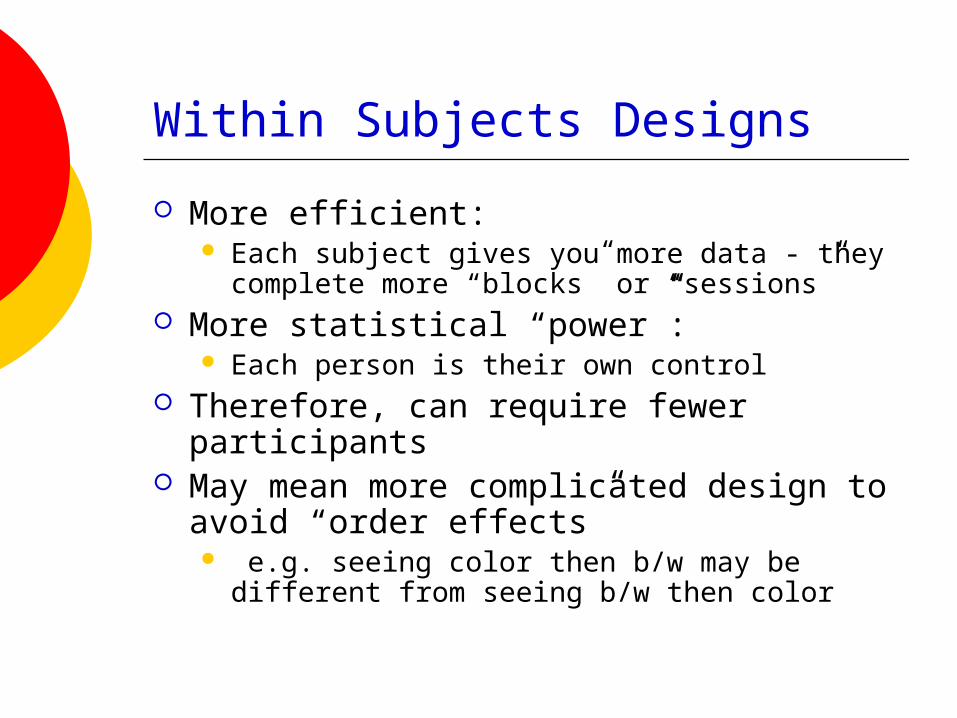
Within Subjects Designs
More efficient: Each subject gives you more data - they
complete more “blocks” or “sessions” More statistical “power”:
Each person is their own control Therefore, can require fewer participants May mean more complicated design to
avoid “order effects” e.g. seeing color then b/w may be different
from seeing b/w then color
Between Subjects Designs
Fewer order effects Participant may learn from first
condition Fatigue may make second performance
worse Simpler design & analysis Easier to recruit participants (only
one session) Less efficient
What about subjects?
How many? Book advice:at least 10 Other advice:6 subjects per
experimental condition Real advice: depends on statistics
Relating subjects and experimental conditions Within/between subjects design
Now What…?
You’ve got your task, performance measures, experimental design, etc.
You have hypotheses about what will happen in the experiment
You gathered your data Performed initial data inspection
Removed outliers, have general idea what occurred
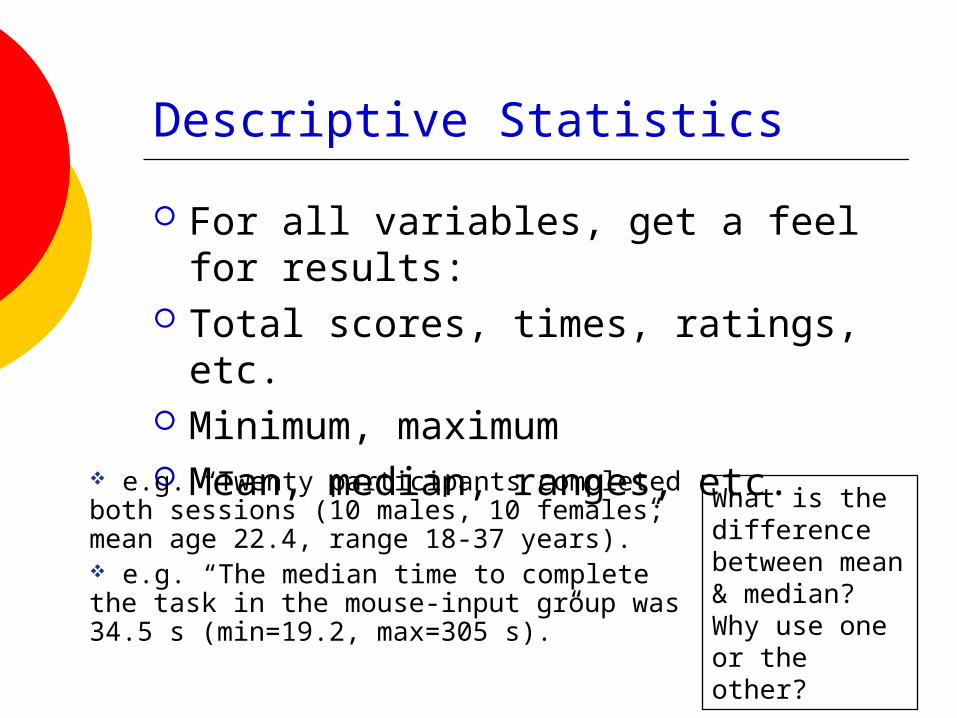
Descriptive Statistics
For all variables, get a feel for results:
Total scores, times, ratings, etc. Minimum, maximum Mean, median, ranges, etc.
What is the difference between mean & median? Why use one or the other?
e.g. “Twenty participants completed both sessions (10 males, 10 females; mean age 22.4, range 18-37 years).” e.g. “The median time to complete the task in the mouse-input group was 34.5 s (min=19.2, max=305 s).”
Subgroup Stats
Look at descriptive stats (means, medians, ranges, etc.) for any subgroups e.g. “The mean error rate for the
mouse-input group was 3.4%. The mean error rate for the keyboard group was 5.6%.”
e.g. “The median completion time (in seconds) for the three groups were: novices: 4.4, moderate users: 4.6, and experts: 2.6.”
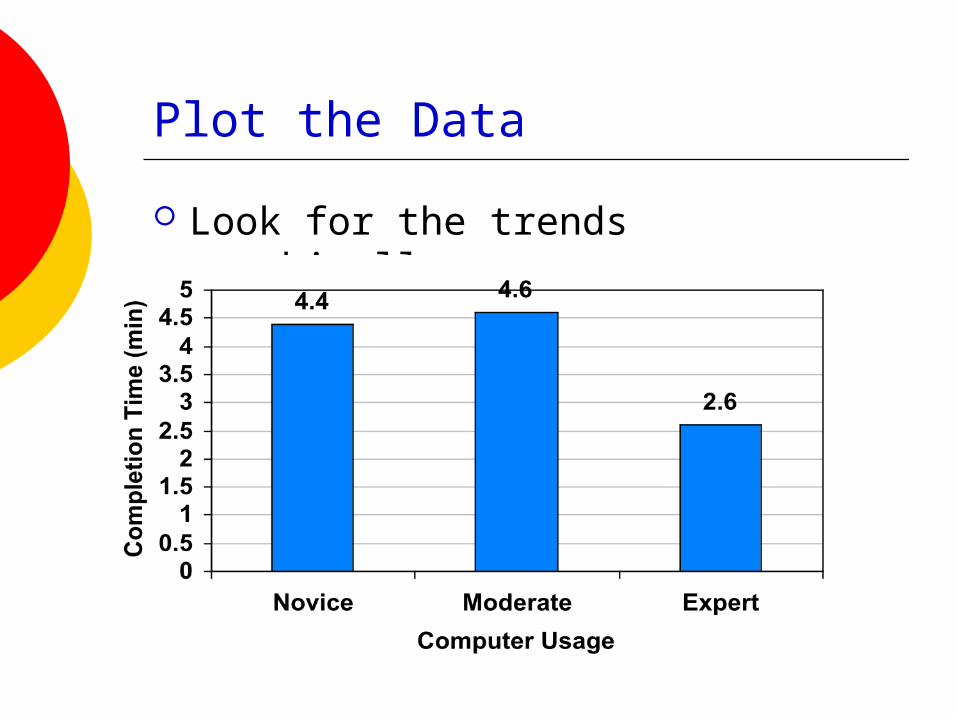
Plot the Data
Look for the trends graphically
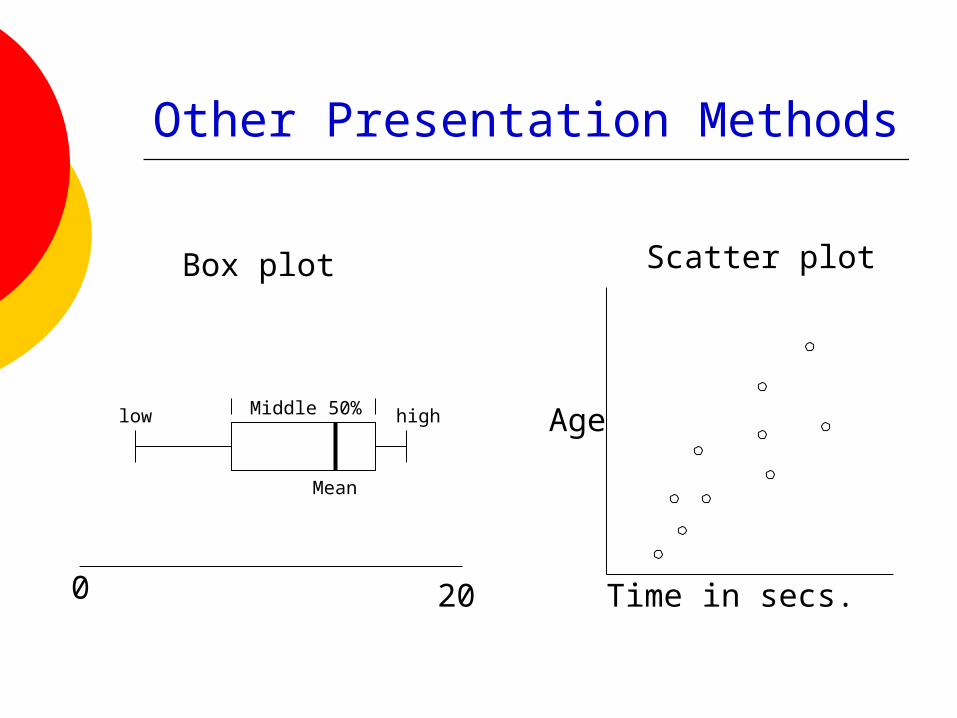
Other Presentation Methods
0 20
Mean
low highMiddle 50%
Time in secs.
Age
Box plot Scatter plot
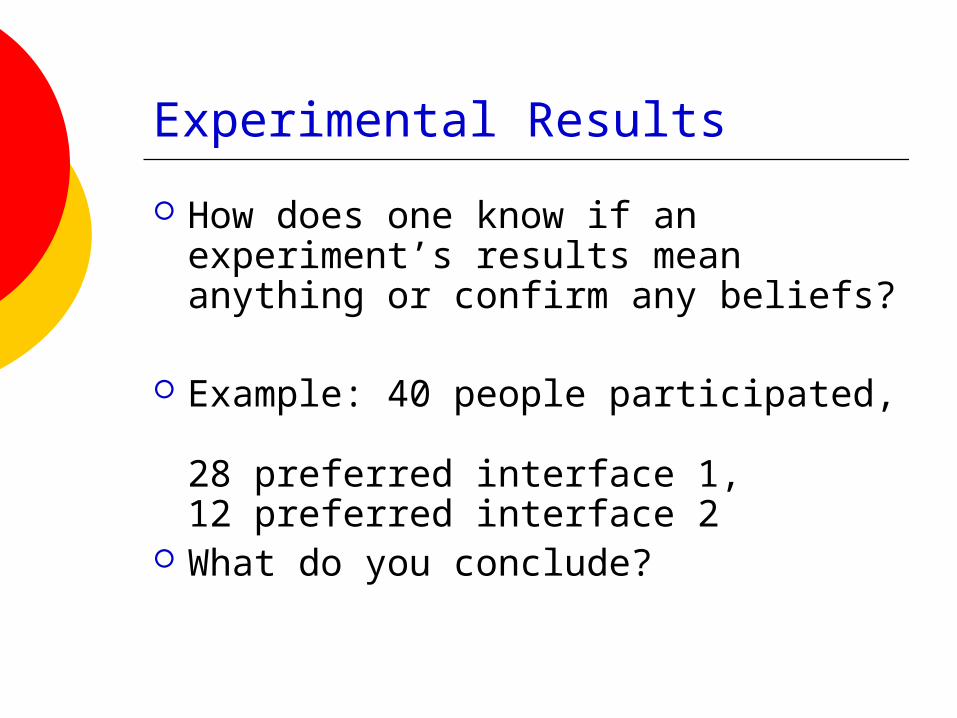
Experimental Results
How does one know if an experiment’s results mean anything or confirm any beliefs?
Example: 40 people participated, 28 preferred interface 1, 12 preferred interface 2
What do you conclude?
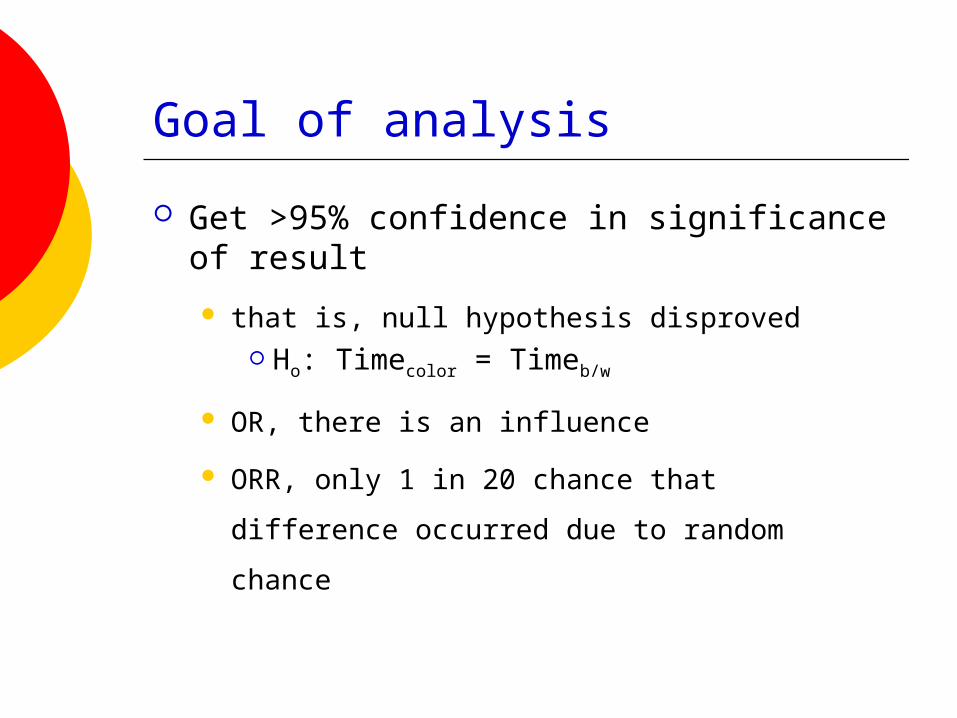
Goal of analysis
Get >95% confidence in significance of result
that is, null hypothesis disproved Ho: Timecolor = Timeb/w
OR, there is an influence
ORR, only 1 in 20 chance that difference
occurred due to random chance
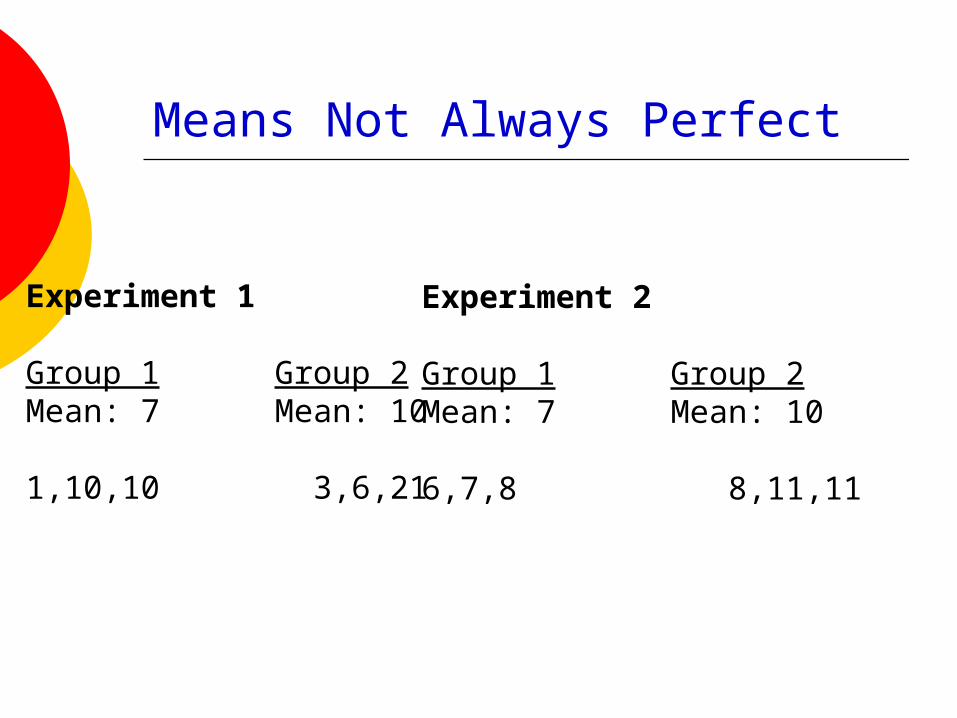
Means Not Always Perfect
Experiment 1
Group 1 Group 2Mean: 7 Mean: 10
1,10,10 3,6,21
Experiment 2
Group 1 Group 2Mean: 7 Mean: 10
6,7,8 8,11,11
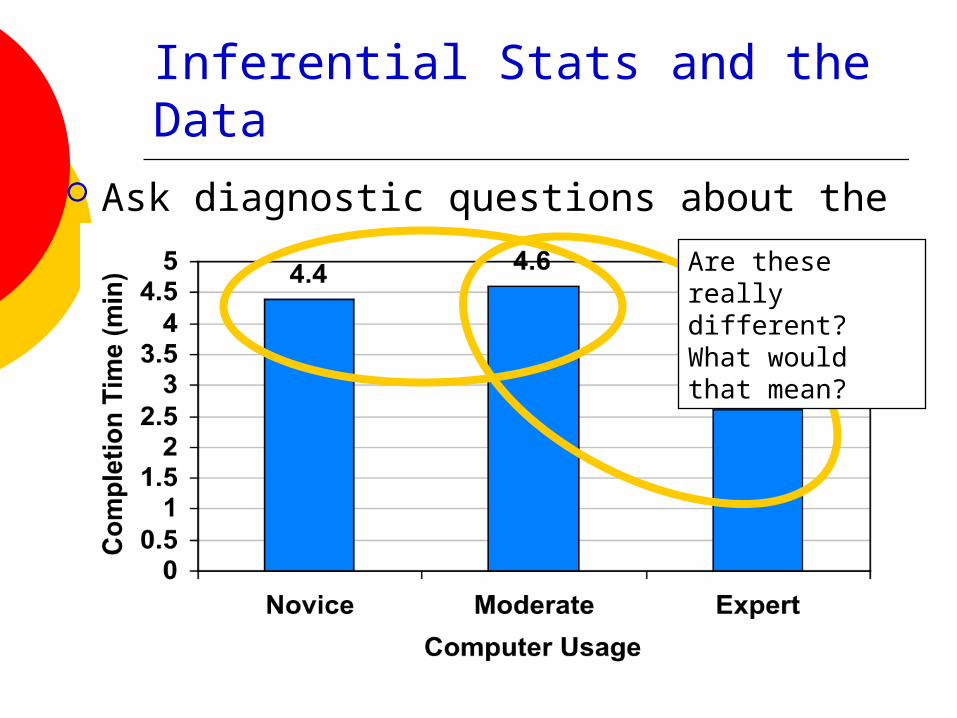
Inferential Stats and the Data Ask diagnostic questions about the data
Are these really different? What would that mean?
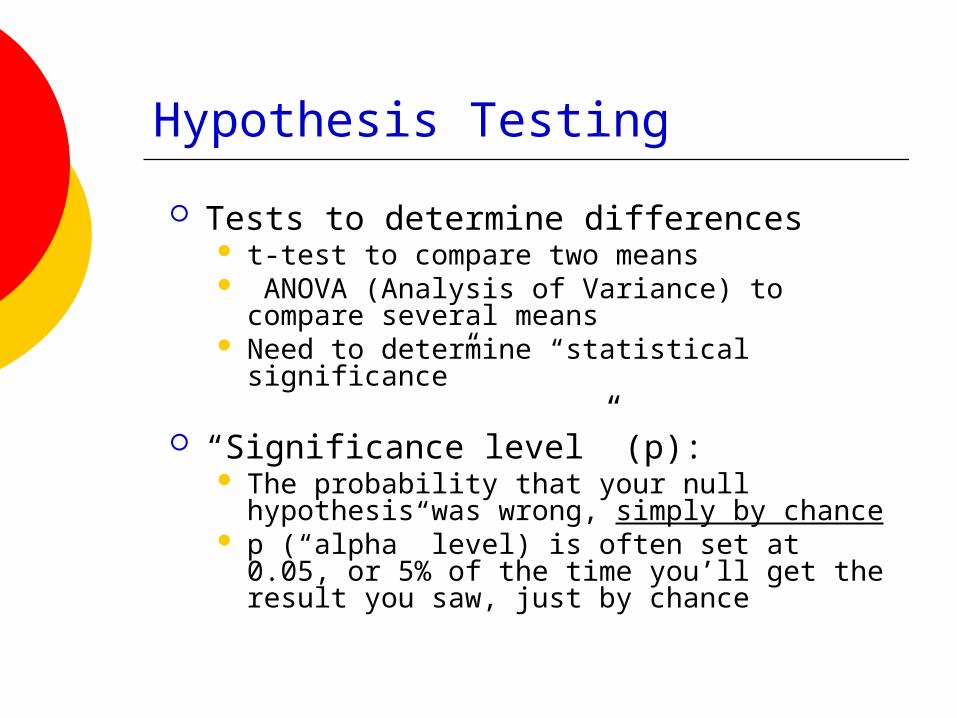
Hypothesis Testing
Tests to determine differences t-test to compare two means ANOVA (Analysis of Variance) to compare
several means Need to determine “statistical significance”
“Significance level” (p): The probability that your null hypothesis was
wrong, simply by chance p (“alpha” level) is often set at 0.05, or 5%
of the time you’ll get the result you saw, just by chance
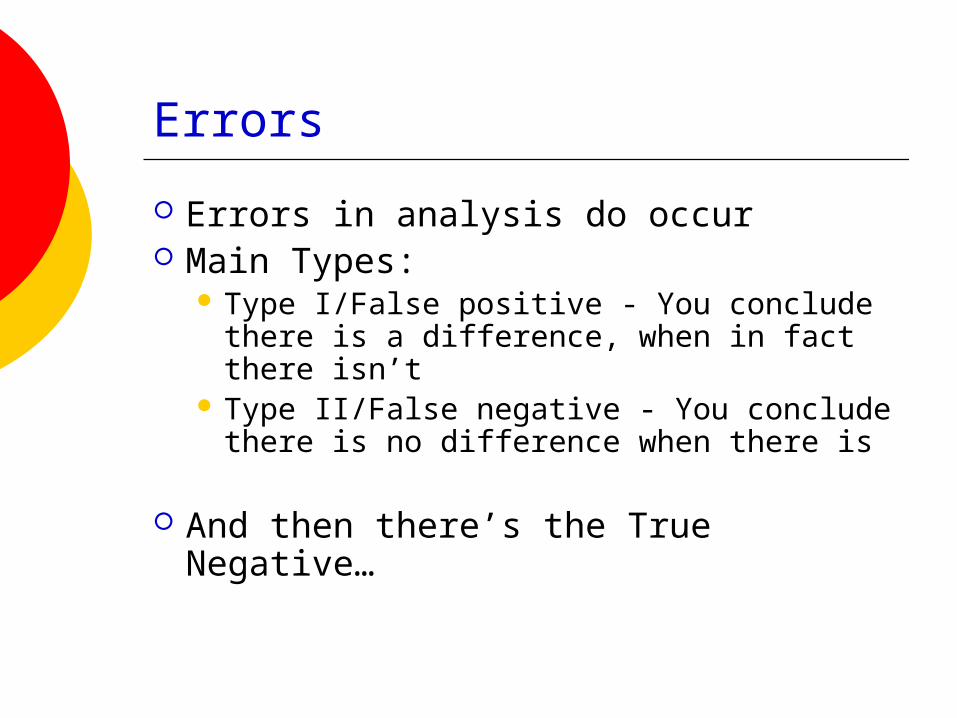
Errors
Errors in analysis do occur Main Types:
Type I/False positive - You conclude there is a difference, when in fact there isn’t
Type II/False negative - You conclude there is no difference when there is
And then there’s the True Negative…
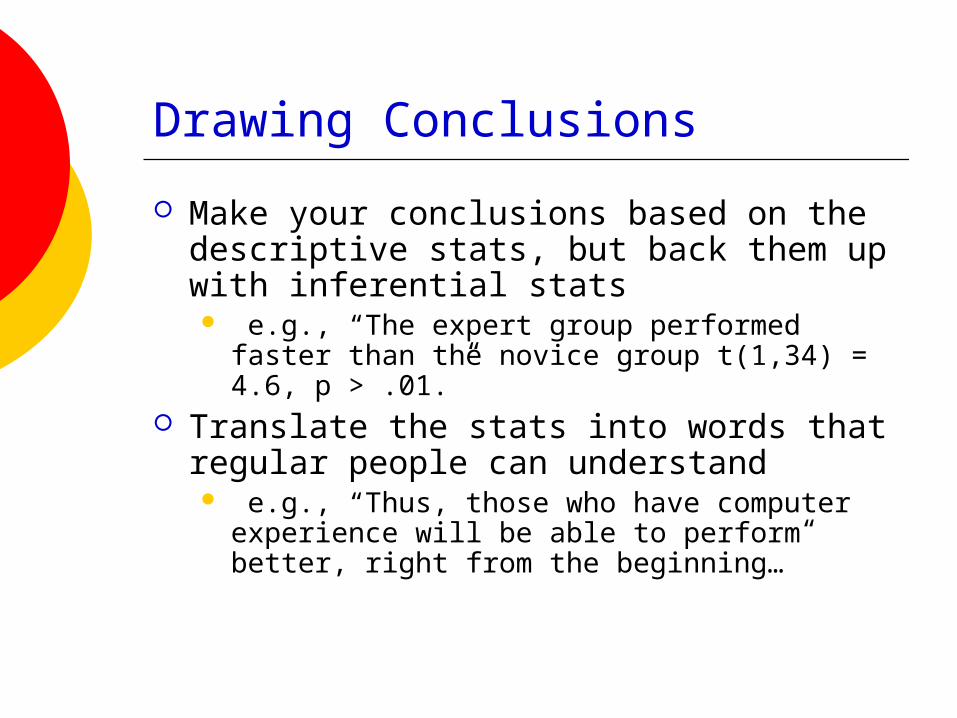
Drawing Conclusions
Make your conclusions based on the descriptive stats, but back them up with inferential stats e.g., “The expert group performed faster than
the novice group t(1,34) = 4.6, p > .01.” Translate the stats into words that regular
people can understand e.g., “Thus, those who have computer
experience will be able to perform better, right from the beginning…”
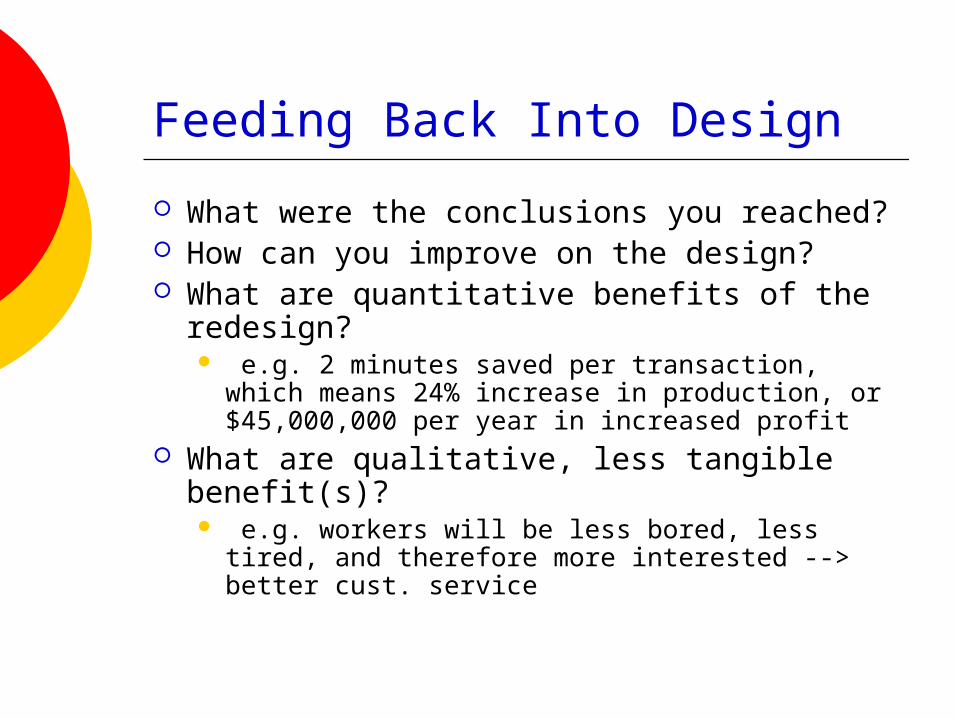
Feeding Back Into Design
What were the conclusions you reached? How can you improve on the design? What are quantitative benefits of the
redesign? e.g. 2 minutes saved per transaction, which
means 24% increase in production, or $45,000,000 per year in increased profit
What are qualitative, less tangible benefit(s)? e.g. workers will be less bored, less tired, and
therefore more interested --> better cust. service
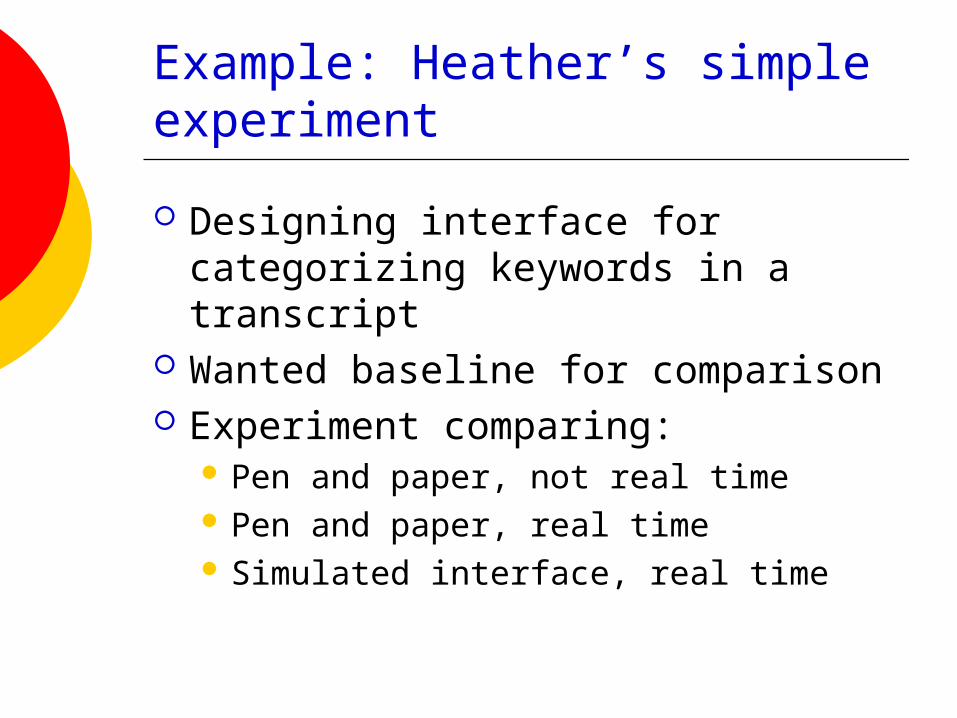
Example: Heather’s simple experiment
Designing interface for categorizing keywords in a transcript
Wanted baseline for comparison Experiment comparing:
Pen and paper, not real time Pen and paper, real time Simulated interface, real time
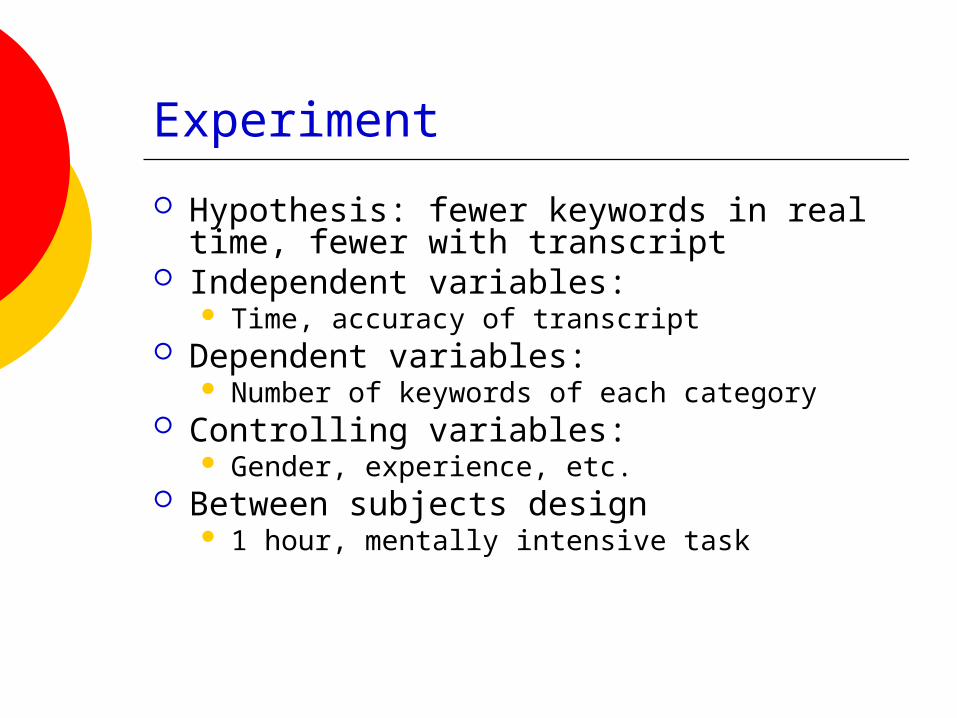
Experiment
Hypothesis: fewer keywords in real time, fewer with transcript
Independent variables: Time, accuracy of transcript
Dependent variables: Number of keywords of each category
Controlling variables: Gender, experience, etc.
Between subjects design 1 hour, mentally intensive task
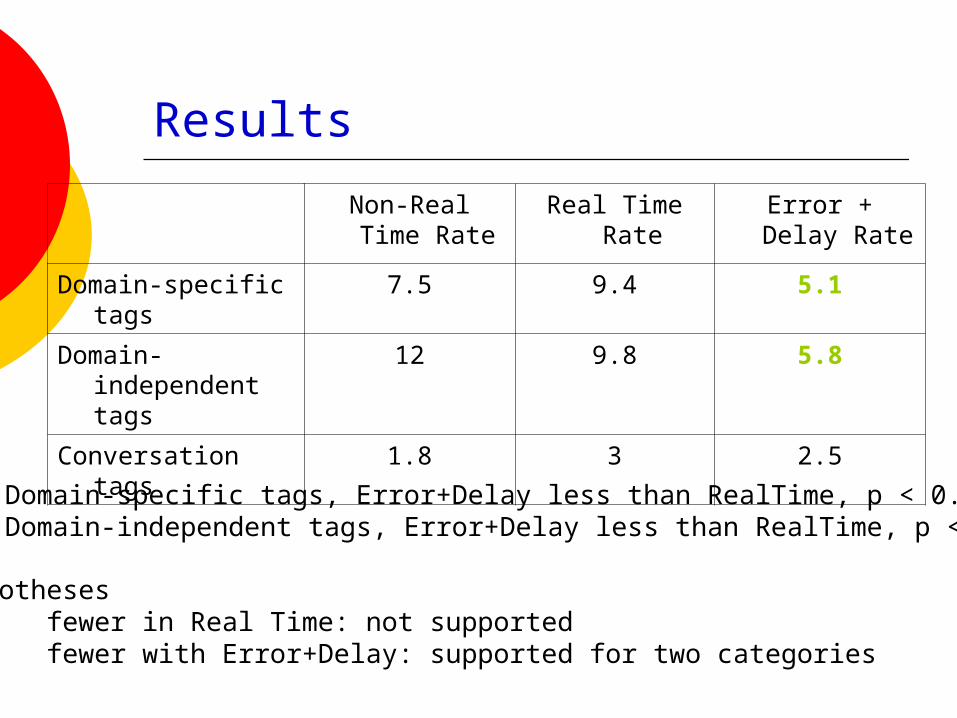
Results
Non-Real Time Rate
Real Time Rate Error + Delay Rate
Domain-specific tags 7.5 9.4 5.1
Domain- independent tags
12 9.8 5.8
Conversation tags 1.8 3 2.5
For Domain-specific tags, Error+Delay less than RealTime, p < 0.01For Domain-independent tags, Error+Delay less than RealTime, p < 0.01
Hypothesesfewer in Real Time: not supportedfewer with Error+Delay: supported for two categories
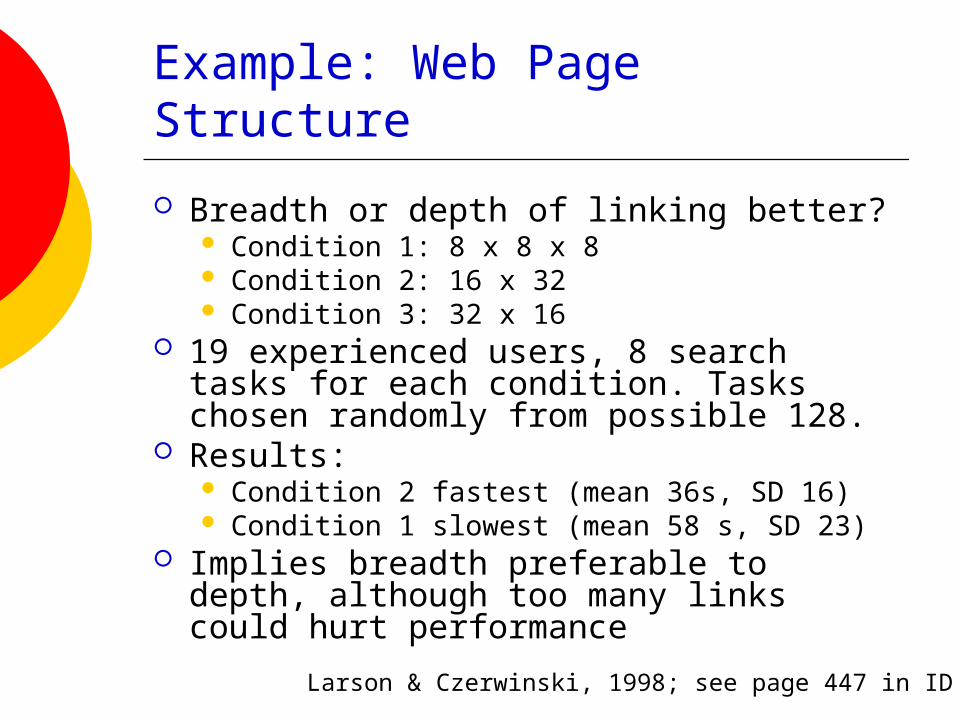
Example: Web Page Structure
Breadth or depth of linking better? Condition 1: 8 x 8 x 8 Condition 2: 16 x 32 Condition 3: 32 x 16
19 experienced users, 8 search tasks for each condition. Tasks chosen randomly from possible 128.
Results: Condition 2 fastest (mean 36s, SD 16) Condition 1 slowest (mean 58 s, SD 23)
Implies breadth preferable to depth, although too many links could hurt performance
Larson & Czerwinski, 1998; see page 447 in ID
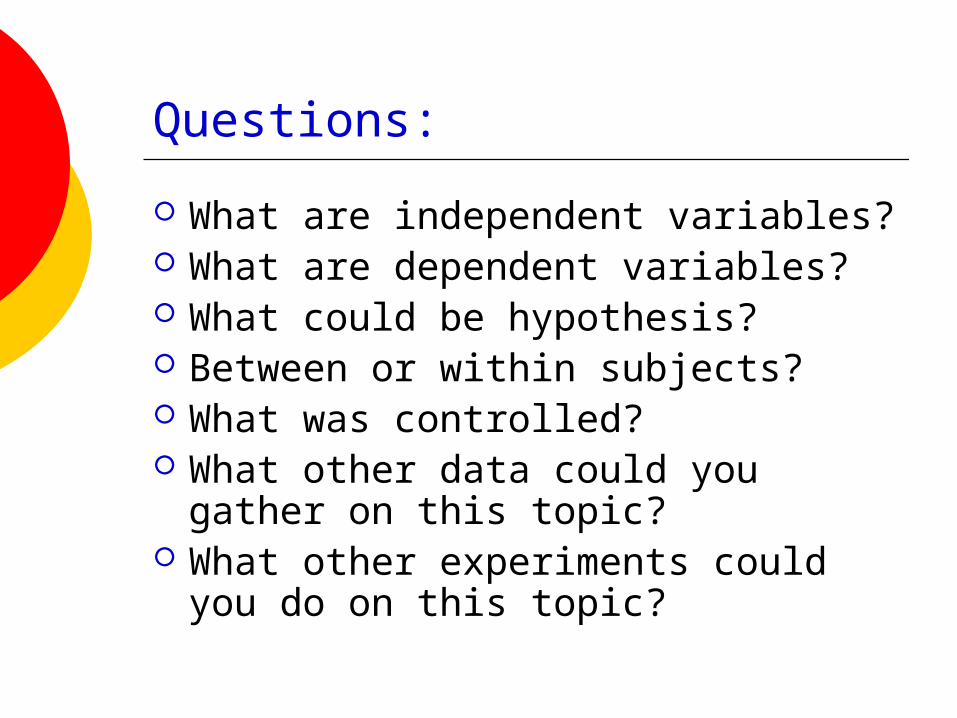
Questions:
What are independent variables? What are dependent variables? What could be hypothesis? Between or within subjects? What was controlled? What other data could you gather
on this topic? What other experiments could you
do on this topic?
Assignment: Due Wednesday
Group evaluation plan: draft Expect at least following:
Usability criteria Expected methods
And which criteria each are evaluating A few details for each method
Tasks you will perform, data you will gather
Questions you will ask, etc.
Example: add video to IM voice chat?
Compare voice chat with and without video
Plan an experiment: Compare message time or difficulty in
communicating or frequency… Consider:
Tasks What data you want to gather How you would gather What analysis you would do after