Embed Size (px)
Citation preview

1
Experiments in Photonics
Section 2 Photonics & Optics
Setting up the spectrometer.

2
2.1 Lenses and Chromatic Dispersion
Introduction
This section will concentrate on using convex lenses to produce images and look at some of the problems when optical devices are constructed.
Light bends as it passes through a lens and the amount and direction of the bending depends on the shape of the lens.
Figure 2.1.1 Convex Lens
All rays parallel to the optic axis of the lens always cross at the focal point of the lens.
All rays passing through the centre of the lens travel in straight lines.
Aims
Calculate the focal length of a convex lens Relate image and object size to magnification Distinguish between real and virtual images Understand how optical instruments work Identify distortion effects in lenses.
Equipment
Minilab II
Screen
Optical Mounts
Coarse Grid
White LED
Convex lenses
focal point
optical axis
focal length

3
Activity
Select a lens from those provided. A quick way get an idea of the focal lengths of the convex lenses is to focus a window or overhead light onto a sheet of paper.
Make a rough measurement of the focal length of the lenses.
Investigate the properties of the glass lenses using a Light Emitting Diode light source on the top of the optical bench with the magnetic holders.
Insert the LED into a holder and plug the LED into the correct socket.
Set up the components as shown in figure 2.1.2 using the thickest lens.
Figure 2.1.2 Properties of a convex lens
Adjust the lens until a sharp image of the grid is seen on the screen. Note that do object distance and di image distance must both be greater than the focal length for a real image to be formed and seen.
Measure di the distance from the lens to the image and do the distance from the lens to the object (screen). Draw and fill in the table.
The thin lens formula allows the focal length to be accurately calculated using your measurements
io ddf
111
Is the focal length the same as your earlier estimate? Complete the results in tabular form.
Move the lens and repeat the calculation with two more images.
What happens if the lens is placed too close to the object slide?
Which way up is the image produced by a convex lens?
do di f
Screen do di
Lens
LED
radio
in
laser
sw rate
digital
recover power
sw
digital
LED
digital
signal
audio
output LED
power
fibre
output
fibre
input
photo
input
signal
monitor
radio
mon

4
A convex lens produces a real image that means it can be formed on a screen.
Lenses also produce magnification m that is the ratio of the image size h i to object size ho. It is also related to the distances di and do by the following equation.
o
i
o
i
d
d
h
hm
Use the 150mm focal length lens to produce a magnified image. Do your measurements confirm the relationship in the above equation?
Figure 2.1.3 Object distance, image distance, focal length and magnification Light coming from objects some distance away is considered to be approximately parallel. Our eye focuses these parallel beams onto the retina to form an image. Any optical instrument that we use needs to produce similar parallel rays so that the eye or a camera can focus them. Real images are produced by optics when light rays are focussed to a point. This occurs inside the eye. If an imaging screen is placed at this point then an image will be seen on it. Virtual images cannot be seen on a screen. Additional optics of the eye, camera or lens is needed to see them.
Activity
Magnifying Glass
Try out the lenses on their own as magnifying glasses. The eye focuses the virtual image produced by the lens.
object
ho
di
image
hi
f
do
f

5
Figure 2.1.4 Magnifying glass Investigate the magnifying ability of some of the lenses available. Sketch a diagram to illustrate the magnification of each lens. Use a piece of print or grid. What position should the eye take?
Figure 2.1.5 Magnification results
Telescopes
Refer to Figure 2.1.6 and construct an astronomical telescope on the optical bench. Focus on a (distant) object at least three metres away.
Figure 2.1.6 Astronomical Telescope
virtual
image
real
image
eyepiece eye
parallel
light
fi
image
fo
objective
θ’
f
θ’
Object Image
Eye
Image

6
Look through the telescope and describe the image. Try different combinations of lenses and note the significance of focal lengths.
The Galilean telescope or opera glass has certain advantages over an astronomical telescope Refer to Figure 2.1.7 to build a Galilean telescope.
Figure 2.1.7 Galilean Telescope
Additional Activity Calculate the magnification m of the telescopes with different lens combinations. fo = focal length of objective and fe = focal length of eyepiece
fe
fom
Devise a method using the eye to estimate the magnification and compare these to calculated values. Image quality is important in optical instruments. The experimental arrangement used earlier to measure focal lengths is used once again, but this time to demonstrate and measure distortion and colour dispersion.
Figure 2.1.8 Measuring distortion and dispersion Use the LED and place the coarse grid close to the source.
do di Screen Lens Grid
LED
radio
in
laser
sw rate
digital
recover power
sw
digital
LED
digital
signal audio output
radio
signal LED
power
fibre
output
fibre
input
photo
input
signal
monitor
eyepiece objective
virtual
image
fo
eye
parallel
light fi
image

7
Focus the grid on the screen and sketch or record the image. How does it compare to the original grid? This exercise requires a dark area. Place the red filter in front of the grid and try to adjust the screen to give the sharpest possible image. Measure the distance from the screen to the lens. Replace the red filter with the blue filter and adjust the screen once again to give a sharp image. Measure the distance from the screen to the lens. Are they the same and do your results correspond with Figure 2.1.9
Figure 2.1.9 Colour dispersion and use of an achromat lens to correct the effect
white
light
blue red
white
light

8
2.2 Diffraction: An Introduction
Introduction When light passes an edge it spreads out causing diffraction. This effect is particularly important in the design of optical instruments. The shape of an aperture or object determines the shape of the diffraction pattern. For
example a circular aperture will produce a diffuse circular pattern known as Airy’s
disc:
Figure 2.2.1 Diffraction pattern formed by a laser shining through a small hole When you look at a distant street lamp there may be a corona surrounding it. This is actually a diffraction pattern determined by the aperture of your eye. Occasionally the moon exhibits a corona due to diffraction from the small water droplets or ice crystals in the air above us. The dimensions of the interference pattern observed can be calculated if we
know the wavelength () of the light, the size of the aperture (d) and the distance from the aperture to the screen (L). W is the width of the central maximum.
dLW 2
Figure 2.2.2 Diffraction and light intensity through a slit In general terms the smaller the aperture the greater the effect of diffraction and interference. This knowledge is useful because many optical instruments have small circular apertures. Usually for an optical instrument it is desirable to limit the diffraction. This means W must be as small as possible. By inspection of the equation above we can see that we need to make d as large as possible. Microscope objective lenses provide an example, with the better lenses having the larger apertures.
L
d
incident
light
Light intensity
W

9
This experiment will demonstrate some of the qualitative effects of diffraction.
Aims To view and recognise diffraction effects Relate diffraction effects to the wavelength of light Use a diffraction grating
Equipment
Minilab II
Diffraction Grating
Optical Mounts
LED Light Sources
Grids
Activity As a simple demonstration hold a forefinger as close as possible to the thumb without touching. Place an eye close to the gap and look out of the window. What do you observe? Diffraction phenomena are quite common for instance when we look through a flyscreen at a distant lamp or when a TV camera points towards the lights during a sporting event and a cross like effect occurs.
Activity Set up the white LED in a magnetic holder on top of the optical bench and plug it into the correct socket.
Figure 2.2.3 Viewing diffraction effects Stand some distance away and look at the LED through the grids, diffraction grating and rainbow glasses.
Grid
LED
radio
in
laser
sw rate
digital
recover power
sw
digital
LED
digital
signal audio output
radio
signal LED
power
fibre
output
fibre
input
photo
input
signal
monitor
eye

10
Sketch and describe the visible patterns.
Although these slides diffract the light around the wire or lines the colours appear because of light interference that removes and enhances colours in a similar way to the patterns seen on a soap bubble. How do you think the rainbow glasses are made? A diffraction grating is a slide that contains thousands of tiny parallel lines etched into a piece of film. Typically a grating has 600 lines per millimetre or the spacing between lines is about 1.6 microns or 0.0016mm.
Figure 2.2.4 Diffraction grating. Line spacing is about 1.6 microns.
Activity
Look at the blue, green, red and white LEDs through the finest mesh slide. Sketch and record your results.
Which colours are bent the most and do your observations of the white light LED support these findings?
Coarse Grid Fine Grid Diffraction Grating Rainbow Glasses
Blue LED Green LED Red LED White LED
0.025mm
Grating section

11
2.3 Emission and Absorption Spectra
Introduction Light from the sun contains a continuous distribution of wavelengths, from the energetic ultra-violet (UV) at around 100nm to the deep infrared at over 2000nm. The wavelengths associated with a light source are its spectrum. The sun’s spectrum is thus very broad, whereas light from a source such as a sodium street lamp has a discrete spectrum of only a few different wavelengths. The reason for this is that the sun is very hot, and takes on the spectrum of a blackbody radiator. The street lamp emits wavelengths dependent upon the sodium atoms in the tube. A blackbody radiator is a hot object that emits radiation according to quantum theory. The radiation curves for any hot body depends solely on the temperature:
Figure 2.3.1 Black body curves
Light emitting objects such as the sun or normal tungsten lamps have a colour temperature. This means the colour of light is dependent on how hot the lamp is. The spectrum of the sun closely matches the spectrum of a blackbody
radiator at 5780K. A typical halogen bulb operates at a temperature of
around 3500K. For objects much colder than this, the curve tends to have its peak output further into the infrared. Fluorescent tubes and "neon" light displays operate on a different principle. These lights contain mercury, argon or neon for example. The electrons associated with the atom are excited by the electrical supply and each electron emits a photon of light as it drops back to its non-excited state.

12
The wavelength emitted depends on how much energy the electrons give up in dropping back to the ground state. Since electrons can only exist in well-defined energy levels this limits the number of different wavelengths that can be emitted from any given atom. For these types of light a discrete number of wavelengths are emitted, depending on the atoms excited. Working the other way, we can determine the composition of a gas by the photons emitted and absorbed by it. This is how we determine the composition of atmospheres on distant planets and nebulous clouds and stars light years away. In this experiment a diffraction grating spectrometer is constructed and used to examine the emission spectra from a range of light sources and a filter is used to demonstrate an absorption spectrum. A light has been supplied that produces some spectral lines. The experiment can also be extended if (high voltage) discharge lamps are locally available.
Aims
To observe emission and absorption spectra To build a spectrometer Understand how spectra are produced Calculate the wavelength of different colours of light Calculate energy and frequency of light
Equipment
Optical
Bench
Optical Mounts
Biconvex Lens (f=150)
Spectral tube
LED light sources
Diffraction Grating
Imaging screen
Slit Slide
Parallel
line slides
Coloured Filters
The spectrometer is a widely used instrument that can be used to investigate the spectra of light sources and measure the wavelengths of light. Spectrometers use diffraction gratings or prisms to produce spectra. A diffraction grating consists of thousands of microscopic lines etched into a film. When light hits the edges of the lines diffraction or bending of light occurs.
13
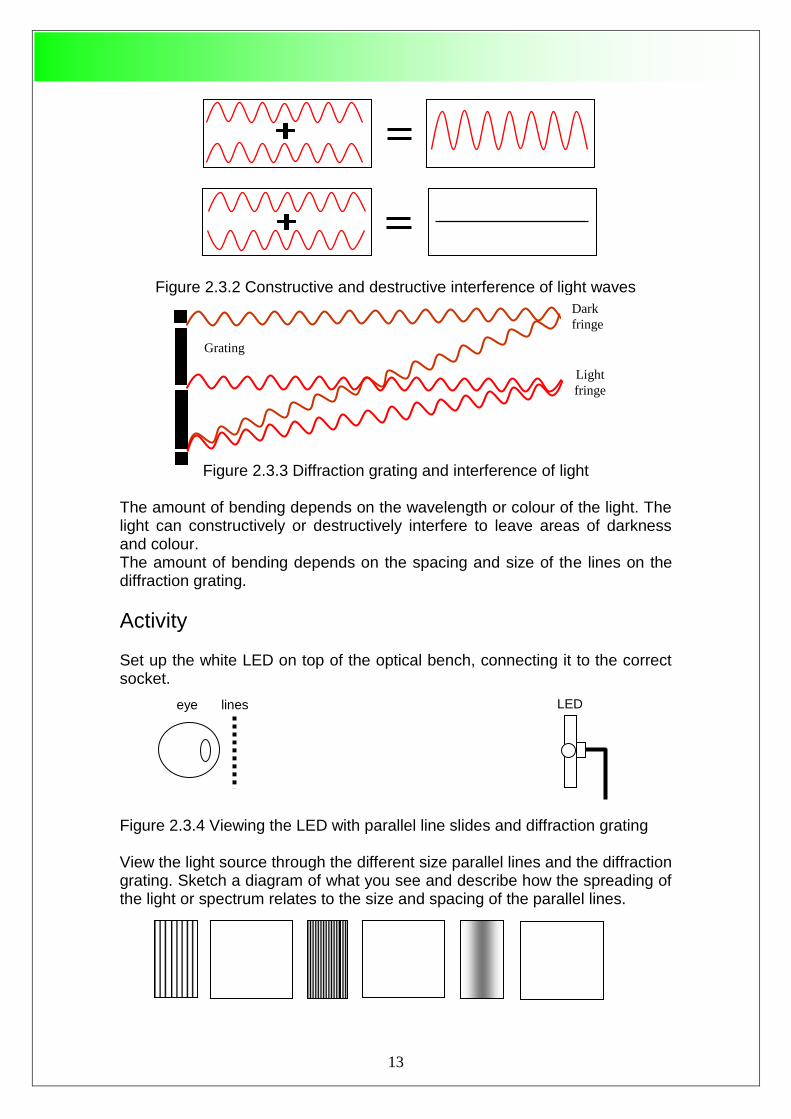
Figure 2.3.2 Constructive and destructive interference of light waves
Figure 2.3.3 Diffraction grating and interference of light
The amount of bending depends on the wavelength or colour of the light. The light can constructively or destructively interfere to leave areas of darkness and colour. The amount of bending depends on the spacing and size of the lines on the diffraction grating.
Activity Set up the white LED on top of the optical bench, connecting it to the correct socket. Figure 2.3.4 Viewing the LED with parallel line slides and diffraction grating View the light source through the different size parallel lines and the diffraction grating. Sketch a diagram of what you see and describe how the spreading of the light or spectrum relates to the size and spacing of the parallel lines.
eye lines LED
Grating
Light
fringe
Dark
fringe
14
The amount of bending depends on the wavelength or colour of the light. The light can constructively or destructively interfere to leave areas of darkness and colour. The amount of bending also depends on the spacing and size of the lines on the diffraction grating.
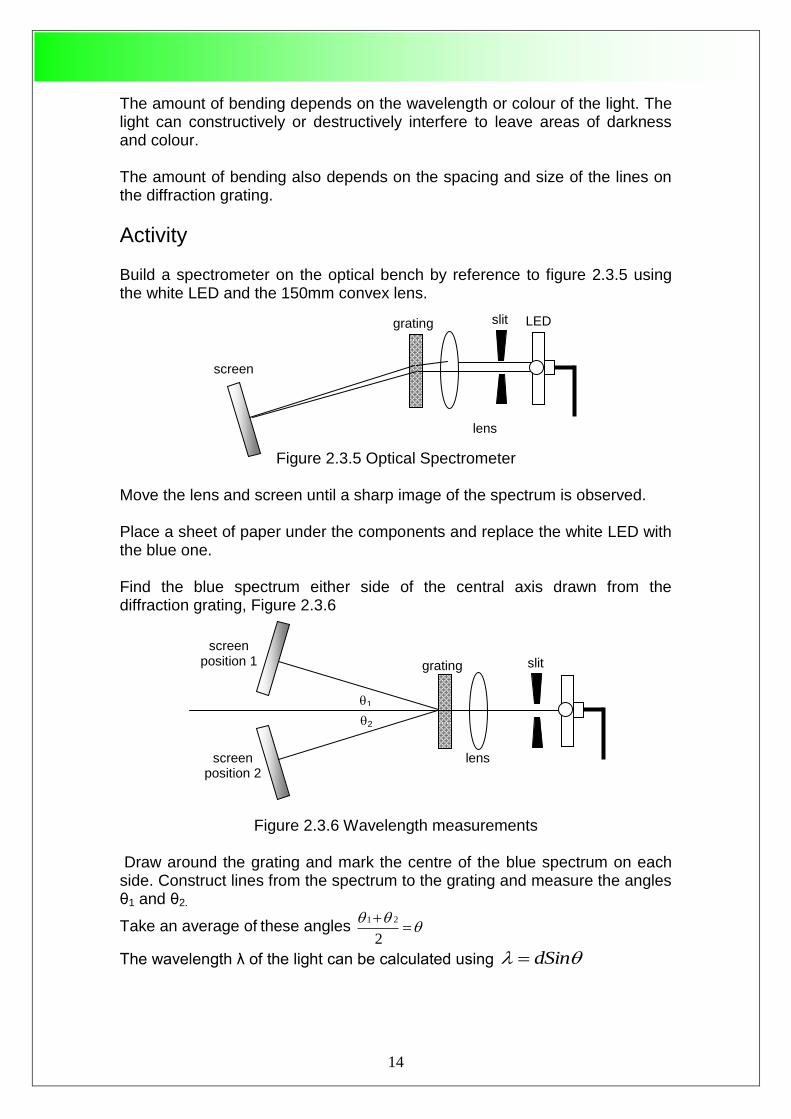
Activity Build a spectrometer on the optical bench by reference to figure 2.3.5 using the white LED and the 150mm convex lens.
Figure 2.3.5 Optical Spectrometer Move the lens and screen until a sharp image of the spectrum is observed. Place a sheet of paper under the components and replace the white LED with the blue one. Find the blue spectrum either side of the central axis drawn from the diffraction grating, Figure 2.3.6
Figure 2.3.6 Wavelength measurements
Draw around the grating and mark the centre of the blue spectrum on each side. Construct lines from the spectrum to the grating and measure the angles θ1 and θ2.
Take an average of these angles
2
21
The wavelength λ of the light can be calculated using dSin
lens
grating LED
screen
slit
screen position 1 grating
lens
1
2
screen position 2
slit

15
d is the line spacing on the diffraction grating. Check the number of lines per millimetre on the grating (600lines/mm) and work out the distance between the lines.
Calculate λ and convert your answer to nanometres the usual units for light wavelength. 1nm = 10-9metres or 10-6mm
Convert the wavelength measurement to frequency using fc
c is the speed of light 3 x 10⁸ m/s and should be in metres
Replace the blue LED with the red and green ones and make similar measurements.
Calculate photon energies using hfE where
h= 6.626 x 10⁻³⁴ Joules/sec, Planck's constant.
E is in joules.
Fill in the table with wavelengths, frequencies and energies
Wavelengths λnm Frequency f Hz Energy J
Blue LED
Green LED
Red LED
Minilab II is supplied with a Cold Cathode Fluorescent Tube CCFL. This can be powered with a 9 Volt battery in a dark room; or more effectively with a 12 Volt DC supply. This light source produces a line spectrum as it contains mercury. Measure some the main lines and compare them to the spectrum in figure 2.3.7. Remember the lamp has fluorescent properties so a continuous spectrum partially coexists with the lines. Your laboratory may also have spectral light sources such as Hydrogen that can be viewed with the spectrometer. Line spectra relate to the atomic structure of the atoms in the lamps.
Figure 2.3.7 Line spectra of Mercury
To use the white light source use the electronic breadboard and note that the value of the resistor (10Ω - 100Ω) can be changed to vary the brightness of the light.

16
Figure 2.3.8 White light source on the Minilab
Absorption Spectrum To demonstrate an absorption spectrum set up the white LED or lamp and display the spectrum. A continuous spectrum should be visible. Place the coloured filters in front of the light source and note how parts of the spectrum are missing.
Figure 2.3.9 Absorption Spectrum Many compounds or substances absorb light and can be identified from their absorption bands. Just as spectral lamps emit line spectra the same atomic vapours can absorb in a similar way. The sun produces one of the most spectacular absorption spectra.
grating LED
screen
slit filter
9V
+ _- 10-100Ω
radio
in
laser
sw rate
digital
recover power
sw
digital
LED
digital
signal audio
output
radio
signal LED
power
fibre
output
fibre
input photo
input
signal
monitor
White light Screen Grating Lens Slit

17
2.4 Prism Spectrometer
Aims
To construct a prism spectrometer
To observe diffraction by a prism
Compare the prism spectrum to a diffraction grating spectrum
Equipment
Optical
Bench
Optical Mounts
Biconvex Lens f=150mm
Slit Slide & Screen
White LED and light sources
Prism
The spectrometer is a widely used instrument that can be used to investigate the spectra of light sources and measure the wavelengths of light. Spectrometers use diffraction gratings or prisms to produce spectra. A prism produces a spectrum by dispersion. The refractive index of the glass depends on the wavelength or colour of the light. The light is refracted as it enters and leaves the prism.
Figure 2.4.1 Dispersion by a prism Try looking at light sources or windows through the prism. Careful as it is made of glass!! Can you see dispersion of light into various colours?
white
red
blue
LED

18
Activity Construct a spectrometer using a prism as shown in figure 2.4.2
Figure 2.4.2 Prism Spectrometer
The light source should be placed next to the edge of the optical table and the slit placed vertically in a holder to provide a slit in front of the light source. Rotate the prism to produce the best spectrum. Use the white LED to produce a spectrum. Try the other light sources as well and compare the spectra produced by the diffraction grating and the prism. Note any differences.
slit lens LED prism
19
2.5 Band Gap Energy and Spectrometry
Aims
To measure band gap energies Construct a spectrometer Understand the significance of band gaps
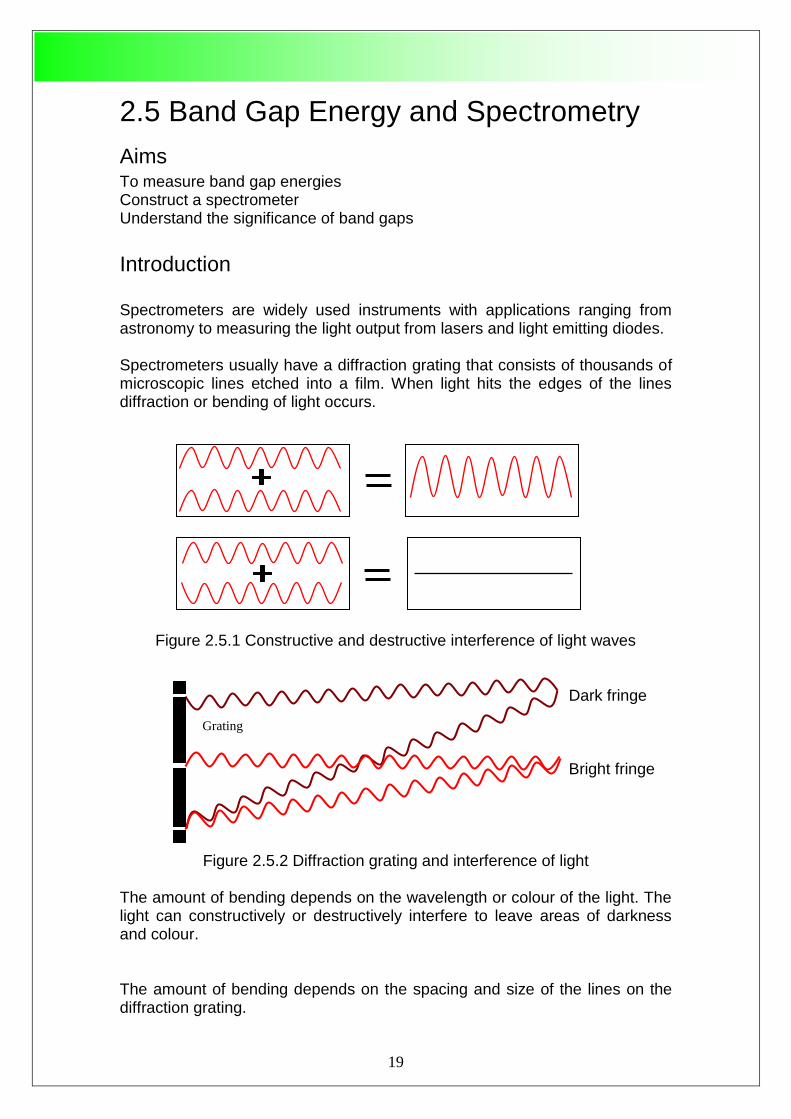
Introduction Spectrometers are widely used instruments with applications ranging from astronomy to measuring the light output from lasers and light emitting diodes. Spectrometers usually have a diffraction grating that consists of thousands of microscopic lines etched into a film. When light hits the edges of the lines diffraction or bending of light occurs.
Figure 2.5.1 Constructive and destructive interference of light waves
Dark fringe Bright fringe
Figure 2.5.2 Diffraction grating and interference of light The amount of bending depends on the wavelength or colour of the light. The light can constructively or destructively interfere to leave areas of darkness and colour. The amount of bending depends on the spacing and size of the lines on the diffraction grating.
Grating

20
Light can be produced in a number of different ways. The filament of a light bulb is heated by passing a current through it. This heat is radiated as visible and non-visible light. An LED or light emitting diode is different and works on the principle of band gap energies. A band gap is essentially the energy gap between the electron valence band and the conduction band. This gap is large for an insulator, small for a semiconductor and for a conductor these bands overlap, meaning that there are always electrons available in the conduction band. Figure 2.5.3 Relative positions of the valence and conduction bands in insulators, semiconductors and conductors A diode is a device that allows current to flow only if it is in the right direction and is of high enough voltage. Diodes use a p-n junction. This is a term used for two pieces of semi-conducting material, one with positive holes (p) and another rich in electrons (n). When these materials are placed together, figure 2.5.4, the electrons and holes combine at the boundary to form a depletion zone that is electrically neutral and acts as an insulator.
Figure 2.5.4 Holes and electrons in a p-n junction
If a high enough voltage is applied the electrons and holes migrate across the depletion zone. As the electrons drop into the holes they drop from the conduction band into the valence band and a photon of light is emitted.
p-type n-type
valence valence valence
conduction
conduction
conduction
Insulator Semiconductor Conductor
p-type n-type Depletion
zone

21
Figure 2.5.5 LED structure and circuit LED’s may be made from layers of Aluminium Gallium Arsenide (AlGaAs) in the form of a semiconductor chip encapsulated in epoxy resin. The composition of the LED can be altered to give different band gap energies. This controls the colour or frequency of emitted light. Small band gaps give red light and larger band gaps give green and blue.
Equipment
Optical
Bench
Optical Mounts
Biconvex Lens (f=150)
Parallel line slides
LED Light Sources
Spectral Light Sources [Optional]
Diffraction Grating
Imaging screen
Slit Slide
Activity Set up one of the LEDs on top of the optical bench, connecting it to the correct socket.
Figure 2.5.6 Viewing the LED with parallel line slides and diffraction grating
p-type
n-type
resistor
light
emission
-ve
+ve
I
parallel lines LED eye
radio
in
laser
sw rate
digital
recover power
sw
digital
LED
digital
signal audio
output
radio
signal LED
power
fibre
output
fibre
input photo
input
signal
monitor

22
View the light source through the different size parallel lines and the diffraction grating. Describe how the spreading of the light or spectrum relates to the size and spacing of the parallel lines. Use the microscope to inspect the line separation. Can you see any lines on the diffraction grating? Build a spectrometer using the white LED and f=150mm lens on the optical bench by reference to figure 2.5.7
Figure 2.5.7 Optical Spectrometer Move the lens and screen until a sharp image of the spectrum is observed. Place a sheet of paper under the components and replace the white LED with the blue one. Find the blue spectrum either side of the central axis drawn from the diffraction grating, Figure 2.5.8
Figure 2.5.8 Wavelength measurements
1
2
LED
screen position 1 grating
lens
axis
screen position 2
slit
camera
LED
screen
grating
lens
slit

23
Draw around the grating and mark the centre of the blue spectrum on each side. Construct lines from the spectrum to the grating and measure the angles θ1 and θ2.
The wavelength λ of the light can be calculated using dSin d is the line spacing on the diffraction grating. Check the number of lines per millimetre on the grating (600lines/mm) and work out the distance between the lines. Calculate λ and convert your answer to nanometres the usual units for light wavelength. 1nm = 10-9metres.
Convert the wavelength measurement to frequency using fc
c is the speed of light 3 * 108 m/s and should be in metres. Fill in the table. Replace the blue LED with the red and green ones and make similar measurements. Measurement of the wavelength of the light and use of the following equation allows the band gap energies to be calculated.
hcE h = Planck's Constant 6.626 * 10-34 J.s
The energy is calculated in Joules. Convert to eV using 1eV = 1.6 * 10-19 J Complete the table and look up some values for the band gap energies for different coloured LEDs. What other factor influences band gap energy?
Wavelength λ
Frequency f
Energy J
Calculate eV
Typical eV
Blue LED
Green LED
Red LED

24
2.6 Young's Double Slit Experiment
Aims
To reproduce Young’s double slit experiment To observe interference fringes Relate their appearance to the wave theory of light and wavelength of light
Introduction The double slit slide has several sets of slits. Use black tape to leave one set of slits only. Set up the white light or white LED source on the optical bench. Bring the slit up close to the eye and view the light source. What do you see? The interference pattern can only occur when the light diffracted by the two slits is coherent or in phase with each other. Coherence can be achieved with a laser, however Thomas Young performed this experiment in 1801 and did not have access to such a device. Instead Young used the arrangement shown in Figure 2.6.1 in which single and double slits are employed to produce two coherent light sources. The light forms a spectrum from each slit and constructive or destructive interference occurs depending on the phase difference of the two paths for the light.
Figure 2.6.1 Young's double slit experiment Young's experiment provided strong evidence for the wave nature of light and the measurement of wavelength. The formation of spectra and interference effects are exploited in the design and use of diffraction gratings.

25
Equipment
Optical
Bench
Optical Mounts
Double
slit slide
Slit slide
LED light sources
Activity The interference patterns or fringes can be investigated by using a single slit in front of the light source and placing your eye close to the double slit slide. Refer to figure 2.6.2
Figure 2.6.2 Observing double slit interference fringes
The single slit fits into one of the magnetic holders horizontally or vertically and can be held open using the screws. Try different double slits but block out the remainder. Adjust the components and alignment to produce the best fringe pattern possible. Sketch the fringe patterns from the different LEDs and note any differences.
Explain the interference patterns and results in terms of the wave like nature of light.
How are the colours and separation of fringes related to the wavelength of the light?
eye double slit LED
single slit
26
2.7 Polarization
Aims To produce and investigate polarized light. Measurement of the intensity of light passing through polarizers.. Visualisation of stress in rulers and protractors.
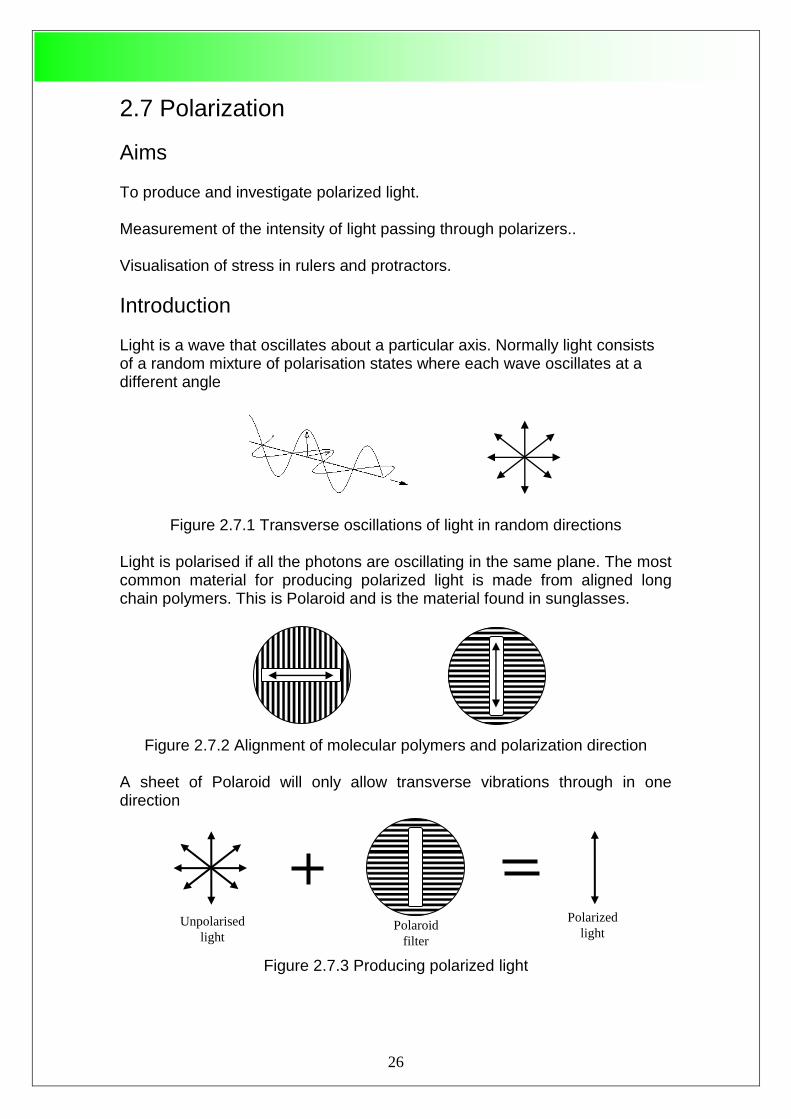
Introduction Light is a wave that oscillates about a particular axis. Normally light consists of a random mixture of polarisation states where each wave oscillates at a different angle
Figure 2.7.1 Transverse oscillations of light in random directions Light is polarised if all the photons are oscillating in the same plane. The most common material for producing polarized light is made from aligned long chain polymers. This is Polaroid and is the material found in sunglasses.
Figure 2.7.2 Alignment of molecular polymers and polarization direction
A sheet of Polaroid will only allow transverse vibrations through in one direction
Figure 2.7.3 Producing polarized light
Unpolarised
light Polaroid
filter
Polarized
light
27
Equipment
Optical Bench
Polaroids
Optical Mounts
Meter
White LED
Phototransistor
BNC-4mm
lead
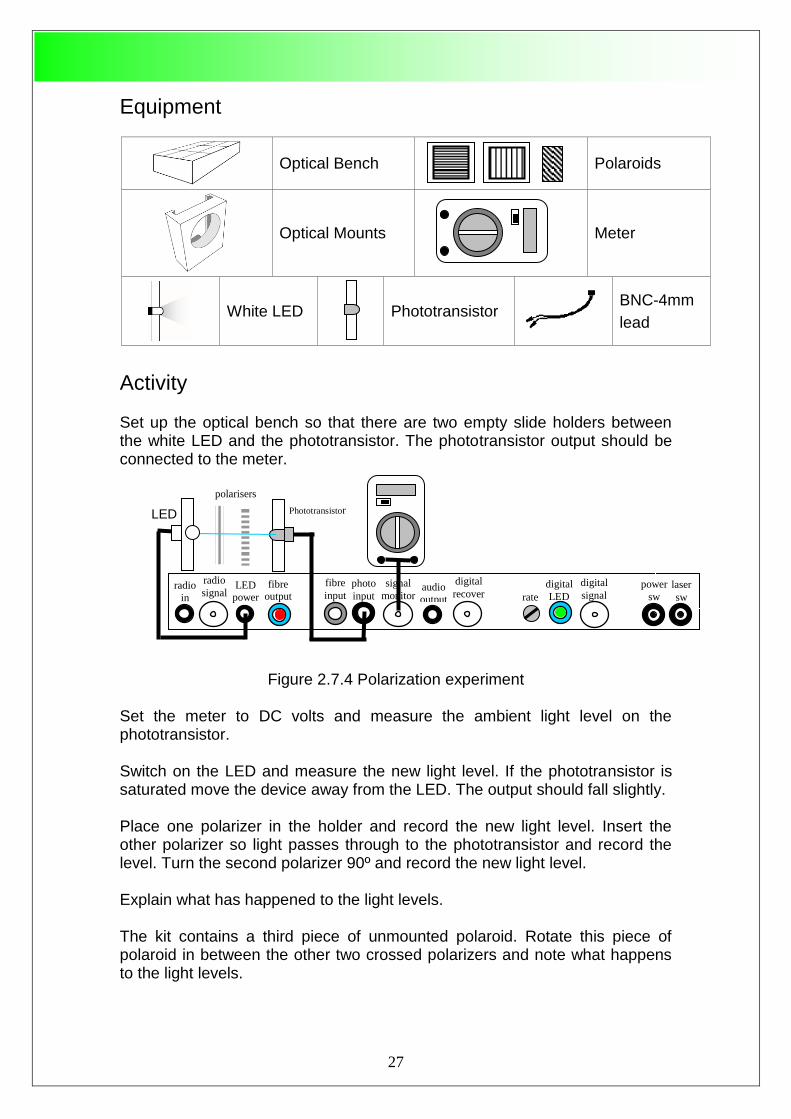
Activity Set up the optical bench so that there are two empty slide holders between the white LED and the phototransistor. The phototransistor output should be connected to the meter.
Figure 2.7.4 Polarization experiment Set the meter to DC volts and measure the ambient light level on the phototransistor. Switch on the LED and measure the new light level. If the phototransistor is saturated move the device away from the LED. The output should fall slightly. Place one polarizer in the holder and record the new light level. Insert the other polarizer so light passes through to the phototransistor and record the level. Turn the second polarizer 90º and record the new light level. Explain what has happened to the light levels. The kit contains a third piece of unmounted polaroid. Rotate this piece of polaroid in between the other two crossed polarizers and note what happens to the light levels.
Phototransistor
polarisers
LED
radio
in
laser
sw rate
digital
recover power
sw
digital
LED
digital
signal audio
output
radio
signal LED
power
fibre output
fibre
input
photo
input
signal
monitor

28
Crossed polarizers do not permit the transmission of any light. Placing a piece of polaroid at 45º between the crossed polarizers permits light to come through. One way of looking at the phenomenon is that the first polarizer blocks 50% of the light, the second one another 50% and the third one yet another 50%. The total transmission is now 12,5% compared to 0% with crossed polarizers. Can you find an explanation for this using vectors?
Additional Activity Many types of glass, plastic and chemical solutions affect polarized light. Remove the pieces of polaroid and place them either side of a transparent plastic ruler or protractor. Slightly flex the plastic and observe the stress patterns. These patterns relate to flaws in the manufacturing process and stresses inherent in the design. Identify areas of stress, weakness and uneven thickness.
Investigate how the light level changes as one of the polaroid slides is rotated through 360º. It will be necessary to find a way to orientate the slide or polaroid at different angles in front of the phototransistor.
29
2.8 Analog Modulation
Introduction
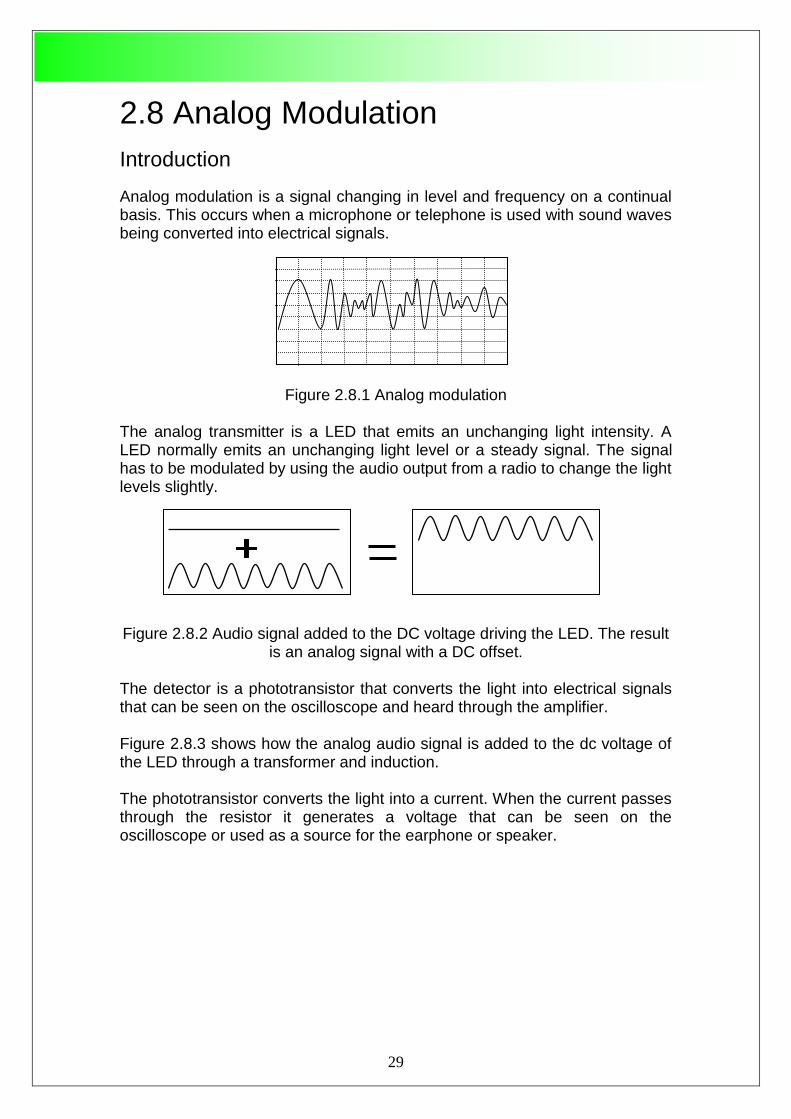
Analog modulation is a signal changing in level and frequency on a continual basis. This occurs when a microphone or telephone is used with sound waves being converted into electrical signals.
Figure 2.8.1 Analog modulation The analog transmitter is a LED that emits an unchanging light intensity. A LED normally emits an unchanging light level or a steady signal. The signal has to be modulated by using the audio output from a radio to change the light levels slightly.
Figure 2.8.2 Audio signal added to the DC voltage driving the LED. The result
is an analog signal with a DC offset. The detector is a phototransistor that converts the light into electrical signals that can be seen on the oscilloscope and heard through the amplifier. Figure 2.8.3 shows how the analog audio signal is added to the dc voltage of the LED through a transformer and induction. The phototransistor converts the light into a current. When the current passes through the resistor it generates a voltage that can be seen on the oscilloscope or used as a source for the earphone or speaker.

30
Figure 2.8.3 Modulating the LED and detecting the signal
Aims
To observe analog modulation To build a free space audio link
Equipment
Optical
Bench
Optical Mounts
Biconvex Lenses
Radio
LED
Phototransistor
Oscilloscope & BNC leads
Speaker or earphone
3.5-3.5mm
stereo lead
Activity Construct a free space audio link based on analog modulation by reference to figure 2.8.4. Use one of the LEDs and the phototransistor. A lens can be used to increase the range of transmission. If the light levels are too high the signal can saturate the phototransistor and prevent it from detecting the signal. An oscilloscope is useful to visualise the waveforms and a speaker or earpiece can be used to listen to the transmitted signal.
Resistor
Radio
+ve
Photodiode LED
Signal
gnd +ve
gnd

31
Figure 2.8.4 Analog free space modulation
Tune in the radio station and display the signal on the oscilloscope. Try VOLTS/DIV on 0.5volts/div and SECS/DIV on 5msecs/div. To display the Phototransistor signal move the DC-GND-AC slider to AC. This blocks the DC voltage and allows the VOLTS/DIV setting to be increased to display the signal.
Use the lenses and mirrors to send the signal as far as possible. Describe how the link works. Occasionally free space laser communication links are used. What kind of problems would these links experience?
volt/div volt/div secs/div
trig
ch1 ch2
Speaker Phototransistor LED
radio
in
laser
sw rate
digital
recover power
sw
digital
LED
digital
signal audio output
radio
signal LED
power
fibre output
fibre
input
photo
input
signal
monitor
Radio
32
2.9 Optical Fibre Basics and Analog Modulation
Introduction
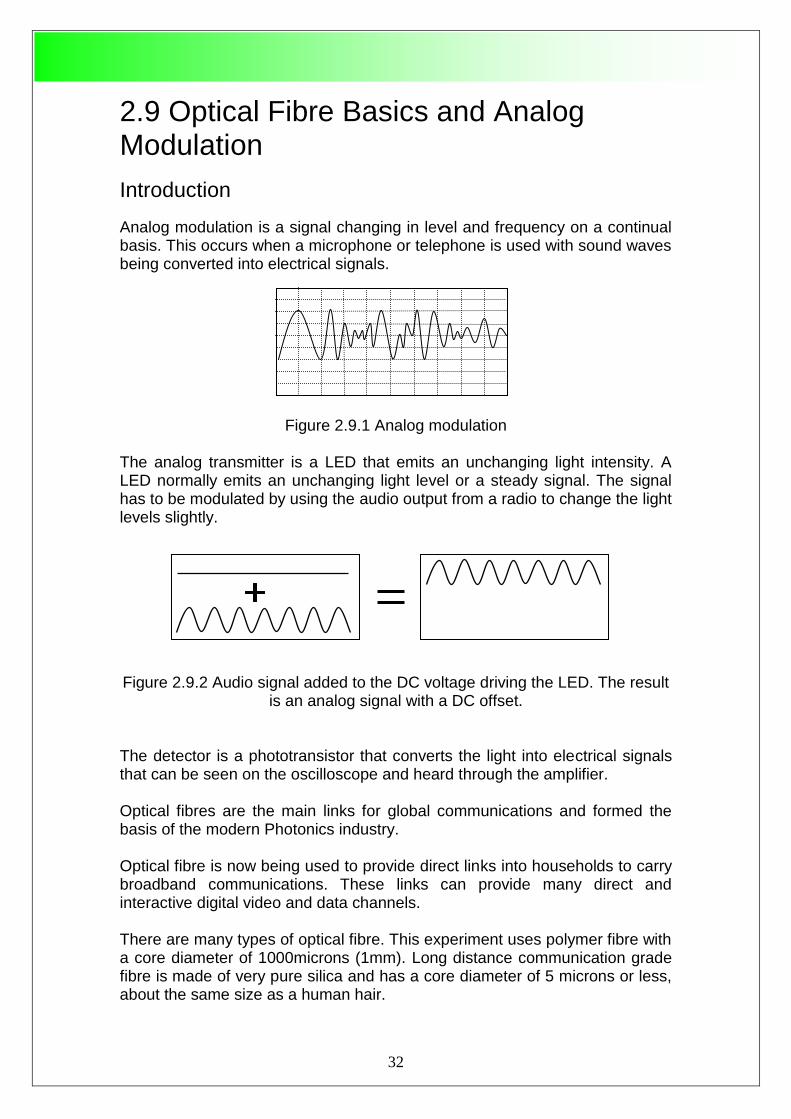
Analog modulation is a signal changing in level and frequency on a continual basis. This occurs when a microphone or telephone is used with sound waves being converted into electrical signals.
Figure 2.9.1 Analog modulation The analog transmitter is a LED that emits an unchanging light intensity. A LED normally emits an unchanging light level or a steady signal. The signal has to be modulated by using the audio output from a radio to change the light levels slightly.
Figure 2.9.2 Audio signal added to the DC voltage driving the LED. The result
is an analog signal with a DC offset. The detector is a phototransistor that converts the light into electrical signals that can be seen on the oscilloscope and heard through the amplifier. Optical fibres are the main links for global communications and formed the basis of the modern Photonics industry. Optical fibre is now being used to provide direct links into households to carry broadband communications. These links can provide many direct and interactive digital video and data channels. There are many types of optical fibre. This experiment uses polymer fibre with a core diameter of 1000microns (1mm). Long distance communication grade fibre is made of very pure silica and has a core diameter of 5 microns or less, about the same size as a human hair.

33
Figure 2.9.3 Optical fibre structure and total internal reflection
Light has to be launched into a fibre. Communication fibre uses lasers but for local networks light-emitting diodes may be used. Light travels through the fibre by total internal reflection bouncing off the interface between the core and cladding. The cladding must have a lower refractive index compared to the core. The light signal has to be detected by a sensor and a photodiode or phototransistor may be used to recover the original signal. These devices are similar to a solar cell and convert light into an electrical signal.
Aims To demonstrate analog modulation Transmission of an analog signal through a polymer optical fibre
Equipment
Optical
Bench
Radio
Optical
Fibre
Oscilloscope & BNC leads
Speaker or earphone
3.5-3.5mm
stereo lead
Activity
Construct a fibre audio link based on analog modulation by reference to figure 2.9.4 An oscilloscope is useful to visualise the waveforms.
High index core
Low index coat
Individual fibre
Optical fibre led
Mi
rro
r

34
Figure 2.9.4 Analog modulation
Tune in the radio station and display the signal on the oscilloscope. Try VOLTS/DIV on 0.5volts/div and SECS/DIV on 5msecs/div. To display the Phototransistor signal move the DC-GND-AC slider to AC. This blocks the DC voltage and allows the VOLTS/DIV setting to be increased to display the signal. The phototransistor detector in the optical fibre receiver can be overloaded with light; causing the signal to break up. Describe how this link works and try to think of the advantages in using optical fibre, rather than a free space link.
volt/div volt/div secs/div
trig
ch1 ch2
Speaker
radio
in
laser
sw rate
digital
recover power
sw
digital
LED
digital
signal audio
output
radio
signal LED
power
fibre
output
fibre
input photo
input
signal
monitor
Radio Fibre

35
2.10 Optical Fibre Basics and Digital Modulation Introduction Fibre optic communication is usually based on digital signals. Light travels through an optical fibre by total internal reflection. Digital pulses of light based on a binary code are normally used to send information through optical fibres. As the pulses of light travel through the fibre they tend to spread out and may eventually overlap. If this occurs the signal becomes corrupted and the information is lost.
Figure 2.10.1 Digital signal showing pulse spreading.
There are two main types of dispersion. Modal dispersion occurs because the light travels through the fibre by total internal reflection and can take different paths.
Figure 2.10.2 Modal dispersion in an optical fibre Figure 2.10.2 shows the paths of two light rays through a length of fibre. If each light ray travels at the same speed which one will arrive at the exit of the fibre first?
Aims To demonstrate digital modulation Calculation of bit rates Observe digital signal restoration
Equipment
Optical
Bench
Oscilloscope & BNC leads
Optical
Fibre

36
Activity
Place a fibre in the digital LED socket and adjust the rate control, figure 2.10.3
Observe the light output from the end of the fibre. Connect the other end of the fibre to the black fibre input socket and connect the oscilloscope to the BNC sockets near the digital LED fibre input socket. As a guide oscilloscope settings should be VOLT/DIV 5Volts/div, SECS/DIV 10msecs/div, TRIGGER Auto and on channel 1, AC-GND-DC slider control on dc. It may be necessary to turn the Trigger Level control. Adjust the rate control and oscilloscope settings to display a digital waveform.
Figure 2.10.3 Connecting the oscilloscope
Figure 2.10.4 Calculating bit rate
Start with the rate control quite slow and calculate the number of bits per second from the screen. Note that each horizontal division on the screen corresponds to the setting on the secs/div control. On Off counts as two bits! Turn the rate control to maximum. Adjust the sec/div control on the oscilloscope until the pulses appear.
volt/div volt/div secs/div
trig
ch1 ch2
radio
in
laser
sw rate
digital
recover power
sw
digital
LED
digital
signal audio
output
radio
signal LED
power
fibre
output
fibre
input photo
input
signal
monitor

37
Calculate the maximum bit rate available from the digital LED Internet radio needs about 20,000 bits/sec and a CD player operates at 44,000 bits/sec Which of these services could our transmitter support? Try the longer lengths of fibre and investigate how the signal from the digital LED changes. The pulses coming into photo-input are detected by a phototransistor without any amplification. Change the oscilloscope connection from signal monitor to digital recover. The circuit has an amplifier and a device to restore the shape of a digital pulse. Note how the signal changes. The polymer fibre has many pathways available for the light to travel and is called multimode fibre. These fibres are only used for relatively short fibre links whereas especially designed single mode fibre with a very small core diameter (5 microns or less) is used for long distance communications. Material or chromatic dispersion occurs because light of different wavelengths or colours travels at different velocities through the fibre. A white light source has a very broad range of wavelengths so would be most unsuitable for signal transmission in optical fibre. Lasers have extremely narrow spectral widths and appear to have a single colour output and are ideally suited to data transmission. However chromatic dispersion still occurs with these devices. How does dispersion affect the potential rate of signal transmission? Why might it be important to restore the shape and strength of a digital pulse in a communication network?

38
2.11 The Inverse Square Law
Aims
To investigates the inverse square law and provide a calibration curve for the optical fibre detector.
Equipment
Optical bench
Optical Mounts
BNC-4mm Lead
Meter
Optical Fibre & Holder
Phototransistor
Activity
Set up the optical fibre and the Phototransistor on the optical bench as shown in figure 2.11.1. The Phototransistor is a device that converts light into an electrical signal. This signal is monitored and measured using a meter.
Figure 2.11.1 Measuring light intensity changes with distance
Connect the BNC socket for the Photodiode signal monitor to the meter. Set the meter to DC volts. Point the fibre towards the Photodiode and register a signal on the meter. Systematically measure how the light output of the fibre changes with distance. The digital LED can also be used on a high flash rate. Ideally measurements should be taken in a completely dark area to eliminate background light. The effect of background light can however be subtracted from the readings.
Phototransistor Fibre
Holder
laser
sw rate
digital
recover power
sw
digital
LED
digital
signal audio
output
LED power
fibre
output
fibre
input
photo
input
signal
monitor
39
Plot the results on a graph with light intensity as the vertical axis and distance as the horizontal axis.
How does the light output from the fibre vary with distance?
The inverse square law states that the illumination of a surface by a point source is inversely proportional to the square of the distance between the source and surface.
2d
II s I = Measured Intensity d = source-detector distance Is = Source
Intensity Use the source intensity Is to calculate and plot light intensities at distances similar to those measured earlier.
Compare this graph to measured results and explain the significance for the design of fibre optic sensors based on reflection.

40
2.12 Launcing Light into Optical Fibre
Introduction Light from a LED or a laser has to be guided or coupled into the fibre. A lens is often used and chosen to collect all the light from the LED and to focus it into the fibre at the correct launch angle so all the light can travel through the fibre as shown in Figure 2.12.1 If the angle is too sharp light will be lost into the cladding of the fibre.
Figure 2.12.1 Light focused into a fibre.
This is known as coupling efficiency and is especially important in long distance fibres with core diameters less than 5 microns. The Numerical Aperture (NA) is a measure of how much light can be collected by an optical system such as an optical fibre or a microscope lens.
The NA is related to the acceptance angle a, which indicates the size of a cone of light that can be accepted by the fibre.
Figure 2.12.2 Acceptance angle of an optical fibre Both numerical aperture and acceptance angle are linked to the refractive index via:
NA = naSin a = (n12 – n2
2)1/2 Where n1 = refractive index of core n2 = refractive index of cladding na = refractive index of air (1.00)
LED Fibre LED Fibre LED Fibre
Launch angle too sharp Launch angle correct Launch angle too shallow
cladding
n1
n2
core
n2
cladding
air
a
n2
n1
core

41
The Minilab II is supplied with polymer multimode fibre with a core diameter of 1000 microns or 1mm. One way of measuring the NA of this fibre is to fill the fibre with light and measure the characteristics of the light leaving the fibre.
Aims To measure the acceptance angle of an optical fibre Calculate the numerical aperture
Equipment
Optical
Bench
Optical Mounts
Ruler
Optical fibre and holder
Imaging screen
Protractor
Activity Plug the fibre into the fibre output or digital LED output and position the components on the optical bench as shown in figure 2.12.3
Figure 2.12.3 Measuring numerical aperture The fibre output is a cone of light that spreads out wider as the distance from the fibre exit increases. The grid slide or screen and ruler can be used to measure diameters. The edges of the cone of light may appear fuzzy so there will be an error introduced into your measurements. Measurement of the edges is an approximation to the notion of Full Width Half Maximum (FWHM). This is how light boundaries are characterised as shown in figure 2.12.4
a screen Fibre
Fibre Holder
laser
sw rate
digital
recover power
sw
digital
LED
digital
signal audio output
LED
power
fibre
output
fibre
input
photo
input
signal
monitor

42
Figure 2.12.4 Optical pattern of a LED showing the FWHM points Measure distance and spot diameter for several different distances and plot the results on graph paper to scale. Measure the acceptance (emission) angle and calculate the numerical aperture. The LED light source for the fibre has a lens incorporated into the design to match the numerical aperture of the fibre.
FWHM
distance
intensity

43
2.13 Optical Fibre Sensors
Introduction Optical fibre sensors are extensively used in industry and have the advantage that the electronics can be housed well away from the sensor area. One type of sensor uses an illuminating and receiver fibre bundled together. The receiver fibre needs to pick up light reflected or diffused from a surface.
Figure 2.13.1 Sensor detecting changes in reflectivity of a moving surface
The sensor can be used in a digital way to detect objects travelling along a conveyor belt or the rotation of fan blades. An alternative use is through the analog mode in which a change in light intensity is recorded. This could be in response to a changing level of fluid in a tank or a change in the turbidity of a liquid or gas.
Aims To investigate how a simple optical fibre sensor works
Equipment
Optical bench
Optical Mounts
BNC-4mm Lead
Meter
Optical Fibres & Holders
Card
Activity Set up the components as shown in figure 2.13.2 Use the analog or digital fibre input and output. Place a piece of white card near the end of the illuminating and receiver fibres and set the meter to DC volts
moving
surface receive
fibre
transmit
fibre light source
detector

44
Figure 2.13.2 Simple reflective optical fibre sensor
Comment on the strength of the signal as the distance to the card and angle of the fibres is changed. For a sensor used to detect the distance from a reflective surface a calibration curve is necessary. The output from any light source changes with distance.
Fibres
screen
laser
sw rate
digital
recover power
sw
digital
LED
digital
signal audio output
fibre
output
fibre
input
photo
input
signal
monitor
meter
LED power

45
2.14 Light Intensity in Fibres
Introduction The power drops off with distance travelled by light in optical fibres. In this case signal loss or attenuation is measured in decibels. Decibels are based on a logarithmic scale and is the relationship between the input and output power.
inPower
outPowerLogDecibels_
_10
Aims To measure the loss of light power through a fibre
Equipment
Optical bench
Optical Mounts
Oscilloscope & BNC leads
Optical Fibres and Holders
Activity Place the short piece of fibre to link the digital transmitter and detector and connect in the oscilloscope as shown in figure 2.14.1
Loss in decibels Fraction of power remaining
Physical comparison
0.2 0.95 Loss undetectable by the eye
1.0 0.79 Reflection from a light surface
3.0 0.5 50% loss of light
10 0.1 Reflection from a dark surface
20 0.01 1% of light left
30 0.001 0.1% of light left

46
Figure 2.14.1 Measurement of light transmission through a fibre
Measure the voltage of the output signal. To do this turn up the volts/div control until the photodiode signal resembles figure 2.14.2 and fills the oscilloscope screen.
Figure 2.14.2 Voltage levels. Each vertical division corresponds to the
volts/div setting. Measure the length of the long piece of fibre. Connect up the long length of fibre and measure the new photodiode signal level. Assume the signal level through the short length is the original power and so calculate signal loss in decibels per kilometre based on the measurement through the length of fibre. Modern communication fibre has a loss approaching 0.2dB per kilometre A 20dB loss in light levels in a fibre is acceptable but at this point the signal has to be amplified. Communication fibre with a 0.2dB loss per kilometre can carry a signal 20/0.2 = 200kms before an amplifier is needed. How far would the polymer fibre carry a signal before the 20dB loss level is reached?
Extra activity If the oscilloscope is connected to digital recover the effect of signal restoration can be observed. The circuit contains an integrated circuit that can restore the signal to its original form or voltage level. This is one way to compensate for digital signal loss in a communications network.
volt/div volt/div secs/di
v
trig
ch1 ch2
radio
in
laser
sw rate
digital
recover power
sw
digital
LED
digital
signal audio
output
radio
signal LED
power
fibre output
fibre
input
photo
input
signal
monitor

47
2.15 Fibre Splices and Coupling
Introduction
Fibres often have to be joined together to connect different circuits, repair breaks or connect in optical amplifiers and lasers. This is known as splicing and various methods are available.
The best method is to weld the ends together using a device known as a fusion splicer. This machine melts, positions and welds the ends of fibre to each other.
A temporary splice is made by holding the fibre ends close together and surrounding the join with a special fluid to guide light from one fibre to the next.
Polymer fibre and some thicker glass fibre fit into end plugs that clip together.
Aims To produce a simple splice To couple light between two fibres using convex lenses Equipment
Optical
Bench
Radio
Lenses
Optical
Fibre and holders
Oscilloscope & BNC leads
Speaker or earphone
3.5-3.5mm
lead
Activity
To investigate the effect on the signal of splices obtain two lengths of fibre. Plug in a short length between a LED fibre emitter and fibre input and measure signal strength using the oscilloscope. To connect another fibre lay the ends next to each other and use a piece of adhesive tape as shown in figure 2.15.1
Figure 2.15.1 Spliced lengths of polymer fibre

48
Splice together two lengths of optical fibre and note any change in signal strength. Figure 2.15.2 provides an additional exercise in transferring light between fibres. Use the two 150mm convex lenses and the fibre holders.
Figure 2.15.2 Building a fibre coupling link.
Explain how the distance between the fibres and lenses was determined for optimal response.
Fibre
volt/div volt/div secs/div
trig
ch1 ch2
Speaker
radio
in
laser
sw rate
digital
recover power
sw
digital
LED
digital
signal audio
output
radio
signal LED
power
fibre
output
fibre
input
photo
input
signal
monitor
Radio

49
2.16 Signal Multiplexing
Introduction
Signal multiplexing is when more than one signal can be carried on an optical fibre (or wire). For optical fibres the correct term is Wavelength Division Multiplexing. Figure 2.16.1 shows three different wavelengths being combined and carried on the same fibre.
Figure 12.16.1 Wavelength Division Multiplexing WDM
The light is normally in the infrared and the wavelengths are very close to each other. This means that many light channels can be carried along the same fibre. The light signals do not interfere with each other and each wavelength can be separately recovered using filters 2.16.2 that only allow a single wavelength through.
Figure 2.16.2 Optical filter only allows one wavelength through
A diffraction grating bends light according to its wavelength. Figure 2.16.3 shows the
three different wavelengths being bent different amounts. A series of detectors can be
placed to detect each signal. The gratings can be fabricated into a length of fibre;
making it easier to extract the signals.
Figure 2.16.3 A diffraction grating separates different wavelengths of light
λ1 + λ1+ λ1
Optical Fibre
λ1
λ2
λ3
λ1
λ2
λ3
light
mix
Diffraction grating
Optical Fibre
λ1 + λ1+ λ1 light
separate
λ1
λ2
λ3
light
mix
λ1
λ2
λ3
Optical Fibre
λ1 + λ1+ λ1
λ2 filter
λ1
λ2
λ3
light
mix
λ1
λ2
λ3

50
Aims Demonstration of multiplexing using a polymer fibre and signal extraction using a filter.
Equipment
Optical
Bench
Radio
Lenses
Optical
Fibre and holders
Fibre Coupler
Perspex & filters
Speaker or earphone
3.5-3.5mm
lead
Activity
Connect the radio to its input. Use the coupler to connect the red LED output and the green LED (digital) output to each other. The light emerging from one of the arms should be a mixture of red and green.
Figure 2.16.4 Fibre coupler and splitter. Connect the output of the coupler to the fibre input and adjust the frequency of the digital output to a suitable audio frequency.
Figure 2.16.5 Listening to both multiplexed signals
Fibre
radio
in
laser
sw rate
digital
recover power
sw
digital
LED
digital
signal audio
output
radio
signal LED
power
fibre output
fibre
input
photo
input
signal
monitor
Radio Coupler

51
Both signals should be audible. To select just one of the signals use the single fibre Perspex coupler and a red or green filter. Insert a small piece of filter into the slot as shown in figure 2.16.5. Another short length of fibre will be required to connect the Perspex coupler to the fibre input.
Figure 2.16.5 fibre coupler and filter How effective are the red and green filters at selecting a signal? Consider the results from the absorption spectroscopy to assist in the explanation.
Extra Activity Work with another group and design a multiplex link carrying two audio and two digital channels between the two Minilabs.
fibre fibre
filter