Embed Size (px)
Citation preview

ANALYSIS OF KEY EXPERIMENTS OBTAINED IN DISCOVERY IN A QUI TAM
CASE
BY HELENE Z HILL1* AND JOEL PITT2
NJ Medical School1 and Georgian Court University
2
Numerical and radiobiological data subpoenaed during Discovery in a qui tam lawsuit were
analyzed. Coulter ZM cell counts and survival colony counts that comprised data in 8
publications, a successful R01 grant proposal and its renewal were reviewed. Chi-squared
analysis was performed on the terminal digits of the recorded numbers, which were expected to
be approximately uniformly distributed. Counts produced by one researcher in the laboratory
diverged significantly from this expectation and raised questions about the data. The p-value for
the goodness of fit to a uniform distribution applied to the terminal digits of 5,155 Coulter ZM
particle counter values from 171 of this individual’s experiments was less than 2.2 x 10⁻¹⁶
. The
chi-squared p-value for the terminal digits of 3,501 of colony counts in 114 experiments was also
less than 2.2 x 10⁻¹⁶
. In data produced by several other members of the same laboratory, the
terminal digits in 2,759 cell counts in 99 experiments from the same Coulter ZM particle counter
and 1,556 colony counts in 59 experiments were consistent with uniformity: the p-values
similarly obtained were 0.12 and 0.57, respectively. In the analyzed data of the questioned
researcher, the average or near-average value of triplicate colony counts appears as one of the
triples at a frequency that also greatly exceeds expectations. Additionally, results of two key
experiments could not be replicated in 22 attempts. Tritiated thymidine survival kinetics in the
22 experiments conform to radiobiological predictions but differ by orders of magnitude from
the questioned individual’s exponential survivals. This analysis underscores the importance of
access to raw data that form the bases of publications, reports and grant applications in order to
evaluate the correctness of the conclusions. Methods employed in this study may prove to be
useful to others in screening numerical data for anomalous results.
Experiments from Discovery in a qui tam Case
Page 2 of 34
Introduction
Various scientists have expressed concern regarding the lack of transparency of the research data
that form the bases of publications, reports and grant applications (Baggerly and Coombes 2011;
Tenopir, Allard et al. 2011). Tenopir et al. recently stated that “Data [sharing] helps verify
results data, which is a key part of the scientific process…data availability provides safeguards
against misconduct related to data fabrication and falsification (Tenopir, Allard et al. 2011).”
The need for open access to data became eminently apparent recently, when Baggerly and
Coombes re-evaluated studies that purported to provide oncologists with information regarding
patient tumor responses derived from microarray analysis (Baggerly and Coombes 2009). As a
result of their investigations, at least three clinical trials were suspended, several lawsuits have
been filed, at least ten articles have been retracted and the principal investigator, Anil Potti, has
resigned. Even more recently, the data in more than 150 papers co-authored by the eminent
Dutch social psychologist Diederik Stapel have come under fire after the revelation of statistical
irregularities. The theses of 14 of Stapel’s 21 graduate students are believed to contain spurious
results, and Stapel himself has admitted to wrong-doing (Vogel 2011).
The raw data we analyzed in this study were made available to us through subpoena during
Discovery in a qui tam lawsuit1 in which Roger W. Howell (principal investigator), Anupam
Bishayee (post-doctoral fellow) and the University of Medicine and Dentistry of New Jersey
were co-defendants. One of us, the relator (HZH), examined approximately 30,000 PDF copies
of notebook pages and other documents from the university and the laboratory that Howell
supervised from 1992 to 2004. Each document presented as evidence in the qui tam case bears a
unique Bates stamped number. Bishayee was employed by UMDNJ as a post-doctoral fellow in
the laboratory from October 1997 through July 2001. The examination of the raw data was
critical for the detection of the statistical and radiobiological irregularities reported herein.
Bishayee’s results were presented in 8 peer-reviewed publications co-authored with Howell
(Howell, Goddu et al. 1998; Bishayee, Rao et al. 1999; Bishayee, Rao et al. 2000; Bishayee, Rao
et al. 2000; Bishayee, Rao et al. 2000; Goddu, Bishayee et al. 2000; Bishayee, Hill et al. 2001;
Howell and Bishayee 2002) as well as in the original grant application (Howell 2000-2006) and
its renewal (Howell 2006-2011). Howell and colleagues continued to cite these publications as
recently as June 2011(Rajon, Bolch et al. 2011).
A second post-doctoral fellow, Marek Lenarczyk, found in his preliminary experiments that he
could not reproduce Bishayee’s results that pertained to the bystander effect for tritiated
thymidine and that had been reported in two publications (Bishayee, Rao et al. 1999; Bishayee,
Hill et al. 2001). Subsequently, Howell himself failed to confirm Bishayee’s results in both the
100% experiments and the 50% (bystander) experiments (Bishayee, Rao et al. 1999; Bishayee,
Hill et al. 2001). Both Howell and Lenarczyk followed the same two protocols that Bishayee
followed, and 16 of the attempts utilized the same cell line, Chinese hamster lung V79.
Lenarczyk also studied a closely related cell line, Chinese hamster ovary CHO-K1, in six
experiments. Scientists generally hold that the “reproducibility of scientific analyses and
processes” is a “requirement …at the core of the scientific method.” (Gil, Deelman et al. 2007)
1United States District Court District of New Jersey case no. 03-4837 (DMC). Qui tam is a suit filed by a private
individual – relator – on behalf of the federal government charging violation of the False Claims Act. The Court
ruled in favor of the defendants. The ruling was sustained on appeal.

Experiments from Discovery in a qui tam Case
Page 3 of 34
Armed with the foregoing information, we undertook in-depth statistical analyses of the
available data to evaluate the possibility that Bishayee’s anomalous results could have occurred
by chance or were the result of honest error. Our analyses led us to explore new approaches
beyond the standard chi-squared test to probe more deeply.
Our results are not based on statistics alone; they are bolstered by the reported radiobiological
results, which in our opinion are highly unlikely because of the experimental conditions that
prevailed, i.e., no deoxycytidine, which would have antagonized the tritiated thymidine block of
the cell cycle, was present during the exposure of the cells to the tritiated thymidine. Bishayee’s
results fail to demonstrate this block, whereas Howell, Lenarczyk and two other post-doctoral
fellows in the laboratory did observe the block, which was also apparent in similar studies of the
bystander effect for tritiated thymidine in Chinese hamster cells by Persaud, et al. (Persaud,
Zhou et al. 2005).
The Discovery documents made the in-depth statistical and radiobiological analyses we have
performed possible. This observation leads us to argue strongly for open access to the raw data
that support scientific publications.
Methods
Statistics
The raw data were processed using the statistical program R. R is a widely used, free, open-
source statistical package that is available in source form and in versions for Windows, Mac and
Linux through www.r- project.org. The primary data sets that we analyzed were triplicate
Coulter and colony counts that were independently drawn from suspensions of mammalian cells.
The Coulter ZM is a particle counter that counts single cells as they pass randomly through a
narrow orifice. Colonies arise from single cells that are distributed randomly onto tissue culture
dishes. Throughout this report, the accumulated data from Bishayee’s experiments are
independently paralleled to the accumulated data of other investigators.
Terminal Digit Analysis: The Mosimann method (Mosimann, Wiseman et al. 1995; Mosimann,
Dahlberg et al. 2002) (see below) was applied to test data sets of Coulter and colony counts
produced by Bishayee and other investigators (as controls) by forming new data sets of the
extracted right-most digits from the data values in the test data sets. The counts of individual
digits were tabulated, and the native R chi-squared test function (chisq.test ()) was used to test
the null hypothesis that the digits were drawn uniformly. The other investigators included eight
members of the laboratory other than Bishayee who utilized the same Coulter counter and/or
counted colonies in the same manner and two professors from out-of-state universities who
contributed data from their Coulter ZM counters. Significantly low p-values in the absence of
any other explanation of non-uniformity can indicate data manipulation in certain cases. The
Mossimann et al. statistical method is recommended as a forensic tool on the website of the
Office of Research Integrity of the Unites States Public Health Service
(http://ori.hhs.gov/misconduct/Tips_StatisticalForensics2.shtml). Tables 1 and 2 present two
examples of this analysis. Table 1 shows the actual counts in an experiment conducted by
Bishayee and an experiment conducted by another investigator in the laboratory. Table 2
tabulates the occurrence as terminal digits for each of the 10 digits (0 through 9) in the two data
Experiments from Discovery in a qui tam Case
Page 4 of 34
sets, along with the chi-squared distribution results. Note that both Coulter and colony counts
are, by definition, integers.
Equal Digit Analysis: An R function was written to extract pairs of terminal digits while
counting the total number of pairs (p) and the total number of equal pairs (e). The value of the R
pbinom(e,p,0.10) function was subtracted from 1 to obtain the probability that the number of
equal pairs exceeded the actual under the null hypothesis that the probability of equal terminal
digits is 0.10. Table 1 shows double equal terminal digits highlighted in red.
Calculation of mid-ratios: A function created in R was used to calculate the mid-ratios. For the
triplicate colony counts a, b, and c, in ascending order, the mid-ratio is the ratio of the difference
between the middle number and the lowest number to the difference between the highest number
and the lowest number (i.e.(b-a)/(c-a)). When one of the counts in a triple is close to the average
of the triple, the mid-ratio of that triple will be close to 0.5. (cf. Pitt, J Expert Report, in the
supporting material).
Table 3 shows the triplicate colony counts in an experiment by Bishayee and an experiment by
another investigator in the laboratory, along with the derived mid-ratios. The occurrence of the
rounded average in a number of the triples is shown in bold. Figure 1 is a PDF copy of the
notebook page of the same experiment by Bishayee with the rounded averages highlighted in
blue. Note that 9 of 10 of Bishayee’s triples contain the rounded triple mean, while none of the
10 triples of the other investigator contain the rounded mean.
Analysis of the number of triples that contain their rounded mean: We developed a method
to estimate the likelihood that a given number of triples in a collection contained their own
rounded mean. To do so, we needed to evaluate the probability that a randomly chosen triple
contains its own mean. It seems reasonable that this probability varies with the size of the gap,
i.e., the difference between the largest and smallest colony counts of the triple (See Table 4 for
gaps of the triples in Table 3). There is, however, an important difference that affects the
estimates of the probability that a triple with an even gap contains its rounded mean and the
probability that a triple with an odd gap contains its mean. This difference arises from the simple
algebraic fact that when the gap between the highest and lowest value of a triple is even, there
will only be one middle value that could complete it as a triple containing its own mean, whereas
when the gap is odd there will be two middle values. For example, for colony counts with a =10
and c =20, the gap is 10 (even), and the only possible middle value that would create a triple that
contains its mean is 15. The rounded mean of the triples (10, 14, 20; mean=14.7), (10, 15, 20;
mean=15) and (10, 16, 20; mean=15.3) is 15 for all three triples. However, only (10, 15, 20)
actually contains the rounded mean. For colony counts with a = 10 and c = 21, the gap is 11
(odd), and there are 2 middle values: 15 and 16. The mean of the triple (10, 15, 21) is 15.33,
which rounds (down) to 15, whereas the mean of (10, 16, 21) is 15.67, which rounds (up) to 16.
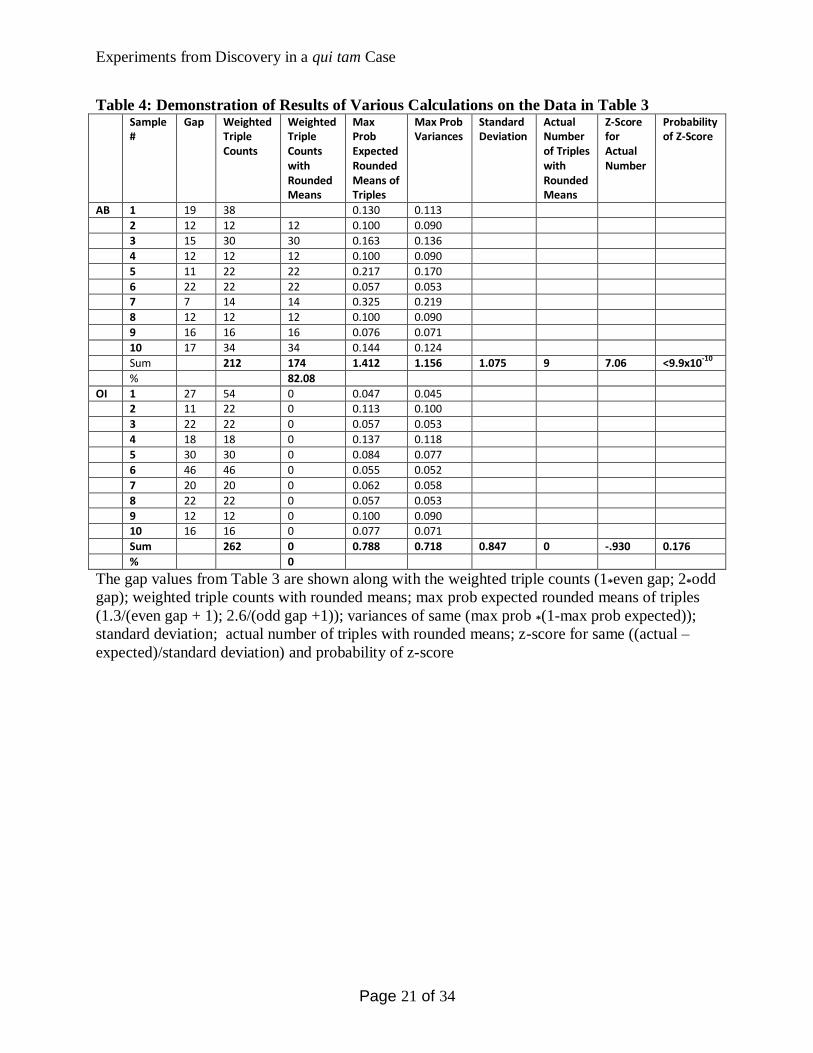
The weighted triple counts in Table 4 serve to compensate for the impact of odd versus even
gaps in these and other experiments.
Simulations led to the hypothesis that the probability that a given, randomly selected triple
contains its rounded mean should not exceed 1.3/(gap +1) if the gap is even and 2.6/(gap +1) if
the gap is odd. We refer to this value as the max prob case and use it to obtain an upper bound
estimate of the probability that, in a given collection of triples with known gaps, the actual
number of triples that contain their mean equals or exceeds an observed value. Indeed, as the
parameter of the Poisson distribution from which the triples are drawn becomes larger, the

Experiments from Discovery in a qui tam Case
Page 5 of 34
probability that the mean is one of the counts of a triple with gap d appears to approach 1/(d+1)
when d is even and 2/(d+1) when d is odd.
To count the number of triples that contain their rounded mean, we assign a value of 1 to the
triples that contain their rounded mean and a value of 0 to the triples that do not contain their
mean; we then sum these ones and zeros. Hence, under the max prob case, we view the number
of triples that contain their mean as the value of the sum of variables, each of which takes the
value 1 with probability 1.3/(d +1) if the gap is even and 2.6/(d+1) if the gap is odd. We can
obtain the expected value of this sum by summing the various individual Bernoulli probabilities,
i.e., by writing the probability of a value of 1 for a given gap as p(gap). Thus, for a collection of
triples with gaps gap1, gap2, gap3, ..., gapn, the expectation is p(gap1) + p(gap2) + p(gap3) +...+
p(gapn). The 6th column in Table 4 shows these expectations for the various triples. Similarly,
we find the variance of the sum by adding the individual Bernoulli variances. For a given gap,
the variance will be p(gap)*(1-p(gap)) (cf column 7 in Table 4). After adding these individual
variances, we find the standard deviation by taking the square root
(http://en.wikipedia.org/wiki/Standard_score) (column 8 in Table 4).
The Lyapunov version of the Central Limit Theorem (Fisz 1961) applies, which indicates that
the sum of these Bernoulli random variables will have a near-normal distribution. Accordingly,
we use tables for the normal distribution to estimate the tail probabilities. To double-check the
applicability of our use of the normal approximation, we performed bootstrap calculations of the
probabilities, using R to perform sets of 200,000 trials. These results did not deviate significantly
from our estimates using the normal distribution.
Because the probability distribution of the number of triples in a given set that actually contain
their mean would be approximately normal in the max prob case, the mean and standard
deviation for that normal distribution can be readily computed from the sizes of the gaps in the
collection. We can use our knowledge of the distribution in the max prob case to construct a
simple test of the weaker hypothesis that the probability that the mean of a triple with gap d is
one of the counts is less than 1.3/(d+1) when d is even or 2.6/(d+1) when d is odd. We construct
this test by observing that, under this hypothesis, the probability that the actual number of triples
that contain their mean meets or exceeds a given value is certainly less than the probability of
meeting or exceeding that same value in the max prob case. Thus, once we know the mean and
standard deviation for the max prob case, we can obtain an upper bound for the p-value of the
actual number of triples that contained their mean by calculating the z-score (the difference
between the actual and expected values divided by the standard deviation) for that number and
determining the probability that a standard normal variable exceeds that value. Table 4 shows
the z-scores for the two data sets, along with the corresponding probabilities.
Results and Discussion
Terminal Digit Analysis of Cell and Colony Counts
Mosimann et al. (Mosimann, Wiseman et al. 1995; Mosimann, Dahlberg et al. 2002) observed
that when "digits are ... recorded well beyond the repeatability of an experimental procedure,”
the insignificant and particularly the right-most/terminal digits tend to be uniformly distributed.
They added that “most people are unable to choose digits randomly.” In many experiments
performed in the laboratory, the concentrations of cells in single-cell suspensions were evaluated
in triplicate using a Coulter ZM particle counter. The numbers of colonies distributed on the
plastic surfaces of tissue-culture dishes were also evaluated in triplicate by
Experiments from Discovery in a qui tam Case
Page 6 of 34
counting and marking each (stained) colony on the underside of its dish. We expected that
because the rightmost digits of these counts were determined to be “well beyond the repeatability
of the experimental procedure," they would be randomly or uniformly distributed, as had been
demonstrated in a similar situation by Mosimann et al. for radioactivity counts recorded on hard
copies from a scintillation counter.
The histograms in Figure 2 show the frequencies of the terminal digits of the Coulter counts from
other members of the laboratory (Figure 2A) and from Bishayee (Figure 2B). The terminal digit
counts of the other researchers exhibit reasonable uniformity, in that no single digit appears in
fewer than 8% or more than 12% of the data values, whereas the digits 2, 5 and 9 appear as the
right-most digit in more than 14% of Bishayee’s data values, and the digit 4 appears in fewer
than 6% of Bishayee’s data values. Similarly, the histogram for the terminal digits drawn from
the colony counts of other researchers in the laboratory is consistent with the expectation that
these digits should be uniform (Figure 2C); again, Bishayee's values are not uniform (Figure
2D). As in Bishayee's Coulter counts, the frequencies of 2, 5 and 9 are high, whereas the
frequencies of 1, 3, 4 and 7 are low.
The results of applying chi-squared tests for goodness of fit to a uniform distribution to the sets
of the terminal digits of the data collected by various investigators are shown in Table 5. The
results of other investigators are fully consistent with the expectation that the least significant
digits of these types of data values are ordinarily uniform and stand in sharp contrast to the
significant rejection of the uniformity hypothesis that results from applying the same test to
Bishayee’s data. The p-values for the chi-squared test applied to Bishayee's data sets are not
only less than 0.05, which is conventionally the level used to determine whether the results of
a statistical test are "significant" enough to permit the rejection of the null hypothesis (in this
case, the hypothesis that the digits are a random sample from a uniform distribution), but they are
also far less than the 0.01 level at which results are often termed "very significant" and even far
less than the "extremely significant" 0.001 level.
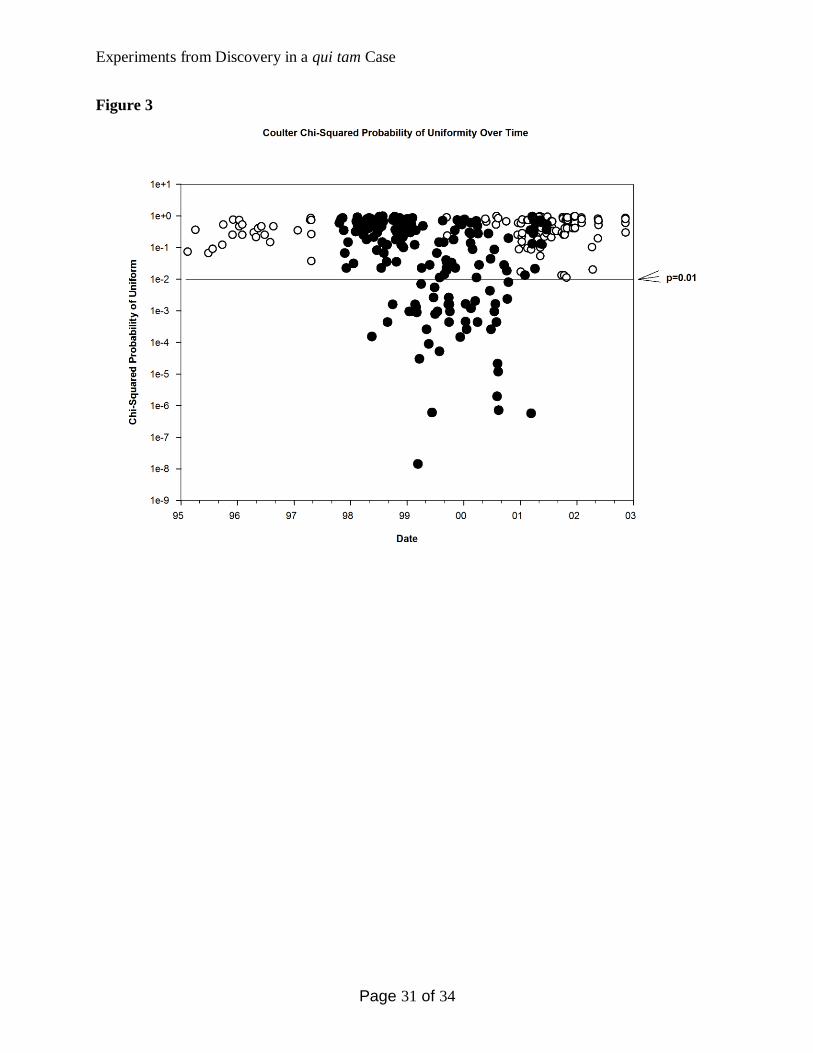
Figure 3 depicts, on a semi-log scale, the separate chi-squared p-values (for goodness of fit to a
uniform distribution) for the terminal digits of the Coulter counts from 288 individual
experiments conducted in the laboratory between February 1995 and October 2001. For 45 of
these experiments, the hypothesis that the terminal digits of the data values were drawn
uniformly would be rejected at the 0.01 level (a stringent testing condition); all 45 of these
experiments were conducted by Bishayee. The many experiments in which his chi-squared
values are consistent with uniformity (>0.01) indicate that Bishayee's results are not likely the
result of instrument malfunction.
If the two right-most digits in the Coulter data are uniformly or randomly distributed, then the
probability that they will be equal is 0.1. Whereas 280, or 10.1%, of the right-most digit pairs of
2,759 Coulter values from the other investigators were equal, 636, or 12.3%, of the pairs from
5,155 of Bishayee’s Coulter values were equal. The proportion of equal right-most digit pairs
from the other investigators falls into the 95% confidence interval (0.092, 0.111), whereas the
95% confidence interval for Bishayee’s equal-pair frequency is (0.116, 0.130). Assuming that
these right-most pairs were generated uniformly, the probability of 636 or more equal pairs in
5,155 Coulter values is less than 2.8 x 10⁻⁸
, which significantly contraindicates their expected
randomness. In contrast, the probability of 280 or more equal pairs among 2,759 Coulter values
for the other researchers is 0.38, which is consistent with our randomness hypothesis. (cf. Pitt, J
Expert Report, in the supporting material). Obviously, the terminal duplicates would be

Experiments from Discovery in a qui tam Case
Page 7 of 34
expected to be randomly or uniformly distributed by digit, as are the terminal digits. This
property holds for the other members in the laboratory: the chi-squared p-value is 0.30.
However, the p-value for Bishayee’s data is, again, considerably less than 2.2 x10⁻¹⁶
. The
terminal doublet distributions are shown in Figure 2A and 2B.
Frequency that the Average Value of Three Colony Counts Appears as One of the Triples
The appearance of the average or near-average (average ± 1) value of the colony triples appeared
frequently as one of the three values in Bishayee’s colony counts. To evaluate this observation
in greater depth, we sorted each colony count triple in ascending order and calculated its mid-
ratio (cf. Methods). The results of these calculations are shown in Figure 4. The graph in 4A
shows the mid-ratio distribution of 486 triples in 58 experiments that were performed by
investigators other than Bishayee in the laboratory, whereas graphs 4B – 4I show the mid-ratio
distributions from Bishayee's experiments with various radioactive isotopes. (The graph in 4C
represents 190 triples in 13 100% tritiated-thymidine experiments and will be discussed below.)
The contrast between 4A and the other graphs is immediately apparent. The distribution of the
mid-ratios of the triples reported by the investigators other than Bishayee is reasonably uniform
across the set of all of the potential values, which range from 0 to 1 in increments of 0.1. In the
graphs of Bishayee's mid-ratios, the bars between 0.4 and 0.6 protrude distinctly above the
others.
Upon closer examination, we noticed that the relative frequency with which the average or near-
average appeared as one of the values of a triple was not exceptionally high in the data values for
the control (usually not radioactively exposed) colonies in Bishayee's experiments, although it
seemed unusually high in the test sample (usually radioactively exposed) triples. To provide a
better quantification of our observation, we identified the triples that contained at least one
colony count that was exactly equal to the rounded value of the mean of the triple and performed
separate counts of these triples for Bishayee's control triples and test triples as well as the control
triples and test triples of the other investigators. We calculated the relative frequency with which
such triples occurred in each group. When the difference between the lowest and highest values
of a triple is less than two, the rounded average of the counts in the triple will always be a count
in the triple. Therefore, we considered only those triples in which the difference was greater than
or equal to 2. The results of this analysis are shown in Table 6. Sixty-four percent of Bishayee's
test triples contain the rounded mean as one of the counts, whereas the frequency of this effect in
the other three data sets is less than 18%.
When the counts of triples are selected by the same random mechanism, the likelihood that one
of the counts is equal to the mean value of the triple varies with the gap size of the triple (i.e., the
difference between the largest and smallest counts in the triple). The variation is complicated by
the fact that when the gap is odd, there are two possible mid-values that can complete a triple
that includes its own mean, whereas when the gap is even, there is only one such value (cf.
Methods).
It is, of course, possible that the unusually high frequency of triples containing their mean in
Bishayee's test data might be the result of a preponderance of triples in which the gap is small.
To compensate for this possibility, we performed a more elaborate calculation (described in
detail in the next paragraph) in which we effectively weighted the triples in which the mean
appeared, based on the foregoing observations regarding gap sizes.
Experiments from Discovery in a qui tam Case
Page 8 of 34
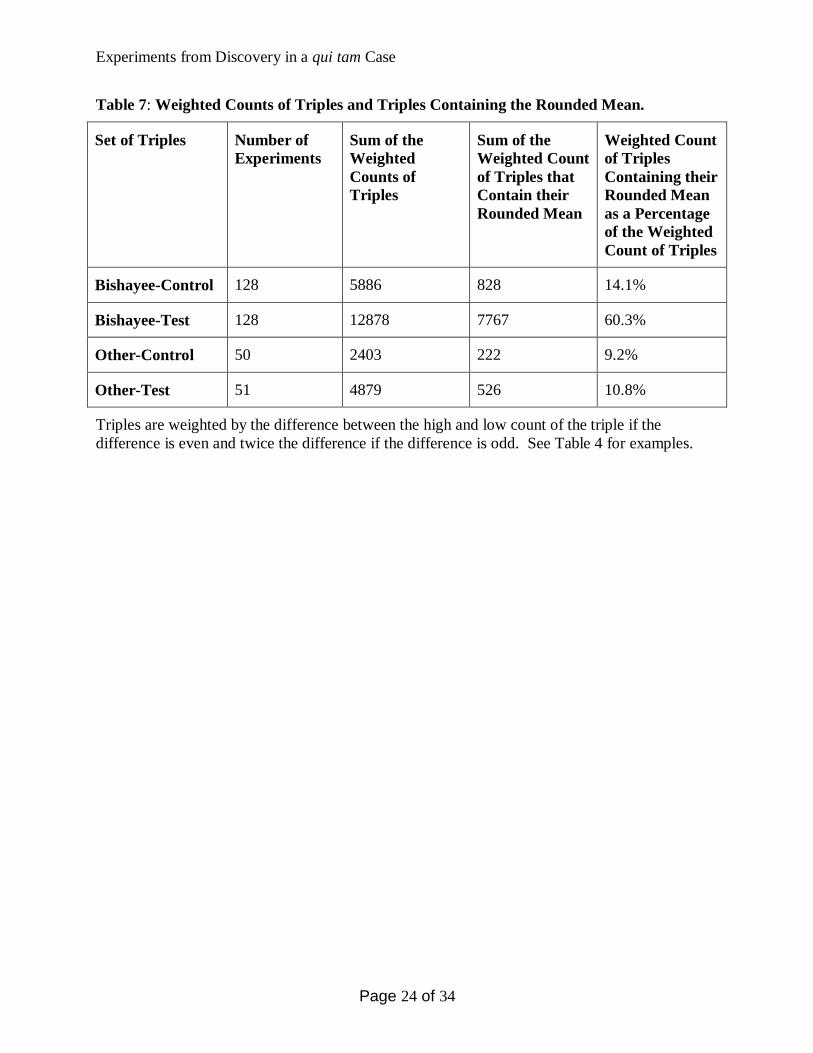
Rather than counting the number of triples that contained the mean, we summed the gaps for all
of the triples that contained their mean and divided that sum by the sum of all of the gaps. The
results are shown in Table 7. Although this approach is not standard, it is more conservative
because it takes the size of the gaps into account, and once again, the result (60.3%) that we
obtained for Bishayee's test triples is markedly larger than the results for the other three data sets,
which were all less than 15%.
We pursued the investigation one step further to estimate the probability that the discordance
between the rate at which the average value appeared in Bishayee's test triples and the rate at
which it appeared in the other data sets might have been the result of chance. We developed the
concept of the max prob case, as explained in the Methods section.
We applied this test to the triples that Bishayee recorded for colony count controls and colony
count test runs, as well as to those recorded by the other investigators. The entries in the first
column of Table 8 identify the specific sets of triples that we considered. Each entry in the
second column is the calculated mean in the max prob case; the third column displays the
standard deviation for the max prob case; the fourth column displays the actual number of triples
in the set that contained their mean; the fifth column displays the corresponding z-value; and the
sixth column displays the probability of meeting or exceeding that z-value in a standard normal
distribution.
Bishayee's control and test counts are both significantly above the expected levels. The z-score
for the test values indicates there is a very small probability that so many triples could have
contained their means by pure chance.
The results for the triples produced by other investigators are entirely consistent with our null
hypothesis. Indeed, the actual number of triples that contain their means is less in both cases
than the expected value under the null hypothesis, which is not entirely surprising given that the
expectation is computed based on the max prob case, which is hypothesized to overestimate the
likelihood that a triple contains its mean.
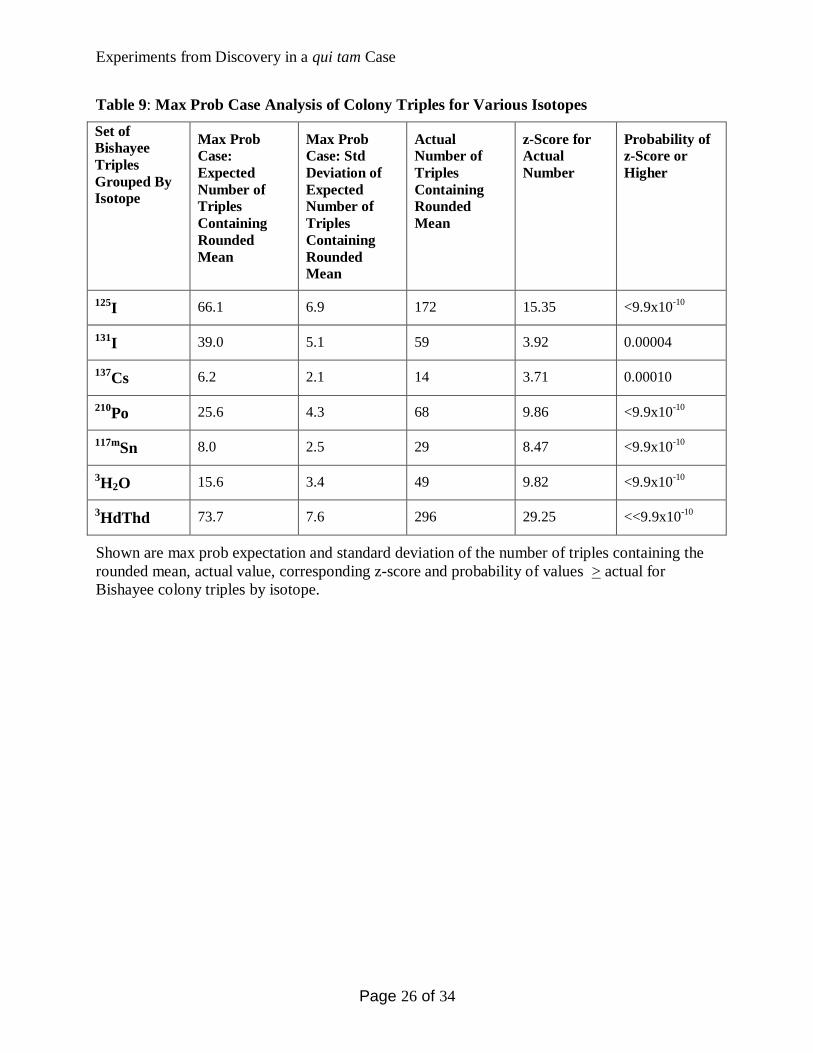
In Table 9, we display the results of applying the same analysis to the distinct sets of triples that
correspond to the different isotopes for which Bishayee recorded colony counts. All of the
results are highly significant.
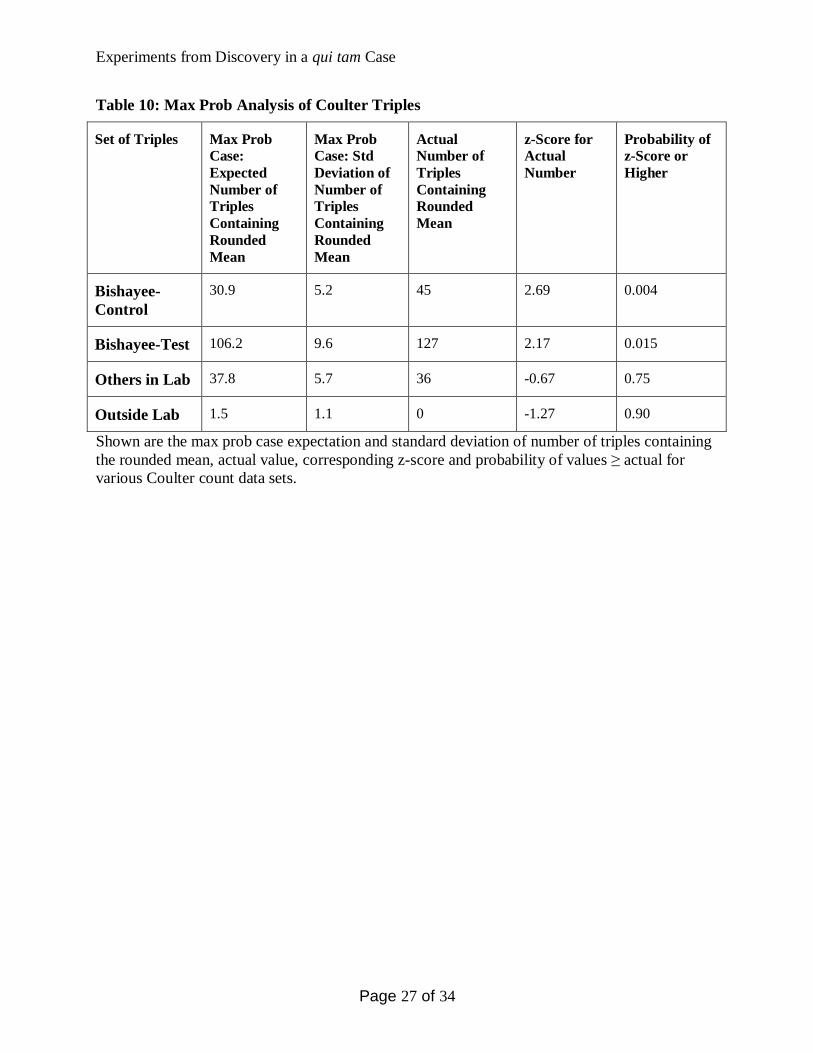
Although we formulated our hypothesis after observing the triples of the colony counts, the same
analysis applies to the triples of the Coulter counts. Consequently, we applied the foregoing
hypothesis test to the Bishayee Coulter count triples, the Coulter count triples for the other
investigators in the same laboratory and the Coulter count triples that we had obtained from
investigators in other laboratories. The results are shown in Table 10. Again, the number of
triples that contain their mean in Bishayee's data sets is significantly higher than would be
expected under the null hypothesis, whereas the value for the triples reported by the other
investigators are entirely consistent with the null hypothesis.
Tritiated Thymidine Experiments and the Role of Deoxycytidine
Thymidine concentrations of approximately 1 mM or greater in the tissue culture medium block
the cell cycle at the G1/S interface and during S phase (Tobey, Anderson et al. 1967; Hall and
Giaccia 2005). Radiation blocks the cell cycle primarily in G2 (Hall and Giaccia 2005). High-
specific-activity tritiated thymidine blocks the cell cycle and kills cells at nanomolar
concentrations (Ehmann, Williams et al. 1975; Pollack, Bagwell et al. 1979; Hoy, Lewis et al.

Experiments from Discovery in a qui tam Case
Page 9 of 34
1990; Hu, Black et al. 2002). The cell-cycle-blocking effect of thymidine is reversed by
deoxycytidine (Morris and Fischer 1960; Bjursell and Reichard 1973; Fox, Tripp et al. 1980;
Wheater and Roberts 1987; Hiramoto, Narahara et al. 1990).
Numerous reports have described the killing effect of tritiated thymidine on cultured mammalian
cells. The cells are generally incubated with the isotope up to or beyond the cell-cycle time
before plating for colony formation. Storage under non-growing conditions allows more tritium
decay before plating. The survival curves take 3 forms: (1) monotonic exponential; (2) initial
shoulder, then exponential; and (3) biphasic, i.e., a rapid decline in survival followed by a slower
decline or plateau. When the exponential killing occurred without (Burki and Okada 1970;
Chan, Lisco et al. 1976) or with (Marin and Bender 1963; Burki, Roots et al. 1973; Bedford,
Mitchell et al. 1975; Burki, Koch et al. 1978) a shoulder, deoxycytidine was also present in the
medium, or its presence was inferred (Elkind and Sutton 1960; Sinclair 1964; Burki, Roots et al.
1973). In its absence, the survival curve was biphasic (Drew and Painter 1959; Drew and Painter
1962; Burki and Okada 1970; Keprtova and Minarova 1985; Hu, Black et al. 2002; Persaud,
Zhou et al. 2005), with only one exception (Panter 1981).
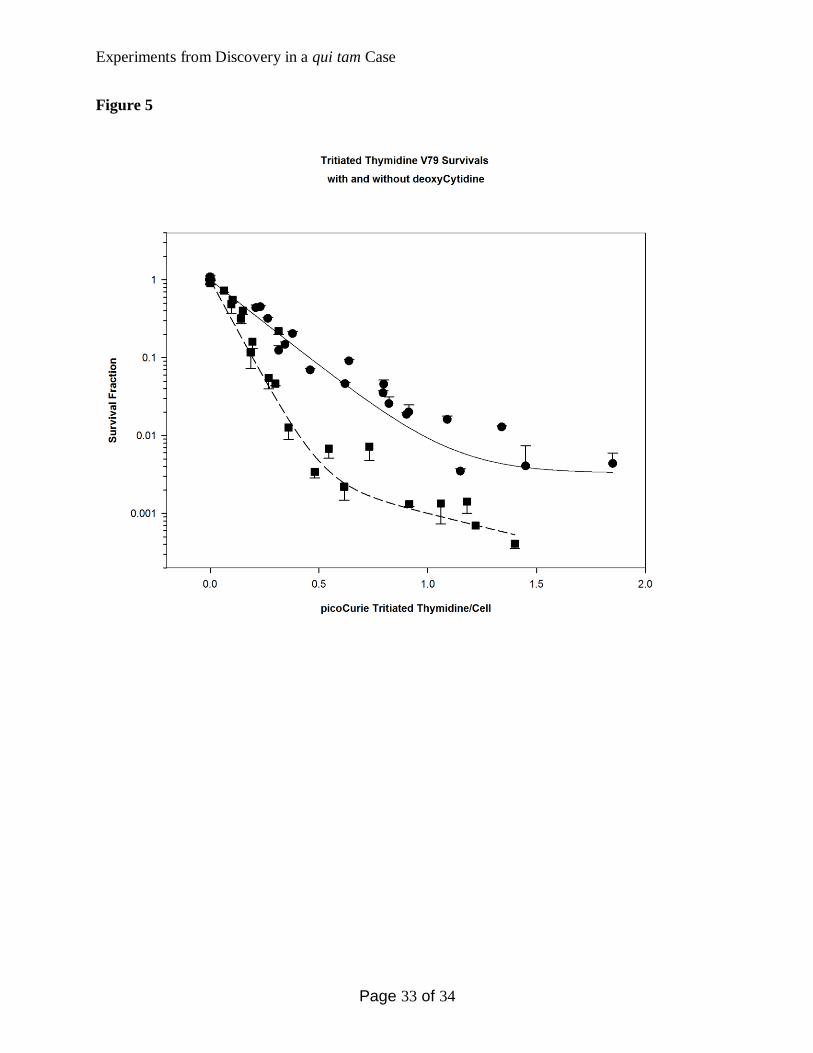
In six experiments from the laboratory obtained during Discovery, the V79 cells were incubated
with increasing concentrations of high-specific-activity tritiated thymidine with and without
deoxycytidine for approximately one cell cycle before plating for colony formation (Figure 5).
Both survival curves are biphasic, but the final plateau is approximately 15-fold lower with
deoxycytidine than in its absence, which confirms the reversal of the cell cycle-blocking effect of
tritiated thymidine by deoxycytidine.
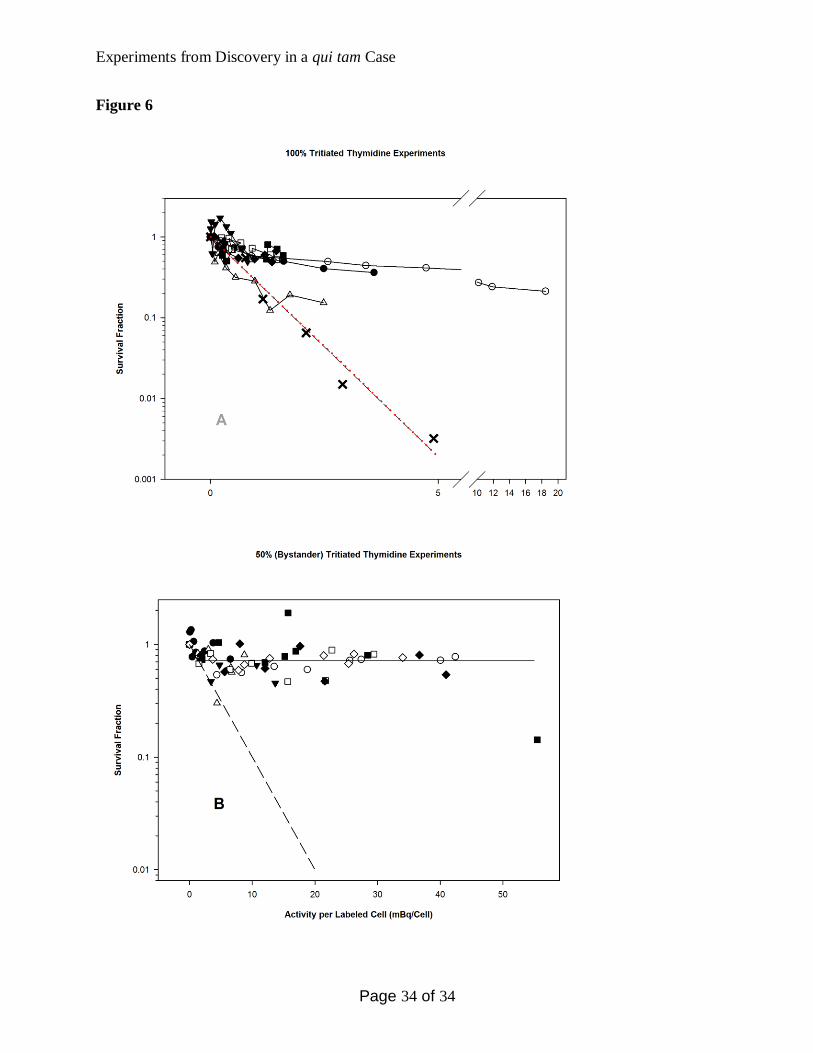
Howell and Lenarczyk performed a total of ten 100% experiments (all cells exposed to tritiated
thymidine): 7 experiments involving V79 cells and 3 experiments with CHO-K1 cells. No
deoxycytidine was present. The V79 survival curves were biphasic and reached a plateau of
approximately 0.5, except for one curve that reached a plateau at approximately 0.3 (Figure 6A).
These survival results contrast with Bishayee’s exponential decline, which was reported in two
publications (Bishayee, Rao et al. 1999; Bishayee, Hill et al. 2001) (dashed line). The CHO-K1
survival curves are similar, but they reach a plateau at approximately 0.3 (data not shown).
Howell’s and Lenarczyk’s V79 results are consistent with the V79 biphasic survival curves
reported by Keprtova and Minarova (Keprtova and Minarova 1985) under similar conditions.
Howell’s ultimate survival at 5 mBq is approximately 160 times greater than Bishayee’s
following the same protocol. (See supporting material, Expert Report of Michael Robbins).
The defense’s expert witness in the qui tam case argued that the exponential survival slope in
Bishayee’s 100% experiments was predicted from radiobiological principles (cf. Table 1 in both
references (Bishayee, Rao et al. 1999; Bishayee, Hill et al. 2001)) (Figure 6A). The 100% slope,
i.e., A1 in reference 2, was computed from the survival curves of eight experiments to be the
predicted 0.8 mBq per labeled cell. Thirteen 100% experiments were found in the PDF files
examined during Discovery; the triple colony analysis is shown in Figure 4C. The p-values for
the uniformity of the chi-squared tests for the terminal digits of the Coulter and colony data for
these experiments are 1.26 x 10⁻⁷
and 2.5 x 10⁻⁴
, respectively. These values are significant
indicators that the terminal digits were not drawn uniformly. The distribution of the triples in
Figure 4C does not conform to that of the controls in Figure 4A. (See supporting material,
Expert Report of Ludwig Feinendegen.)

Experiments from Discovery in a qui tam Case
Page 10 of 34
The defense expert also posited that exponential survival curves would occur in the absence of
deoxycytidine, as seen in Bishayee’s 100% experiments, because the thymidine concentration in
the high-specific-activity nuclide is too low to affect the cell cycle. “Under these conditions
[high specific activity] 3H-TdR becomes a true tracer of physiological metabolism and does not
perturb the … nucleotide pool” (from Expert Report, Ludwig E. Feinendegen, MD., June 2009).
However, both Keprtova and Minarova (Keprtova and Minarova 1985) and Hu et al. (Hu, Black
et al. 2002) reported biphasic survivals when using similar high-specific-activity tritiated
thymidine. Furthermore, Cleaver and Holford found that a 10-minute pre-incubation with 10-9
M
thymidine decreased the incorporation of 2.5 x 10⁻⁶
M tritiated thymidine into the DNA by 10%,
which indicates that minute amounts of thymidine perturb the intracellular thymidine pool
(Cleaver and Holford 1965). The results in Figure 5 also support the conclusion that
deoxycytidine is needed to abrogate the blocking of the cell cycle by tritiated thymidine. (See
supporting material, Expert Report of Ludwig Feinendegen.)
Fifty Percent Experiments and the Bystander Effect
In 1992, Nagasawa and Little showed that 30% of an irradiated population of CHO cells had
increased sister chromatid exchanges, which were indicative of DNA damage (Nagasawa and
Little 1992), even though only 1% of the cells were traversed by an alpha particle. This
phenomenon is known as the bystander effect and also occurs following exposure to other types
of radiation. Bishayee and Howell claim to be the first to show a bystander effect using tritium
(Bishayee, Rao et al. 1999; Bishayee, Hill et al. 2001); they claim that the bystander effect is
abrogated by DMSO, which is a scavenger of reactive oxygen species (ROS), and by lindane,
which is an inhibitor of gap junction intracellular communication (GJIC), thereby implying that
the bystander effect is transmitted by cell-to-cell communication involving the transfer of ROS.
However, others have shown that bystander effects in CHO cells are transmitted through the
medium (Vines, Lyng et al. 2009). Bystander effects in radiation impact both radiation therapy
and nuclear medicine (Mothersill, Moriarty et al. 2004; Banaz-Yasar, Lennartz et al. 2008).
Inaccurate information could lead to errors in treatment planning, allowable doses in diagnostic
radiation and permissible workplace exposures.
“Clusters,” or mixtures of cells, of which half were exposed overnight to tritiated thymidine and
half were unexposed (bystanders), were incubated for 72 h in the cold. Data in Bishayee’s
experiments purports to demonstrate that both exposed cells and bystanders are killed during this
union. Lenarczyk performed five such “50%” experiments with V79 cells and three with CHO-
K1 cells. Howell also performed four 50% experiments with V79 cells. The V79 experiments
are summarized in Figure 6B and are compared to the 50% experiments in the two published
reports (Bishayee, Rao et al. 1999; Bishayee, Hill et al. 2001) (dashed line). There was a 70-fold
difference in the survival at the highest radiation levels, although the experiments followed the
same protocol. Lenarczyk’s and Howell’s experiments reach a survival plateau at approximately
0.70, whereas their 100% survival (cf. Figure 6A) leveled at approximately 0.5. Because the
exposed cells comprise half the mix, the overall expected survival would be 0.75, assuming that
no bystanders are killed.
The Helena Tubes Are Hypoxic
Hypoxic conditions decrease the lethal effects of low linear energy transfer (LET) radiation
(tritium, gamma and X-rays) by up to approximately 3-fold; this is the so-called “oxygen effect.”
(Hall and Giaccia 2005)

Experiments from Discovery in a qui tam Case
Page 11 of 34
Howell designed an experiment to test the clusters for hypoxia (see details in the supporting
material). The cells in half the tubes were undisturbed and potentially hypoxic, and the cells in
the other half were re-aerated (resuspended) after 72 h of incubation in 0.4 ml of medium in
capped Helena tubes (0.4 ml capacity). The survival and mutation (Hsie, McElheny et al. 1979)
were measured in ten samples (5 re-aerated, 5 potentially hypoxic). In Bishayee’s experiment,
the mutation testing required 120 Coulter data counts; the terminal digit analysis for uniformity
determined a chi-squared p-value of 7.4 x 10⁻¹³
. The average of the three survival colony counts
for each sample appeared as one of the counts of the triple in the 6 irradiated samples and 1
control (Z-score 5.86, p(z) = 2.31 x 10⁻⁹
). The relator examined some of the dishes that were
believed to contain mutant colonies and reported to Howell that she found no mutant colonies on
them, even though Bishayee reported mutant colonies for all the data points in this experiment.
Howell made no comment. Bishayee’s results showed somewhat less killing and fewer mutants
in the undisturbed samples, “clusters”. These results were displayed in Figure 7 of the grant
application and allowed the referees to conclude that severe hypoxia was not present in Howell’s
clusters, which were designed to model the human isotope distribution in nuclear medicine.
Two weeks earlier, the relator had followed the same mutation protocol with V79 cells. The re-
aerated cultures showed a marked increase in mutants, but there was no increase in mutants in
the undisturbed cultures. The relator concluded that severe hypoxia was present in the Helena
tubes; these results conflicted with Bishayee’s results for the same protocol. Bishayee’s
experiments and the relator’s experiments are included in the supporting material (B007891-
B007900; B013918-B013926; B020145-B020151).
No repetitions of this experiment were found in the Discovery documents. The gamma ray
survival studies in Helena tubes performed by Lenarczyk and a later post-doctoral fellow
similarly indicated severe hypoxia (cf. Robbins, MR Expert Report in the Supplemental
Material).
Investigators at Columbia University using CHO cells in microfuge tubes that allowed 100 ml of
air above the medium demonstrated a bystander effect for tritiated thymidine (Persaud, Zhou et
al. 2005). Their 100% survival tends towards a plateau of approximately 30%, which supports
the results of Howell and Lenarczyk but not Bishayee.
Summary
We have recorded the following observations:
1. Coulter count terminal digits: Bishayee’s digit distributions differ significantly from the
expected (near) uniform frequencies; those of the other investigators do not.
2. Colony count terminal digits: Bishayee’s digit distributions differ significantly from the
expected (near) uniform frequencies; those of the other investigators do not.
3. Right-most and next to right-most Coulter digits: Bishayee’s doublets are equal at a frequency
that deviates from the expectation of randomness; those of the other investigators do not deviate
significantly from the expectation of randomness. Furthermore, the distribution of the doublet
values of the other investigators is also not significantly different from the expectation of
randomness, whereas the distribution of Bishayee’s doublet values is considerably different from
the random expectation.
Experiments from Discovery in a qui tam Case
Page 12 of 34
4. Values that are very near the average appear as one of the counts in Bishayee’s triple colony
counts at significantly higher frequencies than expected. The rate at which this phenomenon
occurs in the triple data from others is consistent with expectations of random.
5. One hundred percent experiments: In the absence of deoxycytidine, Bishayee’s exponential
survival curves differ from the results in the literature; additionally, the results of Howell and
Lenarczyk indicate biphasic survival curves that are similar to the majority of the reports that
were found in the literature.
6. Fifty percent experiments: Bishayee’s results differ markedly from the results of Howell and
Lenarczyk, who followed the same protocols.
7. Twenty-two attempts by Howell and Lenarczyk failed to replicate or confirm Bishayee’s
100% and 50% tritiated thymidine results.
8. It is likely that the “clusters” in the Helena tubes are hypoxic.
9. There is an eye-witness report by the relator that there were no mutant colonies in Bishayee’s
dishes that she examined in an external beam gamma ray experiment, and his purported report of
mutant induction in the absence of re-aeration conflicts markedly with the relator’s results
following the same protocol. Additionally, the chi-squared probability that the terminal digits in
Bishayee’s 120 Coulter counts in this experiment are uniformly distributed is less than 8 x 10-13
.
As of December 2011, there were 267 citations of the papers of Bishayee and Howell, of which
the most recent occurred in September 2011. Howell has cited the papers in his own
publications as recently as June 2011.
This analysis raises serious questions about the results that provided the experimental
background for several published papers as well as a grant application and its renewal. Had this
information been known to the study section and the referees, would it have altered their
decisions? With the vast capabilities of the worldwide web to store information, should not the
raw data on which such decisions are based be made publicly available? A prototype for the web
storage of experimental data has already been established by the physics community (Ginsparg
2011), and electronic notebooks are encouraged to facilitate data sharing and analysis (Butler
2005) (see also (Tenopir, Allard et al. 2011)). These practices could help to avoid the publication
of material that does not have strong experimental support or that is otherwise unreliable.
The statistical analysis of numerical data can be used to identify aberrant results (Tomkins,
Penrose et al. 2010; Postma 2011; Tomkins, Penrose et al. 2011). Terminal digit analysis, as
described by Mossimann et al. (Mosimann, Wiseman et al. 1995; Mosimann, Dahlberg et al.
2002), provides a simple method for detecting anomalous data, and we show in this study that
the careful observation and analysis of recorded values can lead to additional understanding of
deviations from expectations of randomness. Recently, a rigorous statistical analysis of data that
purported to predict the responses to chemotherapeutic agents of human lung, breast and ovarian
cancers demonstrated the erroneous nature of the results (Baggerly and Coombes 2009; Baggerly
and Coombes 2011) and led to several retractions (Baggerly and Coombes 2010; Goldberg 2010;
2011; 2011) and a resignation (2010). In this case, patients were potentially directly affected by
the use of the wrong drug and/or the withholding of the right drug. The experiments reported in
the Howell studies were designed to “correlate biological response with mean absorbed dose …
in diagnostic and therapeutic nuclear medicine…. In….diagnosis, the risk of radiation insult can
…be drastically underestimated and … lead to increased risk of inducing cancer. In contrast,

Experiments from Discovery in a qui tam Case
Page 13 of 34
patients can be over or under treated in radionuclide therapy of cancer.”(Howell 2000-2006)
Howell’s research was designed to prevent these untoward outcomes in nuclear medicine in the
use of radionuclides for the diagnosis and treatment of cancer. The implementation of Howell’s
published results could lead to the underestimation of doses in diagnosis and to over- or under-
treatment in radionuclide cancer therapy. It is disturbing that his results are potentially
misleading in this way.
Limitations
Our studies are limited to the analysis of data that may not always have been in forms that we
would have chosen. For example, the control experiments by other investigators that were
available to us were fewer in number than the experiments performed by Bishayee. Because
smaller sample sizes have less power, we randomly selected 314 terminal digits from Bishayee’s
Coulter results and ran chi-squared analyses 100,000 times to test for uniformity. All of the runs
would have rejected the null hypothesis for uniformity at the 0.00001 level; one run rejected the
hypothesis at the 0.000000001 level. The value of 314 was selected because it is the total
number of digits supplied by one of the two outside contributors and is the smallest Coulter
sample set (cf Table 5).
During the time that Bishayee was working in the laboratory, few experiments were being
performed simultaneously by others, which resulted in some temporal disparity. However, the
protocols that we analyzed were followed almost identically by all of the members of the
laboratory. There is no a priori evidence that the cells, instrumentation, equipment and
consumable supplies used by the other researchers were any different from those utilized by
Bishayee. There is also no evidence that different operators could influence the terminal digits
seen on the display of the Coulter counter. All of the investigators used similar techniques to
stain and count the colonies. Nevertheless, automatic colony counters are commercially
available, and their use should be encouraged. Similarly, a simple oxygen electrode could have
expeditiously determined whether the Helena tubes were hypoxic, and the counts from the
Coulter ZM could have been recorded on a printer.
Conclusion
Bishayee’s results challenge radiobiological expectations, and statistical analyses indicate that
his numerical results diverge significantly from expectations of uniformity or randomness and
are extremely unlikely to have resulted from chance alone. Because the experiments that he
performed form the background of as many as 8 publications, we suggest that it would be
appropriate for Howell, the Principal Investigator, and Bishayee to retract these papers.

Experiments from Discovery in a qui tam Case
Page 14 of 34
References and Notes
(2010). "JCO Retracts Key Duke Genomics Paper; Duke Shuts Down Three Phase II Trials; Anil
Potti Resigns
" The Cancer Letter 36(42).
(2011). "Misconduct in Science. An array of errors." The Economist(September 9).
(2011). "PLoS One prints Potti retraction..." The Cancer Letter 37(34): 7-8.
Baggerly, K. A. and K. R. Coombes (2009). "Deriving chemosensitivity from cell lines: Forensic
bioinformatics and reproducible research in high-throughput biology, ." The Annals of
Applied Statistics 3(4): 1309-1334.
Baggerly, K. A. and K. R. Coombes (2010). "Retraction based on data given to Duke last
November, but apparently disregarded." The Cancer Letter 36(39): 1,4-6.
Baggerly, K. A. and K. R. Coombes (2011). "What Information Should Be Required to Support
Clinical "Omics" Publications?" Clin Chem 57: 688-690.
Banaz-Yasar, F., K. Lennartz, et al. (2008). "Radiation-induced bystander effects in malignant
trophoblast cells are independent from gap junctional communication." J Cell Biochem
103(1): 149-161.
Bedford, J. S., J. B. Mitchell, et al. (1975). "Cell killing by gamma rays and beta particles from
tritiated water and incorporated tritiated thymidine." Radiat Res 63(3): 531-543.
Bishayee, A., H. Z. Hill, et al. (2001). "Free radical-initiated and gap junction-mediated
bystander effect due to nonuniform distribution of incorporated radioactivity in a three-
dimensional tissue culture model." Radiat Res 155(2): 335-344.
Bishayee, A., D. V. Rao, et al. (2000). "Protection by DMSO against cell death caused by
intracellularly localized iodine-125, iodine-131 and polonium-210." Radiat Res 153(4):
416-427.
Bishayee, A., D. V. Rao, et al. (1999). "Evidence for pronounced bystander effects caused by
nonuniform distributions of radioactivity using a novel three-dimensional tissue culture
model." Radiat Res 152(1): 88-97.
Bishayee, A., D. V. Rao, et al. (2000). "Radiation protection by cysteamine against the lethal
effects of intracellularly localized Auger electron, alpha- and beta-particle emitting
radionuclides." Acta Oncol 39(6): 713-720.
Bishayee, A., D. V. Rao, et al. (2000). "Marrow-sparing effects of
117mSn(4+)diethylenetriaminepentaacetic acid for radionuclide therapy of bone cancer."
J Nucl Med 41(12): 2043-2050.
Bjursell, G. and P. Reichard (1973). "Effects of thymidine on deoxyribonucleoside triphosphate
pools and deoxyribonucleic acid synthesis in Chinese hamster ovary cells." J Biol Chem
248(11): 3904-3909.
Burki, H. J., C. Koch, et al. (1978). "Molecular suicide studies of 125I and 3H disintegration in
the DNA of Chinese hamster cells." Curr Top Radiat Res Q 12(1-4): 408-425.
Burki, H. J. and S. Okada (1970). "Killing of cultured mammalian cells by radioactive decay of
tritiated thymidine at -196 degrees C." Radiat Res 41(2): 409-424.
Burki, H. J., R. Roots, et al. (1973). "Inactivation of mammalian cells after disintegration of 3H
or 125I in cell DNA at -196 degrees C." Int J Radiat Biol Relat Stud Phys Chem Med
24(4): 363-375.
Butler, D. (2005). "Electronic notebooks: a new leaf." Nature 436(7047): 20-21.

Experiments from Discovery in a qui tam Case
Page 15 of 34
Chan, P. C., E. Lisco, et al. (1976). "The radiotoxicity of iodine-125 in mammalian cells II. A
comparative study on cell survival and cytogenetic responses to 125IUdR, 131TUdR, and
3HTdR." Radiat Res 67(2): 332-343.
Cleaver, J. E. and R. M. Holford (1965). "Investigations into the incorporation of [3H] thymidine
into DNA in L-strain cells and the formation of a pool of phosphorylated derivaives
during pulse labelling." Biochim Biophys Acta 103(4): 654-671.
Drew, R. M. and R. B. Painter (1959). "Action of tritiated thymidine on the clonal growth of
mammalian cells." Radiat Res 11: 535-544.
Drew, R. M. and R. B. Painter (1962). "Further studies on the clonal growth of HeLa S3 cells
treated with tritiated thymidine." Radiat Res 16: 303-311.
Ehmann, U. K., J. R. Williams, et al. (1975). "Perturbations in cell cycle progression from
radioactive DNA precursors." Nature 258(5536): 633-636.
Elkind, M. M. and H. Sutton (1960). "Radiation response of mammalian cells grown in culture.
1. Repair of X-ray damage in surviving Chinese hamster cells." Radiat Res 13: 556-593.
Fisz, M. (1961). Probability and Mathematical Statistics. Delhi, S. Chand.
Fox, R. M., E. H. Tripp, et al. (1980). "Mechanism of deoxycytidine rescue of thymidine toxicity
in human T-leukemic lymphocytes." Cancer Res 40(5): 1718-1721.
Gil, Y., E. Deelman, et al. (2007). "Examining the challenges of scientific workflows." IEEE
Computer 40(12): 24-32.
Ginsparg, P. (2011). "ArXiv at 20." Nature 476: 145-147.
Goddu, S. M., A. Bishayee, et al. (2000). "Marrow toxicity of 33P-versus 32P-orthophosphate:
implications for therapy of bone pain and bone metastases." J Nucl Med 41(5): 941-951.
Goldberg, P. (2010). "Nevins retracts key paper by Duke group, raising question of harm to
patients." The Cancer Letter 36(39): 1-4.
Hall, E. J. and A. J. Giaccia (2005). Radiobiology for the Radiologist Lippincott Williams &
Wilkins.
Hiramoto, K., K. Narahara, et al. (1990). "Synchronization culture of amniotic fluid cells using
excess thymidine block followed by deoxycytidine release and its application to high-
resolution banding analysis of chromosomes." Jinrui Idengaku Zasshi 35(2): 195-206.
Howell, R. W. (2000-2006). 1R01CA083838-01A1 Effects of Nonuniform Distributions of
Radioactivity.
Howell, R. W. (2006-2011). "1R01CA083838-06A1 Effects of Nonuniform Distributions of
Radioactivity ".
Howell, R. W. and A. Bishayee (2002). "Bystander effects caused by nonuniform distributions of
DNA-incorporated (125)I." Micron 33(2): 127-132.
Howell, R. W., S. M. Goddu, et al. (1998). "Radioprotection against lethal damage caused by
chronic irradiation with radionuclides in vitro." Radiat Res 150(4): 391-399.
Hoy, C. A., E. D. Lewis, et al. (1990). "Perturbation of DNA replication and cell cycle
progression by commonly used [3H]thymidine labeling protocols." Mol Cell Biol 10(4):
1584-1592.
Hsie, A. W., V. K. E. McElheny, et al. (1979). Mammalian Cell Mutagenesis: The Maturation of
Test Systems, CSH Laboratory Press.
http://en.wikipedia.org/wiki/Standard_score.
http://ori.hhs.gov/misconduct/Tips_StatisticalForensics2.shtml.
Hu, V. W., G. E. Black, et al. (2002). "3H-thymidine is a defective tool with which to measure
rates of DNA synthesis." Faseb J 16(11): 1456-1457.
Experiments from Discovery in a qui tam Case
Page 16 of 34
Keprtova, J. and E. Minarova (1985). "The effect of 3H-thymidine on the proliferation of in vitro
cultured mammalian cells." Gen Physiol Biophys 4(1): 81-92.
Marin, G. and M. A. Bender (1963). "Survival Kinetics of Hela S-3 Cells after Incorporation of
3h-Thymidine or 3h-Uridine." Int J Radiat Biol Relat Stud Phys Chem Med 7: 221-233.
Morris, N. R. and G. A. Fischer (1960). "Studies concerning inhibition of the synthesis of
deoxycytidine by phosphorylated derivatives of thymidine." Biochim Biophys Acta 42:
183-184.
Mosimann, J. E., J. E. Dahlberg, et al. (2002). "Terminal digits and the examination of
questioned data." Accountability in Research 9: 75-92.
Mosimann, J. E., D. V. Wiseman, et al. (1995). "Data fabrication: Can people generate random
digits?" Accountability in Research 4: 31-55.
Mothersill, C. E., M. J. Moriarty, et al. (2004). "Radiotherapy and the potential exploitation of
bystander effects." Int J Radiat Oncol Biol Phys 58(2): 575-579.
Nagasawa, H. and J. B. Little (1992). "Induction of sister chromatid exchanges by extremely low
doses of alpha-particles." Cancer Res 52(22): 6394-6396.
Panter, H. C. (1981). "Cell inactivation by tritium decays at 37 and -196 degrees C: some
comparisons with X rays." Radiat Res 87(1): 79-89.
Persaud, R., H. Zhou, et al. (2005). "Assessment of low linear energy transfer radiation-induced
bystander mutagenesis in a three-dimensional culture model." Cancer Res 65(21): 9876-
9882.
Pollack, A., C. B. Bagwell, et al. (1979). "Radiation from tritiated thymidine perturbs the cell
cycle progression of stimulated lymphocytes." Science 203(4384): 1025-1027.
Postma, E. (2011). "Comment on "Additive genetic breeding values correlate with the load of
partially deleterious mutations"." Science 333(6047): 1221.
Rajon, D., W. E. Bolch, et al. (2011). "Lognormal Distribution of Cellular Uptake of
Radioactivity: Monte Carlo Simulation of Irradiation and Cell Killing in 3-Dimensional
Populations in Carbon Scaffolds." Journal of Nuclear Medicine 52(6): 926-933.
Sinclair, W. K. (1964). "X-Ray-Induced Heritable Damage (Small-Colony Formation) in
Cultured Mammalian Cells." Radiat Res 21: 584-611.
Tenopir, C., S. Allard, et al. (2011). "Data sharing by scientists: practices and perceptions." PLoS
One 6(6): e21101.
Tobey, R. A., E. C. Anderson, et al. (1967). "The effect of thymidine on the duration of G1 in
Chinese hamster cells." J Cell Biol 35(1): 53-59.
Tomkins, J. L., M. A. Penrose, et al. (2010). "Additive genetic breeding values correlate with the
load of partially deleterious mutations." Science 328(5980): 892-894.
Tomkins, J. L., M. A. Penrose, et al. (2011). "Retraction." Science 333(6047): 1220.
Vines, A. M., F. M. Lyng, et al. (2009). "Bystander effect induced changes in apoptosis related
proteins and terminal differentiation in in vitro murine bladder cultures." Int J Radiat Biol
85(1): 48-56.
Vogel, G. (2011). "Scientific misconduct. Psychologist accused of fraud on 'astonishing scale'."
Science 334(6056): 579.
Wheater, R. F. and S. H. Roberts (1987). "An improved lymphocyte culture technique:
deoxycytidine release of a thymidine block and use of a constant humidity chamber for
slide making." J Med Genet 24(2): 113-114.

Experiments from Discovery in a qui tam Case
Page 17 of 34
Appendix I
Brief summary of protocols for the experiments in the laboratory (cf. also the PDF files in
the supporting material):
Cells are plated into 150-cm2 flasks and incubated for 1 to 2 days. The cells are trypsinized,
harvested and transferred to Falcon tubes (17x100 mm) containing 2 to 4 million cells in 1 ml of
medium (MEM with 10% FBS), which are placed on rollers in a 37°C incubator. Radioisotopes
are added as appropriate after 3 hours. The tubes are rolled overnight, following which the cells
are harvested and washed several times to remove any unincorporated isotope.
In the 100% experiments, each Falcon tube contains 4 million cells.
In the 50% experiments, each Falcon tube contains 2 million cells. Half of the tubes are
incubated with the radioisotope.
In the external beam 137
Cs experiments, each Falcon tube contains 4 million cells and no
radioisotope.
After the overnight rolling, washing and pairing of labeled and unlabeled cells for the 50%
experiments as appropriate, 4 million cells from each tube are transferred to 400-µl Helena tubes
with attached caps, with or without additives such as DMSO and/or lindane, in a total volume of
400 µl. The tubes are closed.
The Helena tubes are lightly centrifuged (1,000 rpm, 5 min, 4°C) to allow the cells to form
“clusters” and are transferred to a 10°C incubator for a 72-hour incubation.
In the external beam 137
Cs experiments, after the 72-hour incubation, the cells in half of the
Helena tubes are resuspended for aeration, and the other half remain as clusters. The tubes are
irradiated as appropriate.
The cells are then harvested from the Helena tubes, washed several times, diluted and plated in
triplicate for colonies. Three aliquots of the original suspension are counted in the Coulter
counter to assess the cell number and in the scintillation counter to assess the radioactivity.
The dishes for the colonies are incubated at 37°C for approximately one week; the colonies are
then fixed, stained and counted.
Supporting material:
1. The three expert reports
2. Lenarczyk’s experiments
3. The PDF files obtained through Discovery, purged of extraneous and irrelevant files
4. A locator for the raw data in the PDF files (Colony and Coulter lists by Bates and Date)
5. Tritiated thymidine survivals with and without deoxycytidine
6. The R routines stated in the methods

Experiments from Discovery in a qui tam Case
Page 18 of 34
DEPARTMENT OF RADIOLOGY (HZH)
NEW JERSEY MEDICAL SCHOOL
MSB F609
185 SOUTH ORANGE AVENUE
NEWARK, NJ 07101-1709
DEPARTMENT OF MATHEMATICS AND COMPUTER SCIENCE
GEORGIAN COURT UNIVERSITY (JP)
900 ALKEWOOD AVENUE
LAKEWOOD, NJ 08701
E-MAIL:[email protected]

Experiments from Discovery in a qui tam Case
Page 19 of 34
Table 1: Examples of Triplicate Coulter Counts
Sample # AB Triplicate Counts OI Triplicate Counts
1 577 592 563 89 97 86
2 611 607 653 331 316 329
3 581 593 617 378 330 375
4 633 645 619 333 404 367
5 511 537 549 396 382 408
6 544 562 573 342 331 344
7 666 672 693 340 349 344
8 601 572 633 325 347 304
9 511 529 541 315 291 283
10 532 555 562 307 339 323
11 513 549 562 285 314 323
12 562 539 547 260 262 284
13 560 542 522 361 315 298
14 680 669 671 355 324 356 These were reported in an experiment by Bishayee (AB) performed on 10/9/2000 (Bates #
B001357, cf. supporting material) and from an experiment by another laboratory investigator
(OI) performed on 8/11/2000 (Bates # B007230). The terminal digits are shown in bold. The
terminal duplicates are shown in red. There are 10 doubles in Bishayee’s samples (23.8%) and 4
in the other investigator’s samples (9.5%).
Table 2: The Terminal Digit Counts from Table 1 and The Chi-Squared Probability of
Uniform Distribution.
Digit 0 1 2 3 4 5 6 7 8 9 Total Chi
Sq
Chi sq p for
uniform
AB
Freq
2 7 9 8 1 2 2 5 0 6 42 21.8 9.5 x 10⁻³
OI
Freq
3 4 3 4 7 6 4 4 3 4 42 3.7 9.3 x 10⁻¹
Ctrl
Freq
4.2 4.2 4.2 4.2 4.2 4.2 4.2 4.2 4.2 4.2 42
The chi-squared goodness of fit was determined in Microsoft Excel (9 degrees of freedom) for
the digit frequencies of AB and OI compared with the control uniform distribution.

Experiments from Discovery in a qui tam Case
Page 20 of 34
Table 3: Examples of Triplicate Colony Counts and Mid-Ratios
Sample
#
AB Triplicate
Counts
Average Mid-ratio
(b-a)/(c-a)
OI Triplicate
Counts
Average Mid-ratio
(b-a)/(c-a)
1 130 149 142 140.33 0.63 92 111 119 107.33 0.70
2 131 137 143 137.00 0.50 78 85 74 79.00 0.36
3 123 131 138 130.66 0.53 142 126 120 129.33 0.27
4 128 134 140 134.00 0.50 120 129 121 123.33 0.11
5 125 130 136 130.33 0.45 64 68 79 70.33 0.27
6 115 126 137 126.00 0.50 92 101 78 90.33 0.61
7 17 20 24 20.33 0.43 74 62 94 76.67 0.38
8 29 35 41 35.00 0.50 89 69 67 75.00 0.091
9 62 70 54 62.00 0.50 85 87 97 89.67 0.17
10 70 79 62 70.33 0.47 71 58 55 61.33 0.19
These are from an experiment by Bishayee (AB) performed on 2/22/1999 (Bates # B008127, cf.
supporting material) and from an experiment by another laboratory investigator (OI) performed
on 4/19/2001 (Bates # B007385). Triple values that are equal to the rounded average of the
triple are shown in bold.
Experiments from Discovery in a qui tam Case
Page 21 of 34
Table 4: Demonstration of Results of Various Calculations on the Data in Table 3 Sample
# Gap Weighted
Triple Counts
Weighted Triple Counts with Rounded Means
Max Prob Expected Rounded Means of Triples
Max Prob Variances
Standard Deviation
Actual Number of Triples with Rounded Means
Z-Score for Actual Number
Probability of Z-Score
AB 1 19 38 0.130 0.113
2 12 12 12 0.100 0.090
3 15 30 30 0.163 0.136
4 12 12 12 0.100 0.090
5 11 22 22 0.217 0.170
6 22 22 22 0.057 0.053 7 7 14 14 0.325 0.219
8 12 12 12 0.100 0.090
9 16 16 16 0.076 0.071
10 17 34 34 0.144 0.124
Sum 212 174 1.412 1.156 1.075 9 7.06 <9.9x10⁻¹⁰
% 82.08
OI 1 27 54 0 0.047 0.045 2 11 22 0 0.113 0.100
3 22 22 0 0.057 0.053
4 18 18 0 0.137 0.118
5 30 30 0 0.084 0.077
6 46 46 0 0.055 0.052
7 20 20 0 0.062 0.058
8 22 22 0 0.057 0.053
9 12 12 0 0.100 0.090 10 16 16 0 0.077 0.071
Sum 262 0 0.788 0.718 0.847 0 -.930 0.176
% 0
The gap values from Table 3 are shown along with the weighted triple counts (1*even gap; 2*odd
gap); weighted triple counts with rounded means; max prob expected rounded means of triples
(1.3/(even gap + 1); 2.6/(odd gap +1)); variances of same (max prob *(1-max prob expected));
standard deviation; actual number of triples with rounded means; z-score for same ((actual –
expected)/standard deviation) and probability of z-score

Experiments from Discovery in a qui tam Case
Page 22 of 34
Table 5: Terminal Digit Analysis of Coulter and Colony Counts
Digit
Type Investigator 0 1 2 3 4 5 6 7 8 9 Total Chi-sq P-value
Coulter Bishayee 171
experiments
472 612 730 416 335 725 362 422 370 711 5155 456.4 < 2.2x10⁻¹⁶
Coulter Others 99
experiments
249 294 276 244 296 270 284 258 306 282 2759 13.9 0.13
Coulter Outside lab 11
experiments
28 34 29 24 27 36 44 33 26 33 314 9.9 0.36
Coulter Outside lab 17
experiments
34 38 45 35 32 42 31 35 35 33 360 4.9 0.84
Colonies Bishayee 114
experiments
514 267 395 265 262 418 306 261 342 471 3501 228.4 < 2.2x10⁻¹⁶
Colonies Others 59
experiments
173 154 166 140 163 137 147 156 163 157 1556 7.6 0.57
The terminal digits 0 through 9 were quantified as noted. A chi-squared test for goodness of fit
was calculated by comparing each distribution with a uniform distribution with the same total
digit count. See Tables 1 and 2 for examples. “Others” refers to other investigators in the
laboratory. Outside labs contributed two sets of Coulter data.

Experiments from Discovery in a qui tam Case
Page 23 of 34
Table 6: Count and Relative Frequency of Triples and Triples Containing the Rounded
Mean
Set of Triples Number of
Experiments
Number of
Complete
Triples With
Gap (High-
Low) > 2
Number of Such
Triples Where
the Rounded
Mean of the
Triple is One of
Its 3 Counts
Percentage of
Triples
Containing
Their Rounded
Mean
Bishayee-Control 128 349 61 17.5%
Bishayee-Test 128 985 625 63.5%
Bishayee-All 128 1334 686 51.4%
Others-Control 50 140 19 13.6%
Others-Test 51 337 57 16.9%
Others-All 51 478 76 15.9%
Counts and frequencies in the Bishayee Control, the Bishayee Test, the other investigators in the
laboratory Control and the other investigators in the laboratory Test Sets. Triples were only
counted if the difference between the high value and the low value was at least 2. See Figure 1
for examples of triples containing their rounded means.
Experiments from Discovery in a qui tam Case
Page 24 of 34
Table 7: Weighted Counts of Triples and Triples Containing the Rounded Mean.
Set of Triples Number of
Experiments
Sum of the
Weighted
Counts of
Triples
Sum of the
Weighted Count
of Triples that
Contain their
Rounded Mean
Weighted Count
of Triples
Containing their
Rounded Mean
as a Percentage
of the Weighted
Count of Triples
Bishayee-Control 128 5886 828 14.1%
Bishayee-Test 128 12878 7767 60.3%
Other-Control 50 2403 222 9.2%
Other-Test 51 4879 526 10.8%
Triples are weighted by the difference between the high and low count of the triple if the
difference is even and twice the difference if the difference is odd. See Table 4 for examples.

Experiments from Discovery in a qui tam Case
Page 25 of 34
Table 8: Max Prob Case Analysis of Colony Triples
Set of
Triples Number of
Experiments
Max Prob
Case:
Expected
Number of
Triples
Containing
Rounded
Mean
Max Prob
Case: Std
Deviation of
Number of
Triples
Containing
Rounded
Mean
Actual
Number of
Triples
Containing
Rounded
Mean
z-Score
for
Actual
Number
Probability
of z-Score
or Higher
Bishayee-
Control
128 49.0 6.2 61 1.92 0.027
Bishayee-
Test
128 183.8 11.5 625 38.39 <<<9.9x10⁻¹⁰
Other-
Control
50 21.7 4.0 19 -0.67 0.748
Other-
Test
51 66.0 6.8 57 -1.32 0.907
Shown are the max prob expectation and standard deviation of the number of colony triples
containing the rounded mean, actual value, corresponding z-score and probability values >
Actual for various colony data sets.
Experiments from Discovery in a qui tam Case
Page 26 of 34
Table 9: Max Prob Case Analysis of Colony Triples for Various Isotopes
Set of
Bishayee
Triples
Grouped By
Isotope
Max Prob
Case:
Expected
Number of
Triples
Containing
Rounded
Mean
Max Prob
Case: Std
Deviation of
Expected
Number of
Triples
Containing
Rounded
Mean
Actual
Number of
Triples
Containing
Rounded
Mean
z-Score for
Actual
Number
Probability of
z-Score or
Higher
125I 66.1 6.9 172 15.35 <9.9x10
-10
131I 39.0 5.1 59 3.92 0.00004
137Cs 6.2 2.1 14 3.71 0.00010
210Po 25.6 4.3 68 9.86 <9.9x10
-10
117mSn 8.0 2.5 29 8.47 <9.9x10
-10
3H2O 15.6 3.4 49 9.82 <9.9x10
-10
3HdThd 73.7 7.6 296 29.25 <<9.9x10
-10
Shown are max prob expectation and standard deviation of the number of triples containing the
rounded mean, actual value, corresponding z-score and probability of values > actual for
Bishayee colony triples by isotope.
Experiments from Discovery in a qui tam Case
Page 27 of 34
Table 10: Max Prob Analysis of Coulter Triples
Set of Triples Max Prob
Case:
Expected
Number of
Triples
Containing
Rounded
Mean
Max Prob
Case: Std
Deviation of
Number of
Triples
Containing
Rounded
Mean
Actual
Number of
Triples
Containing
Rounded
Mean
z-Score for
Actual
Number
Probability of
z-Score or
Higher
Bishayee-
Control
30.9 5.2 45 2.69 0.004
Bishayee-Test 106.2 9.6 127 2.17 0.015
Others in Lab 37.8 5.7 36 -0.67 0.75
Outside Lab 1.5 1.1 0 -1.27 0.90
Shown are the max prob case expectation and standard deviation of number of triples containing
the rounded mean, actual value, corresponding z-score and probability of values ≥ actual for
various Coulter count data sets.

Experiments from Discovery in a qui tam Case
Page 28 of 34
Figure Legends:
Fig. 1: Colony counts from a 50% (bystander) experiment performed by Bishayee. (Bates #
B008127, 2/22/1999). The rounded average appears as one of the triplicate counts in 9 of the 10
samples; it is highlighted in blue in all conditions except for the double negative control (sample
1.2: no radioactivity, no lindane). Samples 2.2-5.2 were exposed to increasing concentrations of
lindane during the 72-hour incubation in the cold, as were samples 7.2-10.2. Samples 6.3-10.2
were exposed to radioactivity (4 Ci/ml tritiated thymidine overnight) and increasing
concentrations of lindane (the last column on the right outside the Table) during the cold
incubation. The results in Column SF are the surviving fractions.
Fig. 2: Terminal digit analysis. The solid black bars represent the terminal digits (0-9)
quantified for the Coulter and colony count data values, excluding the triples containing one or
more values of less than 10. A. Data from researchers other than Bishayee using the Coulter ZM
in the laboratory, consisting of 99 experiments and 2,759 data values. B. Bishayee’s Coulter ZM
counts, consisting of 171 experiments and 5,155 data values. C. The colony counts of other
researchers, consisting of 59 experiments and 1,556 data values. D. Bishayee’s colony counts,
consisting of 114 experiments and 3,501 data values. Note the similarity of the patterns in B and
D. The narrow grey bars represent the terminal doublet distributions in Coulter count data Fig.
3: Coulter chi-squared p-values over time. Filled circles: Bishayee; open circles: other
laboratory investigators. Only Bishayee’s experimental results fall below the 0.01 line. The
lowest p-value is 1.41 x 10⁻⁸
for 30 data values from a 50% experiment on 3/12/99 (B008219).
Fig. 4: Distributions of the ratios (middle – low)/(high – low) for colony triples A. The
ratio distribution of 486 triples from 58 experiments of researchers other than Bishayee B – I.
Bishayee’s data. B. 478 triples, 46 3H experiments; C. 190 triples, 13 100%
3H experiments, 8
used to calculate A1 (Bishayee, Rao et al. 1999; Bishayee, Hill et al. 2001); D. 36 triples, 4
external beam 137
Cs experiments; E. 87 triples, 9 3H2O experiments; F. 188 triples, 19
131I
experiments; G. 366 triples, 33 125
I experiments; H. 50 triples, 5 117m
Sn experiments; I. 140
triples, 14 210
Po experiments. Some of the 131
I experiments were performed earliest and these
distributions are the least anomalous.
Fig. 5: Tritiated thymidine survival curves with and without deoxycytidine. Three
experiments in each group were pooled. The regressions were calculated using the surviving
fraction (S/S0) = y = a*e-bx
+ (1-a)*e-cx
with weight = 1/y2. No deoxycytidine: circles; with
deoxycytidine: squares. The ultimate survival plateau is decreased by approximately 15-fold in
the presence of deoxycytidine, which indicates a partial reversal of the tritiated thymidine block.
(Cf supporting material folder “tritiated thymidine survivals wwout deoxycytidine”.)
Fig. 6: Tritiated thymidine survival curves. A. The 100% experiments. Symbols:
experiments of Lenarczyk and Howell. Dashed line: regression based on survival data (symbol =
letter X) estimated from the 100% survival in Figure 1 of reference 2. Dotted red line: survival
calculated for A1 = 0.8 mBq per labeled cell. The Lenarczyk and Howell survival curves are
biphasic, whereas Bishayee’s curve is exponential (note that Bishayee’s regression line coincides
exactly with the calculated survival for A1 = 0.8 mBq); the curves differ at 5 mBq by more than
two orders of magnitude. B. The 50% experiments. Symbols: experiments of Lenarczyk and
Howell. Solid line: survival fraction of 0.70. Dashed line: survival estimated from the 50%
survival of Figure 3 of reference 2. Bishayee’s survival curve is exponential; the survival curves
differ at 20 mBq by approximately 70-fold.

Experiments from Discovery in a qui tam Case
Page 29 of 34
Figure 1

Experiments from Discovery in a qui tam Case
Page 30 of 34
Figure 2
Experiments from Discovery in a qui tam Case
Page 31 of 34
Figure 3

Experiments from Discovery in a qui tam Case
Page 32 of 34
Figure 4
Experiments from Discovery in a qui tam Case
Page 33 of 34
Figure 5
Experiments from Discovery in a qui tam Case
Page 34 of 34
Figure 6