Embed Size (px)
DESCRIPTION
Recombination in low-bandgap InGaAs Tim Gfroerer Davidson College, Davidson, NC with Mark Wanlass National Renewable Energy Lab, CO ~ Supported by Bechtel Bettis, Inc. and the American Chemical Society – Petroleum Research Fund ~. Experiments by. Colleen Gillespie (Davidson ’06). Pete Campbell - PowerPoint PPT Presentation
Citation preview
Recombination in low-bandgap InGaAs
Tim Gfroerer
Davidson College, Davidson, NC
with Mark WanlassNational Renewable Energy Lab, CO
~ Supported by Bechtel Bettis, Inc. and the American Chemical Society – Petroleum Research Fund ~

Experiments by . . .
Colleen Gillespie (Davidson ’06)
Patten Priestley (Davidson ’03)and Malu Fairley (Spelman ’03)
Pete Campbell(Davidson ’03)

5.6 5.7 5.8 5.9 6.0 6.10.2
0.4
0.6
0.8
1.0
1.2
1.4
1.6
I nAs
GaAs
SevereMismatch
InPSubstrate
Band
gap
(eV)
Lattice parameter (Angstroms)
Motivation: TPV converters
Increasing the Indium concentration in the InGaAs lowers the bandgap and increases the fraction of blackbody radiation that is absorbed in the cell.
0.0 0.5 1.0
1.5 2.0 2.5
0.0
0.2
0.4
0.6
0.8
1.0
Norm
aliz
ed
Inte
nsi
tyEnergy (eV)
T=1300 C

Variable-Bandgap Lattice-Mismatched Stuctures
Undoped InAsyP1-y, 30 nm
Undoped InxGa1-xAs, 1.5 μm
Undoped InAsyP1-y buffer, 1 μm
Undoped InAsyP1-y step-grade region:0.3 μm/step (~ -0.2% LMM/step), n
steps
Undoped InP substrate

Efficiency Measurements
: Laser Light
: Luminescence
CW YAG laser1 Watt @ 1064 nm
ND Filters
Variable Temp Cryostat
Sample
Photodiode
Lowpass Filter
heat
light inlight in light out
light in = heat + light out
radiative efficiency = light out / light in
0.0 0.1 0.2 0.3 0.4 0.5 0.6100
104
108
1012
1016
Den
sity
of S
tate
s (c
m-3eV
-1)
Energy (eV)
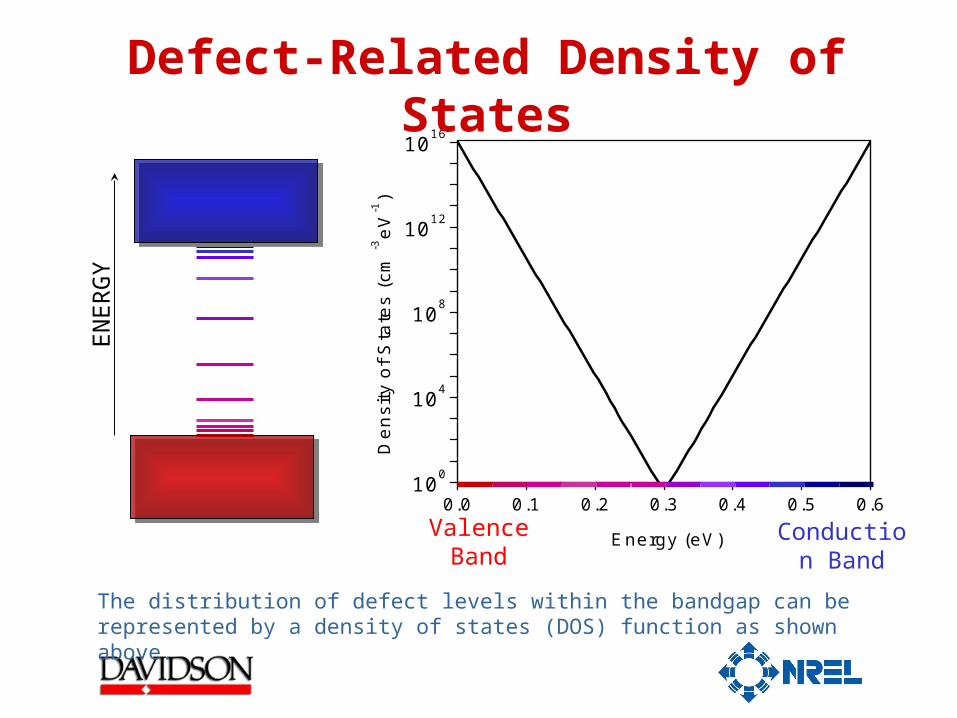
Defect-Related Density of States
Valence Band
Conduction Band
EN
ER
GY
The distribution of defect levels within the bandgap can be represented by a density of states (DOS) function as shown above.
0
20
40
60
80
100
EV
EC
Energy
Lo
g(D
OS
)
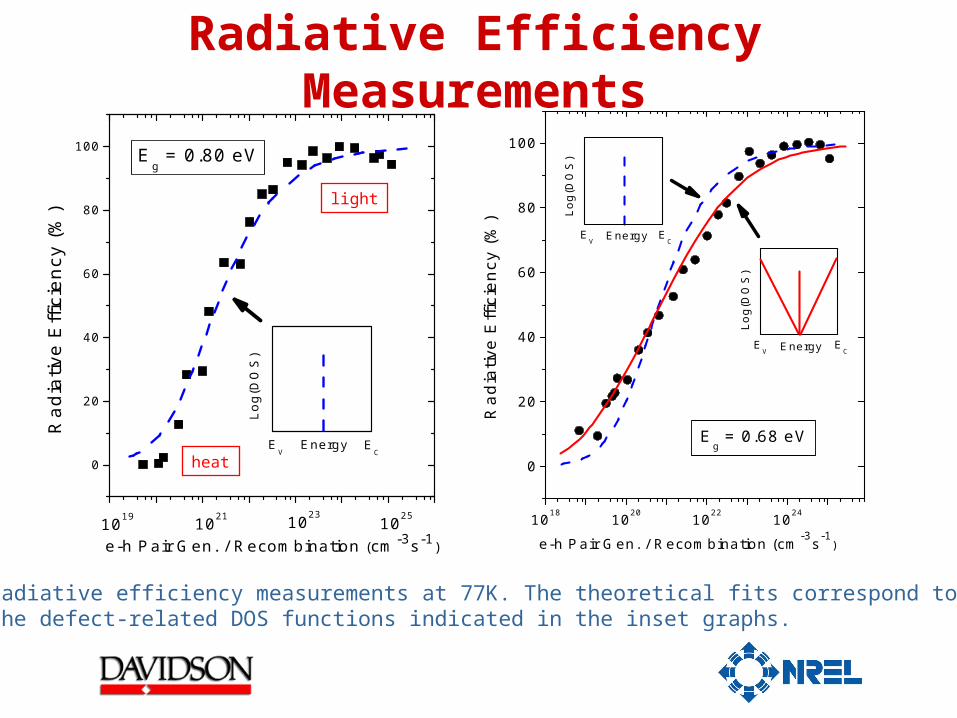
Eg = 0.80 eV
10231019 1021 1025
R
adia
tive
Effi
cien
cy (
%)
e-h Pair Gen. / Recombination (cm-3s-1)
Radiative Efficiency Measurements
heat
light
1018 1020 1022 1024
0
20
40
60
80
100
EC
EV
EC
EV
Eg = 0.68 eV
Energy
Log(
DO
S)
Energy
Log(
DO
S)
Rad
iativ
e E
ffici
ency
(%
)
e-h Pair Gen. / Recombination (cm-3s-1)
Radiative efficiency measurements at 77K. The theoretical fits correspond to the defect-related DOS functions indicated in the inset graphs.
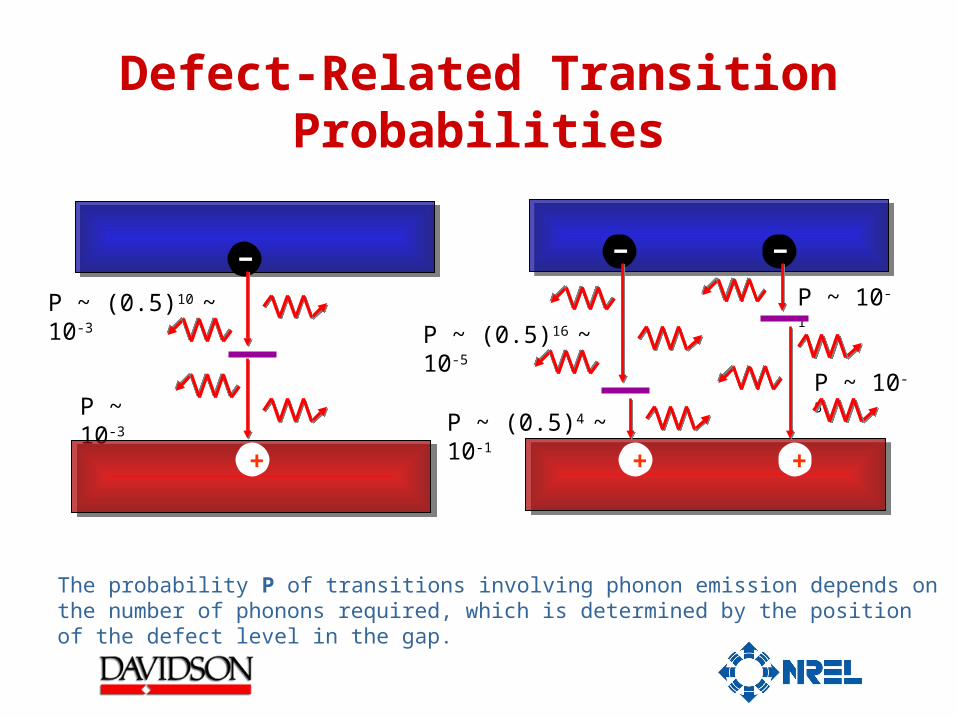
Defect-Related Transition Probabilities
P ~ 10-
3
P ~ (0.5)10 ~ 10-3
P ~ 10-5
P ~ 10-1
P ~ (0.5)16 ~ 10-5
P ~ (0.5)4 ~ 10-1
The probability P of transitions involving phonon emission depends on the number of phonons required, which is determined by the position of the defect level in the gap.
-
+ + +
- -

Temperature Dependence
0.0
0.2
0.4
0.6
0.8
1.0
Eg ~ 0.77 eV
102310211019 1025
Rad
iativ
e E
ffici
ency
e-h Pair Gen. / Recombination (cm-3s-1)
77K 131K 185K 239K 296K
1018 1020 1022 1024 1026
0.0
0.2
0.4
0.6
0.8
1.0
Eg ~ 0.56 eV
Rad
iativ
e E
ffici
ency
e-h Pair Gen. / Recombination (cm-3s-1)
77K 131K 185K 239K 296K
Temperature dependence of radiative efficiency vs. excitation, showing how the SRH and Auger mechanisms depend on Indium concentration.

0.5 0.6 0.7 0.80.4
0.6
0.8
1
2
4
6
8
C (
10-2
8 cm
6 /s )
Bandgap Energy (eV)
185 K 239 K 296 K
Auger Recombination
40 60 80 1000.4
0.6
0.8
1
2
4
6
8
C
( 1
0-28 c
m6 /s
)
1 / kT (eV-1)
Eg ~ 0.77 eV
Eg ~ 0.71 eV
Eg ~ 0.65 eV
Eg ~ 0.56 eV
Temperature and bandgap dependence of the Auger coefficient C. The CHSH(band-to-band) mechanism dominates Auger recombination in low-bandgap InGaAs.

Sub-Bandgap Photoluminescence
0.4 0.5 0.6 0.7 0.8 0.9
10-4
10-3
10-2
10-1
100
T = 77K
x = 0.53 x = 0.60
N
orm
aliz
ed P
L In
tens
ity
Energy (eV)
0.3 0.4 0.5 0.6 0.7 0.8
10-4
10-3
10-2
10-1
100
T = 77K x = 0.72 x = 0.78
Nor
mal
ized
PL
Inte
nsity
Energy (eV)
FTIR spectra showing a deep transition in the lattice-matched material that abates and then disappears with increasing [In].

Four Conclusions• Deep defect levels → shallow near-bandedge states
with increasing [In].• The CHSH Auger mechanism is dominant in this alloy.• Sub-gap PL from deep (Ea > 0.2 eV) levels ↓ and then
disappears with increasing [In].• Structure-less sub-gap cathodoluminescence supports
assignment of this band to point defects.
Three References• T.H. Gfroerer, L.P. Priestley ('03), F.E. Weindruch
('01), and M.W. Wanlass, APL 80, 4570 (2002).• T.H. Gfroerer, L.P. Priestley ('03), Malu Fairley
(‘03), and M.W. Wanlass, JAP 94, 1738 (2003).• T.H. Gfroerer, C.E. Gillespie (‘05), J.P. Campbell
(‘03), and M.W. Wanlass, JAP 98, 093708 (2005).